traffic analysis centre (tac) published a report in 2010 · network performance traffic analysis...
TRANSCRIPT
Network Performance Traffic Analysis Centre
TAC Traffic Note 1 March 2012
Traffic levels on major roads in Greater London
1993 - 2010
Précis: An analysis of traffic levels in Greater London, 1993 to 2010, using DfT traffic flow data. This data is for major roads only and summarises trends for all vehicle classification types.
Transport for London Surface Transport Traffic Analysis Centre
TAC Traffic Note 1 – Traffic levels on major roads in Greater London 1993-2010
1
0 Document Control 0.1 Author
Colin Brady Network Performance - Traffic Analysis Centre
0.2 Checked by
Martin Obee Network Performance - Traffic Analysis Centre
0.3 Approved by Mike Tarrier Network Performance - Traffic Analysis Centre 0.4 Document Summary
This document provides an analysis of traffic levels in Greater London, 1993 to 2010, using DfT traffic flow data. This data is for major roads only and summarises trends for all vehicle classification types.
0.5 Document History
Version Date Changes since previous issue
0.1 20/12/2011 Update of previous report using 2010 DfT traffic flow data
0.2 27/01/2012 Checked over and finalised 0.3 02/03/2012 Chief Traffic Analyst comments 1.0 02/03/2012
0.5 Distribution
Tony Earl (Head of Network Performance) Mike Tarrier (Chief Traffic Analyst) TAC Traffic note distribution list Intranet and TfL website
Transport for London Surface Transport Traffic Analysis Centre
TAC Traffic Note 1 – Traffic levels on major roads in Greater London 1993-2010
2
Contents Document Control .......................................................................................................................... 1 Contents ......................................................................................................................................... 2 1 Executive Summary ............................................................................................................... 3 2 Introduction ............................................................................................................................. 4 3 All motor vehicle traffic on London’s major roads ................................................................... 8 4 Car and Taxi traffic on London’s major roads ...................................................................... 12 5 Bus and Coach traffic on London’s major roads .................................................................. 16 6 Heavy Goods Vehicle traffic on London’s major roads ........................................................ 20 7 Light Goods Vehicle traffic on London’s major roads ........................................................... 24 8 Powered Two Wheeler Vehicle traffic on London’s major roads .......................................... 28 9 All motor vehicle traffic on the Transport for London Road Network .................................... 32 10 Traffic flows for individual sites ............................................................................................. 33 11 Contacts for further information ............................................................................................ 33 12 Library of traffic notes ........................................................................................................... 34 13 Other useful documents ....................................................................................................... 35 14 References ........................................................................................................................... 35 Tables Table 1 – Total Motor Traffic Volume London & Great Britain, 1993 to 2010 ........................................ 6 Table 2 – Average daily traffic flows on major roads in London by vehicle type, 1993 to 2010 ............. 6 Table 3 – All motor vehicle traffic on London’s major roads by Borough ............................................... 8 Table 4 – Car and Taxi traffic on London’s major roads by Borough ................................................... 12 Table 5 – Bus and Coach traffic on London’s major roads by Borough ............................................... 16 Table 6 – Heavy Goods Vehicle traffic on London’s major roads by Borough ..................................... 20 Table 7 – Light Goods Vehicle traffic on London’s major roads by Borough ....................................... 24 Table 8 – Powered Two Wheeler traffic on London’s major roads by Borough ................................... 28 Table 9 – Traffic flows on the Transport for London Road Network by vehicle type, 2000 to 2010 ..... 32
Figures Figure 1 – Map of Central, Inner and Outer London Areas used for reporting
traffic trends measured through DfT NRTCC programme .................................................... 5 Figure 2 – All motor vehicle annual average daily traffic flows on London’s major roads, 1993-2010 ... 7 Figure 3 – 2010 proportion of traffic on London’s major roads by vehicle type ...................................... 7 Figure 4 – All motor vehicle traffic on London’s major roads, 1993 to 2010 .......................................... 9 Figure 5 – 2010 Map of Annual Average Daily Flow Estimates – All motor vehicles ........................... 10 Figure 6 – All motor vehicle traffic; Map of percentage change from 1994-99 to year 2010 ................ 11 Figure 7 – Car and Taxi traffic on major roads in London, 1993 to 2010 ............................................. 13 Figure 8 – 2010 Map of Annual Average Daily Flow Estimates – Car and Taxi vehicles ..................... 14 Figure 9 – Car and Taxi traffic; Map of percentage change from 1994-99 to year 2010 ...................... 15 Figure 10 – Bus and Coach traffic on major roads in London, 1993 to 2010 ....................................... 17 Figure 11 – 2010 Map of Annual Average Daily Flow Estimates – Bus and Coach Vehicles .............. 18 Figure 12 – Bus and Coach traffic; Map of percentage change from 1994-99 to year 2010 ................ 19 Figure 13 – Heavy Goods Vehicle traffic on major roads in London, 1993 to 2010 ............................. 21 Figure 14 – 2010 Map of Annual Average Daily Flow Estimates – Heavy Goods Vehicles ................. 22 Figure 15 – Heavy Goods Vehicle traffic; Map of percentage change from 1994-99 to year 2010 ...... 23 Figure 16 – Light Goods Vehicle traffic on major roads in London, 1993 to 2010 ............................... 25 Figure 17 – 2010 Map of Annual Average Daily Flow Estimates – Light Goods Vehicles ................... 26 Figure 18 – Light Goods Vehicle traffic; Map of percentage change from 1994-99 to year 2010 ........ 27 Figure 19 – Powered Two Wheeler Vehicle traffic on major roads in London, 1993 to 2010 .............. 29 Figure 20 – 2010 Map of Annual Average Daily Flow Estimates – Powered Two Wheeler Vehicles .. 30 Figure 21 – Powered Two Wheeler Vehicle traffic;
Map of percentage change from 1994-99 to year 2010 .................................................... 31 Figure 22 – All Motor Vehicle Traffic on the Transport for London Road Network ............................... 32
Transport for London Surface Transport Traffic Analysis Centre
TAC Traffic Note 1 – Traffic levels on major roads in Greater London 1993-2010
3
1 Executive Summary 1.1 The report provides a historical summary and analysis of traffic counts recorded
through the DfT National Road Traffic Count programme from 1993 to 2010. The report summarises the trends in traffic volume on major roads broken down by vehicle type and London Borough. Highlights from the 2010 surveys show that:
• Overall the number of all motor vehicle kilometres travelled on London’s
major road network is 19.4 billion, its lowest level since 1993
• The total motor vehicle kilometres travelled on all roads in London is 31.4 billion, its lowest level since 1995
• Over the longer term, measured by comparison to the 1994-1999 base
average, there has been a decrease of 3.9% in major road traffic within Greater London, with decreases of 21.1%, 8.2% and 1% recorded in central, inner and outer London respectively
• Analysis by borough shows that all motor vehicle traffic has increased in the areas to the east and some to the north whereas central, southern and western areas have decreased (with the exception of RB Kingston)
• Over 9.6 billion vehicle kilometres were travelled on the TLRN,
accounting for over 30% of vehicle kilometres travelled on all London’s roads
• Bus and Coach vehicle kilometres travelled on London’s major roads
has shown over a 30% increase compared to the 1994-99 base average
• Over the last 4 years there have been significant reductions in light
goods vehicle kilometres travelled on major roads across all areas of London
1.2 The note is updated annually by the Traffic Analysis Centre who manage the TfL
database which holds DfT traffic count data for the London area.
Transport for London Surface Transport Traffic Analysis Centre
TAC Traffic Note 1 – Traffic levels on major roads in Greater London 1993-2010
4
2 Introduction 2.1 This traffic note, produced by the Traffic Analysis Centre (TAC) within London
Streets, provides a summary and analysis of road traffic levels on major roads within Greater London for 1993 to 2010 measured through the Department for Transport (DfT) National Road Traffic Census Count (NRTCC) programme. Comparisons are made between 2010 (the latest year for which finalised data is available) and the average for 1994-1999. It summarises traffic levels broken down by different vehicle classifications and areas of London. Section 8 summarises traffic levels specifically for the Transport for London Road Network (TLRN). This note will be updated annually by TAC who manage the TfL database which holds DfT traffic count data for the London area.
2.2 The DfT monitoring network within London is made up of approximately 1780 km
of major roads (all ‘M’ and ‘A’ numbered roads) split into 1850 links. For each link, 12 hour 7am to 7pm classified manual counts are undertaken on a 1, 2, 4 or 8 year frequency depending on the variability and level of traffic. These counts are combined with information from Automatic Traffic Counters (ATCs) to derive expansion factors which are used to calculate an annual average daily traffic flow estimate (AADF) for each link. In years when a link is not counted, a current AADF is calculated by applying growth factors to the previous year’s AADF. These are 7 day 24 hour averages and are aggregated to estimate the number of vehicle kilometres travelled on the network. Although an attempt is made to estimate minor road traffic, the DfT methodology used is less robust as it is not feasible to measure it in terms of links. Instead minor road traffic is estimated by grouping the network into one of six minor road classes and measuring the average flow for each of these. This is not included in this report, except in Table 1 for a general comparison.
2.3 The DfT vehicle classification includes all motor vehicles split into car and taxi,
bus and coach, heavy goods vehicles (HGV), light goods vehicles (LGV), and powered two wheelers. Each of these is analysed in this traffic note. In addition pedal cycles are also counted.
2.4 More detailed information on how national road traffic estimates are made by the
DfT can be found on their website: http://assets.dft.gov.uk/statistics/releases/traffic-estimates-2010/traffic-estimates-2010-methodology.pdf
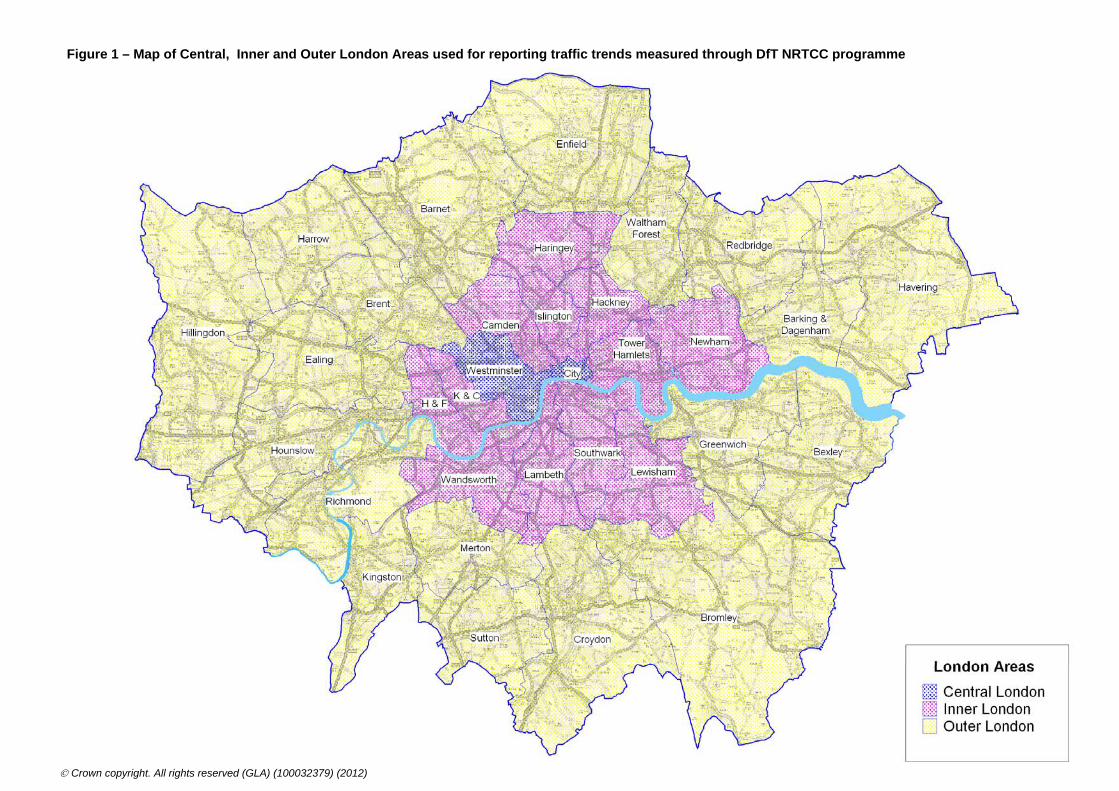
2.5 Figure 1 on the next page shows the boundaries of the Central, Inner and Outer
London areas that are used throughout this report to summarise the traffic trends. The 3 areas are based on London Borough boundaries with: • Central London comprising of Westminster and the City of London; • Inner London comprising of Camden, Hackney, Hammersmith & Fulham,
Haringey, Islington, Kensington & Chelsea, Lambeth, Lewisham, Newham, Southwark, Tower Hamlets and Wandsworth; and
• Outer London comprising of Barking & Dagenham, Barnet, Bexley, Brent, Bromley, Croydon, Ealing, Enfield, Greenwich, Harrow, Havering, Hillingdon, Hounslow, Kingston, Merton, Redbridge, Richmond, Sutton and Waltham Forest.
5
Figure 1 – Map of Central, Inner and Outer London Areas used for reporting traffic trends measured through DfT NRTCC programme
© Crown copyright. All rights reserved (GLA) (100032379) (2012)
Transport for London Surface Transport Traffic Analysis Centre
TAC Traffic Note 1 – Traffic levels on major roads in Greater London 1993-2010
6
Table 1 – Total Motor Traffic Volume London & Great Britain, 1993 to 2010
Table 2 – Average daily traffic flows on major roads in London by vehicle type, 1993 to 2010
Billion vehicle-kilometres per year
London Major Roads
London Minor Roads
All Roads London (DfT)
All Roads Great Britain
1993 19.6 11.1 30.7 412.31994 20.0 11.2 31.1 421.51995 20.0 11.2 31.2 429.71996 20.1 11.3 31.5 441.11997 20.3 11.4 31.7 450.31998 20.3 11.6 31.9 458.51999 20.8 11.9 32.7 467.02000 20.7 11.9 32.6 467.12001 20.6 12.1 32.7 474.42002 20.3 12.5 32.8 486.52003 20.2 12.6 32.8 490.42004 20.0 12.6 32.7 498.62005 20.0 12.6 32.7 499.42006 20.5 12.5 33.0 507.62007 20.0 12.9 32.9 513.02008 19.5 12.7 32.2 508.92009 19.5 12.5 31.9 504.02010 19.4 12.0 31.4 495.9
Pedal Cycles Motorcycles
Cars & Taxis LGV HGV
Buses & Coaches
All motor Vehicles
1993 0.26 0.58 24.8 3.10 1.30 0.44 30.31994 0.27 0.61 25.2 3.24 1.28 0.47 30.81995 0.26 0.60 25.1 3.42 1.25 0.50 30.81996 0.29 0.62 25.3 3.33 1.33 0.51 31.11997 0.28 0.67 25.4 3.36 1.34 0.51 31.31998 0.26 0.68 25.4 3.30 1.48 0.50 31.31999 0.26 0.74 25.8 3.50 1.40 0.53 31.92000 0.25 0.72 25.6 3.52 1.44 0.52 31.82001 0.27 0.75 25.5 3.58 1.40 0.52 31.72002 0.26 0.71 25.2 3.42 1.35 0.56 31.22003 0.33 0.78 24.7 3.70 1.35 0.59 31.12004 0.33 0.74 24.5 3.50 1.37 0.62 30.82005 0.40 0.74 24.5 3.57 1.40 0.62 30.82006 0.47 0.84 24.4 4.18 1.37 0.69 31.52007 0.43 0.81 23.7 4.28 1.36 0.67 30.82008 0.44 0.74 23.3 3.86 1.38 0.66 29.92009 0.43 0.70 23.6 3.69 1.31 0.67 29.92010 0.46 0.66 23.7 3.55 1.34 0.66 29.9
Thousand vehicles per day
7
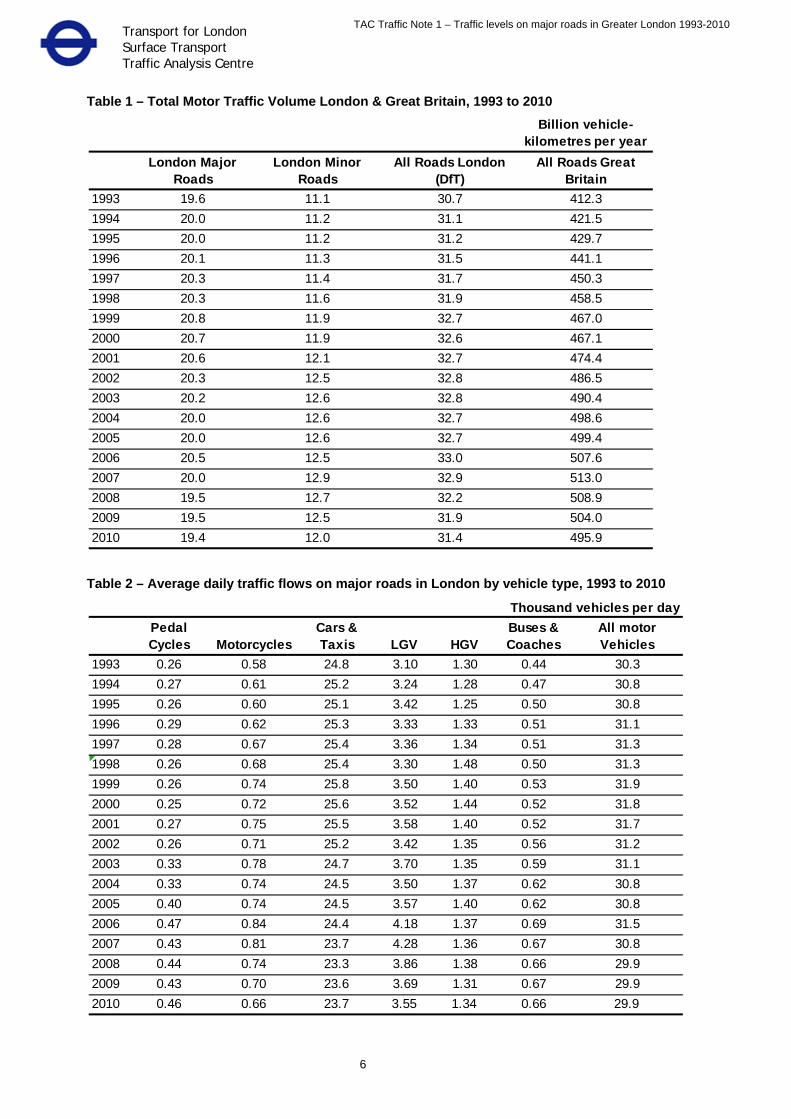
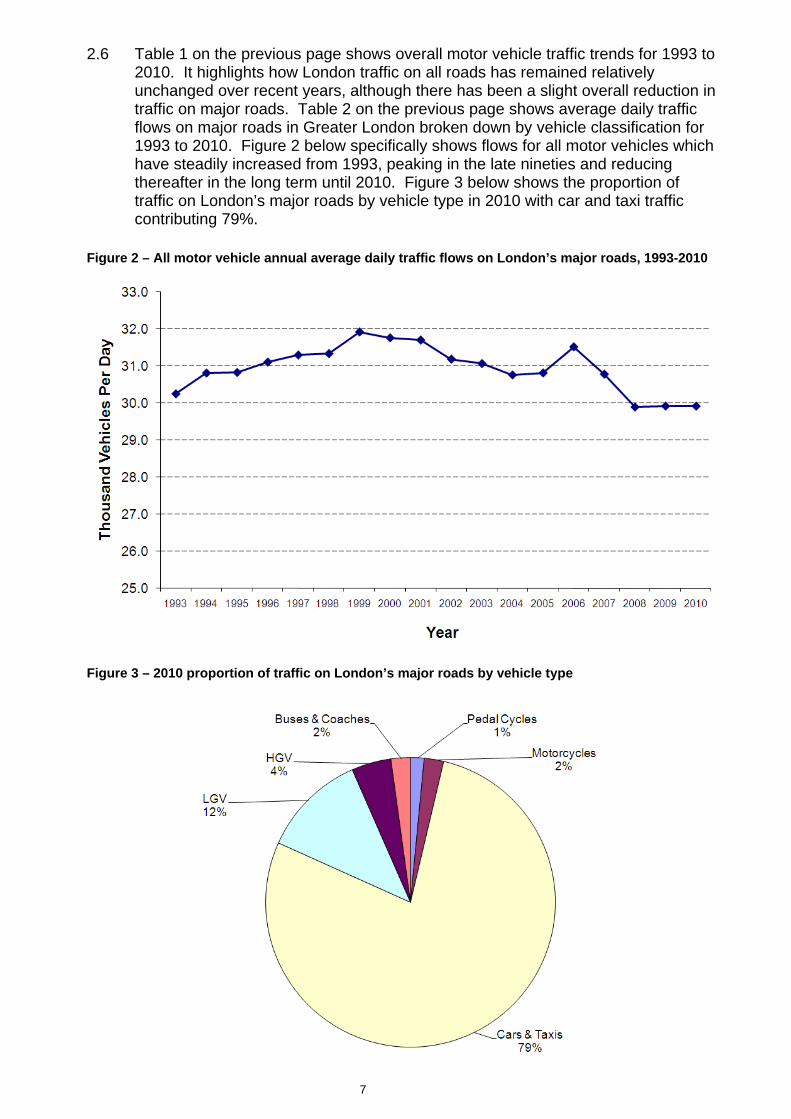
2.6 Table 1 on the previous page shows overall motor vehicle traffic trends for 1993 to 2010. It highlights how London traffic on all roads has remained relatively unchanged over recent years, although there has been a slight overall reduction in traffic on major roads. Table 2 on the previous page shows average daily traffic flows on major roads in Greater London broken down by vehicle classification for 1993 to 2010. Figure 2 below specifically shows flows for all motor vehicles which have steadily increased from 1993, peaking in the late nineties and reducing thereafter in the long term until 2010. Figure 3 below shows the proportion of traffic on London’s major roads by vehicle type in 2010 with car and taxi traffic contributing 79%.
Figure 2 – All motor vehicle annual average daily traffic flows on London’s major roads, 1993-2010
Figure 3 – 2010 proportion of traffic on London’s major roads by vehicle type
8
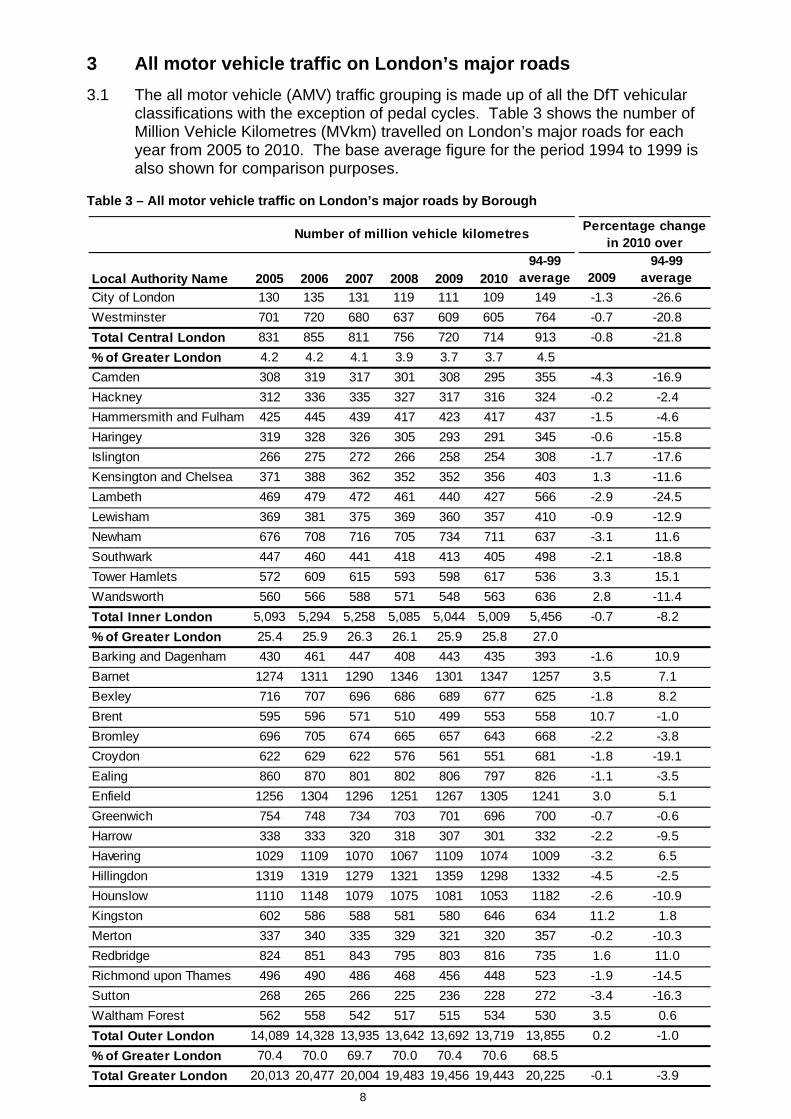
3 All motor vehicle traffic on London’s major roads
3.1 The all motor vehicle (AMV) traffic grouping is made up of all the DfT vehicular classifications with the exception of pedal cycles. Table 3 shows the number of Million Vehicle Kilometres (MVkm) travelled on London’s major roads for each year from 2005 to 2010. The base average figure for the period 1994 to 1999 is also shown for comparison purposes.
Table 3 – All motor vehicle traffic on London’s major roads by Borough
Local Authority Name 2005 2006 2007 2008 2009 201094-99
average 200994-99
averageCity of London 130 135 131 119 111 109 149 -1.3 -26.6Westminster 701 720 680 637 609 605 764 -0.7 -20.8Total Central London 831 855 811 756 720 714 913 -0.8 -21.8% of Greater London 4.2 4.2 4.1 3.9 3.7 3.7 4.5Camden 308 319 317 301 308 295 355 -4.3 -16.9Hackney 312 336 335 327 317 316 324 -0.2 -2.4Hammersmith and Fulham 425 445 439 417 423 417 437 -1.5 -4.6Haringey 319 328 326 305 293 291 345 -0.6 -15.8Islington 266 275 272 266 258 254 308 -1.7 -17.6Kensington and Chelsea 371 388 362 352 352 356 403 1.3 -11.6Lambeth 469 479 472 461 440 427 566 -2.9 -24.5Lewisham 369 381 375 369 360 357 410 -0.9 -12.9Newham 676 708 716 705 734 711 637 -3.1 11.6Southwark 447 460 441 418 413 405 498 -2.1 -18.8Tower Hamlets 572 609 615 593 598 617 536 3.3 15.1Wandsworth 560 566 588 571 548 563 636 2.8 -11.4Total Inner London 5,093 5,294 5,258 5,085 5,044 5,009 5,456 -0.7 -8.2% of Greater London 25.4 25.9 26.3 26.1 25.9 25.8 27.0Barking and Dagenham 430 461 447 408 443 435 393 -1.6 10.9Barnet 1274 1311 1290 1346 1301 1347 1257 3.5 7.1Bexley 716 707 696 686 689 677 625 -1.8 8.2Brent 595 596 571 510 499 553 558 10.7 -1.0Bromley 696 705 674 665 657 643 668 -2.2 -3.8Croydon 622 629 622 576 561 551 681 -1.8 -19.1Ealing 860 870 801 802 806 797 826 -1.1 -3.5Enfield 1256 1304 1296 1251 1267 1305 1241 3.0 5.1Greenwich 754 748 734 703 701 696 700 -0.7 -0.6Harrow 338 333 320 318 307 301 332 -2.2 -9.5Havering 1029 1109 1070 1067 1109 1074 1009 -3.2 6.5Hillingdon 1319 1319 1279 1321 1359 1298 1332 -4.5 -2.5Hounslow 1110 1148 1079 1075 1081 1053 1182 -2.6 -10.9Kingston 602 586 588 581 580 646 634 11.2 1.8Merton 337 340 335 329 321 320 357 -0.2 -10.3Redbridge 824 851 843 795 803 816 735 1.6 11.0Richmond upon Thames 496 490 486 468 456 448 523 -1.9 -14.5Sutton 268 265 266 225 236 228 272 -3.4 -16.3Waltham Forest 562 558 542 517 515 534 530 3.5 0.6Total Outer London 14,089 14,328 13,935 13,642 13,692 13,719 13,855 0.2 -1.0% of Greater London 70.4 70.0 69.7 70.0 70.4 70.6 68.5Total Greater London 20,013 20,477 20,004 19,483 19,456 19,443 20,225 -0.1 -3.9
Number of million vehicle kilometres Percentage change in 2010 over
Transport for London Surface Transport Traffic Analysis Centre
TAC Traffic Note 1 – Traffic levels on major roads in Greater London 1993-2010
9
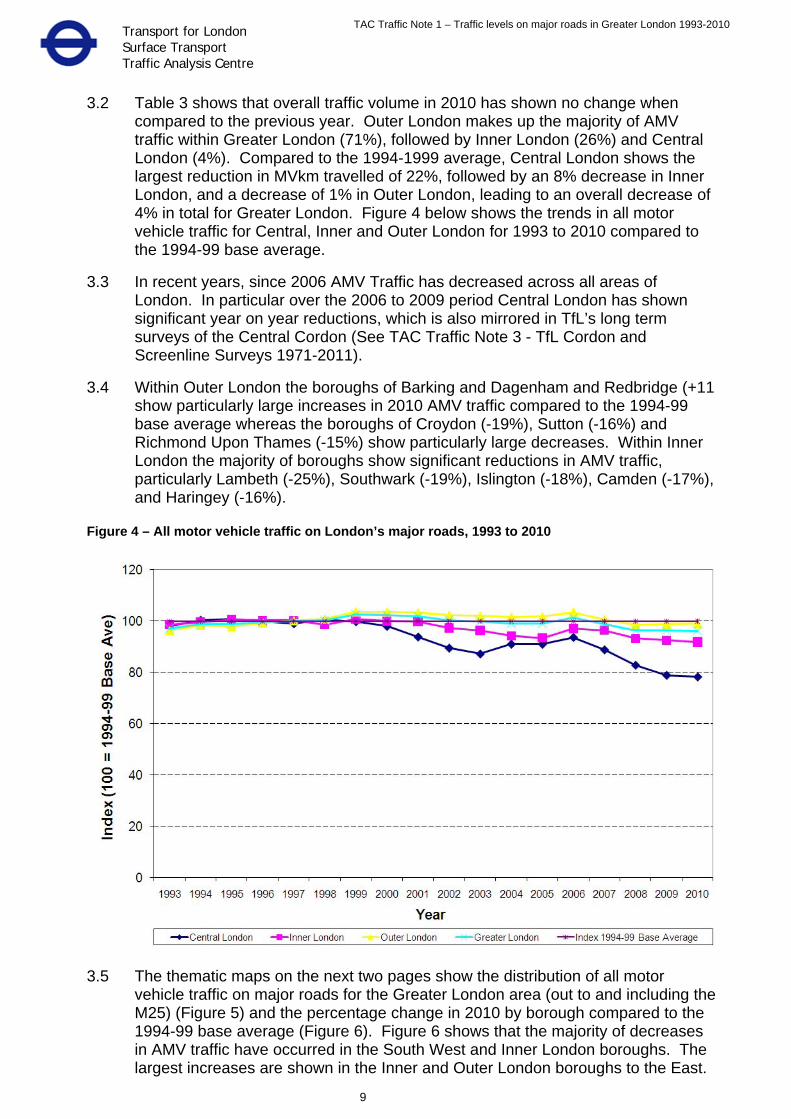
3.2 Table 3 shows that overall traffic volume in 2010 has shown no change when compared to the previous year. Outer London makes up the majority of AMV traffic within Greater London (71%), followed by Inner London (26%) and Central London (4%). Compared to the 1994-1999 average, Central London shows the largest reduction in MVkm travelled of 22%, followed by an 8% decrease in Inner London, and a decrease of 1% in Outer London, leading to an overall decrease of 4% in total for Greater London. Figure 4 below shows the trends in all motor vehicle traffic for Central, Inner and Outer London for 1993 to 2010 compared to the 1994-99 base average.
3.3 In recent years, since 2006 AMV Traffic has decreased across all areas of
London. In particular over the 2006 to 2009 period Central London has shown significant year on year reductions, which is also mirrored in TfL’s long term surveys of the Central Cordon (See TAC Traffic Note 3 - TfL Cordon and Screenline Surveys 1971-2011).
3.4 Within Outer London the boroughs of Barking and Dagenham and Redbridge (+11
show particularly large increases in 2010 AMV traffic compared to the 1994-99 base average whereas the boroughs of Croydon (-19%), Sutton (-16%) and Richmond Upon Thames (-15%) show particularly large decreases. Within Inner London the majority of boroughs show significant reductions in AMV traffic, particularly Lambeth (-25%), Southwark (-19%), Islington (-18%), Camden (-17%), and Haringey (-16%).
Figure 4 – All motor vehicle traffic on London’s major roads, 1993 to 2010
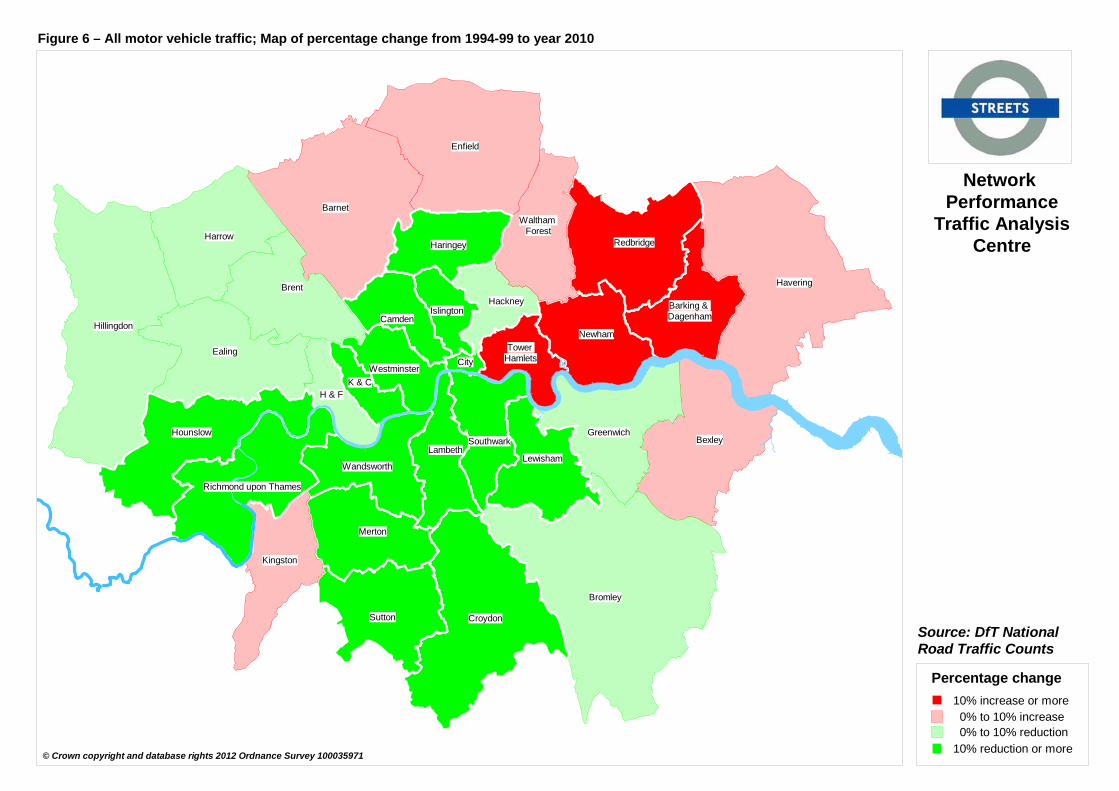
3.5 The thematic maps on the next two pages show the distribution of all motor vehicle traffic on major roads for the Greater London area (out to and including the M25) (Figure 5) and the percentage change in 2010 by borough compared to the 1994-99 base average (Figure 6). Figure 6 shows that the majority of decreases in AMV traffic have occurred in the South West and Inner London boroughs. The largest increases are shown in the Inner and Outer London boroughs to the East.
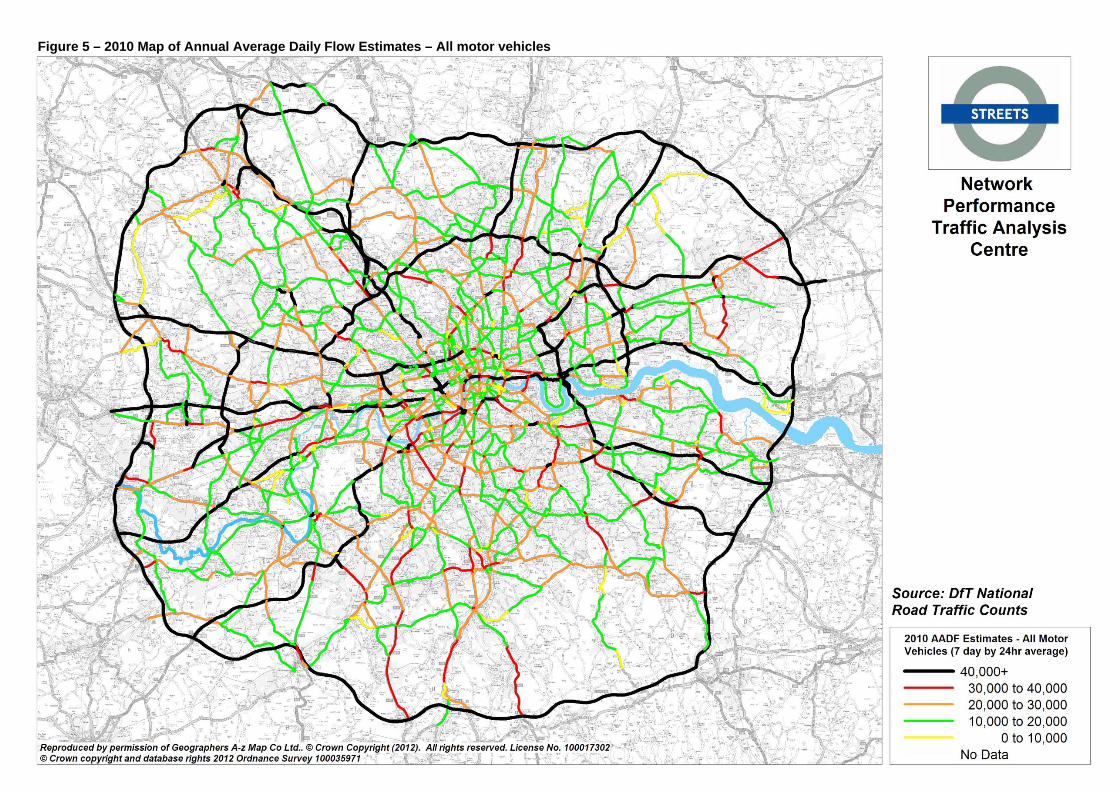
Figure 5 – 2010 Map of Annual Average Daily Flow Estimates – All motor vehicles
Hounslow
Tower Hamlets
Waltham Forest
Hackney
Kingston
Barking & Dagenham
City
H & FK & C
Hounslow
Tower Hamlets
Waltham Forest
Hackney
Kingston
Barking & Dagenham
City
H & FK & C
Barnet
Bexley
Brent
Bromley
Camden
Croydon
Ealing
Enfield
Greenwich
HaringeyHarrow
Havering
HillingdonIslington
LambethLewisham
Merton
Newham
Redbridge
Richmond upon Thames
Southwark
Sutton
Wandsworth
Westminster
Percentage change10% increase or more0% to 10% increase0% to 10% reduction
10% reduction or more
Network Performance
Traffic AnalysisCentre
Source: DfT NationalRoad Traffic Counts
© Crown copyright and database rights 2012 Ordnance Survey 100035971
Figure 6 – All motor vehicle traffic; Map of percentage change from 1994-99 to year 2010
12
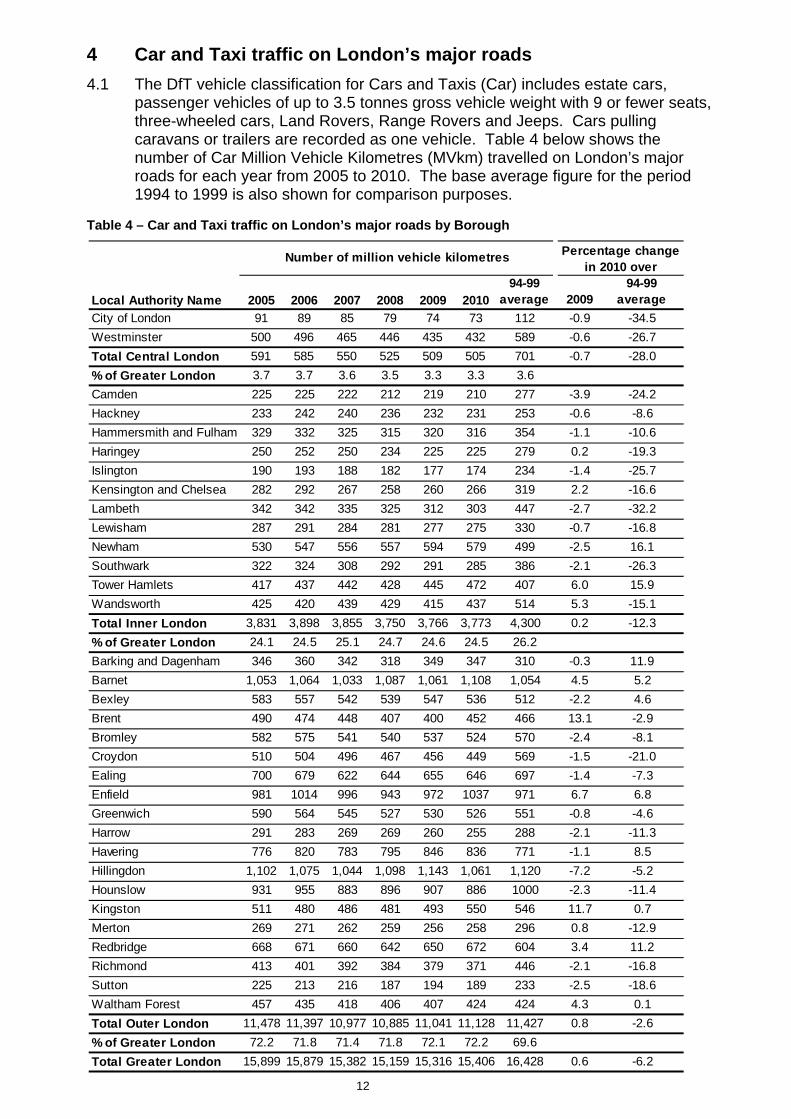
4 Car and Taxi traffic on London’s major roads
4.1 The DfT vehicle classification for Cars and Taxis (Car) includes estate cars, passenger vehicles of up to 3.5 tonnes gross vehicle weight with 9 or fewer seats, three-wheeled cars, Land Rovers, Range Rovers and Jeeps. Cars pulling caravans or trailers are recorded as one vehicle. Table 4 below shows the number of Car Million Vehicle Kilometres (MVkm) travelled on London’s major roads for each year from 2005 to 2010. The base average figure for the period 1994 to 1999 is also shown for comparison purposes.
Table 4 – Car and Taxi traffic on London’s major roads by Borough
Local Authority Name 2005 2006 2007 2008 2009 201094-99
average 200994-99
averageCity of London 91 89 85 79 74 73 112 -0.9 -34.5Westminster 500 496 465 446 435 432 589 -0.6 -26.7Total Central London 591 585 550 525 509 505 701 -0.7 -28.0% of Greater London 3.7 3.7 3.6 3.5 3.3 3.3 3.6Camden 225 225 222 212 219 210 277 -3.9 -24.2Hackney 233 242 240 236 232 231 253 -0.6 -8.6Hammersmith and Fulham 329 332 325 315 320 316 354 -1.1 -10.6Haringey 250 252 250 234 225 225 279 0.2 -19.3Islington 190 193 188 182 177 174 234 -1.4 -25.7Kensington and Chelsea 282 292 267 258 260 266 319 2.2 -16.6Lambeth 342 342 335 325 312 303 447 -2.7 -32.2Lewisham 287 291 284 281 277 275 330 -0.7 -16.8Newham 530 547 556 557 594 579 499 -2.5 16.1Southwark 322 324 308 292 291 285 386 -2.1 -26.3Tower Hamlets 417 437 442 428 445 472 407 6.0 15.9Wandsworth 425 420 439 429 415 437 514 5.3 -15.1Total Inner London 3,831 3,898 3,855 3,750 3,766 3,773 4,300 0.2 -12.3% of Greater London 24.1 24.5 25.1 24.7 24.6 24.5 26.2Barking and Dagenham 346 360 342 318 349 347 310 -0.3 11.9Barnet 1,053 1,064 1,033 1,087 1,061 1,108 1,054 4.5 5.2Bexley 583 557 542 539 547 536 512 -2.2 4.6Brent 490 474 448 407 400 452 466 13.1 -2.9Bromley 582 575 541 540 537 524 570 -2.4 -8.1Croydon 510 504 496 467 456 449 569 -1.5 -21.0Ealing 700 679 622 644 655 646 697 -1.4 -7.3Enfield 981 1014 996 943 972 1037 971 6.7 6.8Greenwich 590 564 545 527 530 526 551 -0.8 -4.6Harrow 291 283 269 269 260 255 288 -2.1 -11.3Havering 776 820 783 795 846 836 771 -1.1 8.5Hillingdon 1,102 1,075 1,044 1,098 1,143 1,061 1,120 -7.2 -5.2Hounslow 931 955 883 896 907 886 1000 -2.3 -11.4Kingston 511 480 486 481 493 550 546 11.7 0.7Merton 269 271 262 259 256 258 296 0.8 -12.9Redbridge 668 671 660 642 650 672 604 3.4 11.2Richmond 413 401 392 384 379 371 446 -2.1 -16.8Sutton 225 213 216 187 194 189 233 -2.5 -18.6Waltham Forest 457 435 418 406 407 424 424 4.3 0.1Total Outer London 11,478 11,397 10,977 10,885 11,041 11,128 11,427 0.8 -2.6% of Greater London 72.2 71.8 71.4 71.8 72.1 72.2 69.6Total Greater London 15,899 15,879 15,382 15,159 15,316 15,406 16,428 0.6 -6.2
Number of million vehicle kilometres Percentage change in 2010 over
Transport for London Surface Transport Traffic Analysis Centre
TAC Traffic Note 1 – Traffic levels on major roads in Greater London 1993-2010
13
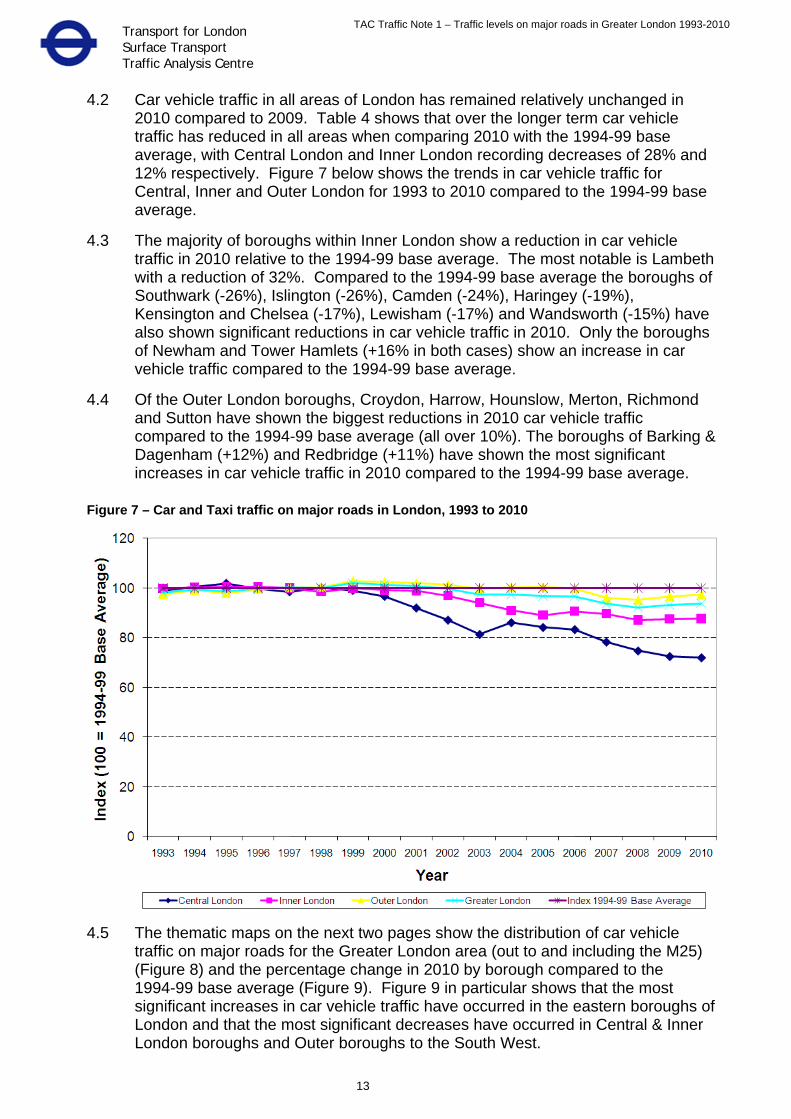
4.2 Car vehicle traffic in all areas of London has remained relatively unchanged in 2010 compared to 2009. Table 4 shows that over the longer term car vehicle traffic has reduced in all areas when comparing 2010 with the 1994-99 base average, with Central London and Inner London recording decreases of 28% and 12% respectively. Figure 7 below shows the trends in car vehicle traffic for Central, Inner and Outer London for 1993 to 2010 compared to the 1994-99 base average.
4.3 The majority of boroughs within Inner London show a reduction in car vehicle
traffic in 2010 relative to the 1994-99 base average. The most notable is Lambeth with a reduction of 32%. Compared to the 1994-99 base average the boroughs of Southwark (-26%), Islington (-26%), Camden (-24%), Haringey (-19%), Kensington and Chelsea (-17%), Lewisham (-17%) and Wandsworth (-15%) have also shown significant reductions in car vehicle traffic in 2010. Only the boroughs of Newham and Tower Hamlets (+16% in both cases) show an increase in car vehicle traffic compared to the 1994-99 base average.
4.4 Of the Outer London boroughs, Croydon, Harrow, Hounslow, Merton, Richmond
and Sutton have shown the biggest reductions in 2010 car vehicle traffic compared to the 1994-99 base average (all over 10%). The boroughs of Barking & Dagenham (+12%) and Redbridge (+11%) have shown the most significant increases in car vehicle traffic in 2010 compared to the 1994-99 base average.
Figure 7 – Car and Taxi traffic on major roads in London, 1993 to 2010
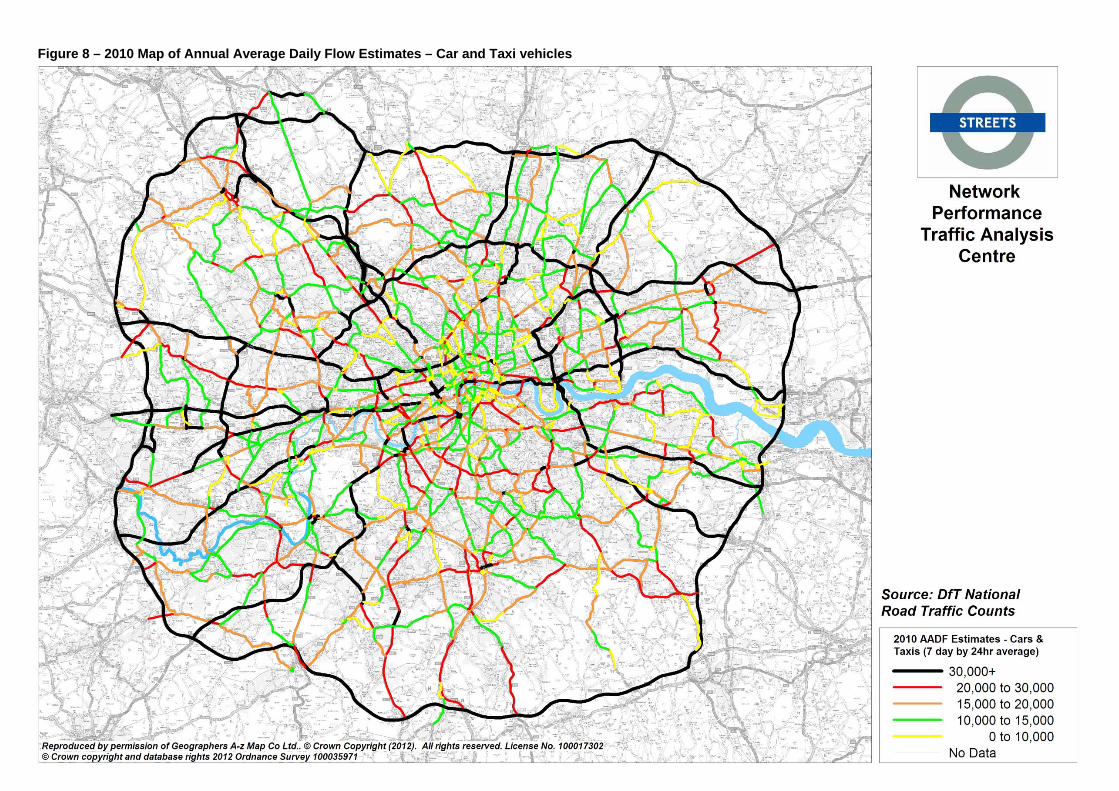
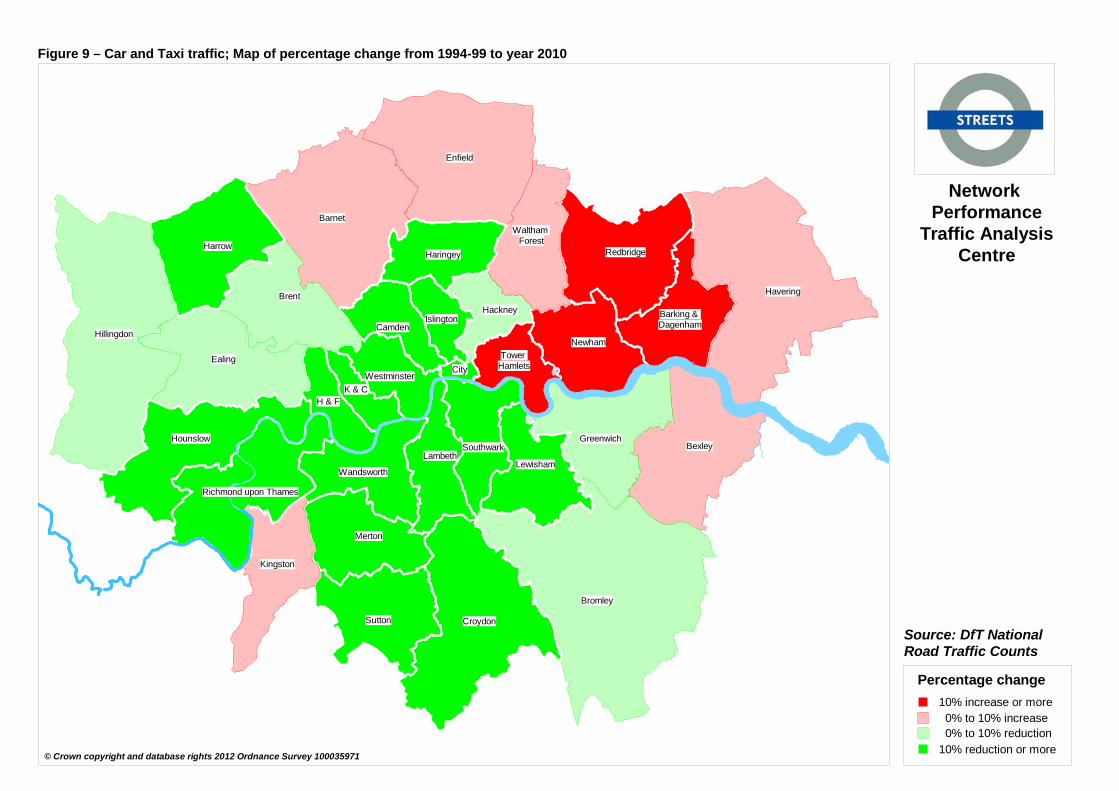
4.5 The thematic maps on the next two pages show the distribution of car vehicle
traffic on major roads for the Greater London area (out to and including the M25) (Figure 8) and the percentage change in 2010 by borough compared to the 1994-99 base average (Figure 9). Figure 9 in particular shows that the most significant increases in car vehicle traffic have occurred in the eastern boroughs of London and that the most significant decreases have occurred in Central & Inner London boroughs and Outer boroughs to the South West.
14
Figure 8 – 2010 Map of Annual Average Daily Flow Estimates – Car and Taxi vehicles
15
Hounslow
Tower Hamlets
Waltham Forest
Hackney
Kingston
Barking & Dagenham
City
H & FK & C
Hounslow
Tower Hamlets
Waltham Forest
Hackney
Kingston
Barking & Dagenham
City
H & FK & C
Barnet
Bexley
Brent
Bromley
Camden
Croydon
Ealing
Enfield
Greenwich
HaringeyHarrow
Havering
HillingdonIslington
LambethLewisham
Merton
Newham
Redbridge
Richmond upon Thames
Southwark
Sutton
Wandsworth
Westminster
Percentage change10% increase or more0% to 10% increase0% to 10% reduction
10% reduction or more
Network Performance
Traffic AnalysisCentre
Source: DfT NationalRoad Traffic Counts
© Crown copyright and database rights 2012 Ordnance Survey 100035971
Figure 9 – Car and Taxi traffic; Map of percentage change from 1994-99 to year 2010
16
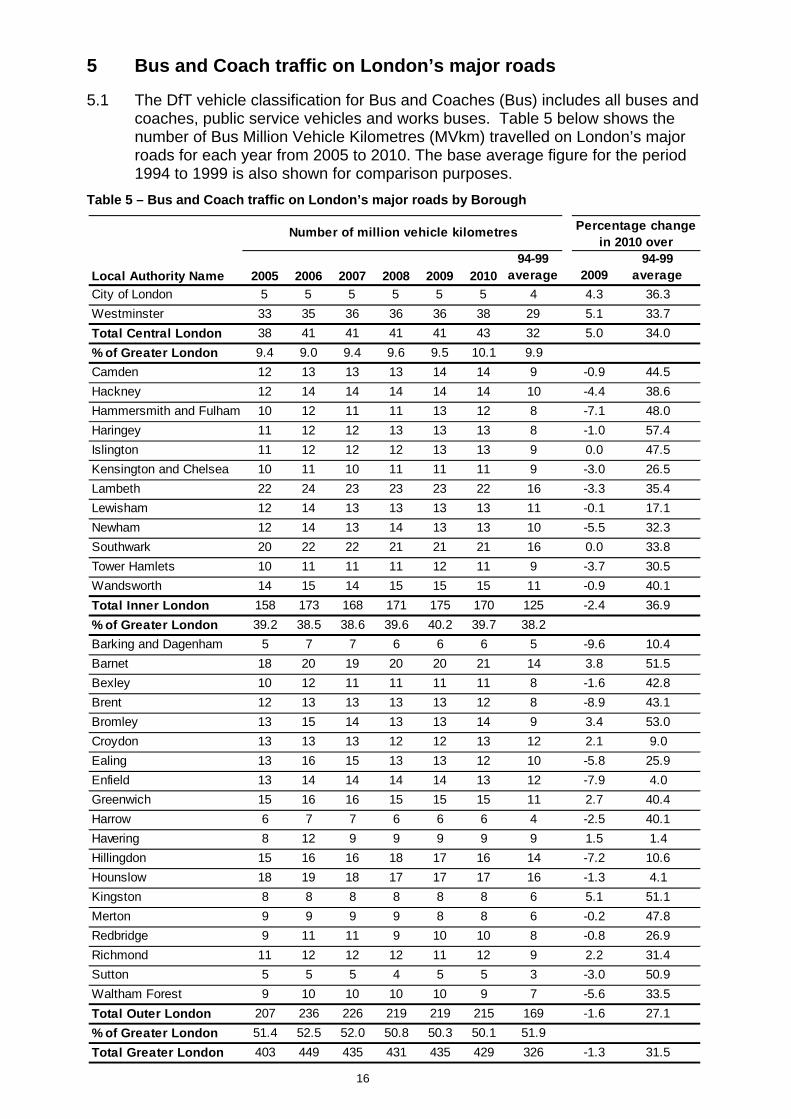
5 Bus and Coach traffic on London’s major roads
5.1 The DfT vehicle classification for Bus and Coaches (Bus) includes all buses and coaches, public service vehicles and works buses. Table 5 below shows the number of Bus Million Vehicle Kilometres (MVkm) travelled on London’s major roads for each year from 2005 to 2010. The base average figure for the period 1994 to 1999 is also shown for comparison purposes.
Table 5 – Bus and Coach traffic on London’s major roads by Borough
Local Authority Name 2005 2006 2007 2008 2009 201094-99
average 200994-99
averageCity of London 5 5 5 5 5 5 4 4.3 36.3Westminster 33 35 36 36 36 38 29 5.1 33.7Total Central London 38 41 41 41 41 43 32 5.0 34.0% of Greater London 9.4 9.0 9.4 9.6 9.5 10.1 9.9Camden 12 13 13 13 14 14 9 -0.9 44.5Hackney 12 14 14 14 14 14 10 -4.4 38.6Hammersmith and Fulham 10 12 11 11 13 12 8 -7.1 48.0Haringey 11 12 12 13 13 13 8 -1.0 57.4Islington 11 12 12 12 13 13 9 0.0 47.5Kensington and Chelsea 10 11 10 11 11 11 9 -3.0 26.5Lambeth 22 24 23 23 23 22 16 -3.3 35.4Lewisham 12 14 13 13 13 13 11 -0.1 17.1Newham 12 14 13 14 13 13 10 -5.5 32.3Southwark 20 22 22 21 21 21 16 0.0 33.8Tower Hamlets 10 11 11 11 12 11 9 -3.7 30.5Wandsworth 14 15 14 15 15 15 11 -0.9 40.1Total Inner London 158 173 168 171 175 170 125 -2.4 36.9% of Greater London 39.2 38.5 38.6 39.6 40.2 39.7 38.2Barking and Dagenham 5 7 7 6 6 6 5 -9.6 10.4Barnet 18 20 19 20 20 21 14 3.8 51.5Bexley 10 12 11 11 11 11 8 -1.6 42.8Brent 12 13 13 13 13 12 8 -8.9 43.1Bromley 13 15 14 13 13 14 9 3.4 53.0Croydon 13 13 13 12 12 13 12 2.1 9.0Ealing 13 16 15 13 13 12 10 -5.8 25.9Enfield 13 14 14 14 14 13 12 -7.9 4.0Greenwich 15 16 16 15 15 15 11 2.7 40.4Harrow 6 7 7 6 6 6 4 -2.5 40.1Havering 8 12 9 9 9 9 9 1.5 1.4Hillingdon 15 16 16 18 17 16 14 -7.2 10.6Hounslow 18 19 18 17 17 17 16 -1.3 4.1Kingston 8 8 8 8 8 8 6 5.1 51.1Merton 9 9 9 9 8 8 6 -0.2 47.8Redbridge 9 11 11 9 10 10 8 -0.8 26.9Richmond 11 12 12 12 11 12 9 2.2 31.4Sutton 5 5 5 4 5 5 3 -3.0 50.9Waltham Forest 9 10 10 10 10 9 7 -5.6 33.5Total Outer London 207 236 226 219 219 215 169 -1.6 27.1% of Greater London 51.4 52.5 52.0 50.8 50.3 50.1 51.9Total Greater London 403 449 435 431 435 429 326 -1.3 31.5
Number of million vehicle kilometres Percentage change in 2010 over
Transport for London Surface Transport Traffic Analysis Centre
TAC Traffic Note 1 – Traffic levels on major roads in Greater London 1993-2010
17
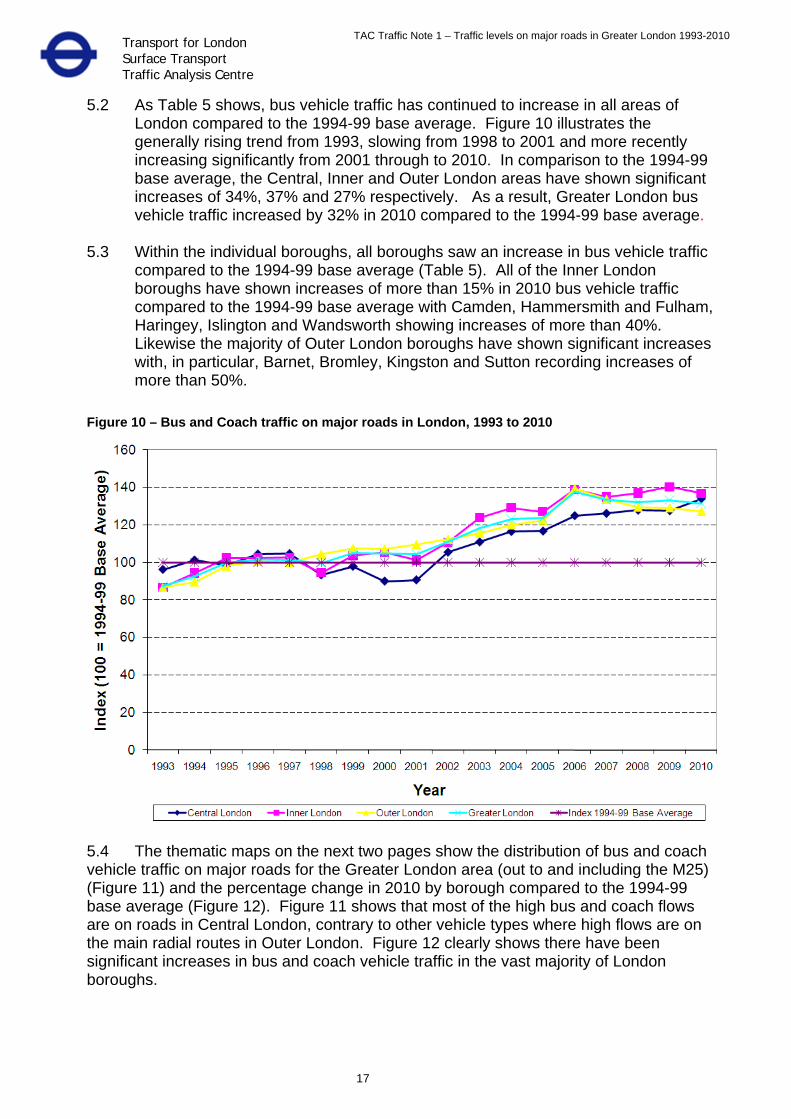
5.2 As Table 5 shows, bus vehicle traffic has continued to increase in all areas of London compared to the 1994-99 base average. Figure 10 illustrates the generally rising trend from 1993, slowing from 1998 to 2001 and more recently increasing significantly from 2001 through to 2010. In comparison to the 1994-99 base average, the Central, Inner and Outer London areas have shown significant increases of 34%, 37% and 27% respectively. As a result, Greater London bus vehicle traffic increased by 32% in 2010 compared to the 1994-99 base average.
5.3 Within the individual boroughs, all boroughs saw an increase in bus vehicle traffic
compared to the 1994-99 base average (Table 5). All of the Inner London boroughs have shown increases of more than 15% in 2010 bus vehicle traffic compared to the 1994-99 base average with Camden, Hammersmith and Fulham, Haringey, Islington and Wandsworth showing increases of more than 40%. Likewise the majority of Outer London boroughs have shown significant increases with, in particular, Barnet, Bromley, Kingston and Sutton recording increases of more than 50%.
Figure 10 – Bus and Coach traffic on major roads in London, 1993 to 2010
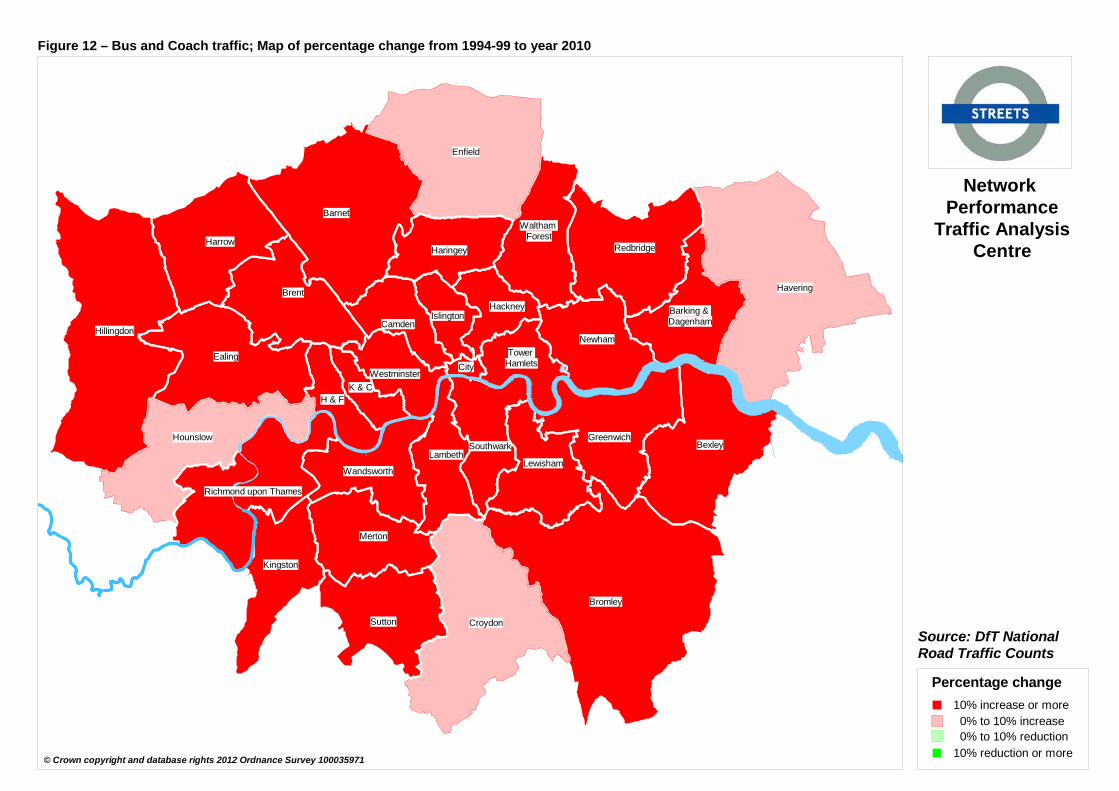
5.4 The thematic maps on the next two pages show the distribution of bus and coach vehicle traffic on major roads for the Greater London area (out to and including the M25) (Figure 11) and the percentage change in 2010 by borough compared to the 1994-99 base average (Figure 12). Figure 11 shows that most of the high bus and coach flows are on roads in Central London, contrary to other vehicle types where high flows are on the main radial routes in Outer London. Figure 12 clearly shows there have been significant increases in bus and coach vehicle traffic in the vast majority of London boroughs.
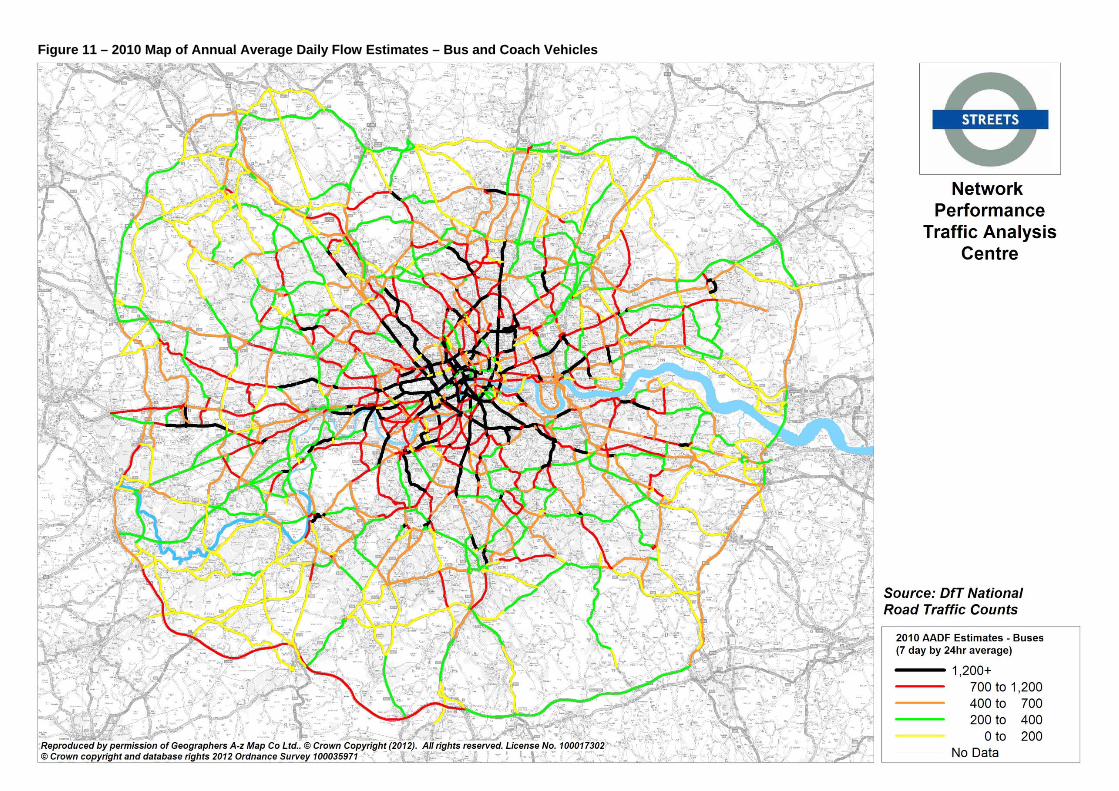
Figure 11 – 2010 Map of Annual Average Daily Flow Estimates – Bus and Coach Vehicles
Hounslow
Tower Hamlets
Waltham Forest
Hackney
Kingston
Barking & Dagenham
City
H & FK & C
Hounslow
Tower Hamlets
Waltham Forest
Hackney
Kingston
Barking & Dagenham
City
H & FK & C
Barnet
Bexley
Brent
Bromley
Camden
Croydon
Ealing
Enfield
Greenwich
HaringeyHarrow
Havering
HillingdonIslington
LambethLewisham
Merton
Newham
Redbridge
Richmond upon Thames
Southwark
Sutton
Wandsworth
Westminster
Percentage change10% increase or more0% to 10% increase0% to 10% reduction
10% reduction or more
Network Performance
Traffic AnalysisCentre
Source: DfT NationalRoad Traffic Counts
© Crown copyright and database rights 2012 Ordnance Survey 100035971
Figure 12 – Bus and Coach traffic; Map of percentage change from 1994-99 to year 2010
20
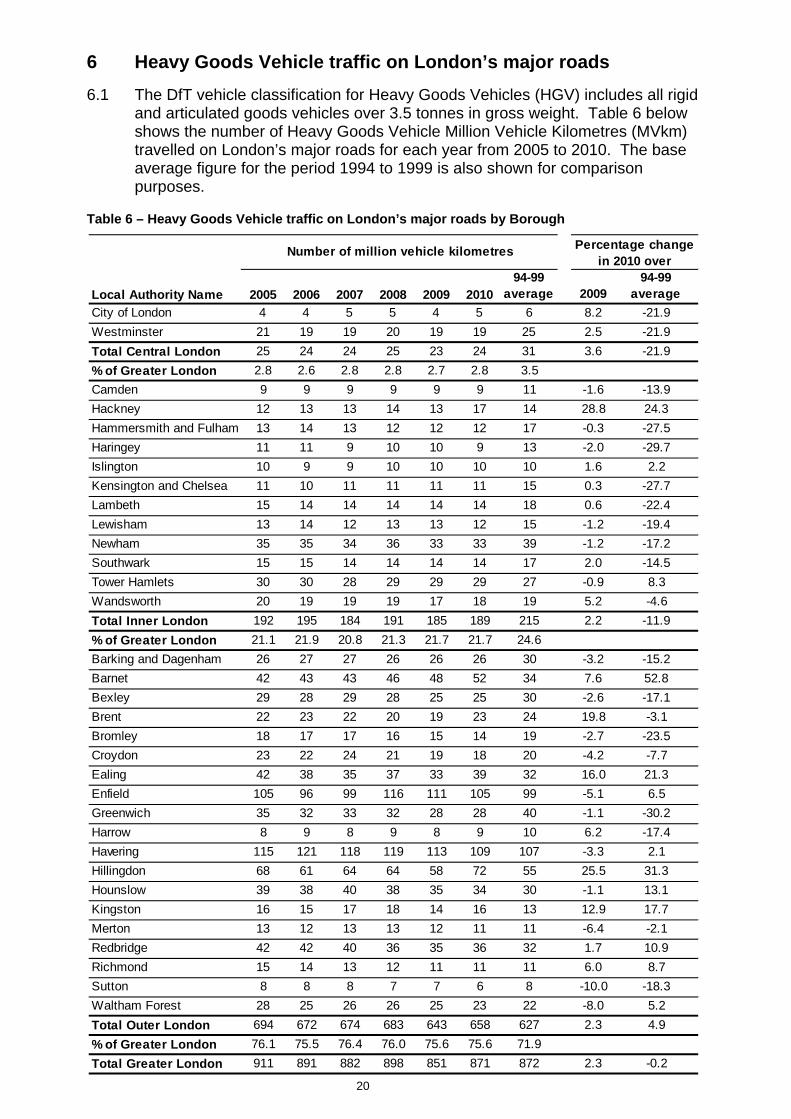
6 Heavy Goods Vehicle traffic on London’s major roads
6.1 The DfT vehicle classification for Heavy Goods Vehicles (HGV) includes all rigid and articulated goods vehicles over 3.5 tonnes in gross weight. Table 6 below shows the number of Heavy Goods Vehicle Million Vehicle Kilometres (MVkm) travelled on London’s major roads for each year from 2005 to 2010. The base average figure for the period 1994 to 1999 is also shown for comparison purposes.
Table 6 – Heavy Goods Vehicle traffic on London’s major roads by Borough
Local Authority Name 2005 2006 2007 2008 2009 201094-99
average 200994-99
averageCity of London 4 4 5 5 4 5 6 8.2 -21.9Westminster 21 19 19 20 19 19 25 2.5 -21.9Total Central London 25 24 24 25 23 24 31 3.6 -21.9% of Greater London 2.8 2.6 2.8 2.8 2.7 2.8 3.5Camden 9 9 9 9 9 9 11 -1.6 -13.9Hackney 12 13 13 14 13 17 14 28.8 24.3Hammersmith and Fulham 13 14 13 12 12 12 17 -0.3 -27.5Haringey 11 11 9 10 10 9 13 -2.0 -29.7Islington 10 9 9 10 10 10 10 1.6 2.2Kensington and Chelsea 11 10 11 11 11 11 15 0.3 -27.7Lambeth 15 14 14 14 14 14 18 0.6 -22.4Lewisham 13 14 12 13 13 12 15 -1.2 -19.4Newham 35 35 34 36 33 33 39 -1.2 -17.2Southwark 15 15 14 14 14 14 17 2.0 -14.5Tower Hamlets 30 30 28 29 29 29 27 -0.9 8.3Wandsworth 20 19 19 19 17 18 19 5.2 -4.6Total Inner London 192 195 184 191 185 189 215 2.2 -11.9% of Greater London 21.1 21.9 20.8 21.3 21.7 21.7 24.6Barking and Dagenham 26 27 27 26 26 26 30 -3.2 -15.2Barnet 42 43 43 46 48 52 34 7.6 52.8Bexley 29 28 29 28 25 25 30 -2.6 -17.1Brent 22 23 22 20 19 23 24 19.8 -3.1Bromley 18 17 17 16 15 14 19 -2.7 -23.5Croydon 23 22 24 21 19 18 20 -4.2 -7.7Ealing 42 38 35 37 33 39 32 16.0 21.3Enfield 105 96 99 116 111 105 99 -5.1 6.5Greenwich 35 32 33 32 28 28 40 -1.1 -30.2Harrow 8 9 8 9 8 9 10 6.2 -17.4Havering 115 121 118 119 113 109 107 -3.3 2.1Hillingdon 68 61 64 64 58 72 55 25.5 31.3Hounslow 39 38 40 38 35 34 30 -1.1 13.1Kingston 16 15 17 18 14 16 13 12.9 17.7Merton 13 12 13 13 12 11 11 -6.4 -2.1Redbridge 42 42 40 36 35 36 32 1.7 10.9Richmond 15 14 13 12 11 11 11 6.0 8.7Sutton 8 8 8 7 7 6 8 -10.0 -18.3Waltham Forest 28 25 26 26 25 23 22 -8.0 5.2Total Outer London 694 672 674 683 643 658 627 2.3 4.9% of Greater London 76.1 75.5 76.4 76.0 75.6 75.6 71.9Total Greater London 911 891 882 898 851 871 872 2.3 -0.2
Number of million vehicle kilometres Percentage change in 2010 over

Transport for London Surface Transport Traffic Analysis Centre
TAC Traffic Note 1 – Traffic levels on major roads in Greater London 1993-2010
21
6.2 Figure 13 below shows that the overall trend in HGV traffic within Greater London has remained relatively constant. Both Central and Inner London HGV traffic peaked in 1998 and have generally decreased since, with only slight increases in recent years. In Outer London, the trend has been relatively constant since 1998 with small fluctuations. It is worth noting that HGV traffic makes up a smaller proportion of total traffic and therefore percentage changes are based on relatively small absolute numbers.
6.3 The majority of Outer London boroughs to the North and West have shown
increases in HGV traffic. In particular Barnet, Ealing, Hillingdon, Hounslow, Kingston and Redbridge have all recorded increases of 10% or more in 2010 compared to the 1994-99 base average (Table 6). Those Outer London boroughs which have shown particularly significant decreases are Bromley and Greenwich, with reductions of more than 20%.
6.4 With the exceptions of Hackney, Islington and Tower Hamlets, all the Inner
London boroughs have seen reductions in HGV traffic in 2010 compared to the 1994-99 base average, leading to an overall reduction for the Inner area of 12% (Table 6).
Figure 13 – Heavy Goods Vehicle traffic on major roads in London, 1993 to 2010
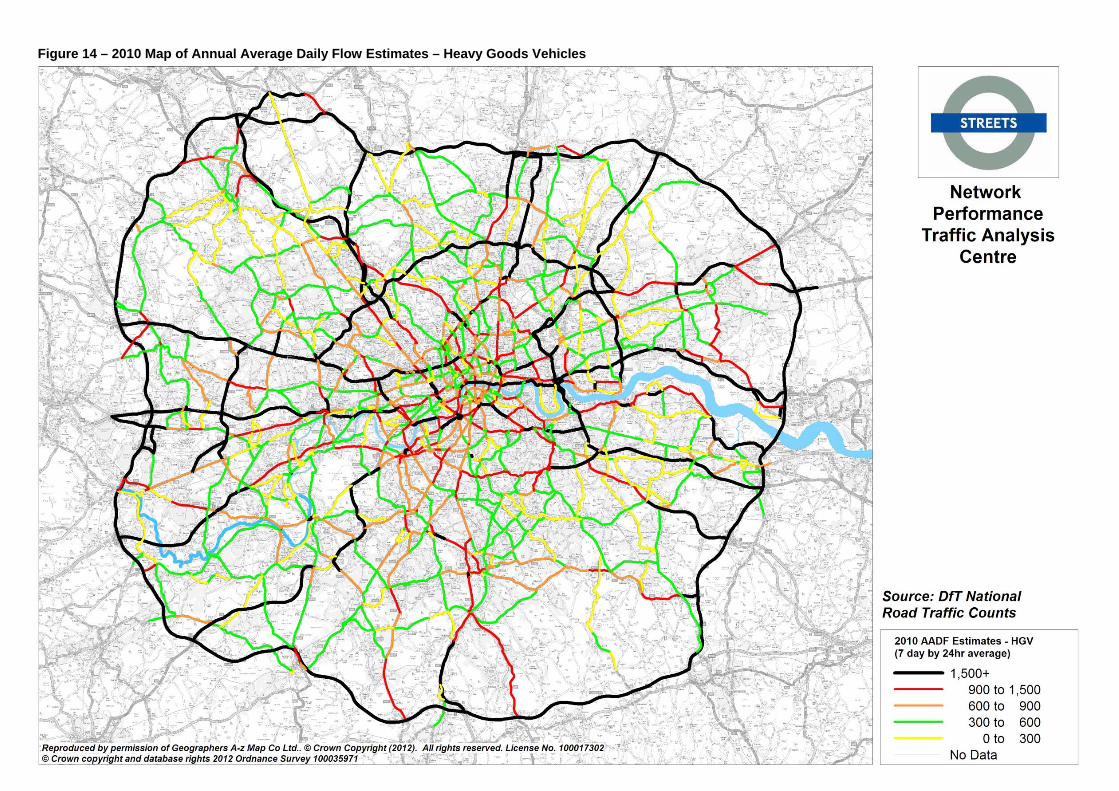
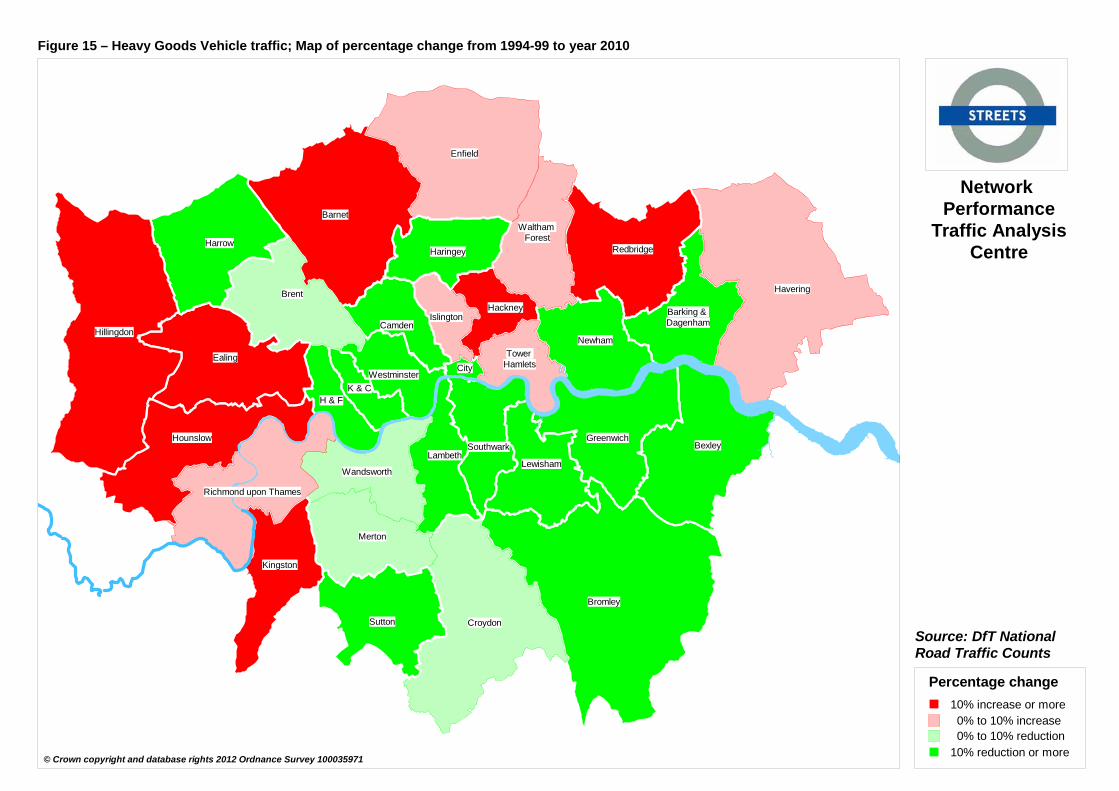
6.5 The thematic maps on the next two pages show the distribution of HGV traffic on
major roads for the Greater London area (out to and including the M25) (Figure 14) and the percentage change in 2010 by borough compared to the 1994-99 base average (Figure 15). Figure 14 clearly shows the busy HGV routes which can be identified as the main radials including the M1, M11, M3, M4, A13, A2, and A3, plus the orbital A406 North Circular. Figure 15 shows HGV growth in a number of Outer London boroughs, especially to the West (possibly due to Heathrow Airport).
22
Figure 14 – 2010 Map of Annual Average Daily Flow Estimates – Heavy Goods Vehicles
23
Hounslow
Tower Hamlets
Waltham Forest
Hackney
Kingston
Barking & Dagenham
City
H & FK & C
Hounslow
Tower Hamlets
Waltham Forest
Hackney
Kingston
Barking & Dagenham
City
H & FK & C
Barnet
Bexley
Brent
Bromley
Camden
Croydon
Ealing
Enfield
Greenwich
HaringeyHarrow
Havering
HillingdonIslington
LambethLewisham
Merton
Newham
Redbridge
Richmond upon Thames
Southwark
Sutton
Wandsworth
Westminster
Percentage change10% increase or more0% to 10% increase0% to 10% reduction
10% reduction or more
Network Performance
Traffic AnalysisCentre
Source: DfT NationalRoad Traffic Counts
© Crown copyright and database rights 2012 Ordnance Survey 100035971
Figure 15 – Heavy Goods Vehicle traffic; Map of percentage change from 1994-99 to year 2010
24
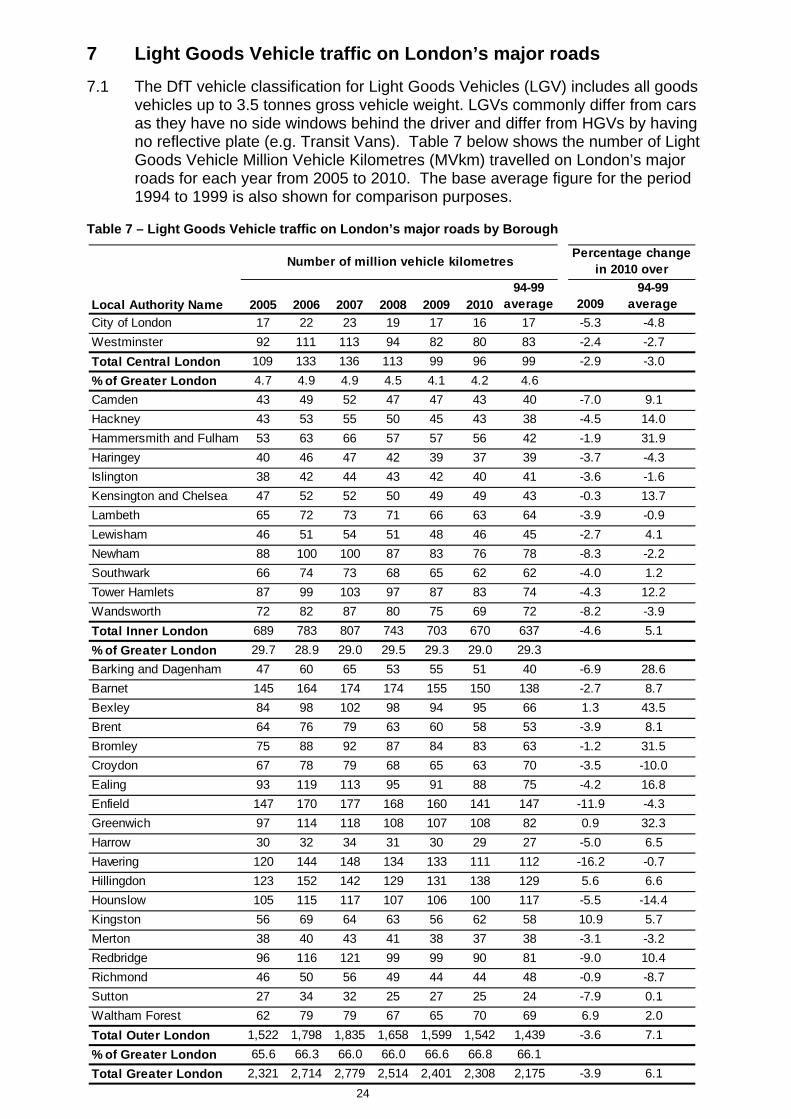
7 Light Goods Vehicle traffic on London’s major roads
7.1 The DfT vehicle classification for Light Goods Vehicles (LGV) includes all goods vehicles up to 3.5 tonnes gross vehicle weight. LGVs commonly differ from cars as they have no side windows behind the driver and differ from HGVs by having no reflective plate (e.g. Transit Vans). Table 7 below shows the number of Light Goods Vehicle Million Vehicle Kilometres (MVkm) travelled on London’s major roads for each year from 2005 to 2010. The base average figure for the period 1994 to 1999 is also shown for comparison purposes.
Table 7 – Light Goods Vehicle traffic on London’s major roads by Borough
Local Authority Name 2005 2006 2007 2008 2009 201094-99
average 200994-99
averageCity of London 17 22 23 19 17 16 17 -5.3 -4.8Westminster 92 111 113 94 82 80 83 -2.4 -2.7Total Central London 109 133 136 113 99 96 99 -2.9 -3.0% of Greater London 4.7 4.9 4.9 4.5 4.1 4.2 4.6Camden 43 49 52 47 47 43 40 -7.0 9.1Hackney 43 53 55 50 45 43 38 -4.5 14.0Hammersmith and Fulham 53 63 66 57 57 56 42 -1.9 31.9Haringey 40 46 47 42 39 37 39 -3.7 -4.3Islington 38 42 44 43 42 40 41 -3.6 -1.6Kensington and Chelsea 47 52 52 50 49 49 43 -0.3 13.7Lambeth 65 72 73 71 66 63 64 -3.9 -0.9Lewisham 46 51 54 51 48 46 45 -2.7 4.1Newham 88 100 100 87 83 76 78 -8.3 -2.2Southwark 66 74 73 68 65 62 62 -4.0 1.2Tower Hamlets 87 99 103 97 87 83 74 -4.3 12.2Wandsworth 72 82 87 80 75 69 72 -8.2 -3.9Total Inner London 689 783 807 743 703 670 637 -4.6 5.1% of Greater London 29.7 28.9 29.0 29.5 29.3 29.0 29.3Barking and Dagenham 47 60 65 53 55 51 40 -6.9 28.6Barnet 145 164 174 174 155 150 138 -2.7 8.7Bexley 84 98 102 98 94 95 66 1.3 43.5Brent 64 76 79 63 60 58 53 -3.9 8.1Bromley 75 88 92 87 84 83 63 -1.2 31.5Croydon 67 78 79 68 65 63 70 -3.5 -10.0Ealing 93 119 113 95 91 88 75 -4.2 16.8Enfield 147 170 177 168 160 141 147 -11.9 -4.3Greenwich 97 114 118 108 107 108 82 0.9 32.3Harrow 30 32 34 31 30 29 27 -5.0 6.5Havering 120 144 148 134 133 111 112 -16.2 -0.7Hillingdon 123 152 142 129 131 138 129 5.6 6.6Hounslow 105 115 117 107 106 100 117 -5.5 -14.4Kingston 56 69 64 63 56 62 58 10.9 5.7Merton 38 40 43 41 38 37 38 -3.1 -3.2Redbridge 96 116 121 99 99 90 81 -9.0 10.4Richmond 46 50 56 49 44 44 48 -0.9 -8.7Sutton 27 34 32 25 27 25 24 -7.9 0.1Waltham Forest 62 79 79 67 65 70 69 6.9 2.0Total Outer London 1,522 1,798 1,835 1,658 1,599 1,542 1,439 -3.6 7.1% of Greater London 65.6 66.3 66.0 66.0 66.6 66.8 66.1Total Greater London 2,321 2,714 2,779 2,514 2,401 2,308 2,175 -3.9 6.1
Number of million vehicle kilometresPercentage change
in 2010 over
Transport for London Surface Transport Traffic Analysis Centre
TAC Traffic Note 1 – Traffic levels on major roads in Greater London 1993-2010
25
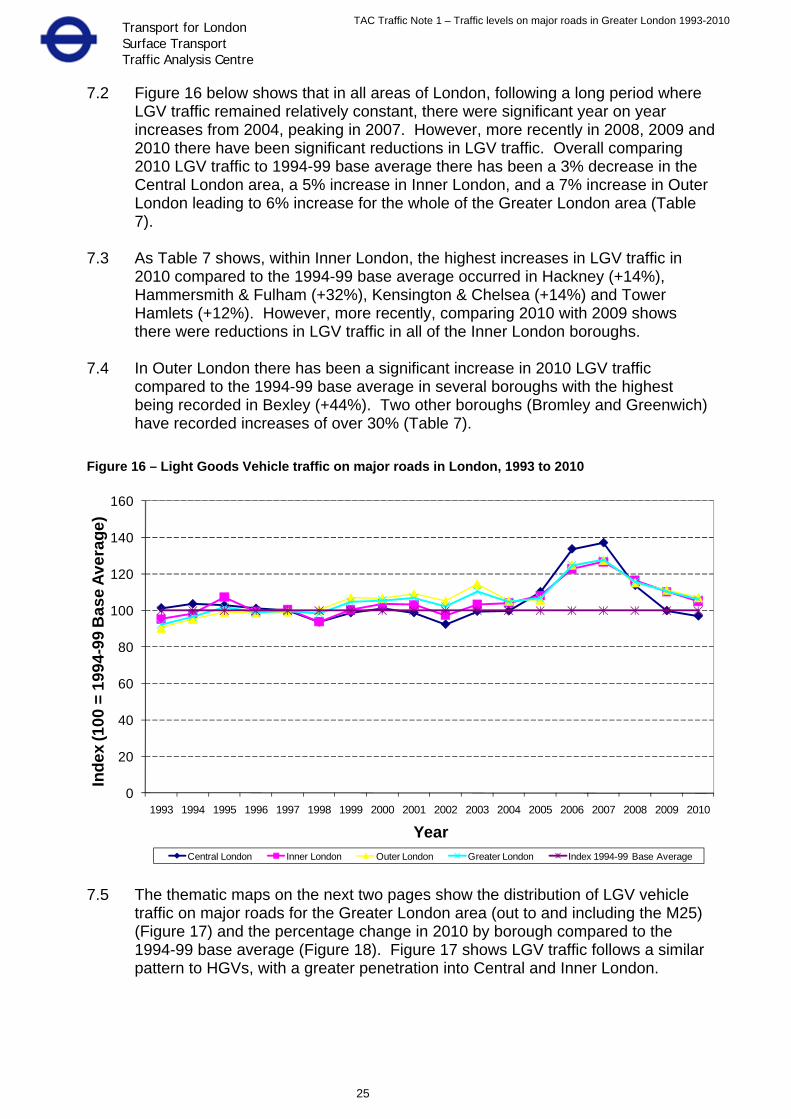
7.2 Figure 16 below shows that in all areas of London, following a long period where LGV traffic remained relatively constant, there were significant year on year increases from 2004, peaking in 2007. However, more recently in 2008, 2009 and 2010 there have been significant reductions in LGV traffic. Overall comparing 2010 LGV traffic to 1994-99 base average there has been a 3% decrease in the Central London area, a 5% increase in Inner London, and a 7% increase in Outer London leading to 6% increase for the whole of the Greater London area (Table 7).
7.3 As Table 7 shows, within Inner London, the highest increases in LGV traffic in
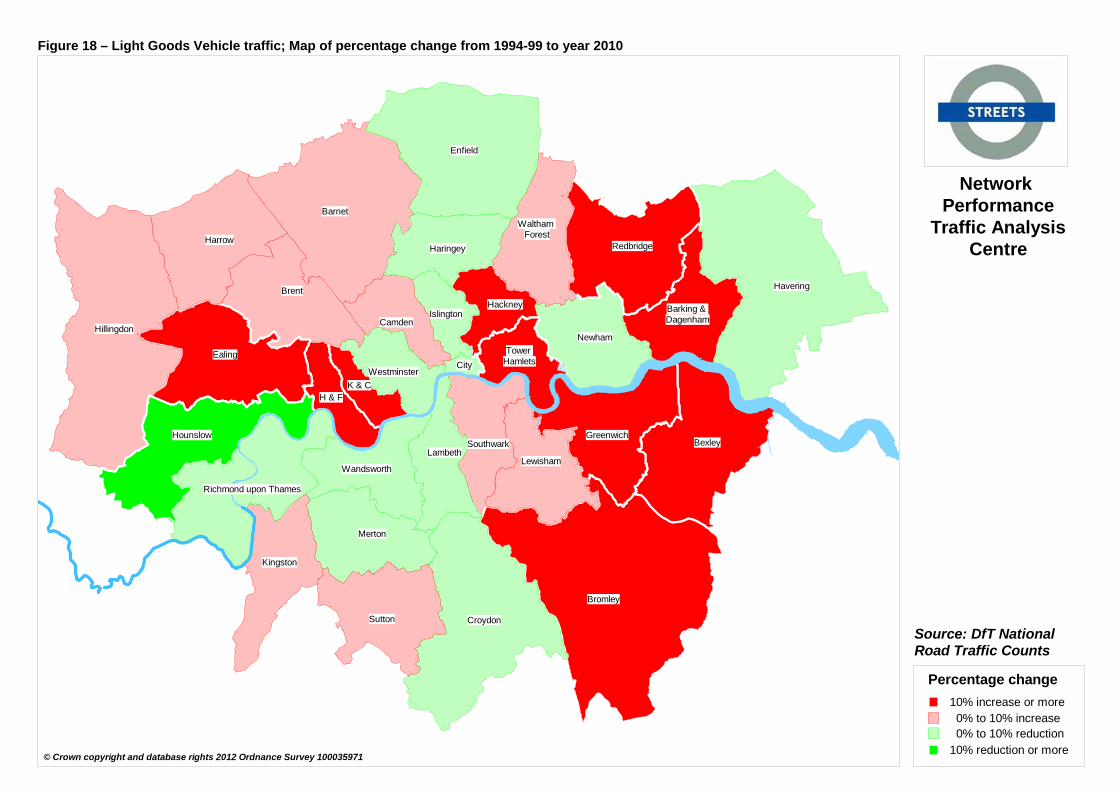
2010 compared to the 1994-99 base average occurred in Hackney (+14%), Hammersmith & Fulham (+32%), Kensington & Chelsea (+14%) and Tower Hamlets (+12%). However, more recently, comparing 2010 with 2009 shows there were reductions in LGV traffic in all of the Inner London boroughs.
7.4 In Outer London there has been a significant increase in 2010 LGV traffic
compared to the 1994-99 base average in several boroughs with the highest being recorded in Bexley (+44%). Two other boroughs (Bromley and Greenwich) have recorded increases of over 30% (Table 7).
Figure 16 – Light Goods Vehicle traffic on major roads in London, 1993 to 2010
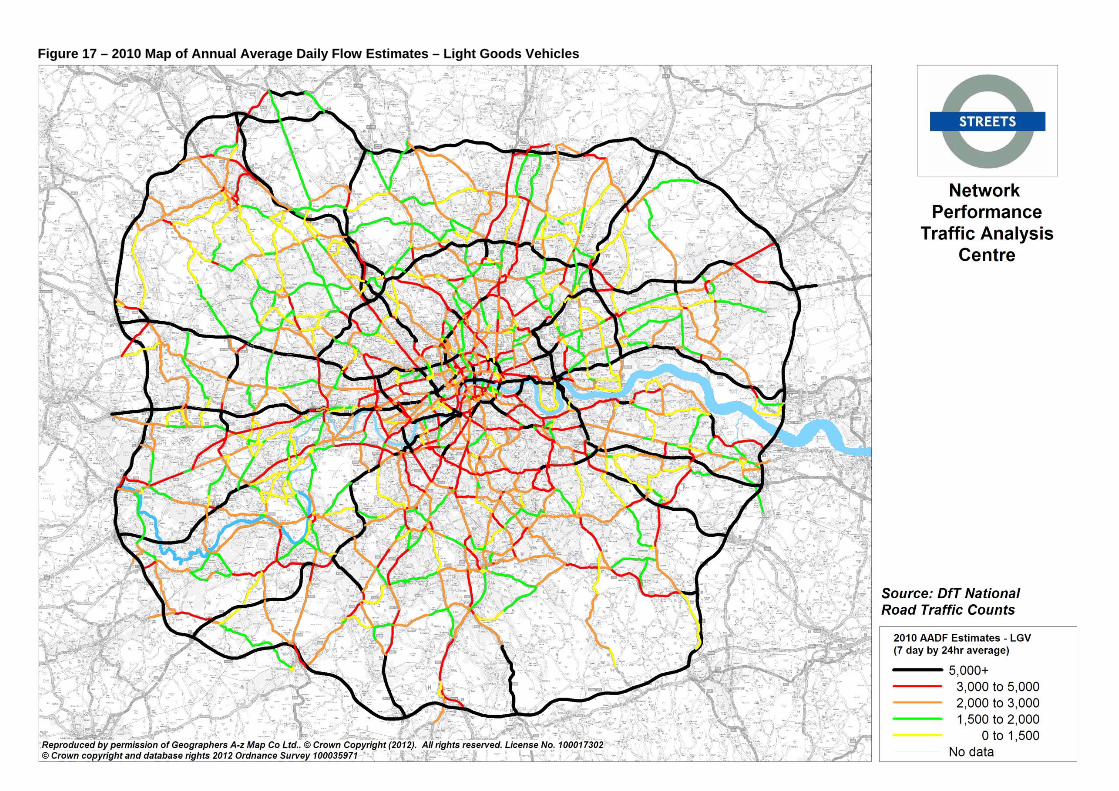
7.5 The thematic maps on the next two pages show the distribution of LGV vehicle
traffic on major roads for the Greater London area (out to and including the M25) (Figure 17) and the percentage change in 2010 by borough compared to the 1994-99 base average (Figure 18). Figure 17 shows LGV traffic follows a similar pattern to HGVs, with a greater penetration into Central and Inner London.
0
20
40
60
80
100
120
140
160
1993 1994 1995 1996 1997 1998 1999 2000 2001 2002 2003 2004 2005 2006 2007 2008 2009 2010
Inde
x (1
00 =
199
4-99
Bas
e Av
erag
e)
YearCentral London Inner London Outer London Greater London Index 1994-99 Base Average
26
Figure 17 – 2010 Map of Annual Average Daily Flow Estimates – Light Goods Vehicles
27
Hounslow
Tower Hamlets
Waltham Forest
Hackney
Kingston
Barking & Dagenham
City
H & FK & C
Hounslow
Tower Hamlets
Waltham Forest
Hackney
Kingston
Barking & Dagenham
City
H & FK & C
Barnet
Bexley
Brent
Bromley
Camden
Croydon
Ealing
Enfield
Greenwich
HaringeyHarrow
Havering
HillingdonIslington
LambethLewisham
Merton
Newham
Redbridge
Richmond upon Thames
Southwark
Sutton
Wandsworth
Westminster
Percentage change10% increase or more0% to 10% increase0% to 10% reduction
10% reduction or more
Network Performance
Traffic AnalysisCentre
Source: DfT NationalRoad Traffic Counts
© Crown copyright and database rights 2012 Ordnance Survey 100035971
Figure 18 – Light Goods Vehicle traffic; Map of percentage change from 1994-99 to year 2010
28
8 Powered Two Wheeler Vehicle traffic on London’s major roads
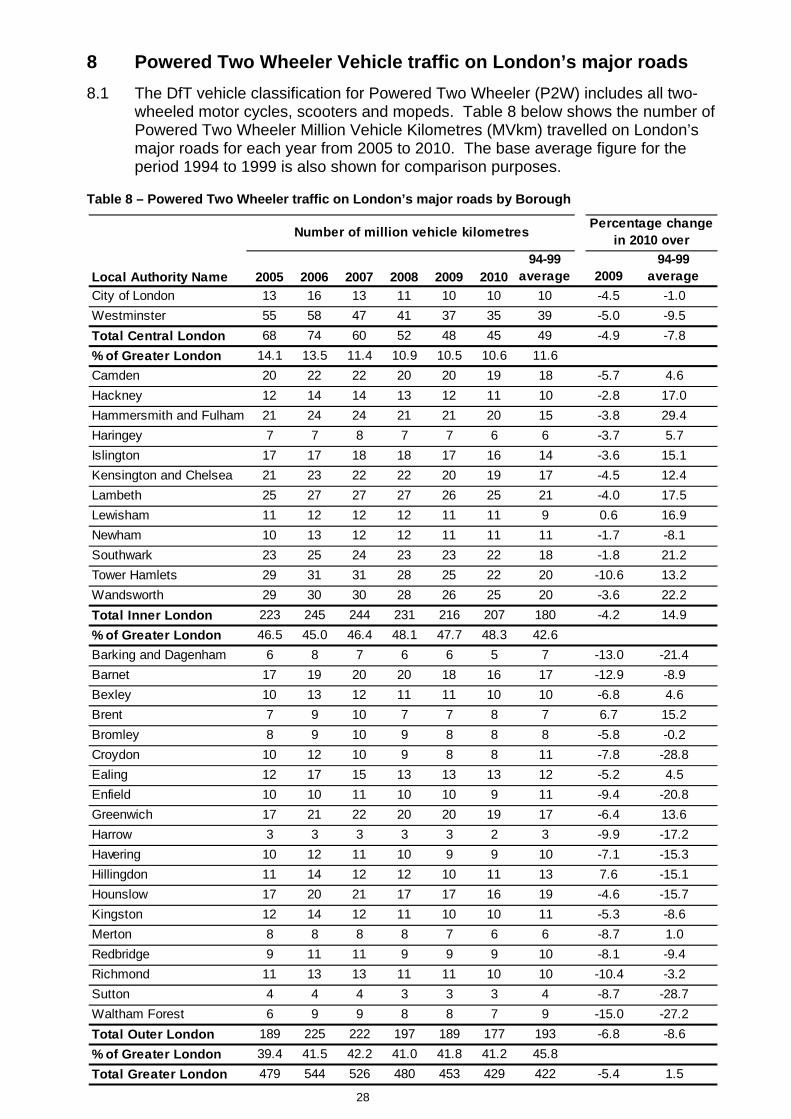
8.1 The DfT vehicle classification for Powered Two Wheeler (P2W) includes all two-wheeled motor cycles, scooters and mopeds. Table 8 below shows the number of Powered Two Wheeler Million Vehicle Kilometres (MVkm) travelled on London’s major roads for each year from 2005 to 2010. The base average figure for the period 1994 to 1999 is also shown for comparison purposes.
Table 8 – Powered Two Wheeler traffic on London’s major roads by Borough
Local Authority Name 2005 2006 2007 2008 2009 201094-99
average 200994-99
averageCity of London 13 16 13 11 10 10 10 -4.5 -1.0Westminster 55 58 47 41 37 35 39 -5.0 -9.5Total Central London 68 74 60 52 48 45 49 -4.9 -7.8% of Greater London 14.1 13.5 11.4 10.9 10.5 10.6 11.6Camden 20 22 22 20 20 19 18 -5.7 4.6Hackney 12 14 14 13 12 11 10 -2.8 17.0Hammersmith and Fulham 21 24 24 21 21 20 15 -3.8 29.4Haringey 7 7 8 7 7 6 6 -3.7 5.7Islington 17 17 18 18 17 16 14 -3.6 15.1Kensington and Chelsea 21 23 22 22 20 19 17 -4.5 12.4Lambeth 25 27 27 27 26 25 21 -4.0 17.5Lewisham 11 12 12 12 11 11 9 0.6 16.9Newham 10 13 12 12 11 11 11 -1.7 -8.1Southwark 23 25 24 23 23 22 18 -1.8 21.2Tower Hamlets 29 31 31 28 25 22 20 -10.6 13.2Wandsworth 29 30 30 28 26 25 20 -3.6 22.2Total Inner London 223 245 244 231 216 207 180 -4.2 14.9% of Greater London 46.5 45.0 46.4 48.1 47.7 48.3 42.6Barking and Dagenham 6 8 7 6 6 5 7 -13.0 -21.4Barnet 17 19 20 20 18 16 17 -12.9 -8.9Bexley 10 13 12 11 11 10 10 -6.8 4.6Brent 7 9 10 7 7 8 7 6.7 15.2Bromley 8 9 10 9 8 8 8 -5.8 -0.2Croydon 10 12 10 9 8 8 11 -7.8 -28.8Ealing 12 17 15 13 13 13 12 -5.2 4.5Enfield 10 10 11 10 10 9 11 -9.4 -20.8Greenwich 17 21 22 20 20 19 17 -6.4 13.6Harrow 3 3 3 3 3 2 3 -9.9 -17.2Havering 10 12 11 10 9 9 10 -7.1 -15.3Hillingdon 11 14 12 12 10 11 13 7.6 -15.1Hounslow 17 20 21 17 17 16 19 -4.6 -15.7Kingston 12 14 12 11 10 10 11 -5.3 -8.6Merton 8 8 8 8 7 6 6 -8.7 1.0Redbridge 9 11 11 9 9 9 10 -8.1 -9.4Richmond 11 13 13 11 11 10 10 -10.4 -3.2Sutton 4 4 4 3 3 3 4 -8.7 -28.7Waltham Forest 6 9 9 8 8 7 9 -15.0 -27.2Total Outer London 189 225 222 197 189 177 193 -6.8 -8.6% of Greater London 39.4 41.5 42.2 41.0 41.8 41.2 45.8Total Greater London 479 544 526 480 453 429 422 -5.4 1.5
Number of million vehicle kilometres Percentage change in 2010 over
Transport for London Surface Transport Traffic Analysis Centre
TAC Traffic Note 1 – Traffic levels on major roads in Greater London 1993-2010
29
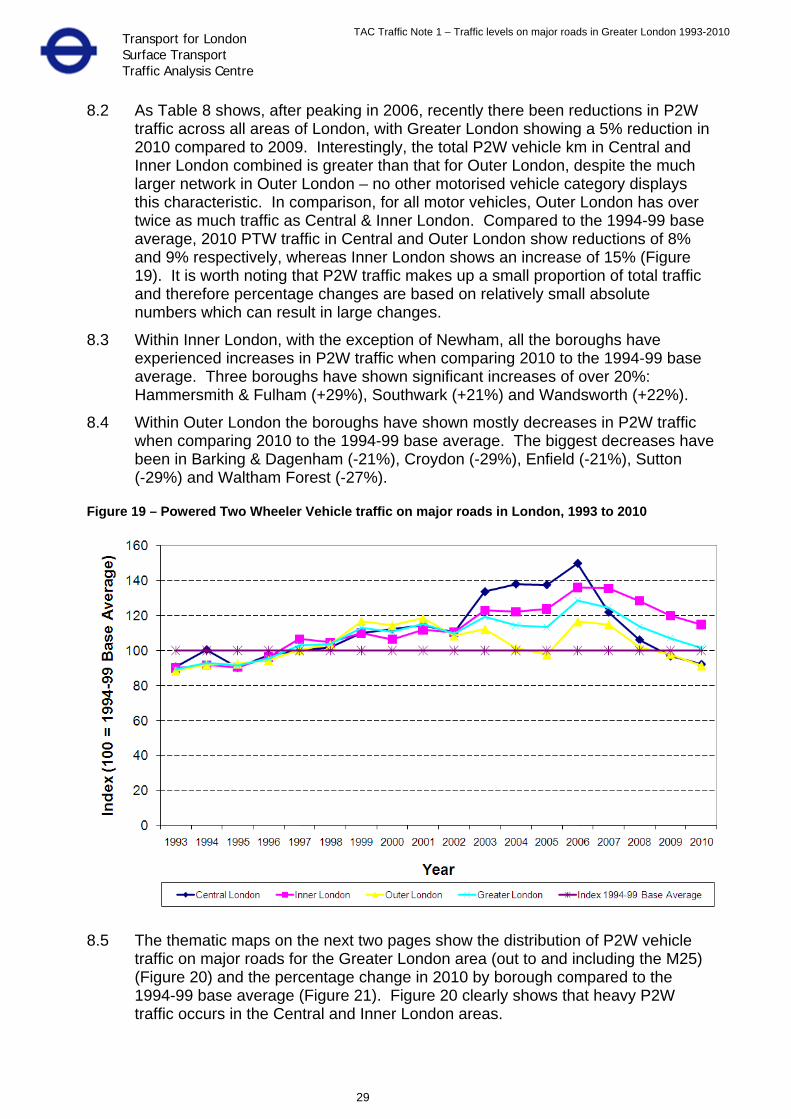
8.2 As Table 8 shows, after peaking in 2006, recently there been reductions in P2W traffic across all areas of London, with Greater London showing a 5% reduction in 2010 compared to 2009. Interestingly, the total P2W vehicle km in Central and Inner London combined is greater than that for Outer London, despite the much larger network in Outer London – no other motorised vehicle category displays this characteristic. In comparison, for all motor vehicles, Outer London has over twice as much traffic as Central & Inner London. Compared to the 1994-99 base average, 2010 PTW traffic in Central and Outer London show reductions of 8% and 9% respectively, whereas Inner London shows an increase of 15% (Figure 19). It is worth noting that P2W traffic makes up a small proportion of total traffic and therefore percentage changes are based on relatively small absolute numbers which can result in large changes.
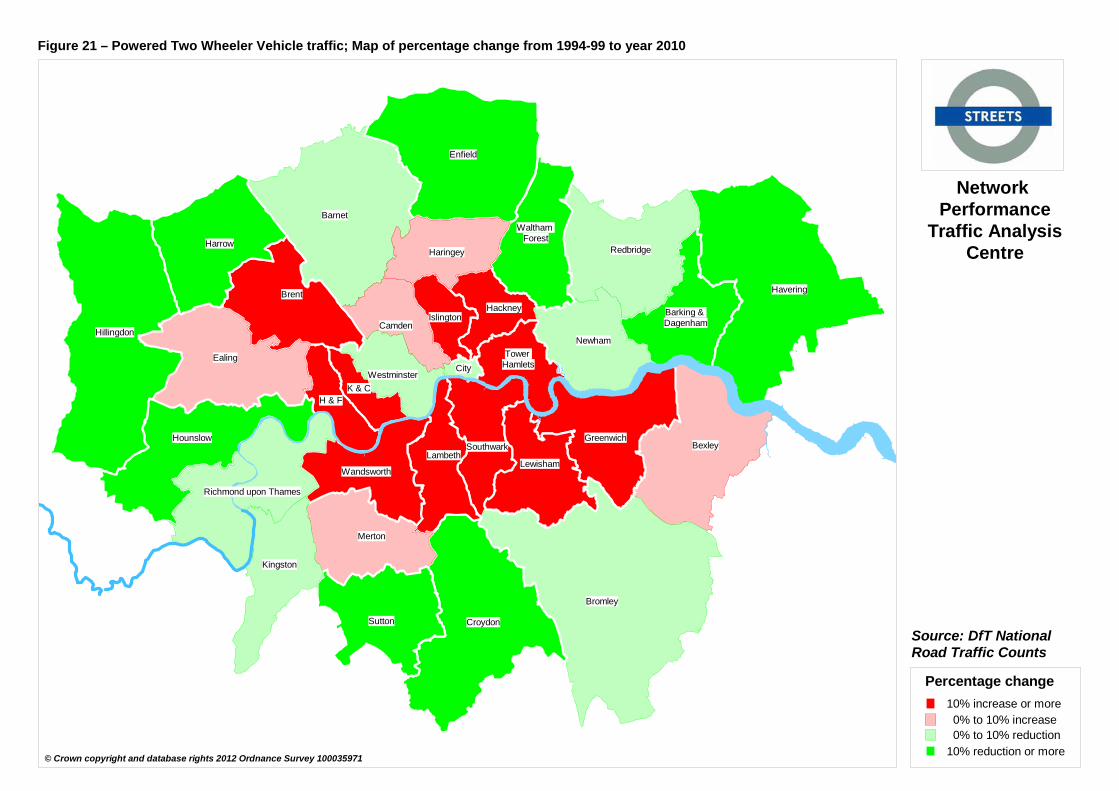
8.3 Within Inner London, with the exception of Newham, all the boroughs have experienced increases in P2W traffic when comparing 2010 to the 1994-99 base average. Three boroughs have shown significant increases of over 20%: Hammersmith & Fulham (+29%), Southwark (+21%) and Wandsworth (+22%).
8.4 Within Outer London the boroughs have shown mostly decreases in P2W traffic when comparing 2010 to the 1994-99 base average. The biggest decreases have been in Barking & Dagenham (-21%), Croydon (-29%), Enfield (-21%), Sutton (-29%) and Waltham Forest (-27%).
Figure 19 – Powered Two Wheeler Vehicle traffic on major roads in London, 1993 to 2010
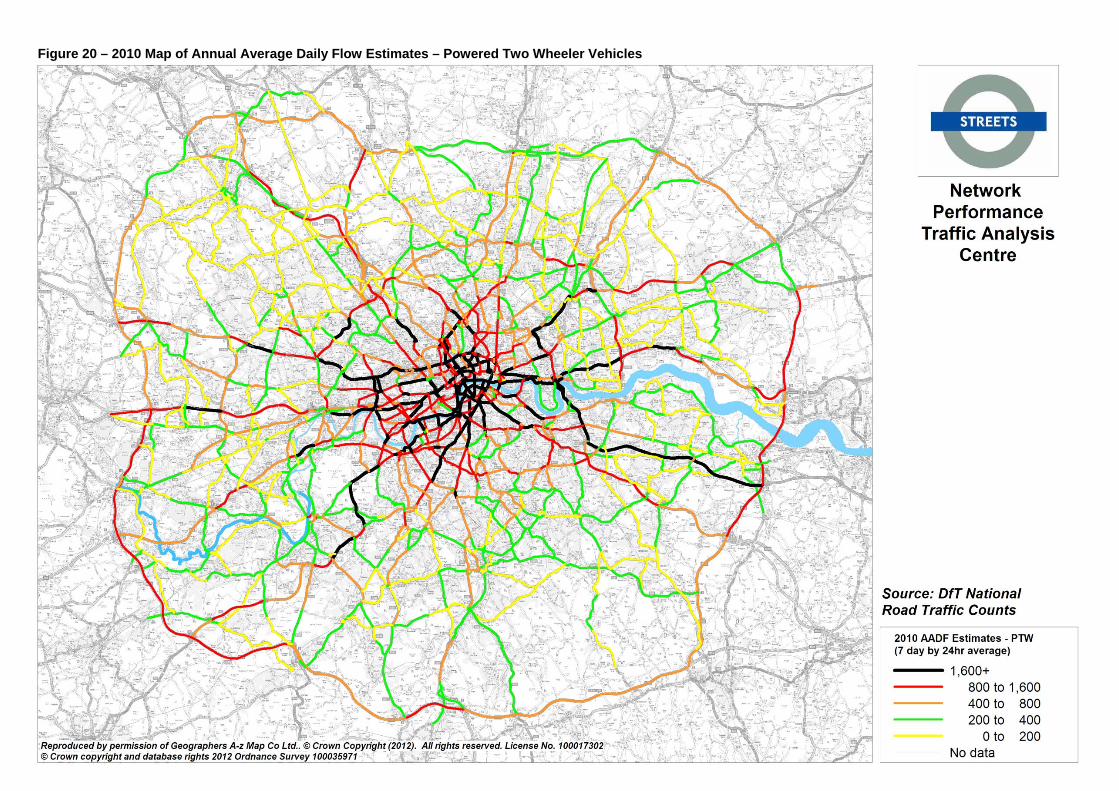
8.5 The thematic maps on the next two pages show the distribution of P2W vehicle
traffic on major roads for the Greater London area (out to and including the M25) (Figure 20) and the percentage change in 2010 by borough compared to the 1994-99 base average (Figure 21). Figure 20 clearly shows that heavy P2W traffic occurs in the Central and Inner London areas.
30
Figure 20 – 2010 Map of Annual Average Daily Flow Estimates – Powered Two Wheeler Vehicles
31
Hounslow
Tower Hamlets
Waltham Forest
Hackney
Kingston
Barking & Dagenham
City
H & FK & C
Hounslow
Tower Hamlets
Waltham Forest
Hackney
Kingston
Barking & Dagenham
City
H & FK & C
Barnet
Bexley
Brent
Bromley
Camden
Croydon
Ealing
Enfield
Greenwich
HaringeyHarrow
Havering
HillingdonIslington
LambethLewisham
Merton
Newham
Redbridge
Richmond upon Thames
Southwark
Sutton
Wandsworth
Westminster
Percentage change10% increase or more0% to 10% increase0% to 10% reduction
10% reduction or more
Network Performance
Traffic AnalysisCentre
Source: DfT NationalRoad Traffic Counts
© Crown copyright and database rights 2012 Ordnance Survey 100035971
Figure 21 – Powered Two Wheeler Vehicle traffic; Map of percentage change from 1994-99 to year 2010
Transport for London Surface Transport Traffic Analysis Centre
TAC Traffic Note 1 – Traffic levels on major roads in Greater London 1993-2010
32
9 All motor vehicle traffic on the Transport for London Road Network
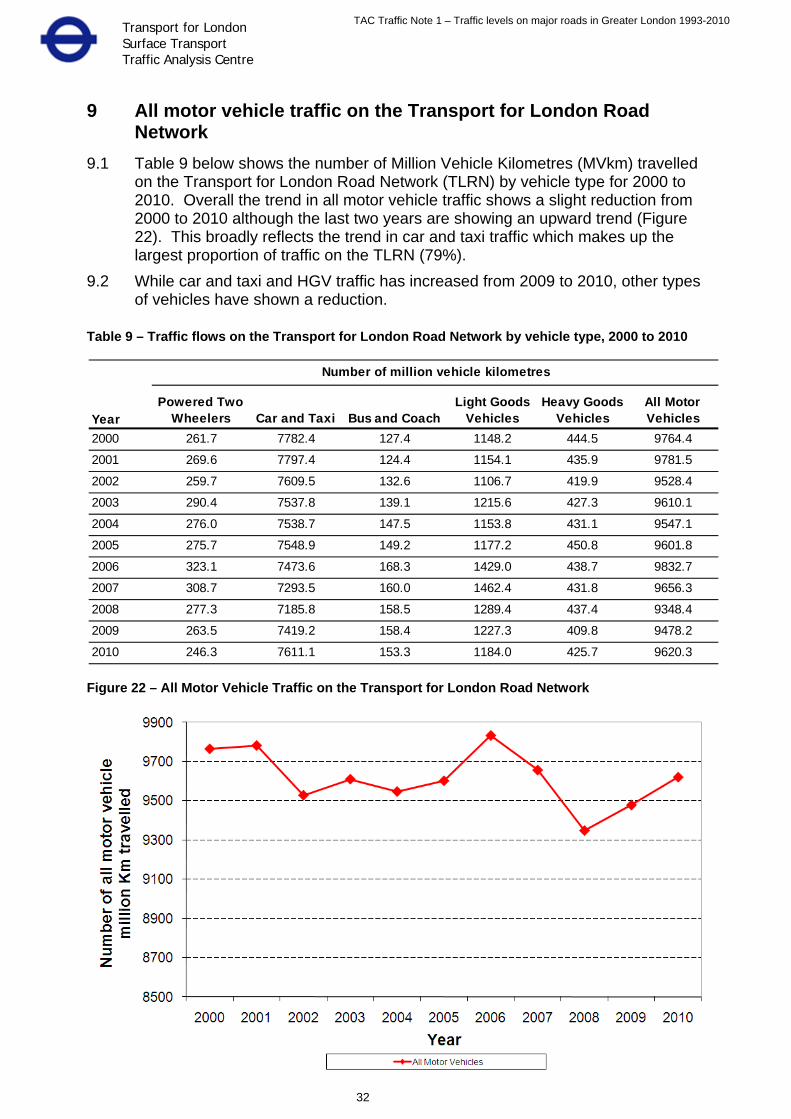
9.1 Table 9 below shows the number of Million Vehicle Kilometres (MVkm) travelled on the Transport for London Road Network (TLRN) by vehicle type for 2000 to 2010. Overall the trend in all motor vehicle traffic shows a slight reduction from 2000 to 2010 although the last two years are showing an upward trend (Figure 22). This broadly reflects the trend in car and taxi traffic which makes up the largest proportion of traffic on the TLRN (79%).
9.2 While car and taxi and HGV traffic has increased from 2009 to 2010, other types of vehicles have shown a reduction.
Table 9 – Traffic flows on the Transport for London Road Network by vehicle type, 2000 to 2010
Figure 22 – All Motor Vehicle Traffic on the Transport for London Road Network
YearPowered Two
Wheelers Car and Taxi Bus and CoachLight Goods
VehiclesHeavy Goods
VehiclesAll Motor Vehicles
2000 261.7 7782.4 127.4 1148.2 444.5 9764.4
2001 269.6 7797.4 124.4 1154.1 435.9 9781.5
2002 259.7 7609.5 132.6 1106.7 419.9 9528.4
2003 290.4 7537.8 139.1 1215.6 427.3 9610.1
2004 276.0 7538.7 147.5 1153.8 431.1 9547.1
2005 275.7 7548.9 149.2 1177.2 450.8 9601.8
2006 323.1 7473.6 168.3 1429.0 438.7 9832.7
2007 308.7 7293.5 160.0 1462.4 431.8 9656.3
2008 277.3 7185.8 158.5 1289.4 437.4 9348.4
2009 263.5 7419.2 158.4 1227.3 409.8 9478.2
2010 246.3 7611.1 153.3 1184.0 425.7 9620.3
Number of million vehicle kilometres
Transport for London Surface Transport Traffic Analysis Centre
TAC Traffic Note 1 – Traffic levels on major roads in Greater London 1993-2010
33
10 Traffic flows for individual sites 10.1 Traffic information for individual count sites on major roads is available from
Traffic Analysis Centre– contact [email protected]. Maps can be provided for specific areas showing the locations of the count sites on request. These will also include locations where there is other traffic count data including Automatic Traffic Counts sites and Cordon/Screenline count sites.
10.2 For each site Annual Average Daily Flow estimates (combined direction) are
produced every year and are broken down by vehicle type but not direction. The raw 12 hour manual classified weekday counts, carried out on a 1, 2, 4 or 8 year frequency depending on the variability and level of traffic at the site, are for 7am to 7pm and are available by direction, hour and vehicle type. DfT convert the raw 12-hour count into an Annual Average Daily Flow estimate (AADF) by using expansion factors derived from data collected at automatic traffic counters (ATC) scattered across London. The AADF is a 7 day/24 hour combined direction estimate. In the years when a link is not counted, a current AADF is calculated by applying growth factors to the previous year's AADF. These factors also use data from the ATCs.
10.3 Annual Average Daily Flow Estimates for individual sites can now also be
obtained online at: http://www.dft.gov.uk/traffic-counts/. Sites can be located using an interactive map portal system or through a search menu system.
11 Contacts for further information 11.1 If you require further information on this traffic note or have any other related
queries please contact:
Traffic Data [email protected]
Transport for London Surface Transport Traffic Analysis Centre
TAC Traffic Note 1 – Traffic levels on major roads in Greater London 1993-2010
34
12 Library of traffic notes Other traffic notes include: Traffic Notes DfT NRTCC Counts
• Traffic Note 1 – Traffic levels on major roads in Greater London 1993-2010 (Update with 2011 flows due in Autumn 2012)
TfL Automatic Traffic Counts
• Traffic Note 2 – Expansion factors for road traffic counts in London • Technical Note 4 - Validation of radar traffic monitoring equipment
(published as an internal working document) • Technical Note 6 - Validation of automatic traffic & cycle counters 2006
(published as an internal working document)
TfL Cordon and Screenline Counts • Traffic Note 3 – TfL Cordon and Screenlines 1975 to 2011. (Update
with 2012 flows due in Spring 2013). • Traffic Note 5 – Major and Minor traffic flows measured through TfL
Cordon surveys
ITIS/TrafficMaster GPS journey time data • ITIS – Validation Paper July 2005 • Technical Note 1 – ITIS Speed Survey Data • Technical Note 2 – Traffic Delays in London on Weekdays, Saturdays
and Sundays • Traffic Note 4 – Total vehicle delay for London 2008-09 (2010-11
update due in Summer 2012) • Traffic Note 6 – Traffic delays in the London Boroughs 2009-10
(published on LondonStreetWorks website and GIS SharePoint website)
Cycling
• Traffic Note 7 - Weather conditions and the levels of cycling on the TLRN
• Traffic Note 8 – Proportion of cyclists violating red lights • Traffic Note 9 – Cycling trends in London • Traffic Note 10 – TfL Pedestrian and Cycle Thames Screenline Surveys
2006-2007 • Traffic Note 11 – Cycling journey time reliability • Traffic Note 12 - Expansion factors for cycle counts in London (planned
for 2012)
Pedestrians • Traffic Note 13 - Expansion factors for pedestrian counts in London
(planned for 2012)
Transport for London Surface Transport Traffic Analysis Centre
TAC Traffic Note 1 – Traffic levels on major roads in Greater London 1993-2010
35
13 Other useful documents • Travel in London 4 –
http://www.tfl.gov.uk/assets/downloads/corporate/travel-in-london-report-4.pdf
• Transport Statistics for Great Britain 2011 – http://www.dft.gov.uk/statistics/releases/transport-statistics-great-britain-2011/
• For more detailed information on how national road traffic estimates are made by the DfT please refer to their website: http://assets.dft.gov.uk/statistics/releases/traffic-estimates-2010/traffic-estimates-2010-methodology.pdf
• Link to DfT website for individual site AADF Estimates - http://www.dft.gov.uk/traffic-counts/
14 References • All data published in this summary note is derived from Department for
Transport National Road Traffic Census Counts (NRTCC).