tracking, students' effort, and academic achievement
TRANSCRIPT
http://soe.sagepub.com/Sociology of Education
http://soe.sagepub.com/content/78/1/27The online version of this article can be found at:
DOI: 10.1177/003804070507800102
2005 78: 27Sociology of EducationWilliam Carbonaro
Tracking, Students' Effort, and Academic Achievement
Published by:
http://www.sagepublications.com
On behalf of:
American Sociological Association
can be found at:Sociology of EducationAdditional services and information for
http://soe.sagepub.com/cgi/alertsEmail Alerts:
http://soe.sagepub.com/subscriptionsSubscriptions:
http://www.sagepub.com/journalsReprints.navReprints:
http://www.sagepub.com/journalsPermissions.navPermissions:
http://soe.sagepub.com/content/78/1/27.refs.htmlCitations:
What is This?
- Jan 1, 2005Version of Record >>
at Otterbein University on September 30, 2014soe.sagepub.comDownloaded from at Otterbein University on September 30, 2014soe.sagepub.comDownloaded from
Sociology of Education 2005, Vol. 78 (January): 27–49 27
Tracking, Students’ Effort, andAcademic Achievement
William CarbonaroUniversity of Notre Dame
This study examined the links among students’ effort, tracking, and students’ achievement. It
found that students in higher tracks exert substantially more effort than do students in lower
tracks. These differences in effort are largely explained by differences in prior effort and
achievement, as well as students’ experiences in their classes. Students’ effort is strongly relat-
ed to students’ learning, and track differences in students’ effort account for a modest portion
of track differences in students’ learning. Finally, the effect of students’ effort on students’
learning is roughly the same, regardless of the track in which a student is placed.
Sociologists of education have focusedheavily on how structural factors—thesystemic organizational and institutional
characteristics of schools—shape academicoutcomes. Curricular tracking is perhaps themost prominent structural aspect of schoolsthat researchers have studied. Research hasstrongly suggested that students in higher“tracks” and ability groups tend to learnmore than do comparable students in lowertracks and ability groups (Barr and Dreeben1983; Gamoran 1986, 1987; Gamoran andMare 1989; Hoffer 1992).1 Much researchhas focused on differences in learning oppor-tunities across ability groups and tracks as apossible explanation (see, e.g., Gamoran1986; Pallas et al. 1994). Typically, higher-ability groups and higher-track classes arecharacterized by higher-quality instruction(Gamoran and Carbonaro 2002–03; Oakes1985; Page 1991), more time spent oninstruction (Barr and Dreeben 1983; Oakes1985), and greater curricular coverage (Barrand Dreeben 1983; Brophy and Good 1986;Rowan and Miracle 1983). Since each ofthese aspects of students’ learning opportuni-ties is related to students’ learning (Wang1998), it is not surprising that students inhigher-ability groups and tracks enjoy greater
gains in learning than do those in lower-abil-ity groups and tracks.
Although learning opportunities are cer-tainly important in determining how muchstudents learn in school, other factors thatinfluence learning have received less atten-tion. Sociologists of education have focusedheavily on the importance of social structurebut have been less attentive to the impor-tance of human agency in shaping students’outcomes. For example, curricular tracking isa social structure that differentially providesopportunities and imposes constraints uponwhat students have the potential to learn. Amassive array of studies have described cur-ricular tracking as a practice and have exam-ined its effects. In contrast, a much smallernumber of studies have focused on humanagency—whether a student chooses toengage himself or herself in the learningprocess—even though it also plays a criticalrole in explaining why some students learnmore than do others.2 Sørensen and Hallinan(1977) argued that differences in achieve-ment among students can be explained bythree factors: learning opportunities, effort,and ability. By focusing on learning opportu-nities and effort, they highlighted the impor-tance of both social structure and humanagency in explaining differences in learning.
at Otterbein University on September 30, 2014soe.sagepub.comDownloaded from
28 Carbonaro
Despite Sørensen and Hallinan’s importantconceptual contribution, few studies havesuccessfully accounted for the role that bothstructure and agency play in determining stu-dents’ outcomes. The main goal of this studyis to examine how curricular tracking andeffort are related to gain a better understand-ing of how structure and agency shape stu-dents’ outcomes. In so doing, I hope to ren-der a more complete understanding of howunequal outcomes emerge from structuralfactors within the school that are imposed onstudents and choices that students make onbeing placed in such structures.
BACKGROUND
What Is Students’ Effort?
Before I discuss how effort is related to out-comes and curricular tracking, it is necessaryto devise a working definition of effort. Effortis the amount of time and energy that stu-dents expend in meeting the formal academ-ic requirements established by their teacherand/or school. It is goal specific, and differentstudents may exert the same level of effort inmeeting some goals but different levels ofeffort in meeting others. Often these goalsare hierarchical, and some require little morethan tacit compliance, while others demandgreater commitments of time and/orthought.
It is possible to distinguish among threedifferent types of effort: rule oriented, proce-dural, and intellectual. Rule-oriented effortentails students’ compliance with the mostbasic rules and norms required by the school,such as showing up for class regularly andrefraining from misbehavior. Two studentswho attend class regularly are exerting thesame level of rule-oriented effort. Proceduraleffort requires students to try to meet the spe-cific demands set forth by a teacher in a par-ticular class, including completing requiredassignments, turning in assignments on time,and participating in class discussions.Procedural effort places higher demands onstudents than does rule-oriented effort: Twostudents who attend class regularly are equalin terms of rule-oriented effort, but one stu-
dent may exert more procedural effort byturning in homework assignments more con-sistently than the other student. Finally, stu-dents exert intellectual effort when they applytheir cognitive facilities toward understandingthe intellectual challenges posed by the cur-riculum. Two students exert the same amountof procedural effort if they both submit thesame number of homework assignments, butif Student A devotes more time and thoughtto answering all the questions in the assign-ment correctly while Student B is simply con-cerned with handing in the assignment(regardless of quality), Student A expendsmore intellectual effort than does Student B.As these examples illustrate, effort is a multi-dimensional concept, and a good indicator ofeffort should include measures of a broadrange of tasks and expectations.
This definition of effort can be contrastedwith three concepts that are often associatedwith it. First, Willis (1977) popularized theconcept of resistance in his study of working-class youths in England. Resistance clearlyconnotes students’ withdrawal of effort.However, this concept is limited because itfails to differentiate among the different levelsof effort exerted by students who have notrejected the school culture.
Second, psychologists focus heavily onmotivation and self-efficacy (see, e.g., Bongand Clark 1999). Motivation and self-efficacyare clearly related to effort because theyexplain why some students exert more effortthan do others. However, neither is equiva-lent to effort because two students may exertthe same level of effort and have differentmotives and/or levels of self-efficacy.
Finally, it is important to emphasize howthe concept of effort differs from that ofengagement. Engagement has been definedand operationalized in numerous ways by dif-ferent researchers. Typically, researchers haveargued that effort, as represented by behav-iors like attending class and time spent onhomework, is a key component of engage-ment (see Johnson, Crosnoe, and Elder 2001;Smerdon 1999). However, some researchershave also argued that engagement includesan affective or psychological component thatfocuses on students’ enthusiasm about, inter-est in, and attachment to their school and/or
at Otterbein University on September 30, 2014soe.sagepub.comDownloaded from
Tracking, Effort, and Achievement 29
the schooling process (see, e.g., Newmann1992). I argue that effort can be studied apartfrom this affective component and that it isbeneficial to do so because effort can affectoutcomes, regardless of whether students areenthusiastic about, interested in, and/orattached to their school.
Students’ Effort and Learning
Numerous studies have found that students’effort is related to academic achievement.Studies of “engagement” have typically reliedheavily on measures of effort, such as thecompletion of homework, attentiveness, andpreparedness. Generally, the findings of suchstudies have indicated that students who aremore engaged learn more in school (Johnsonet al. 2001; Marks 2000; Smerdon 1999; Yair2000). Farkas et al. (1990) found that stu-dents’ “work habits,” as measured by teach-ers’ reports of homework, class participation,effort, and organization, were positively relat-ed to students’ mastery of courses and gradepoint averages (GPAs). Rosenbaum (2001)also found that students’ “preparedness” andabsenteeism was related to their GPAs. Timespent on homework by students is a com-monly used measure of effort (see, e.g.,Natriello and McDill 1986), and numerousstudies have indicated that it is related tohigher achievement (Alexander and Cook1982; Carbonaro and Gamoran 2002;Natriello and McDill 1986; but see Bryk, Lee,and Holland 1993 for an exception). In short,although the labels and measures used havevaried across studies, effort has been found tobe positively related to achievement.
Although research on students’ effort hasyielded interesting insights, researchers havepaid little attention to the possible connec-tion between effort and curricular tracking.This omission is surprising, given the sheervolume of research on curricular tracking.Most studies of tracking have focused on theimportance of learning opportunities inexplaining differences in learning across abili-ty groups and tracks, and only a few haveexamined the links between either abilitygrouping or curricular tracking and effort(Eder 1981; Felmlee and Eder 1983; Natrielloand McDill 1986). Hence, an examination of
the relationships between effort and curricu-lar tracking will render a more completeaccount of how curricular tracking affectsacademic outcomes.
RESEARCH AGENDA
The analyses presented here focus on fourmain questions regarding effort and curricu-lar tracking: (1) Does effort vary across tracks?(2) What explains variation in effort acrosstracks? (3) Does variation in effort explain dif-ferences in learning across tracks? and (4)Does effort have the same effect on learningacross tracks, or does effort matter more forlearning in some tracks than in others? Eachresearch question links effort, curricular differ-entiation, and learning in ways that willenhance researchers’ understanding ofinequality in students’ outcomes.
First, does effort vary across curriculartracks? Although numerous studies have doc-umented differences in learning opportunitiesacross tracks (Gamoran and Carbonaro2002–03; Oakes 1985, 1990; Page 1991),only a handful of studies have examinedwhether effort varies across tracks. Eder(1981) and Felmlee and Eder (1983) foundthat first graders in lower-ability groups wereless attentive than their peers in higher-abilitygroups. If “attentiveness” is considered ameasure of effort, this research suggestedthat ability grouping is related to effort.Natriello and McDill (1986) found that stu-dents in the college track spent more time ontheir homework than did students who werenot in the college track. While Natriello andMcDill used “time spent on homework” as aproxy for effort, this measure is flawedbecause other research on tracking has indi-cated that teachers assign more homework tostudents who are enrolled in higher-trackclasses (Oakes 1985). Thus, it is not clearwhether higher-track students are actuallyexerting more effort or whether they are sim-ply responding to the greater demands thattheir teachers place on them. Finally,Smerdon (1999) found that engagement, asmeasured by attendance, preparedness, andtime spent on homework, was positively relat-ed to track placement. Smerdon’s measures
at Otterbein University on September 30, 2014soe.sagepub.comDownloaded from
30 Carbonaro
of track were reported by students and werenot subject specific. Some scholars haveraised questions regarding the appropriate-ness and quality of such measures (e.g., Lucas1999; Lucas and Gamoran 2002). Clearly,additional research, using nationally repre-sentative data with better measures of effortand track, is needed to determine the extentto which students’ track placements are relat-ed to the amount of effort they exert in theirclasses.
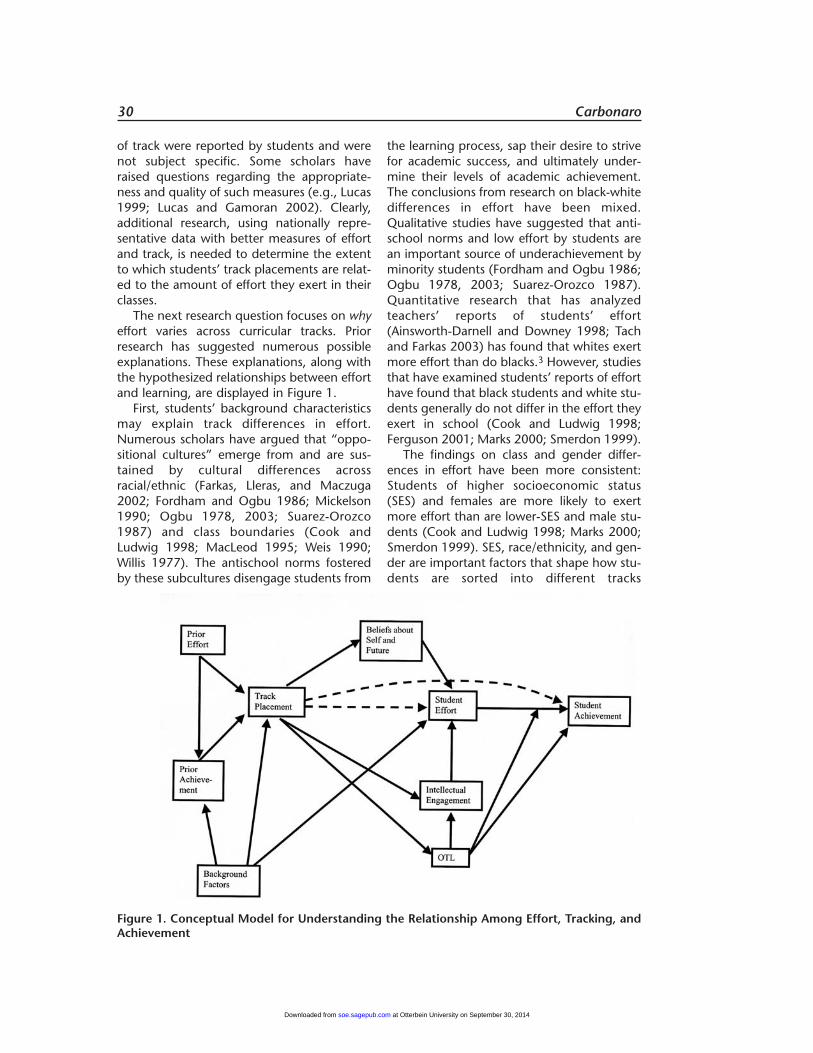
The next research question focuses on whyeffort varies across curricular tracks. Priorresearch has suggested numerous possibleexplanations. These explanations, along withthe hypothesized relationships between effortand learning, are displayed in Figure 1.
First, students’ background characteristicsmay explain track differences in effort.Numerous scholars have argued that “oppo-sitional cultures” emerge from and are sus-tained by cultural differences acrossracial/ethnic (Farkas, Lleras, and Maczuga2002; Fordham and Ogbu 1986; Mickelson1990; Ogbu 1978, 2003; Suarez-Orozco1987) and class boundaries (Cook andLudwig 1998; MacLeod 1995; Weis 1990;Willis 1977). The antischool norms fosteredby these subcultures disengage students from
the learning process, sap their desire to strivefor academic success, and ultimately under-mine their levels of academic achievement.The conclusions from research on black-whitedifferences in effort have been mixed.Qualitative studies have suggested that anti-school norms and low effort by students arean important source of underachievement byminority students (Fordham and Ogbu 1986;Ogbu 1978, 2003; Suarez-Orozco 1987).Quantitative research that has analyzedteachers’ reports of students’ effort(Ainsworth-Darnell and Downey 1998; Tachand Farkas 2003) has found that whites exertmore effort than do blacks.3 However, studiesthat have examined students’ reports of efforthave found that black students and white stu-dents generally do not differ in the effort theyexert in school (Cook and Ludwig 1998;Ferguson 2001; Marks 2000; Smerdon 1999).
The findings on class and gender differ-ences in effort have been more consistent:Students of higher socioeconomic status(SES) and females are more likely to exertmore effort than are lower-SES and male stu-dents (Cook and Ludwig 1998; Marks 2000;Smerdon 1999). SES, race/ethnicity, and gen-der are important factors that shape how stu-dents are sorted into different tracks
Figure 1. Conceptual Model for Understanding the Relationship Among Effort, Tracking, andAchievement
at Otterbein University on September 30, 2014soe.sagepub.comDownloaded from
Tracking, Effort, and Achievement 31
(Gamoran and Mare 1989; Jones, Vanfossen,and Ensminger 1995). The overrepresenta-tion of racial/ethnic minority, lower-SES, andmale students in lower-track classes may part-ly explain track differences in students’ effort.
Second, it is possible that prior effort is animportant criterion that is used to sort stu-dents into curricular tracks. Students whoexert more effort in the 8th grade may bemore likely to be placed in higher tracks inthe 10th grade and, consequently, may bepredisposed to exert greater effort in the 10thgrade. Alternatively, it is well established thatacademic achievement is one of the strongestpredictors of track placement (Gamoran andMare 1989; Hallinan 1992; Jones et al. 1995;Lucas 1999). If effort is related to academicachievement and students are largely sortedinto tracks on the basis of their prior achieve-ment, it is possible that differences in effortacross tracks may simply reflect this sortingprocess of high-achieving and effort-exertingstudents into higher-track classes.
Third, it is possible that higher-track stu-dents have beliefs about themselves and theirfuture that lead them to exert more effort intheir classes. Higher-track students may feelmore efficacious because of teachers’ differ-ent expectations across tracks (see, e.g.,Oakes 1985). If students internalize suchexpectations, students in different tracks mayhold different beliefs about their own chancesof academic success. Students who believethey can succeed and expect to succeed inschool will try harder because they anticipatethat there will be a distinct “payoff” to theirefforts. In contrast, students who do notbelieve that academic success is likely or evenpossible are unlikely to try hard in schoolbecause they view such efforts as a waste oftime. While I argue that beliefs evoke effort, itshould be noted that effort may alter stu-dents’ beliefs in response to teachers’ praiseand/or higher grades.
Finally, track placement may be related tothe cognitive demands of and stimulationfrom the curriculum, which may ultimatelyshape how much effort students exert in agiven class. Oakes (1985) found that high-track students had greater opportunities forcritical thinking and were typically givenmore challenging material to study. Students
will exert more effort when there is a greateracademic challenge and when they findmeaning in the daily tasks that are required ofthem. Marks (2000) found that “authenticinstructional work,” a loosely related conceptthat focuses on whether instruction taps intostudents’ interests and requires that they “digdeeply” in their studies, was positively relatedto engagement. Yair (2000) also found thatstudents displayed greater engagement whenthey are exposed to instruction that is charac-terized by greater relevance, challenge, andacademic demand. If higher-track classes pro-vide material and require tasks that are moreintellectually stimulating, it is possible thatstudents in higher-track classes may respondwith greater effort.
It is important to note that dashed arrowspoint from track placement to effort andachievement in Figure 1. These dashedarrows are meant to denote that these rela-tionships are estimated in the analyses, butthe expectation is that these paths should beinsignificant if all the factors in Figure 1 arefully accounted for in the model. In otherwords, the effects of track placement oneffort and achievement should be indirect,working through the four main factorsdescribed earlier. Any residual track differ-ences in effort and achievement after thesefactors are controlled for may be due to poormeasurement of the mediating variables orsome other variable that is unaccounted for inthe conceptual model.
The next two questions focus on howeffort and tracking are related to achievementoutcomes for students. Smerdon (1999)found that engagement and track placementhad independent effects on reading andmath achievement, but she did not examinewhether any of the track-achievement rela-tionship was explained by engagement. Theanalyses presented here examine this issueand reveal whether differences in effort acrosstracks partly explain why students in higher-track classes tend to learn more than do thosein lower-track classes.
Second, I examine whether the relation-ship between effort and achievement variesacross curricular tracks. Since higher-trackclasses typically have higher-quality instruc-tion and more-experienced teachers (Oakes
at Otterbein University on September 30, 2014soe.sagepub.comDownloaded from

32 Carbonaro
1985, 1990), students in these classes mayhave to expend less effort to learn the mater-ial than may students in lower-track classeswho are exposed to low-quality instruction byless-experienced teachers. Lectures that lackclarity and excitement are likely to requirestudents to ask more questions in class, seekhelp outside class, and do more work athome to learn the material. In short, studentsin lower-track classes may need to exert moreeffort to do as well as students in higher-trackclasses.4 Thus, effort may be a critical predic-tor of students’ success in lower-track classesbut may be less important for learning inhigher-track classes. Examining these ques-tions will illuminate how the interplaybetween structure (learning opportunitiesprovided by different track classes) andagency (students’ efforts to learn) shapes aca-demic outcomes for students.
DATA
The analyses reported here used data fromthe 8th– to 10th-grade cohort of the NationalEducation Longitudinal Survey of 1988(NELS:88). This data set is well suited forstudying the relationship between trackingand effort for several reasons. First, the longi-tudinal design of the data makes it possible tocontrol for 8th-grade differences in students’attitudes, behaviors, and achievements,thereby reducing the likelihood that differ-ences in effort and learning simply reflect pre-existing differences prior to the 10th-gradetrack placement. Second, the NELS:88 dataprovide a vast array of student- and teacher-reported indicators that serve as importantcontrols in the models.
Finally, and most important, the NELS:88data provide two teacher reports per studentin the 8th and 10th grades. In both the 8thand 10th grades, two teachers were surveyedper student; one teacher taught either mathor science, and the other taught eitherEnglish or history. Subject-specific reports byteachers have an important advantage overdata that are not subject specific: Both stu-dents’ effort and students’ track placementare allowed to vary across classes. To capital-ize on this important feature of the NELS
data, samples of students in four subjects—math, English, history, and science—werecreated. This design allows students toappear in multiple samples, thereby allowingtheir track status and effort to vary by subject.Consequently, the design of this study issuperior to the designs of other studies oftracking and effort in which measures of trackstatus and effort/engagement were reportedwithout reference to specific academic sub-jects (e.g., Smerdon 1999). The resultsreported in this article focus on math, sincemost of the research in the area of highschool tracking has focused on math achieve-ment (e.g., Gamoran and Mare 1989; Hoffer1992). However, the analyses were per-formed in all four subjects, and the overallfindings were consistent across academic sub-jects (results available on request).
Students’ Effort Variables
The main variables of interest measure stu-dents’ effort. It is important to recognize thatmeasuring effort is problematic in severalrespects. First, it may be difficult for studentsto report accurately the effort they exert inschool for several reasons. One problem isthat “exerting high effort” may mean some-thing different for different students. Somestudents may think they are exerting high lev-els of effort if they do everything the teacherasks; others may consider such effort onlyadequate. Such different definitions of effortdecrease the reliability of self-reported effort.Social desirability bias is another problemwith self-reports of effort. Brint, Contreras,and Matthews (2001) found that elementaryschools transmitted many messages to stu-dents about the value of hard work as part ofthe hidden curriculum. If students internalizesuch messages, it may be difficult for them toadmit that they are not working hard.Alternatively, some evidence has suggestedthat high school students may downplay theireffort in explaining either their academic suc-cess or failure (Bishop 1999).
Teachers serve as an alternative source ofinformation about students’ effort. Just aswith students, there are advantages and dis-advantages to using teachers’ reports ofeffort. On the one hand, teachers are limited
at Otterbein University on September 30, 2014soe.sagepub.comDownloaded from
Tracking, Effort, and Achievement 33
in that they must indirectly assess effort. Forexample, a student may try hard and spend agreat deal of time on a homework assign-ment, but still do a poor job because he orshe does not have the skills or resources need-ed to succeed. A teacher may incorrectlyattribute the student’s poor performance onthe assignment to insufficient effort and thusprovide an unreliable estimate of effort. Onthe other hand, a teacher is not susceptible tosocial desirability bias in reporting students’effort and hence may provide less-biased esti-mates of effort.
Despite their potential limitations, theteachers’ reports of students’ effort in theNELS:88 data are preferable to the students’reports for two reasons. First, the range ofitems on effort reported by the teachers ismore extensive than that reported by the stu-dents. In addition, the teacher measures ofstudents’ effort relied on both subjectiveassessments of students’ effort and students’behaviors that are more tangible, easilyobserved, and reported. Again, when differ-ent types of information about effort areused, the limitations of any given item will beless important. Two separate measures of 8th-and 10th-grade effort were created for theanalyses that follow.
First, the measure of 8th-grade (or “prior”)effort was created from teacher-reporteditems of effort that were collected in the 8thgrade. By controlling for 8th-grade effort, it ispossible to determine whether differences in10th-grade effort across tracks reflect theplacement of students who expended loweffort into lower-track classes, rather than aresponse by students to their placement in agiven track. The seven items used in the“prior effort” scale (displayed in AppendixTable A) cover both subjective assessments ofeffort (e.g., “this student performs below hisor her ability”) and reports of concrete,observable student behaviors (e.g., “The stu-dent is frequently absent”). The various itemsin the scale tap the different types of effortmentioned previously: rule oriented (studentis absent, tardy, and disruptive), procedural(student rarely completes homework), andintellectual (student performs below ability, iswithdrawn, and is inattentive).
Each student had teachers in two subjects
(math or science and history or English) whoreported these items on the basis of their par-ticular perceptions of effort in a given subject.It would have been preferable to matchreports of 8th- and 10th-grade effort by aca-demic subject (i.e., 8th- and 10th-grade effortas reported by a student’s 8th- and 10th-grade math teachers). Unfortunately, it wasnot possible to do so for many studentsbecause their math teachers in the 8th and10th grades were not sampled; instead, thesestudents had a science teacher sampled in the8th grade and a math teacher sampled in the10th grade. To deal with this problem, Iincluded the reports from both 8th-gradeteachers for each student in a single scale,which made it possible to get an average levelof effort exerted across the two classes, whichserves as a proxy for effort in a given subject.The reliability for this scale was high(Cronbach’s alpha = .85).
A 10th-grade measure of effort was creat-ed using three items from the 10th-gradereports from teachers (see Appendix Table A).While the scale includes an item that is a sub-jective report of effort, it also uses two itemsthat are based on students’ behaviors: atten-tiveness and turning in homework.5 Turningin homework is an indicator of proceduraleffort, and attentiveness is a measure of intel-lectual effort. Ideally, separate measures foreach of the three types of effort—rule orient-ed, procedural, and intellectual—could beincluded in the analyses, but the three avail-able measures in NELS are best suited to becombined in a scale, to maximize the reliabil-ity and validity of the effort measure.
These measures are subject specific foreach student, and most students had sepa-rate reports from two of their teachers. Themajor advantage of using subject-specificsamples is that effort is allowed to vary acrossstudents’ classes. Students’ effort may varyacross their classes because of differences ineither intrinsic or extrinsic motivation (e.g.,students preferring or valuing one academicsubject over another). In addition, if (as Iargue later) students’ track placements varyacross subjects and effort is expected to varyacross tracks, then a subject-specific measureof effort is crucial for the analyses.
In her study, Smerdon (1999) used stu-
at Otterbein University on September 30, 2014soe.sagepub.comDownloaded from
34 Carbonaro
dent-reported engagement measures that didnot vary across subjects, arguing that thesegeneral reports of engagement are preferablebecause they provide a more completedescription of students’ engagement over theduration of a school day. However, since stu-dents’ track placements, academic experi-ences, and effort likely vary across classes, theclass-specific reports of effort used in thisstudy should more accurately reflect howeffort is related to the instructional and cur-ricular context of a given class.6
Overall, the 10th-grade effort scales werereliable, with alphas ranging from .83 to .86across academic subjects. It should be notedthat these reliabilities are much higher thanthe .61 alpha reliability reported by Smerdon(1999). Consequently, the analyses presentedhere are an improvement on Smerdon’sbecause they are less susceptible to possibleproblems associated with random measure-ment error in the regression analyses.
It is important to note that the 8th- and10th-grade measures of effort are not identi-cal. First, the wording of the questions andresponse categories are not identical in the8th and 10th grades. The differences in word-ing are similar enough that they are only ofminor concern. The 10th-grade items havethe advantage of five response categories, asopposed to two for the 8th-grade measure,thereby making it likely that the 10th-gradeestimates are somewhat more precise thanthe 8th-grade estimates. Second, the 8th-grade scale has four additional items that arenot included in the 10th-grade measure (seeAppendix Table A). Adding these additionalitems to the 8th-grade effort scale enhancedthe reliability of the scale (.81 versus .85), andthe validity was probably improved as well.The “reduced” 8th-grade measure withoutthe additional items is highly correlated (r =.925) with the measure used in the analyses.Given this high correlation, the regressionresults were virtually identical, regardless ofwhich measure of 8th-grade effort was used.
Track Indicators
There are three sources of information abouta student’s track in NELS:88: students’ self-reports, teachers’ reports, and information
derived from transcript data. Lucas (1999)discussed the strengths and limitations ofeach method of operationalizing students’track placements and concluded thatresearchers may legitimately use any of thethree measures, depending on the particulargoals of a given analysis. I decided to use theteachers’ reports of track for four main rea-sons: (1) Teachers’ reports are subject specificand therefore allow track placement to varyacross subjects, (2) teachers are at least aslikely to identify important distinctionsbetween classes correctly as are researchers inexamining the transcript data, (3) it is unclearwhether viable course-based indicators canbe constructed in subjects other than mathfrom the NELS:88 transcript data, and (4) theresults do not differ when the teachers’reports of track are replaced with track indi-cators that were derived from the transcriptdata.7
NELS:88 provides two subject-specificteachers’ reports of track for each student.Teachers were asked, “Which of the followingbest describes the ‘track’ this class is consid-ered to be?” and were given five responsecategories: honors or advanced, academic,general, vocational-technical-business, andother. Dummy variables to represent the hon-ors/advanced, academic, and vocational-technical-business/other categories were cre-ated for the analyses; the general-track classserved as the reference category. Hence, thecoefficients for the track dummy variablesindicate the average difference in effort andlearning between students in a given trackand students in general-track classes.
Additional Variables
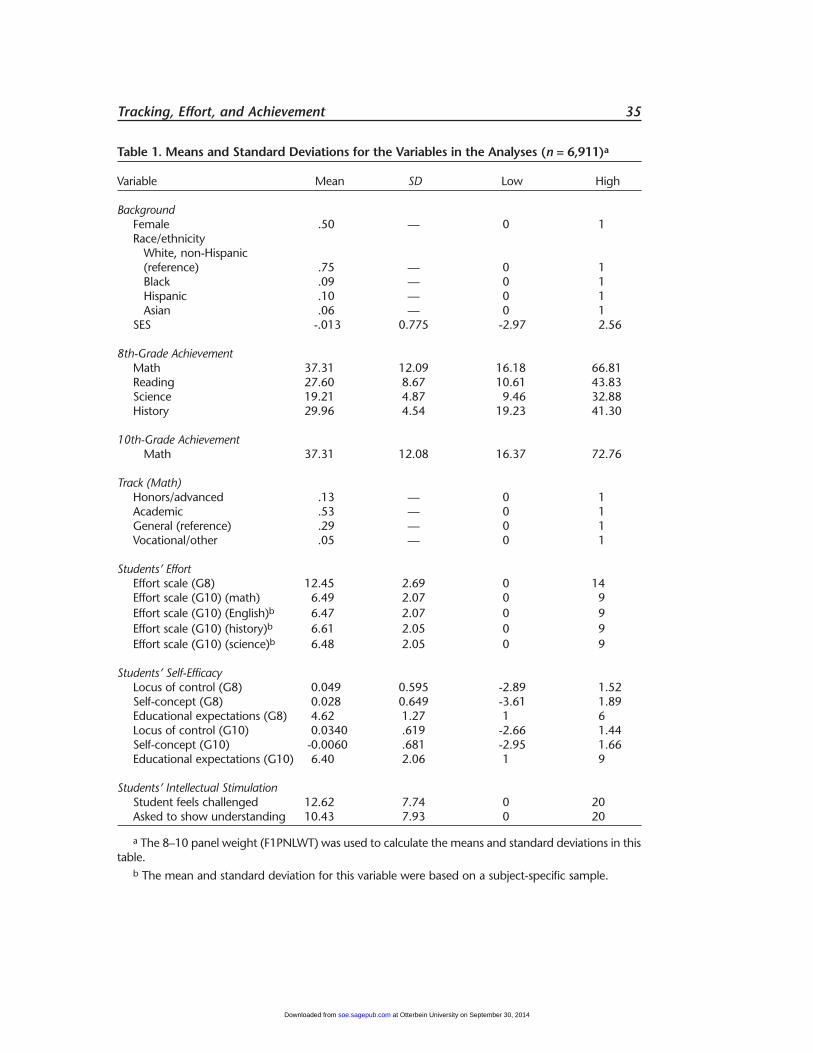
In addition to the measures of effort andtrack, numerous other variables were used inand created for the analyses. Descriptions ofall variables used in the analyses are reportedin Table 1. While the measure of 10th-gradeeffort in math serves as the dependent vari-able in the first set of analyses, 10th-grademath achievement serves as the dependentvariable in the second set. IRT (item-responsetheory) scores were used because they areeasily interpretable (one point equates withone item correct on the examination) and are
at Otterbein University on September 30, 2014soe.sagepub.comDownloaded from
Tracking, Effort, and Achievement 35
Table 1. Means and Standard Deviations for the Variables in the Analyses (n = 6,911)a
Variable Mean SD Low High
BackgroundFemale .50 — 0 1Race/ethnicity
White, non-Hispanic (reference) .75 — 0 1Black .09 — 0 1Hispanic .10 — 0 1Asian .06 — 0 1
SES -.013 0.775 -2.97 2.56
8th-Grade AchievementMath 37.31 12.09 16.18 66.81Reading 27.60 8.67 10.61 43.83Science 19.21 4.87 9.46 32.88History 29.96 4.54 19.23 41.30
10th-Grade AchievementMath 37.31 12.08 16.37 72.76
Track (Math)Honors/advanced .13 — 0 1Academic .53 — 0 1General (reference) .29 — 0 1Vocational/other .05 — 0 1
Students’ EffortEffort scale (G8) 12.45 2.69 0 14Effort scale (G10) (math) 6.49 2.07 0 9Effort scale (G10) (English)b 6.47 2.07 0 9Effort scale (G10) (history)b 6.61 2.05 0 9Effort scale (G10) (science)b 6.48 2.05 0 9
Students’ Self-Efficacy Locus of control (G8) 0.049 0.595 -2.89 1.52Self-concept (G8) 0.028 0.649 -3.61 1.89Educational expectations (G8) 4.62 1.27 1 6Locus of control (G10) 0.0340 .619 -2.66 1.44Self-concept (G10) -0.0060 .681 -2.95 1.66Educational expectations (G10) 6.40 2.06 1 9
Students’ Intellectual StimulationStudent feels challenged 12.62 7.74 0 20Asked to show understanding 10.43 7.93 0 20
a The 8–10 panel weight (F1PNLWT) was used to calculate the means and standard deviations in thistable.
b The mean and standard deviation for this variable were based on a subject-specific sample.
at Otterbein University on September 30, 2014soe.sagepub.comDownloaded from
36 Carbonaro
scaled so that 8th- and 10th-grade test scoresare in the same metric.
Four categories of variables were used toexplain differences in effort and achievementacross tracks. First, since background factors,such as race/ethnicity, sex, and social class,may be related to effort, track placement, andachievement, controls for these variableswere included in the analyses. Race/ethnicitywas based on students’ 8th-grade reports andwas represented by a series of dummy vari-ables (black, Hispanic, and Asian), which werecontrasted with non-Hispanic whites (the ref-erence category). SES was a composite vari-able that was composed of five different fac-tors taken from the base year: family income,mother’s and father’s education, and moth-er’s and father’s occupations. A dummy vari-able (“female”) was created to denote eachstudents’ sex.
Second, measures of prior achievementconsisted of 8th-grade IRT test scores in read-ing, math, science, and history. FollowingJencks’s (1985) suggestion, all four test scoreswere included separately as independent vari-ables in the regression analyses to control forprior achievement. The use of four test scoresminimized possible reliability problems in theanalysis.8
Third, multiple measures of students’beliefs about themselves and their futurewere used in the analysis: students’ (1) 8th-and 10th-grade locus of control,9 (2) 8th-and 10th-grade self-concept,10 and (3) 8th-and 10th-grade expectations regarding howfar students think they will go in school.11 Byincluding the 8th- and 10th-grade measuresas separate predictors in the regression mod-els, I was able to establish whether a changein students’ locus of control and/or self-con-cept affected effort. Finally, two separatemeasures of intellectual stimulation wereincluded: whether students felt challenged ina given subject and whether they were askedto show understanding in a given subject.Although items that measure whether a stu-dent was interested in or stimulated by a classmay be preferable, such measures areunavailable in NELS. Regardless, the measuresused here are likely to be strongly correlatedwith these more-direct measures.
It is important to note that although
opportunities to learn (OTL) are present inthe conceptual model (see Figure 1), directmeasures of learning opportunities were notincluded in the analysis. Although it would bepreferable to include such measures in themodels, valid OTL measures are unavailable inNELS.12 Consequently, after adjustments forthe other mediating variables, the trackdummy variables probably represent differ-ences in exposure to learning opportunities,as well as other unmeasured factors.
METHODS
Ordinary least-squares (OLS) regression tech-niques were used to analyze the data. The dis-tribution for the effort scale is clearly nega-tively skewed. Consequently, when effort isused as a dependent variable, the estimates ofthe coefficients will be less efficient than theywould be if effort were normally distributed.The models presented here were rerun with anormalized version of the effort scale as thedependent variable. Comparisons of the twosets of analyses indicated that the magnitudeand levels of statistical significance for thecoefficients were nearly identical. The resultsfor the analyses using the untransformedeffort scale are presented in the tables, sincethe interpretation of coefficients is morestraightforward in these analyses.
As with any quantitative study, missingdata also presented problems for the analy-ses. Although there was no specific variablethat had a high degree of item nonresponse(percentages of missing cases ranged from 0to 20 percent), when included together in the“full” regression models, 35 percent to 42percent of the cases were lost with listwisedeletion. If the data are “missing completelyat random,” listwise deletion provides unbi-ased estimates, but the smaller sample sizedecreases the statistical power of the models(Alison 2002).
To avoid this limitation of listwise deletion,multiple imputation (using AMELIA software)was used to deal with missing data that weredue to item nonresponse. Multiple imputa-tion provides larger sample sizes than doeslistwise deletion and requires only the weaker“missing at random” assumption to produce
at Otterbein University on September 30, 2014soe.sagepub.comDownloaded from
Tracking, Effort, and Achievement 37
unbiased estimates. Like all imputation proce-dures, King et al.’s (2001) multiple imputa-tion technique uses information from othervariables in the data set to generate predictedvalues for cases with missing data. In thiscase, all the variables listed in Table 1 wereused to impute missing data in each academ-ic subject. However, multiple imputation isunique in that it generates multiple datasets—in this case, five—with different imput-ed values in each data set. By imputing miss-ing values five different times, it is possible toaccount for the uncertainty inherent in theimputation process. The same models arethen run on each data set, and the finalresults are then averaged across the fiveanalyses. Since the imputed data sets have nomissing data, the sample sizes remain thesame in each of the regression models (unlikelistwise deletion). The sample sizes in English,math, science, and history were 8,518, 6,911,5,896, and 4,351, respectively.13
Since NELS is a multistage cluster sample,the true standard errors are actually largerthan the standard errors reported by moststatistical software packages. The “survey”command in Stata was used to calculate thecorrect standard errors and account for thedesign effects in NELS. By using informationabout the sampling strata and primary sam-pling unit, Stata is able to generate weightedpoint estimates that are then used to create a
first-order matrix Taylor series expansion thatgenerates the correct standard errors(Statacorp 1999).
RESULTS
Does Effort Vary Across Tracks?
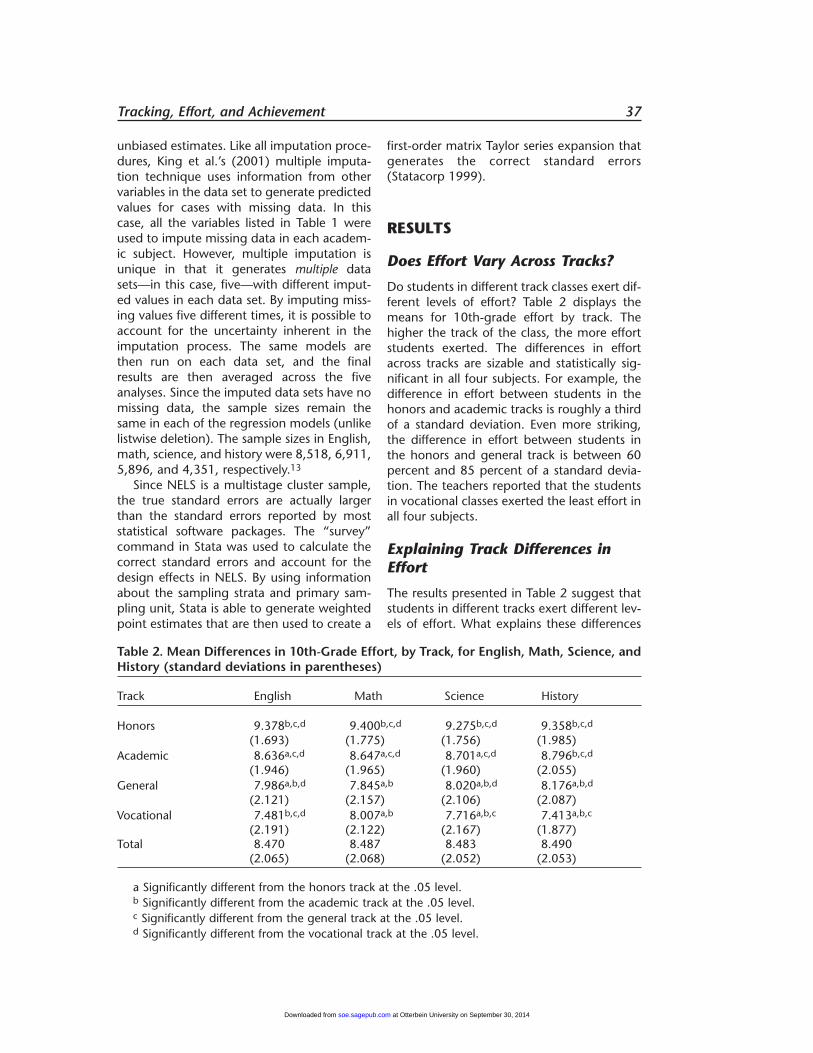
Do students in different track classes exert dif-ferent levels of effort? Table 2 displays themeans for 10th-grade effort by track. Thehigher the track of the class, the more effortstudents exerted. The differences in effortacross tracks are sizable and statistically sig-nificant in all four subjects. For example, thedifference in effort between students in thehonors and academic tracks is roughly a thirdof a standard deviation. Even more striking,the difference in effort between students inthe honors and general track is between 60percent and 85 percent of a standard devia-tion. The teachers reported that the studentsin vocational classes exerted the least effort inall four subjects.
Explaining Track Differences inEffort
The results presented in Table 2 suggest thatstudents in different tracks exert different lev-els of effort. What explains these differences
Table 2. Mean Differences in 10th-Grade Effort, by Track, for English, Math, Science, andHistory (standard deviations in parentheses)
Track English Math Science History
Honors 9.378b,c,d 9.400b,c,d 9.275b,c,d 9.358b,c,d
(1.693) (1.775) (1.756) (1.985)Academic 8.636a,c,d 8.647a,c,d 8.701a,c,d 8.796b,c,d
(1.946) (1.965) (1.960) (2.055)General 7.986a,b,d 7.845a,b 8.020a,b,d 8.176a,b,d
(2.121) (2.157) (2.106) (2.087)Vocational 7.481b,c,d 8.007a,b 7.716a,b,c 7.413a,b,c
(2.191) (2.122) (2.167) (1.877)Total 8.470 8.487 8.483 8.490
(2.065) (2.068) (2.052) (2.053)
a Significantly different from the honors track at the .05 level. b Significantly different from the academic track at the .05 level. c Significantly different from the general track at the .05 level. d Significantly different from the vocational track at the .05 level.
at Otterbein University on September 30, 2014soe.sagepub.comDownloaded from

38 Carbonaro
in effort across tracks? The next set of analy-ses (displayed in Table 3) examine severalpossible explanations of these differences inmath. As I pointed out earlier, the same analy-ses were run in the other subjects, and theresults were similar.
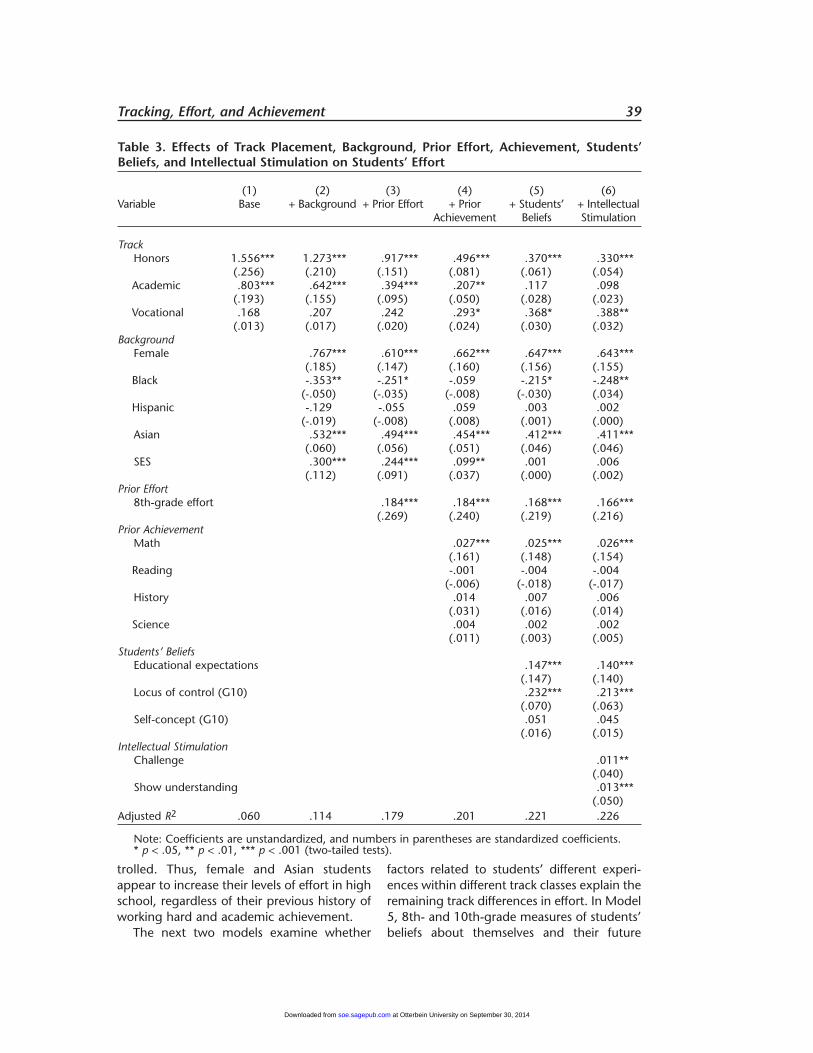
Model 1, the “base” model, indicates theunadjusted differences in teacher-reportedeffort, thereby simply restating the mean dif-ferences in effort by track displayed in Table 2in a regression framework. (Note that thetrack coefficients are relative differencesbetween a given track and general-trackclasses, the reference category.) Model 2examines whether differences in backgroundcharacteristics explain track differences ineffort. Prior research has suggested that effortis related to social class (Cook and Ludwig1998; Willis 1977), gender (Marks 2000;Smerdon 1999), and possibly race/ethnicity(Fordham 1996; Fordham and Ogbu 1986;Ogbu 1978, 2003). Since SES, gender, andrace/ethnicity are related to students’ trackplacements (see Gamoran and Mare 1989,Oakes 1985), it is possible that track differ-ences in effort reflect these differences in stu-dents’ characteristics across tracks. Consistentwith prior research, female students exertedmore effort than did male students, and high-er-SES students exerted more effort than didlow-SES students. The results revealed signifi-cant racial/ethnic differences in 10th-gradeeffort: black students exerted less effort (onaverage) than did white students, while Asianstudents exerted more effort than did stu-dents in any other racial/ethnic group. Theeffort exerted by Hispanic students was notsignificantly different from the effort exertedby white students.
After controls for race/ethnicity, gender,and SES were added to the model, the trackdifferences in effort were reduced. For exam-ple, the differences in effort for students inthe honors and academic tracks werereduced by about 20 percent from Model 1to Model 2. Overall, background differencesexplain some of the track differences in effort,but sizable, statistically significant, differencesremain.
The next set of models examine whether thecriteria used to sort students into tracks explainstrack differences in effort. Model 3 adds a con-
trol for 8th-grade effort, and Model 4 adds thefour 8th-grade achievement scores as predic-tors of 10th-grade effort.14 If students who arepredisposed to exert greater effort are sortedinto higher tracks, Models 3 and 4 should elim-inate most of the track differences in effort.Both 8th-grade effort and 8th-grade achieve-ment are significant predictors of 10th-gradeeffort. In addition, these variables explain agreat deal of the track differences in effort.Controlling for 8th-grade effort reduces thehonors coefficient in Model 2 by 28 percentand the academic coefficient by about 40 per-cent. The addition of controls for prior achieve-ment in Model 4 reduces the coefficientsobserved in Model 2 even more: The effect ofhonors track is reduced by 60 percent, and theeffect of academic track is reduced by almost70 percent when both prior effort and achieve-ment are controlled. A surprising finding is thatnet of background, prior effort, and achieve-ment, vocational-track students exert more(not less) effort than do general-track students(see Model 4). Although it is tempting to con-struct a post hoc explanation for this finding, itshould be noted that the finding is anomalous:Vocational-track students did not differ in theeffort they exerted in Model 4 (or any subse-quent model) in any of the three other subjectsexamined (results not shown).
Overall, Models 3 and 4 indicate thatmuch, although not all, of the track differ-ences in effort are due to the sorting of stu-dents who are more predisposed to exertgreater effort—those who exert more effortand have higher achievement in the 8thgrade—into higher-track classes in the 10thgrade. By including these measures of prioreffort and achievement in subsequent regres-sion models, I was able eliminate these selec-tion factors as threats to internal validity.
When prior effort and achievement arecontrolled, black-white differences in effortare no longer statistically significant, and theSES effect decreases dramatically (by twothirds). This finding suggests that black-whiteand SES differences in effort are explainedmainly by differences in effort and achieve-ment that exist before entry into high school.In contrast, the female and Asian coefficientsdo not decrease much (about 15 percent)when prior effort and achievement are con-
at Otterbein University on September 30, 2014soe.sagepub.comDownloaded from
Tracking, Effort, and Achievement 39
trolled. Thus, female and Asian studentsappear to increase their levels of effort in highschool, regardless of their previous history ofworking hard and academic achievement.
The next two models examine whether
factors related to students’ different experi-ences within different track classes explain theremaining track differences in effort. In Model5, 8th- and 10th-grade measures of students’beliefs about themselves and their future
Table 3. Effects of Track Placement, Background, Prior Effort, Achievement, Students’Beliefs, and Intellectual Stimulation on Students’ Effort
(1) (2) (3) (4) (5) (6)Variable Base + Background + Prior Effort + Prior + Students’ + Intellectual
Achievement Beliefs Stimulation
TrackHonors 1.556*** 1.273*** .917*** .496*** .370*** .330***
(.256) (.210) (.151) (.081) (.061) (.054)Academic .803*** .642*** .394*** .207** .117 .098
(.193) (.155) (.095) (.050) (.028) (.023)Vocational .168 .207 .242 .293* .368* .388**
(.013) (.017) (.020) (.024) (.030) (.032)Background
Female .767*** .610*** .662*** .647*** .643***(.185) (.147) (.160) (.156) (.155)
Black -.353** -.251* -.059 -.215* -.248**(-.050) (-.035) (-.008) (-.030) (.034)
Hispanic -.129 -.055 .059 .003 .002(-.019) (-.008) (.008) (.001) (.000)
Asian .532*** .494*** .454*** .412*** .411***(.060) (.056) (.051) (.046) (.046)
SES .300*** .244*** .099** .001 .006(.112) (.091) (.037) (.000) (.002)
Prior Effort8th-grade effort .184*** .184*** .168*** .166***
(.269) (.240) (.219) (.216)Prior Achievement
Math .027*** .025*** .026***(.161) (.148) (.154)
Reading -.001 -.004 -.004(-.006) (-.018) (-.017)
History .014 .007 .006(.031) (.016) (.014)
Science .004 .002 .002(.011) (.003) (.005)
Students’ BeliefsEducational expectations .147*** .140***
(.147) (.140)Locus of control (G10) .232*** .213***
(.070) (.063)Self-concept (G10) .051 .045
(.016) (.015)Intellectual Stimulation
Challenge .011**(.040)
Show understanding .013***(.050)
Adjusted R2 .060 .114 .179 .201 .221 .226
Note: Coefficients are unstandardized, and numbers in parentheses are standardized coefficients.* p < .05, ** p < .01, *** p < .001 (two-tailed tests).
at Otterbein University on September 30, 2014soe.sagepub.comDownloaded from
40 Carbonaro
were added as controls in the regression. Theinclusion of 8th-grade measures accounts forany prior differences in students’ beliefsbefore their placement in their 10th-gradetrack. Hence, Model 5 examines whetherchanges in beliefs that are due to track place-ment are related to students’ effort. Tenth-grade expectations and locus of control areboth positively related to students’ effort,while students’ self-concept is not.15
Controlling for beliefs decreases the track dif-ferences in effort. The honors-track effect isreduced by 30 percent from Model 4. For theacademic track, the coefficient becomes sta-tistically insignificant. While the track differ-ences in effort decrease when students’beliefs about themselves and the future arecontrolled, it should be noted that causalityremains ambiguous: It is possible that greatereffort leads to higher grades, which, in turn,raise students’ self-concept, locus of control,and expectations, so these results must beinterpreted with caution.
Finally, Model 6 adds controls for intellectu-al stimulation to the model. One way in whichtrack placement may be related to effort isthrough greater intellectual stimulation inresponse to the more-demanding curriculumand stimulating instruction in higher-trackclasses. Both the level of challenge and thedegree to which students are required to“show understanding” in math are positivelyrelated to effort, although the magnitude of theassociation is fairly modest. The results indicatethat intellectual stimulation explains a modestportion (11 percent) of the honors effect oneffort, but the coefficient remains statisticallysignificant. If better measures of intellectualstimulation, such as indicators of a student’sinterest in or stimulation by a given class, wereincluded in the model, more of the track differ-ences in effort may be explained.
Thus, the overall conclusion drawn fromTable 3 is that track differences in effort in the10th grade are explained mostly by theprocess by which students are sorted intotracks: Students who were predisposed toexert more effort in the 10th grade (as evi-denced by their 8th-grade effort and achieve-ment) were more likely to be placed in high-er tracks. However, when combined, beliefsand intellectual stimulation explain a sizable
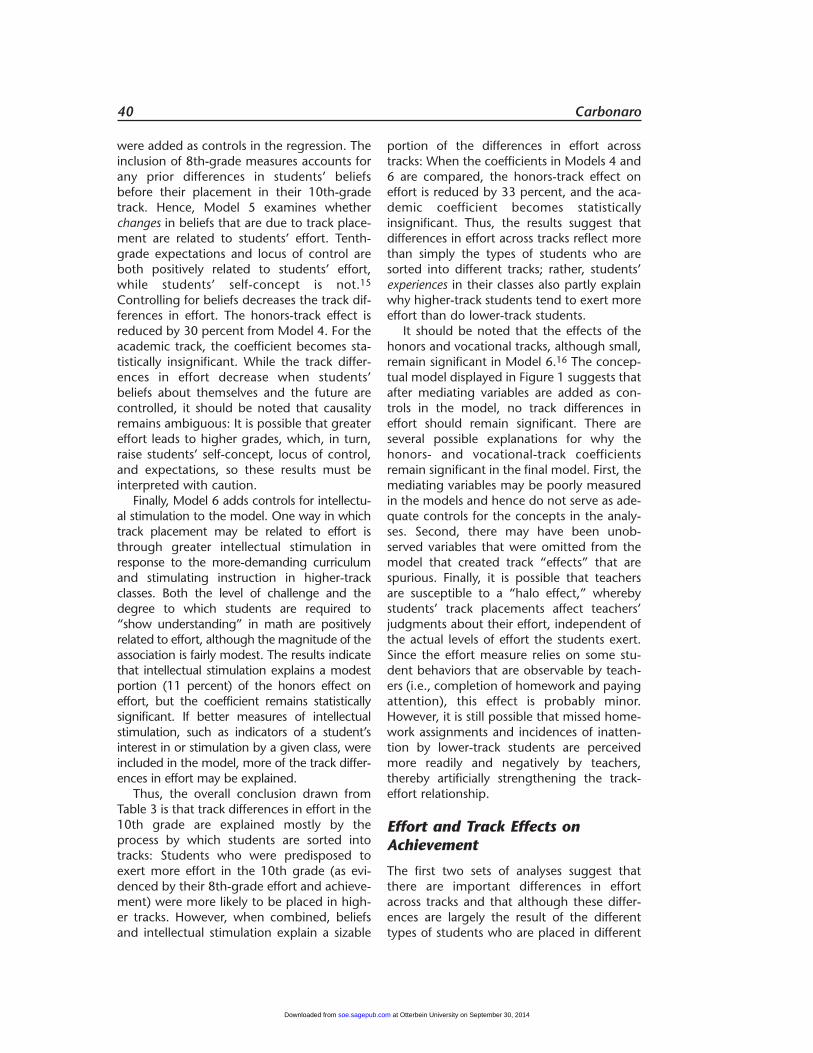
portion of the differences in effort acrosstracks: When the coefficients in Models 4 and6 are compared, the honors-track effect oneffort is reduced by 33 percent, and the aca-demic coefficient becomes statisticallyinsignificant. Thus, the results suggest thatdifferences in effort across tracks reflect morethan simply the types of students who aresorted into different tracks; rather, students’experiences in their classes also partly explainwhy higher-track students tend to exert moreeffort than do lower-track students.
It should be noted that the effects of thehonors and vocational tracks, although small,remain significant in Model 6.16 The concep-tual model displayed in Figure 1 suggests thatafter mediating variables are added as con-trols in the model, no track differences ineffort should remain significant. There areseveral possible explanations for why thehonors- and vocational-track coefficientsremain significant in the final model. First, themediating variables may be poorly measuredin the models and hence do not serve as ade-quate controls for the concepts in the analy-ses. Second, there may have been unob-served variables that were omitted from themodel that created track “effects” that arespurious. Finally, it is possible that teachersare susceptible to a “halo effect,” wherebystudents’ track placements affect teachers’judgments about their effort, independent ofthe actual levels of effort the students exert.Since the effort measure relies on some stu-dent behaviors that are observable by teach-ers (i.e., completion of homework and payingattention), this effect is probably minor.However, it is still possible that missed home-work assignments and incidences of inatten-tion by lower-track students are perceivedmore readily and negatively by teachers,thereby artificially strengthening the track-effort relationship.
Effort and Track Effects onAchievement
The first two sets of analyses suggest thatthere are important differences in effortacross tracks and that although these differ-ences are largely the result of the differenttypes of students who are placed in different
at Otterbein University on September 30, 2014soe.sagepub.comDownloaded from
Tracking, Effort, and Achievement 41
tracks, they are also partly due to students’experiences within these tracks. The next setof questions link effort with track differencesin achievement. In particular, are track differ-ences in learning partly explained by thegreater effort exerted by students in highertracks? The results of the analyses examiningthis question are displayed in Table 4.
The first model (Model 1) estimates thetrack differences in gains in math after back-ground characteristics and 8th-gradeachievement are controlled. These “adjustedtrack effects” indicate that regardless of stu-dents’ prior math achievement, students gainmore when they are placed in a higher mathtrack. Controls for 10th-grade effort wereadded to the next model (Model 2) to estab-lish whether differences in effort partlyexplain some of the track differences in mathgains. Effort has a significant, positive effecton math gains. These effects are relativelylarge compared with the differences in mathgains across tracks: A standard deviationincrease in effort produces an average gain inmath achievement that is two fifths and onequarter of the academic and honors effects(respectively).17
Does the positive relationship betweeneffort and math gains partly explain theeffects of track on learning? When the trackcoefficients in Model 1 are compared withthose in Model 2, a fairly modest reduction inthe track effects on learning is observed: Theeffect of honors track is reduced by roughly10 percent, and the effect of academic trackis reduced by 7 percent. In the other threesubjects, effort explains slightly more of thetrack effects (generally from 10 percent to 20percent), but most of the track effects remainunexplained (results not shown). Hence,although effort plays an important role in pre-dicting learning, it explains little of the trackeffects on learning. If effort does not explainmuch of the track differences in achievement,what does? As Figure 1 (and prior research)suggests, differences in learning opportuni-ties across tracks likely account for track dif-ferences in achievement. Unfortunately, thisinterpretation of the results cannot be con-firmed through further analysis because ofthe absence of adequate direct measures oflearning opportunities in the NELS data.
How does controlling for students’ effortand track placement affect the relationshipbetween background characteristics andachievement? Controlling for effort does notchange the racial/ethnic coefficients and onlyslightly reduces the SES effect on achieve-ment. It is interesting that although the base-line model (Model 1) did not reveal genderdifferences in achievement, the addition ofthe effort measure revealed an advantage formale students. Hence, female students areclosing the achievement gap in math withmale students by exerting more effort in theirmath classes (see Table 3).
While 10th-grade effort has a strong effecton learning, this effect could be due largely tothe fact that students who exert more effortare more likely to be sorted into higher tracks.To eliminate this possibility, Model 3 adds thecontrol for 8th-grade effort as a predictor of10th-grade learning gains. The addition ofthis variable to the model slightly reduceschanges in the track differences in learning orthe effects of effort on students’ learninggains, but both remain sizable and signifi-cant. When 10th-grade effort is removed as apredictor of achievement in Model 3, theresults indicate that 8th-grade effort explainssome of the track differences in achievement,but only about half as much as 10th-gradeeffort does in Model 2.18 Thus, it appears thatthe effects of 10th-grade effort do not simplyreflect the fact that students who try hard aremore likely to be sorted into higher-trackclasses. Rather, students who exert greatereffort in the 10th grade learn more, regard-less of how much effort they exerted in the8th grade.
Effects of Effort on Learning AcrossTracks
The last question of interest focuses onwhether the effect of effort on learning variesacross tracks. Model 4 in Table 4 examinesthis issue by adding interaction termsbetween effort and track placement to themodel. None of the interaction terms is sta-tistically significant at the .05 level. Hence,the results suggest that the effects of effort onlearning are the same for all students, regard-less of their track.
at Otterbein University on September 30, 2014soe.sagepub.comDownloaded from

42 Carbonaro
Table 4. Effects of Track Placement, Effort, and the Track-Effort Interaction on Scores onthe 10th-Grade Math Test
(1) (2) (3) (4) Adjusted + Effort + Prior Effort + Effort x
Variable Track Effects Track Interactions
TrackHonors 4.866*** 4.451*** 4.275*** 3.960**
(.119) (.109) (.104) (.097)Academic 3.474*** 3.252*** 3.090*** 3.515***
(.124) (.117) (.110) (.126)Vocational -.670 -.836 -.796 .499
(-.008) (-.010) (-.010) (.006)Effort
10th-grade effort .602*** .534*** .563***(.089) (.079) (.083)
8th-grade effort .213*** .212*** (.041) (.041)
Track x EffortHonors x Effort -.030
(.006)Academic x Effort -.051
(-.017)Vocational x Effort -.162
(-.016)Background
Female -.129 -.732*** -.733*** -.730***(-.005) (-.026) (-.026) (-.026)
Black -1.573*** -1.513*** -1.479*** -1.477***(-.033) (-.031) (-.031) (-.031)
Hispanic -.577* -.592* -.555* -.558*(-.012) (-.013) (-.122) (-.012)
Asian .425 .136 .139 .130(.007) (.002) (.002) (.002)
SES .920*** .858*** .859*** .859***(.051) (.047) (.047) (.047)
Prior Achievement Math .727*** .707*** .702*** .702***
(.632) (.615) (.611) (.611)Reading .114*** .115*** .113*** .113***
(.071) (.071) (.070) (.070)History .209*** .194*** .186*** .185***
(.068) (.063) (.060) (.060)Science .175*** .174*** .176*** .176***
(.061) (.061) (.061) (.061)
Adjusted R2 .788 .794 .796 .796
Note: Coefficients are unstandardized, and numbers in parentheses are standardized coefficients.* p < .05, ** p < .01, *** p < .001 (two-tailed tests).
at Otterbein University on September 30, 2014soe.sagepub.comDownloaded from
Tracking, Effort, and Achievement 43
DISCUSSION
The main goal of this study was to explore thecomplex and multifaceted ways in whicheffort, curricular tracking, and learning arerelated. The major substantive conclusions ofthe analyses are as follows: (1) The higher astudent’s track, the more effort she or heexerts; (2) most of the differences in effortacross tracks are explained by differences inprior effort and achievement across tracks,but factors related to students’ experienceswithin tracks also explain track differences ineffort; (3) effort is an important predictor ofachievement, but effort does not account fora large proportion of the track effect on gainsin achievement; and (4) the effect of effort onachievement gains does not vary acrosstracks.
Although the findings were mixed overall,they still suggest that examining effort in thecontext of curricular tracking is a fruitfuldirection to pursue. Better measures of effortthat capture a wider range of behaviors mayindicate that effort plays a greater role inexplaining track differences in achievementand may reveal track-by-effort interactions. Inparticular, future studies should distinguishbetween the three types of effort identifiedhere (rule oriented, procedural, and intellec-tual) and measure them separately.Researchers must recognize that each type ofeffort may be related to different outcomes.Rule-oriented effort (e.g., showing up forclass regularly) is likely to be related to out-comes like high school graduation, but in theabsence of greater procedural and intellectu-al effort, academic outcomes may not bedrastically improved. Procedural effort (e.g.,handing in homework regularly) may beimportant for grades, but increased learningand achievement are most likely to be relatedto students’ level of intellectual effort (e.g.,students’ attempts to use their cognitive skillsto comprehend the material). These differenttypes of effort may also be emphasized andrewarded differentially across tracks. Forexample, teachers in low-track classes mayemphasize and reward rule-oriented effort,whereas teachers in high-track classes mayexpect and encourage greater intellectualeffort from students. Hence, track differences
in effort may be more pronounced if separatemeasures of the three types of effort identi-fied here are analyzed. By extension, if high-er-track classes produce more intellectualeffort than do lower-track classes, higher-track students may experience greater gainsin learning because intellectual effort is mostlikely to improve that specific outcome. Whilethe measure of effort that was used in thisarticle tries to capture rule-oriented, proce-dural, and intellectual effort, it is admittedlylimited in scope. Future research that usesmore-expansive measures of rule-oriented,procedural, and intellectual effort couldgreatly improve our knowledge of how effort,tracking, and learning are related.
Although the findings reveal some inter-esting insights regarding the relationshipsamong tracking, effort, and achievement, it isnecessary to consider some possible alterna-tive explanations for the findings. One possi-ble problem with the teachers’ reports ofeffort is that they are formed in reaction tostudents’ performance, not vice versa. Inother words, teachers may believe that high-achieving students are diligent and attentiveand complete homework assignments whilelow-achieving students are and do not; ifteachers assess effort accordingly, then therelationship between effort and achievementmay be biased because of measurement error.
While it is certainly possible that theobserved relationship between effort andachievement is biased owing to errors inteachers’ reports, there are two reasons tobelieve that this is not the case. First, theitems focusing on attentiveness and the com-pletion of homework are based, to someextent, on behaviors that teachers can recall,rather than simply subjective impressions(such as whether the student “tries hard”).Second, it is not clear that teachers couldaccurately predict students’ learning gainsfrom the 8th to the 10th grade. Since teach-ers themselves assign grades, they, of course,know them, but the same is not true for gainsin test scores. Hence, while gains in testscores and grades are correlated, it is unlikelythat teachers’ reports of effort simply reflectstudents’ gains in test scores.
What conclusion can be drawn regardingthe importance of agency versus structure for
at Otterbein University on September 30, 2014soe.sagepub.comDownloaded from
44 Carbonaro
learning? If agency is of paramount impor-tance, track effects should disappear wheneffort is controlled. If structure is the mostcrucial, differences across tracks shouldremain when effort is controlled. Ultimately, itappears that both agency and structure areimportant factors that contribute to learning:Effort has important effects on learning evenafter track placement is controlled, but trackplacements are still related to gains in learn-ing when effort is taken into account. In otherwords, when comparable students in lower-track classes try as hard as students in higher-track classes, they still learn less than theywould in the higher track; however, whencomparable students in the same track exertdifferent levels of effort, students who exertmore effort learn more. Thus, it appears thathigher-track placements and greater effortare not mutually exclusive paths to higherachievement; academic rewards inhere toboth the structural positions that studentsoccupy in the curricular hierarchy and to theiractions within these positions.
I hope that this study will stimulate futureresearch by sociologists of education on effortand its role in creating unequal outcomes. Thisline of research will provide an importantmeans for understanding how structure isrelated to agency and, ultimately, to academicoutcomes. Curricular differentiation is just oneexample of an aspect of social structure withinschools that may influence effort; othersinclude status hierarchies between students,academic and normative school climates, ped-agogical practices within the classroom, andrule governing students’ ability to choose theirown courses. By linking school attributes witheffort, it is possible to understand how struc-ture shapes agency and, ultimately, how itshapes outcomes. In addition, research onthese topics could deepen our insights intohow “oppositional cultures” function. Forexample, do oppositional cultures overwhelmthe school culture? Can school cultures effec-tively offset norms and beliefs that are createdby groups of peers inside and outside theschool? Questions such as these can help linkdifferent aspects of students’ experiences intoa larger gestalt that will deepen our under-
standing of class, racial, and gender inequali-ties in academic outcomes.
Finally, some important implications forpolicy and future research emerged from thefindings. Generally, both policy makers andresearchers pay greater attention to differ-ences in learning opportunities among stu-dents than to differences in effort. For sociol-ogists of education, this impulse to empha-size structure more heavily than agency maypartly reflect a tendency for sociologists toresist explanations that may appear to“blame the victim” and discount the impor-tance of social structure. This is a healthyresponse to the societal impulse to reduce allproblems to the level of the individual and tooverlook the influence of social structure onhuman action.
However, by de-emphasizing effort,researchers and policy makers overlook animportant potential resource that all studentshave and can use to improve their academicoutcomes. Researchers and policy makersneed to consider how to create classroomenvironments that encourage all students totry hard in school. In exploring how schooland classroom conditions are linked witheffort, greater emphasis is actually placed onsocial structure and its relationship withhuman agency. Those who argue forincreased effort by way of moral exhortation,couched in the language of “students’responsibility,” ignore such important link-ages and fail to recognize that some peda-gogical practices are more likely than are oth-ers to motivate students to work hard. Forexample, the findings indicated that intellec-tual stimulation was positively related toeffort, regardless of the track in which stu-dents were placed. Fortunately, there is a richliterature on motivation that can point bothpractitioners and policy makers in promisingdirections (for examples, see Corbett, Wilson,and Williams 2002; Ginsberg and Wlodkowski2000). I hope that this research will stimulatenew policy-relevant ideas about how to useeffort as a means of redressing inequalities instudents’ outcomes.
at Otterbein University on September 30, 2014soe.sagepub.comDownloaded from

Tracking, Effort, and Achievement 45
NOTES
1. In this article, ability grouping refers tothe practice of placing elementary school stu-dents in the same class into different groupsfor the purposes of instruction. In contrast,curricular tracking (or tracking for short) refersto the practice in high school by which stu-dents are placed in different classes forinstruction in a given subject. For the sake ofclarity, the two terms are meant to be mutu-ally exclusive, although the term ability group-ing is sometimes used more broadly to referto practices like tracking. It should be notedthat tracking is a somewhat outdated termbecause it suggests that a student’s track isthe same across academic subjects. However,research has suggested that this is no longerthe case in American high schools, and stu-dents occupy different track positions in dif-ferent academic subjects (Lucas 1999).
2. It should be noted that the field has notalways focused so heavily on structure at theexpense of agency. For example, Kerckhoff(1976) argued that research on the statusattainment process was limited by its focus onsocialization processes. He contended thatresearchers should pay more attention to
“structural limitations and selection criteria”in accounting for differences in attainmentoutcomes (p. 369).
3. One exception is Farkas et al. (1990),who used teachers’ reports of “work habits”and found that differences between the workhabits of black students and white studentswere not statistically significant.
4. Other interactions are plausible as well.For example, it is possible that the effects ofeffort vary by ability. Also, a three-way inter-action among effort, ability, and learningopportunities may exist as well. Sørensen andHallinan (1977) developed a sophisticatedmodel for examining such interactions, buttheir approach and the questions it addressesare beyond the scope of this study.
5. It should be noted that Ainsworth-Darnell and Downey (1998) used the samescale in their study, but they used both teach-ers’ reports in the same scale. The measureused in this study keeps the teachers’ reportsseparate, so that effort is subject specific.
6. In a related paper, Carbonaro (2003)analyzed the NELS:88 data to examine howthe characteristics of parents, peers, andteachers affect effort and achievement. In con-trast to the analyses presented here, the analy-
Appendix Table A
Items Included in the 8th- and 10th-Grade Effort Scales
Survey Items Response Categories
8th-Grade EffortStudent performs below his or her ability [BYT1_2, BYT42] 0 = no, 1 = yesStudent rarely completes homework [BYT1_3, BYT4_3]Student is frequently absent [BYT1_4, BYT4_4]Student is frequently tardy [BYT1_5, BYT4_5]Student is inattentive in class [BYT1_6, BYT4_6]Student is exceptionally passive/withdrawn [BYT1_7, BYT4_7]Student is frequently disruptive [BYT1_8, BYT4_8]
10th-Grade EffortDoes this student usually work hard in your class? [F1T1_2, F1T5_2] 0 = no, 1 = yesHow often is this student attentive in class? [F1T1_18, F1T5_18] 0 = never, 1 = rarely,
2 = some of the time, 3 = most of the time,
4 = all of the timeHow often does this student complete homework assignments inyour class? [F1T1_15, F1T5_15] Same as above
Note: The brackets contain variable names in the NELS:88 codebook.
at Otterbein University on September 30, 2014soe.sagepub.comDownloaded from
46 Carbonaro
ses in that paper relied on combined teachers’reports of effort and global measures of trackthat were derived from students’ transcripts.Although not the main focus of the paper, thefindings regarding the relationships amongtracking, effort, and achievement reported inthat study were consistent with those report-ed here. However, since this article focusesspecifically on tracking, effort, and achieve-ment, subject-specific measures of effort andtrack are the most appropriate, both concep-tually and empirically.
7. Points 2 and 3 require some elaboration.First, teachers have a better understanding ofthe local context and the meaning attachedto course labels than the transcript data canconvey. Second, the transcript data providecourse labels, but in subjects other thanmath, it is not possible to create course-basedindicators of track because (1) the labels arenot specific enough to distinguish betweentrack levels (high versus low), and (2) no clearcourse-taking sequence is apparent. Furtherexplanation and details of the analyses usingthe transcript data are available on request.
8. Jencks (1985) argued that when con-trolling for prior achievement, it is preferableto add controls for test scores in different aca-demic subjects (e.g., including 8th-grademath, reading, history, and science scores aspredictors of 10th-grade math scores), ratherthan simply controlling for a single test scorein one academic subject (e.g., 8th-grademath scores as a control predicting 10th-grade math scores). He contended that priorachievement will be measured more reliablywhen multiple test scores are added to theregression because the additional scores willhelp correct any measurement error in oneparticular test score.
9. The 8th- and 10th-grade scales werecreated using students’ 8th- and 10th-gradereports on the same items. The items are asfollows: (1) “I don’t have enough control overmy life”; (2) “Good luck is more importantthan hard work”; (3) “Every time I try to getahead, something or somebody stops me”;(4) “My plans hardly ever work out, so plan-ning only makes me unhappy”; (5) “When Imake plans, I can almost always make themwork”; and (6) “Chance and luck are veryimportant in what happens in my life.” The
respondents were asked, “how they feltabout” the foregoing items and could choosefrom a scale that ranged from “strongly agreeto strongly disagree.”
10. The 8th- and 10th-grade scales werecreated using students’ 8th- and 10th-gradereports on the same items. The items are asfollows: (1) “I feel good about myself”; (2) “Iam a person of worth, the equal of others”;(3) “I am able to do things as well as mostother people”; (4) “On the whole, I am satis-fied with myself”; (5) “I certainly feel uselessat times”; and (6) “At times, I think I am nogood at all.” The respondents were asked“how they felt about” the foregoing itemsand could choose from a scale that rangedfrom “strongly agree to strongly disagree.”
11. The response categories for this vari-able were as follows: for 8th-grade expecta-tions, (1) “won’t finish high school,” (2) “willfinish high school,” (3) “will attend vocation-al/trade/business school after high school,”(4) “will attend college,” (5) “will finish highschool,” and (6) “will attend a higher schoolafter college”; for 10th-grade expectations,(1) “less than high school graduation,” (2)“high school graduation only,” (3) “less thantwo years of trade school,” (4) “more thantwo years of trade school,” (5) “less than twoyears of college,” (6) “two or more years ofcollege,” (7) “finish college,” (8) “master’sdegree,” and (9) “Ph.D. or M.D.”
12. Ideally, adequate measures of learningopportunities would include variables, such asinstructional time, curricular coverage,instructional quality, and teacher quality.Although NELS includes some information onthese aspects of students’ schooling experi-ences, the measures are generally crude.However, it should be noted that Carbonaroand Gamoran (2002) had some success inusing these measures in their examination ofachievement in English. It is unclear whethersimilar measures could be created in math orother subjects.
13. The sample sizes differ across academ-ic subjects because some students did nottake courses in each of the four subjects intheir junior year.
14. The bivariate correlation between 8th-and 10th-grade effort is .346. Eighth-gradeachievement is also positively correlated with
at Otterbein University on September 30, 2014soe.sagepub.comDownloaded from
Tracking, Effort, and Achievement 47
10th-grade effort, with correlations rangingfrom a high of .306 (effort and math) to a lowof .224 (effort and science).
15. Neither the 8th-grade measure oflocus of control nor students’ self-conceptwas statistically significant at the .05 level inModel 5 or 6. Eighth-grade expectations hada small, negative, statistically significant rela-tionship with effort (p = .01).
16. The honors coefficient is statistically sig-nificant in Model 6 for English and science aswell.
17. In the other three subjects, the effectof effort on achievement is larger relative tothe track effects than is the case in math. Forexample, in English, a standard-deviationincrease in effort produces an increase inreading gains that is larger than the effect ofacademic track and two thirds that of theeffect of the honors track.
18. In the other three subjects, the resultsindicate that 8th-grade effort (apart from10th-grade effort) explains almost none ofthe track differences in achievement. Hence,math is unique because it is the only subjectin which 8th-grade effort seems to contributeto track differences in achievement.
REFERENCES
Ainsworth-Darnell, James, and Douglas Downey.1998. “Assessing Racial/Ethnic Differences inSchool Performance.” American SociologicalReview 63:536–53.
Alexander, Karl, and Martha Cook. 1982.“Curricula and Coursework: A Surprise Endingto a Familiar Story.” American SociologicalReview 47:626–40.
Allison, Paul. 2002. Missing Data. Thousand Oaks,CA: Sage.
Barr, Rebecca, and Robert Dreeben. 1983. HowSchools Work. Chicago: University of ChicagoPress.
Bishop, John. 1999. “Nerd Harassment, Incentives,School Priorities, and Learning.” Pp. 231–80in Learning and Earning: How Schools Matter,edited by Susan Mayer and Paul Peterson.Washington, DC: Brookings Institution Press.
Bong, Mimi, and Richard Clark. 1999.“Comparison Between Self-Concept and Self-Efficacy in Academic Motivation Research.”Educational Psychologist 34:139–53.
Brint, Steven, Mary Contreras, and Michael
Matthews. 2001. “Socialization Messages inPrimary Schools: An Organizational Analysis.”Sociology of Education 74:157–80.
Brophy, Jere, and Thomas Good. 1986. “TeacherBehavior and Student Achievement.” Pp.328–75 in Handbook of Research on Teaching,edited by Merlin Wittrock. New York:Macmillan.
Bryk, Anthony, Valerie Lee, and Peter Holland.1993. Catholic Schools and the Common Good.Cambridge, MA: Harvard University Press.
Carbonaro, William. 2003. “Teacher, Peer, andParent Social Capital: Influences on StudentEffort and Academic Outcomes.” Paper pre-sented at the “Creation and Returns to SocialCapital” Colloquium, Royal NetherlandsAcademy of Arts and Sciences, Amsterdam,the Netherlands.
Carbonaro, William, and Adam Gamoran. 2002.“The Production of Achievement Inequality inHigh School English.” American EducationalResearch Journal 39:801–27.
Cook, Philip, and Jens Ludwig. 1998. “The Burdenof ‘Acting White’: Do Black AdolescentsDisparage Academic Achievement?” Pp.375–400 in The Black-White Test Score Gap,edited by Christopher Jencks and MeredithPhillips. Washington, DC: BrookingsInstitution Press.
Corbett, Dick, Bruce Wilson, and Belinda Williams.2002. Effort and Excellence in UrbanClassrooms: Expecting—and Getting—Successwith All Students. New York: Teachers CollegePress.
Eder, Donna. 1981. “Ability Grouping as a Self-Fulfilling Prophecy: A Micro Analysis ofTeacher-Student Interaction.” Sociology ofEducation 54:151–62.
Farkas, George, Robert Grobe, Daniel Sheehan,and Yuan Shuan. 1990. “Cultural Resourcesand School Success: Gender, Ethnicity, andPoverty Groups Within an Urban SchoolDistrict.” American Sociological Review55:127–42.
Farkas, George, Christy Lleras, and Steve Maczuga.2002. “Does Oppositional Culture Exist inMinority and Poverty Peer Groups? Commenton Ainsworth-Darnell and Downey.” AmericanSociological Review 67:148–55.
Felmlee, Diane, and Donna Eder. 1983.“Contextual Effects in the Classroom: TheImpact of Ability Groups on StudentAttention.” Sociology of Education 56:77–87.
Ferguson, Ronald. 2001. “A Diagnostic Analysis ofBlack-White GPA Disparities in Shaker Heights,Ohio.” Pp. 347–414 in Brookings Papers onEducation Policy: 2001, edited by Diane
at Otterbein University on September 30, 2014soe.sagepub.comDownloaded from
48 Carbonaro
Ravitch. Washington, DC: BrookingsInstitution Press.
Fordham, Signithia. 1996. Blacked Out: Dilemmas ofRace, Identity, and Success at Capital High.Chicago: University of Chicago Press.
Fordham, Signithia, and John Ogbu. 1986. “BlackStudents’ School Success: Coping with the‘Burden of “Acting White.”’” Urban Review18:176–206.
Gamoran, Adam. 1986. “Institutional andInstructional Effects of Ability Grouping.”Sociology of Education 59:85–98.
—-. 1987. “The Stratification of High SchoolLearning Opportunities.” Sociology ofEducation 60:135–55.
Gamoran, Adam, and William Carbonaro.2002–03. “High School English: A NationalPortrait.” High School Journal 86:1–13.
Gamoran, Adam, and Robert Mare. 1989.“Secondary School Tracking and EducationalInequality: Compensation, Reinforcement, orNeutrality?” American Journal of Sociology94:1146–83.
Ginsberg, Margery, and Raymond Wlodkowski.2000. Creating Highly Motivating Classroomsfor All Students. San Francisco: Jossey-Bass.
Hallinan, Maureen. 1992. “The Organization ofStudents for Instruction in the MiddleSchool.” Sociology of Education 65:114–27.
Hoffer, Thomas. 1992. “Middle School AbilityGrouping and Student Achievement inScience and Mathematics.” EducationEvaluation and Policy Analysis 14:205–27.
Jencks, Christopher. 1985. “How Much Do HighSchool Students Learn?” Sociology of Education58:128–35.
Johnson, Monica Kirkpatrick, Robert Crosnoe, andGlenn Elder, Jr. 2001. “Students’ Attachmentand Academic Engagement: The Role of Raceand Ethnicity.” Sociology of Education74:318–40.
Jones, James, Beth Vanfossen, and MargaretEnsminger. 1995. “Individual andOrganizational Predictors of High School TrackPlacement.” Sociology of Education 68:287–300.
Kerckhoff, Alan. 1976. “The Status AttainmentProcess: Socialization or Allocation?” SocialForces 55:368–81.
King, Gary, James Honaker, Anne Joseph, andKenneth Scheve. 2001. “AnalyzingIncomplete Political Science Data: AnAlternative Algorithm for MultipleImputation.” American Political Science Review95:49–69.
Lucas, Samuel. 1999. Tracking Inequality:Stratification and Mobility in American HighSchools. New York: Teachers College Press.
Lucas, Samuel, and Adam Gamoran. 2002.“Tracking and the Achievement Gap.” Pp.171–98 in Bridging the Achievement Gap, edit-ed by John Chubb and Tom Loveless.Washington, DC: Brookings Institution Press.
MacLeod, Jay. 1995. Ain’t No Makin’ It: Aspirationsand Attainment in a Low-Income Neighborhood(2nd ed.). Boulder, CO: Westview Press.
Marks, Helen. 2000. “Student Engagement inInstructional Activity: Patterns in theElementary, Middle, and High Schools Years.”American Educational Research Journal37:153–84.
Mickelson, Roslyn. 1990. “The Attitude-Achievement Paradox Among BlackAdolescents.” Sociology of Education 63:44–61.
Natriello, Gary, and Edward McDill. 1986.“Performance Standards, Student Effort onHomework, and Academic Achievement.”Sociology of Education 59:18–31.
Newmann, Fred, ed. 1992. Student Engagementand Achievement in American SecondarySchools. New York: Teachers College Press.
Oakes, Jeannie. 1985. Keeping Track: How SchoolsStructure Inequality. New Haven, CT: YaleUniversity Press.
—-. 1990. Multiplying Inequalities. Santa Monica,CA: RAND.
Ogbu, John. 1978. Minority, Education, and Caste.New York: Academic Press.
—-. 2003. Black American Students in an AffluentSuburb: A Study of Academic Disengagement.Mahwah, NJ: Lawrence Erlbaum.
Page, Reba. 1991. Lower Track Classrooms: ACurricular and Cultural Perspective. New York:Teachers College Press.
Pallas, Aaron, Doris Entwisle, Karl Alexander, andMaria Stluka. 1994. “Ability-Group Effects:Instructional, Social, or Institutional?”Sociology of Education 67:27–46.
Rosenbaum, James. 2001. Beyond College for All:Career Paths for the Forgotten Half. New York:Russell Sage Foundation.
Rowan, Brian, and Andrew Miracle, Jr. 1983.“Systems of Ability Grouping and theStratification of Achievement in ElementarySchools.” Sociology of Education 56:133–44.
Smerdon, Becky. 1999. “Engagement andAchievement: Differences Between African-American and White High School Students.”Research in Sociology of Education andSocialization 12:103–34.
Sørensen, Aage, and Maureen Hallinan. 1977. “AReconceptualization of School Effects.”Sociology of Education 50:273–89.
Statacorp. 1999. Stata Statistical Software: Release6.0. College Station, TX: Stata Corporation.
at Otterbein University on September 30, 2014soe.sagepub.comDownloaded from
Tracking, Effort, and Achievement 49
Suarez-Orozco, Marcelo. 1987. “Towards aPsychosocial Understanding of HispanicAdaptation to American Schooling.” Pp.156–68 in Learning to Learn: A MulticulturalPerspective, edited by Henry Trueba.Newberry, MA: Newberry Press.
Tach, Laura, and George Farkas. 2003. “AbilityGrouping and Educational Stratification in theEarly School Years.” Paper presented at theannual meeting of the American SociologicalAssociation, Atlanta, GA.
Wang, Jia. 1998. “Opportunity to Learn: The
Impacts and Policy Implications.” EducationalEvaluation and Policy Analysis 20:137–56.
Weis, Lois. 1990. Working Class Without Work: HighSchool Students in a De-industrializingEconomy. New York: Routledge.
Willis, Paul. 1977. Learning to Labor. New York:Columbia University Press.
Yair, Gad. 2000. “Educational Battlefields inAmerica: The Tug-of-War over Students’Engagement with Instruction.” Sociology ofEducation 73:247–69.
William Carbonaro, Ph.D., is an assistant professor of sociology at the University of Notre Dame.His research interests are in the areas of education and social stratification. He is currently workingon several projects that focus on how students’ high school experiences affect racial/ethnic differ-ences in college graduation.
The author thanks Adam Gamoran, Michael Olneck, Warren Kubitschek, Maureen Hallinan, SeanKelly, and attendees of the University of Wisconsin-Madison sociology of education brownbag seriesfor their valuable feedback on an earlier version of this article and Bridget Nicholson for her valu-able research assistance on this project. Address all correspondences to William Carbonaro,Department of Sociology, University of Notre Dame, 1016 Flanner Hall, Notre Dame, IN, 46556;e-mail: [email protected].
at Otterbein University on September 30, 2014soe.sagepub.comDownloaded from