tpl san jose feasibility study final 2017
TRANSCRIPT
PARK FINANCE FEASIBILITY STUDY | JULY 2017
CITY OF SAN JOSÉ, CALIFORNIA

CITY OF SAN JOSÉ, CALIFORNIA | PARK FINANCE FEASIBILITY STUDY | JULY,2017
2
This page intentionally left blank.
CITY OF SAN JOSÉ, CALIFORNIA| PARK FINANCE FEASIBILITY STUDY | JULY, 2017
THE TRUST FOR PUBLIC LAND :: CONSERVATION FINANCE DEPARTMENT 1
Copyright © July, 2017, The Trust for Public Land. All rights reserved. Cover photo: Alum Rock Park, San José, CA. Credit: City of San José

CITY OF SAN JOSÉ, CALIFORNIA | PARK FINANCE FEASIBILITY STUDY | JULY, 2017
1
CITY OF SAN JOSÉ, CALIFORNIA | PARK FINANCE FEASIBILITY STUDY | JULY,2017
2
TABLE OF CONTENTS
Introduction 3
Executive Summary 4
Overview 6
City Government and Finances 8
Revenue Options for Parks and Recreation 10
Voter-Approved Parks and Open Space Trends 36
Elections 36
Conclusion 38
Appendices 39
Disclaimer: This feasibility study is not a legal document and should not be relied upon as a legal
opinion.
CITY OF SAN JOSÉ, CALIFORNIA | PARK FINANCE FEASIBILITY STUDY | JULY, 2017
3
INTRODUCTION The Trust for Public Land (TPL) is a national nonprofit organization dedicated to conserving,
improving, and restoring land for people to enjoy as parks, gardens, and natural areas. Since 1972,
TPL has conserved more than three millions acres nationwide. To help local governments and
state agencies acquire land and create parks, TPL assists communities in identifying and securing
public financing. TPL’s Conservation Finance program offers technical assistance to elected
officials, public agencies, and community groups to design, pass, and implement public funding
measures that reflect popular priorities.
The Trust for Public Land differs from other conservation nonprofits because it works across the
full range of landscapes necessary for human health and well-being — from urban areas to
wilderness. TPL has the expertise and resources to tackle the most complex parks and land
protection projects. And TPL is the only national conservation group working to provide close-to-
home nature in cities and metropolitan areas, where 85 percent of Americans live.
Since 1996, TPL has been involved in more than 500 successful ballot measures and twenty
successful legislative campaigns that have created more than $68 billion in new funding for parks,
land conservation, and restoration. Voters have approved 81 percent of the ballot measures
supported by The Trust for Public Land.
In California, TPL works to plan, fund, protect, and create to craft solutions to local parks and
conservation challenges. TPL has assisted with statewide ballot measures to generate funding for
parks, wildlife habitat and water, including Propositions 40, 50 and 84. TPL also assisted with the
successful 2014 statewide water bond measure. At the local level, TPL has provided technical
assistance and planning services to cities and counties. Most recently, TPL helped lead the passage
of Measure A in Los Angeles County, a parcel tax for safe, clean neighborhood parks, open space,
beaches, rivers, and water conservation that will generate at least approximately $95 million
annually in perpetuity. TPL recently worked with the City of San José to develop a report detailing
the economic benefits of parks and recreation in San José.
In January 2017, the City of San José asked TPL to explore options to develop a program for the
financing of land conservation, parks, and recreation purposes. This study presents viable local
public options for funding conservation, parks, and recreation purposes; it also provides analysis of
which local options and funding levels are feasible, economically prudent, and likely to be publicly
acceptable. This research provides a stand-alone, fact-based reference document that can be used to
evaluate financing mechanisms from an objective vantage point.1
1 The contents of this report are based on the best available information at the time of research and drafting. March and April 2016.
CITY OF SAN JOSÉ, CALIFORNIA | PARK FINANCE FEASIBILITY STUDY | JULY,2017
4
EXECUTIVE SUMMARY The Trust for Public Land (TPL) is undertaking feasibility analysis to explore funding options for the City of San José to address the need to develop and sustain reliable, ongoing sources of funding for land conservation, parks, and recreation purposes. These funding sources could help ensure that San José parks receive regular upgrades and ongoing operations and maintenance. In order to understand what would be an appropriate funding source; this report first briefly delves into the city’s background for a general overview of its land, people, economy, and the growth trends that have shaped it in recent years. The report primarily investigates the authority and revenue capacity of the city to raise funds for conservation, parks, and recreation purposes. As many pathways to implement a park finance measure would require voter approval, this report also explores election history. This information plays an important role in informing the city, TPL, and partners as they design a parks measure for the city.
San José, like many other major American cities, currently faces a substantial backlog of deferred park maintenance projects as well as a gap in funding needed to ensure sustainable park operations and maintenance. To address this issue, the Department of Parks, Recreation and Neighborhood Services received direction from the city council in fall 2016 to provide additional information regarding park maintenance and potential funding scenarios. In February 2017, Mayor Liccardo, with support from councilmembers Rocha and Jimenez, directed staff to examine park financing options and return to Council to receive direction on whether to proceed with developing options for placing a park measure on the ballot during the 2018 cycle. This report provides information to inform this process.
The most feasible or commonly used funding mechanisms are summarized below and are presented in no particular order.
1. Bond. A $135 million bond would cost the owner of a home with the average assessed value in San José approximately $30 per year. A two-thirds majority of votes cast on the measure is required for approval. Revenue could not be used for operations and maintenance.
2. Parcel Tax. A two-thirds majority of votes cast on the measure is required for approval. Revenue could be used for operations and maintenance. Voters could approve a parcel tax based on a fixed rate per parcel, fixed rate per square foot, or some other classification. Examples of parcel tax structures are listed below.
Per Parcel: A $30 per parcel tax of all parcels within the city would generate approximately $7.2 million annually and would cost the median homeowner $30 per year.
Per Square Foot: A uniform parcel tax of $0.0065 per square foot of all parcels within the city would generate approximately $28 million per year and cost the owner of an average sized home $30 per year.
Per Square Foot of Improved Property: A uniform parcel tax of $0.015 per square foot of improved property located within the city would generate approximately $8.2 million per year and cost the owner of an average sized home $30 per year.
CITY OF SAN JOSÉ, CALIFORNIA | PARK FINANCE FEASIBILITY STUDY | JULY, 2017
5
Other Structures: California statutes do not specify the methods by which a city may impose a parcel tax. Many cities, including San José, impose parcel taxes with varying structures. Examples are discussed in the report. Additional research and data would be necessary to determine revenue estimates and impact on property owners. San José’s existing library parcel tax, which generates approximately $8 million per year, charges different rates based on land classifications and costs the average homeowner approximately $30 a year.
3. Special Districts. The city could consider creating special districts such as a park and recreation district or a community facilities district. These districts could levy taxes and issue bonds, subject to voter approval. All special district taxes require two-thirds voter support.
4. Other Taxes. The city could consider other taxes such as an increase or modification to the existing utility users’ tax or the construction and conveyance taxes, among other taxes.
Note: San José is at its maximum allowed sales tax rate and cannot increase it further at this time.
This report is meant to inform the City of San José’s consideration of new funding for land conservation, parks, and recreation purposes by identifying potential funding mechanisms and determining the fiscal capacity and implementation requirements of various approaches. Next steps should include narrowing funding options to those that match the needs identified by the city’s green print plan and testing voter attitudes toward a specific set of funding proposals. TPL recommends conducting a public opinion survey that tests ballot language, tax tolerance, and program priorities of voters in the city.
CITY OF SAN JOSÉ, CALIFORNIA | PARK FINANCE FEASIBILITY STUDY | JULY,2017
6
OVERVIEW
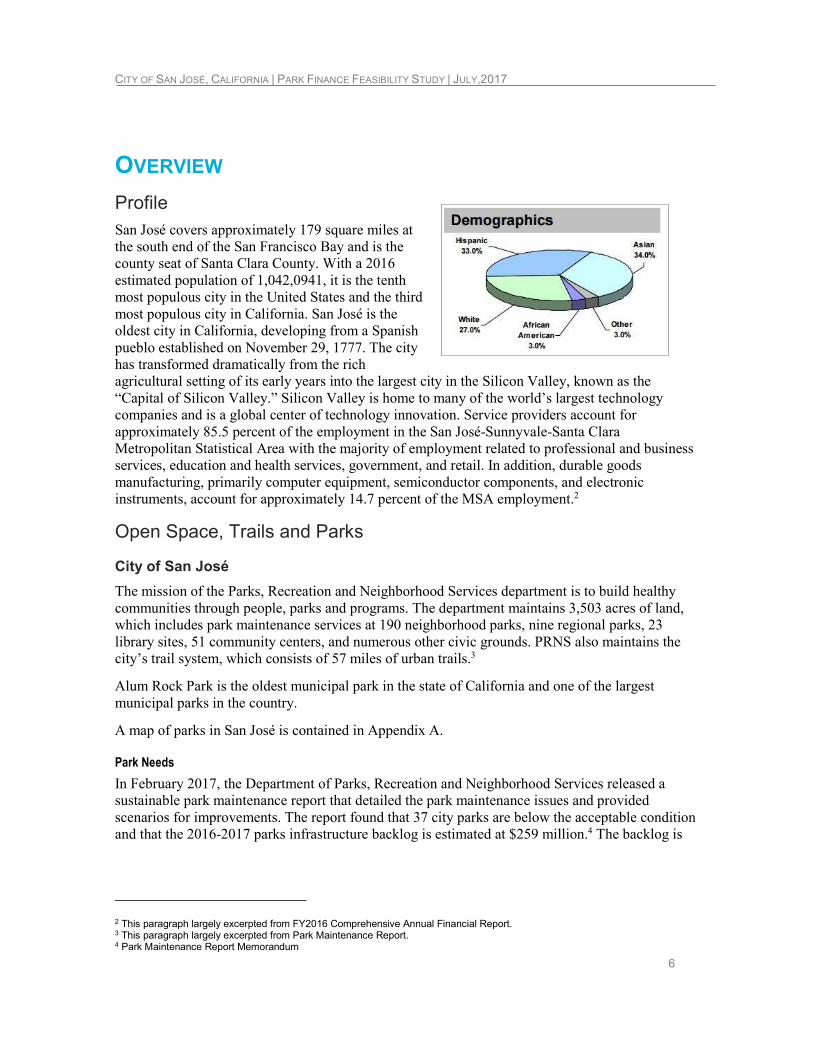
Profile San José covers approximately 179 square miles at the south end of the San Francisco Bay and is the county seat of Santa Clara County. With a 2016 estimated population of 1,042,0941, it is the tenth most populous city in the United States and the third most populous city in California. San José is the oldest city in California, developing from a Spanish pueblo established on November 29, 1777. The city has transformed dramatically from the rich agricultural setting of its early years into the largest city in the Silicon Valley, known as the “Capital of Silicon Valley.” Silicon Valley is home to many of the world’s largest technology companies and is a global center of technology innovation. Service providers account for approximately 85.5 percent of the employment in the San José-Sunnyvale-Santa Clara Metropolitan Statistical Area with the majority of employment related to professional and business services, education and health services, government, and retail. In addition, durable goods manufacturing, primarily computer equipment, semiconductor components, and electronic instruments, account for approximately 14.7 percent of the MSA employment.2
Open Space, Trails and Parks
City of San José
The mission of the Parks, Recreation and Neighborhood Services department is to build healthy communities through people, parks and programs. The department maintains 3,503 acres of land, which includes park maintenance services at 190 neighborhood parks, nine regional parks, 23 library sites, 51 community centers, and numerous other civic grounds. PRNS also maintains the city’s trail system, which consists of 57 miles of urban trails.3
Alum Rock Park is the oldest municipal park in the state of California and one of the largest municipal parks in the country.
A map of parks in San José is contained in Appendix A.
Park Needs
In February 2017, the Department of Parks, Recreation and Neighborhood Services released a sustainable park maintenance report that detailed the park maintenance issues and provided scenarios for improvements. The report found that 37 city parks are below the acceptable condition and that the 2016-2017 parks infrastructure backlog is estimated at $259 million.4 The backlog is
2 This paragraph largely excerpted from FY2016 Comprehensive Annual Financial Report. 3 This paragraph largely excerpted from Park Maintenance Report. 4 Park Maintenance Report Memorandum
CITY OF SAN JOSÉ, CALIFORNIA | PARK FINANCE FEASIBILITY STUDY | JULY, 2017
7
expected to grow by nearly $50 million by the end of FY2017.5 The city spent $18.3 million in capital funds on park maintenance backlog projects last year.
Economic Benefits Study
In early 2016, TPL, in partnership with San José Department of Parks, Recreation and Neighborhood Services, completed a study that analyzed and quantified the economic benefits of the city’s park system. The study examined areas such as enhanced property values, the ability to provide essential natural goods and services, generating health care cost savings, offering recreational opportunities and attracted workers, and boosting the local tourism economy. Among other measurable benefits, the study found that parks increase property tax revenue by $12 million annually, provide storm water management valued at more than $6 million annually, and generate annual medical savings of more than $28 million.
A one page fact sheet of this study, which contains a summary of the economic benefits analyzed, is included in Appendix B.
ParkScore
In 2016, TPL’s ParkScore ranked San José as the 31st best park system in the United States out of the largest 100 cities. A map showing the ParkScore analysis of city residents within a 10 minute walk of a park is contained in Appendix C. Results for 2017 are expected to be released in spring 2017.
Other Public Agency Park Providers
Santa Clara County and the Santa Clara Valley Open Space Authority both provide parks and open space services in the City of San José. Each is briefly described below.
Santa Clara County Parks
The Santa Clara County park system includes 28 regional parks encompassing over 52,000 acres of land.6 It is funded through a dedicated portion of the county property tax.
Santa Clara Valley Open Space Authority
The Santa Clara Valley Open Space Authority is an independent special district separate from Santa Clara County. It is governed by an elected board of directors.
Its jurisdiction is all of Santa Clara County with the exception of lands and communities within the boundaries of Midpeninsula Regional Open Space District and the city of Gilroy. The cities of Milpitas, Santa Clara, Campbell, San José and Morgan Hill participate in OSA. The purpose of the Open Space Authority is to preserve key portions of the natural environment in order to balance continuing urban growth.
The Authority is funded through a $24 a year parcel tax and a benefit assessment.7 The city of San José receives limited financial support from the Authority.
5 Memorandum: Park Bond: Mayor Liccardo and Councilmembers Rocha and Jimenez. February 24, 2017. Accessed March 21, 2017. http://sanJosé.granicus.com/MetaViewer.php?view_id=&event_id=2676&meta_id=622229 6 https://www.sccgov.org/sites/parks/AboutUs/Pages/About-the-County-Regional-Parks.aspx 7 Largely excerpted from http://www.openspaceauthority.org/about/index.html
CITY OF SAN JOSÉ, CALIFORNIA | PARK FINANCE FEASIBILITY STUDY | JULY,2017
8
CITY GOVERNMENT & FINANCES
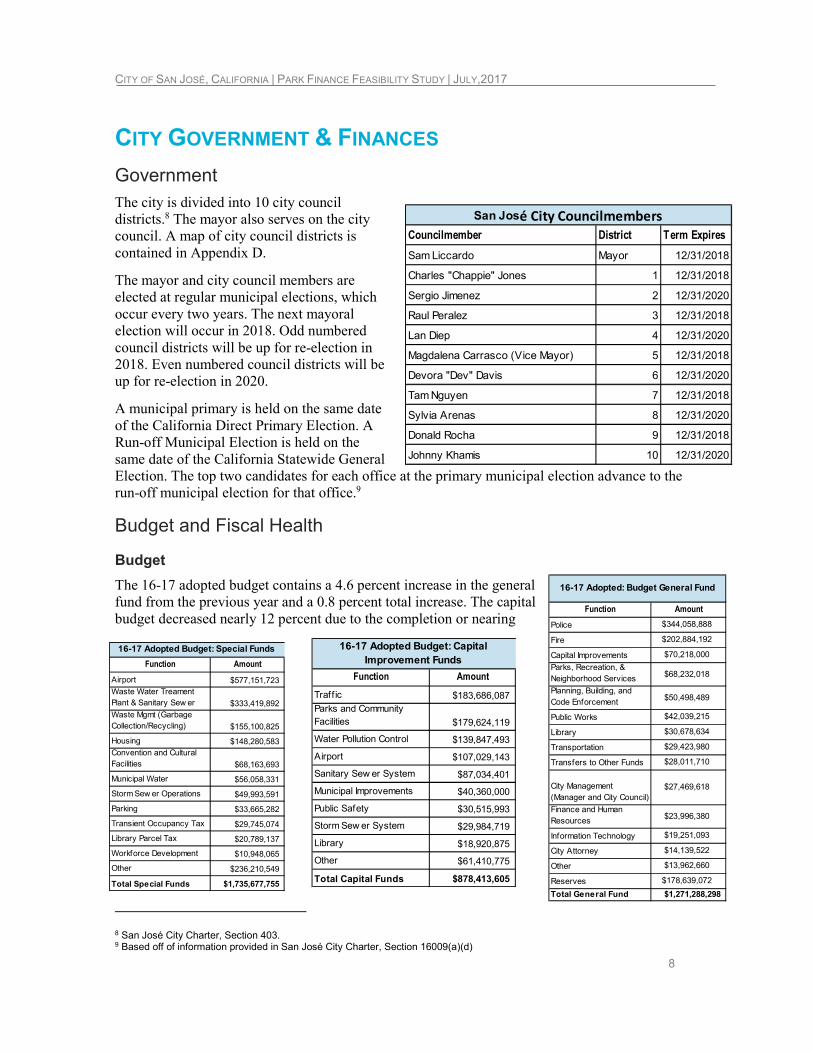
Government The city is divided into 10 city council districts.8 The mayor also serves on the city council. A map of city council districts is contained in Appendix D.
The mayor and city council members are elected at regular municipal elections, which occur every two years. The next mayoral election will occur in 2018. Odd numbered council districts will be up for re-election in 2018. Even numbered council districts will be up for re-election in 2020.
A municipal primary is held on the same date of the California Direct Primary Election. A Run-off Municipal Election is held on the same date of the California Statewide General Election. The top two candidates for each office at the primary municipal election advance to the run-off municipal election for that office.9
Budget and Fiscal Health
Budget
The 16-17 adopted budget contains a 4.6 percent increase in the general fund from the previous year and a 0.8 percent total increase. The capital budget decreased nearly 12 percent due to the completion or nearing
8 San José City Charter, Section 403. 9 Based off of information provided in San José City Charter, Section 16009(a)(d)
Councilmember District Term Expires
Sam Liccardo Mayor 12/31/2018
Charles "Chappie" Jones 1 12/31/2018
Sergio Jimenez 2 12/31/2020
Raul Peralez 3 12/31/2018
Lan Diep 4 12/31/2020
Magdalena Carrasco (Vice Mayor) 5 12/31/2018
Devora "Dev" Davis 6 12/31/2020
Tam Nguyen 7 12/31/2018
Sylvia Arenas 8 12/31/2020
Donald Rocha 9 12/31/2018
Johnny Khamis 10 12/31/2020
San José City Councilmembers
Function Amount
Traff ic $183,686,087Parks and Community Facilities $179,624,119
Water Pollution Control $139,847,493
Airport $107,029,143
Sanitary Sew er System $87,034,401
Municipal Improvements $40,360,000
Public Safety $30,515,993
Storm Sew er System $29,984,719
Library $18,920,875
Other $61,410,775
Total Capital Funds $878,413,605
16-17 Adopted Budget: Capital
Improvement FundsFunction Amount
Airport $577,151,723Waste Water Treament Plant & Sanitary Sew er $333,419,892Waste Mgmt (Garbage Collection/Recycling) $155,100,825
Housing $148,280,583Convention and Cultural Facilities $68,163,693
Municipal Water $56,058,331
Storm Sew er Operations $49,993,591
Parking $33,665,282
Transient Occupancy Tax $29,745,074
Library Parcel Tax $20,789,137
Workforce Development $10,948,065
Other $236,210,549
Total Special Funds $1,735,677,755
16-17 Adopted Budget: Special Funds
Function Amount
Police $344,058,888
Fire $202,884,192
Capital Improvements $70,218,000
Parks, Recreation, & Neighborhood Services $68,232,018
Planning, Building, and Code Enforcement $50,498,489
Public Works $42,039,215
Library $30,678,634
Transportation $29,423,980
Transfers to Other Funds $28,011,710
City Management (Manager and City Council)
$27,469,618
Finance and Human Resources
$23,996,380
Information Technology $19,251,093
City Attorney $14,139,522
Other $13,962,660
Reserves $178,639,072
Total General Fund $1,271,288,298
16-17 Adopted: Budget General Fund
CITY OF SAN JOSÉ, CALIFORNIA | PARK FINANCE FEASIBILITY STUDY | JULY, 2017
9
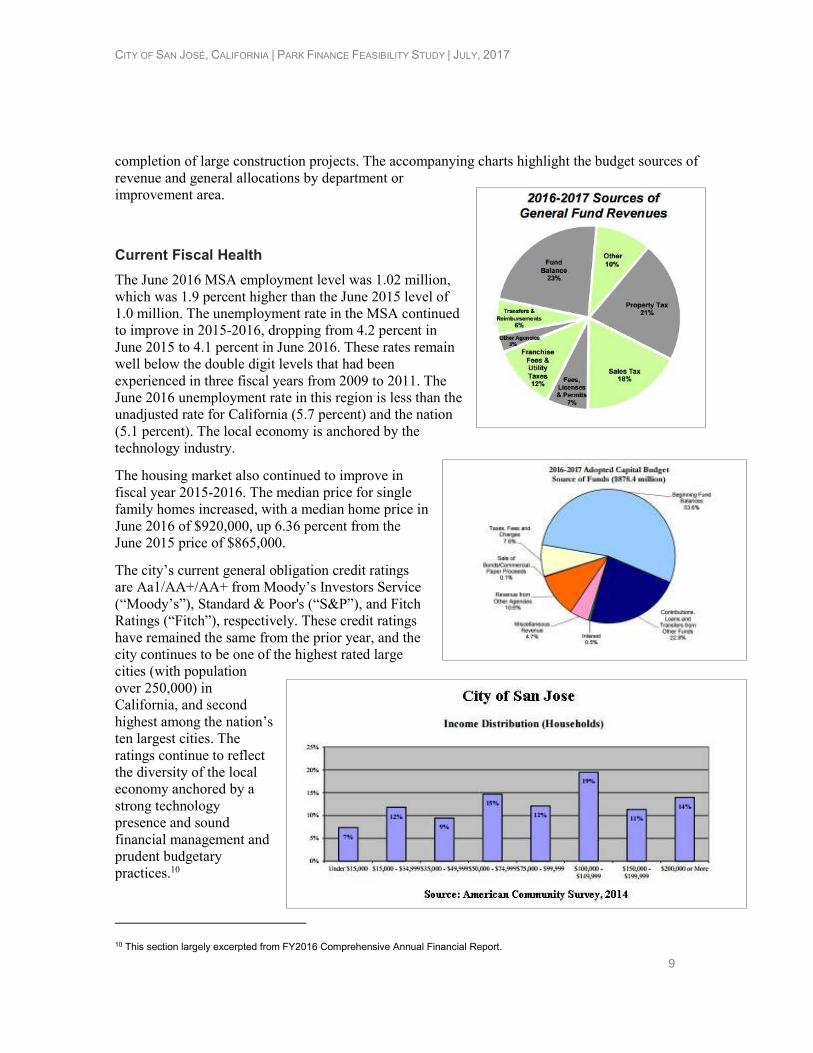
completion of large construction projects. The accompanying charts highlight the budget sources of revenue and general allocations by department or improvement area.
Current Fiscal Health
The June 2016 MSA employment level was 1.02 million, which was 1.9 percent higher than the June 2015 level of 1.0 million. The unemployment rate in the MSA continued to improve in 2015-2016, dropping from 4.2 percent in June 2015 to 4.1 percent in June 2016. These rates remain well below the double digit levels that had been experienced in three fiscal years from 2009 to 2011. The June 2016 unemployment rate in this region is less than the unadjusted rate for California (5.7 percent) and the nation (5.1 percent). The local economy is anchored by the technology industry.
The housing market also continued to improve in fiscal year 2015-2016. The median price for single family homes increased, with a median home price in June 2016 of $920,000, up 6.36 percent from the June 2015 price of $865,000.
The city’s current general obligation credit ratings are Aa1/AA+/AA+ from Moody’s Investors Service (“Moody’s”), Standard & Poor's (“S&P”), and Fitch Ratings (“Fitch”), respectively. These credit ratings have remained the same from the prior year, and the city continues to be one of the highest rated large cities (with population over 250,000) in California, and second highest among the nation’s ten largest cities. The ratings continue to reflect the diversity of the local economy anchored by a strong technology presence and sound financial management and prudent budgetary practices.10
10 This section largely excerpted from FY2016 Comprehensive Annual Financial Report.
CITY OF SAN JOSÉ, CALIFORNIA | PARK FINANCE FEASIBILITY STUDY | JULY,2017
10
The Great Recession in San José and Recent Fiscal Challenges
The city continues to face a long-term service level deficit. This lack of ongoing resources has not allowed the city to restore services to pre-recession levels. Low property tax and sales tax revenue as compared to the size of the city, in addition to costly pension obligations, contribute to a challenging fiscal environment.
Recent Tax Increases In June 2016, San José voters approved a one-fourth (0.25) percent sales tax for 15 years, effective from October 1, 2016, to be available for general purposes; these include improving police response, improving emergency medical/fire response times, repairing potholes and streets, expanding gang prevention, and maintaining the city's long-term financial stability. In addition, an increase to the city’s local business tax was approved by San José voters on November 8, 2016 that will provide for additional funding in the city’s General Fund to support city services.11
San José voters frequently decide on tax measures for county and special district measures. These measures are described in the subsequent elections section of this report.
REVENUE OPTIONS FOR CONSERVATION
Choosing a Funding Strategy Generally, there are three primary types of revenue sources available to local governments to pay for parks and land conservation: discretionary annual spending, creation of dedicated funding streams, and debt financing. The financing options utilized by a community will depend on a variety of factors such as taxing capacity, budgetary resources, voter preferences, and political will.
Significant, dedicated funding generally comes from broad-based taxes and/or the issuance of bonded indebtedness, which often require the approval of voters. In TPL’s experience, local governments that create funding via the legislative process provide substantially less funding than those that create funding through ballot measures. As elected officials go through the process of making critical budgetary decisions, funding for land conservation, parks, and recreation purposes often lags behind other public purposes, and frequently less than what voters would support. It is understandably often difficult to raise taxes without an indisputable public mandate for the intended purpose.
The power of conservation and park finance ballot measures is that they provide a tangible means to implement a local government’s vision. With their own funding, local governments are better positioned to secure scarce funding from state or federal governments or private philanthropic partners. Having a predictable funding source empowers the city or county to establish long-term conservation priorities that protect the most valuable resources, are geographically distributed, and otherwise meet important community goals and values.
Nationwide, a range of public financing options has been utilized by local jurisdictions to fund parks, recreation, and open space, including general obligation bonds, the local sales tax, and the property tax. Less frequently used mechanisms have included special assessment districts, real
11 This paragraph largely excerpted from FY2016 Comprehensive Annual Financial Report.
CITY OF SAN JOSÉ, CALIFORNIA | PARK FINANCE FEASIBILITY STUDY | JULY, 2017
11
estate transfer taxes, impact fees, and income taxes. The ability of local governments to establish dedicated funding sources depends upon state enabling authority, and in some cases, a local charter. In California, bonds, sales taxes and parcel taxes are among the most common funding mechanisms. A mechanism that meets the needs of one community may not necessarily be the right option for a different community.
Park finance measures are not right for every local government or they might not be the right approach at the moment. Budget appropriations and other revenue sources that can be implemented through the legislative process may well serve as short-term funding options while conservation proponents develop a strategy and cultivate broad support for longer-term finance options. Some of the specific finance options available to the city are described in this report.
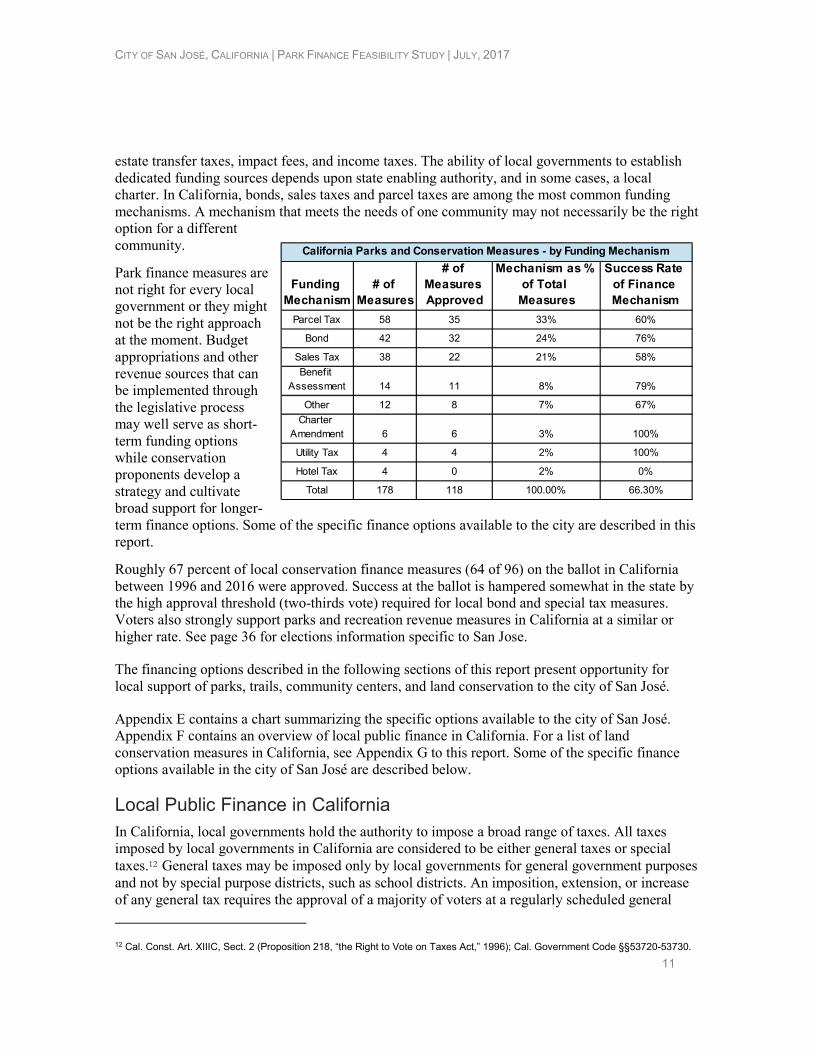
Roughly 67 percent of local conservation finance measures (64 of 96) on the ballot in California between 1996 and 2016 were approved. Success at the ballot is hampered somewhat in the state by the high approval threshold (two-thirds vote) required for local bond and special tax measures. Voters also strongly support parks and recreation revenue measures in California at a similar or higher rate. See page 36 for elections information specific to San Jose.
The financing options described in the following sections of this report present opportunity for local support of parks, trails, community centers, and land conservation to the city of San José.
Appendix E contains a chart summarizing the specific options available to the city of San José. Appendix F contains an overview of local public finance in California. For a list of land conservation measures in California, see Appendix G to this report. Some of the specific finance options available in the city of San José are described below.
Local Public Finance in California In California, local governments hold the authority to impose a broad range of taxes. All taxes imposed by local governments in California are considered to be either general taxes or special
taxes.12 General taxes may be imposed only by local governments for general government purposes and not by special purpose districts, such as school districts. An imposition, extension, or increase of any general tax requires the approval of a majority of voters at a regularly scheduled general
12 Cal. Const. Art. XIIIC, Sect. 2 (Proposition 218, “the Right to Vote on Taxes Act,” 1996); Cal. Government Code §§53720-53730.
Funding
Mechanism
# of
Measures
# of
Measures
Approved
Mechanism as %
of Total
Measures
Success Rate
of Finance
Mechanism
Parcel Tax 58 35 33% 60%
Bond 42 32 24% 76%
Sales Tax 38 22 21% 58%
Benefit Assessment 14 11 8% 79%
Other 12 8 7% 67%
Charter Amendment 6 6 3% 100%
Utility Tax 4 4 2% 100%
Hotel Tax 4 0 2% 0%
Total 178 118 100.00% 66.30%
California Parks and Conservation Measures - by Funding Mechanism
CITY OF SAN JOSÉ, CALIFORNIA | PARK FINANCE FEASIBILITY STUDY | JULY,2017
12
election. Revenues from general taxes are deposited into the jurisdiction’s general fund. Special taxes are imposed for specific purposes by counties, cities and special districts. Any imposition,
extension or increase of a special tax must be approved by two-thirds of votes cast on a measure.13
Any tax imposed by a special district is considered a special tax. Revenues from special taxes are deposited into segregated accounts restricted to the use for which they were imposed and collected.
The State of California authorizes communities to use various revenue sources for parks and recreation purposes including property-related taxes, sales and use taxes, general obligation bonds, the creation of financing districts that serve as financing mechanisms, and the creation of special districts. Each of these funding mechanisms requires approval by the electorate (or landowners in certain cases for special districts) and, in various communities in California, they have enjoyed widespread support.
California charter cities, such as San José, have the power to levy taxes that are not preempted by the state or federal government.14 This report highlights the most common mechanisms for financing conservation, parks, and recreation in California.
Evolution of Voter Approval Requirements for Taxes
In 1978, California voters approved Proposition 13, which lowered the property tax rate to a maximum of one percent for general purposes and required special taxes to be approved by two-thirds of voters. In 1986, voters approved Proposition 46, which allowed local governments to raise the property tax rate to finance infrastructure bonds if approved by two-thirds of local voters.15 In 1982, the case City and County of San Francisco v. Farrell defined a special tax as a tax levied for a specific purpose. In 1996, California voters approved Proposition 218, which required all general taxes to be approved by a simple majority of voters; and required all parcel taxes to be levied as special taxes. Proposition 218 also restricted the ability of local governments to impose fees and assessments.
Voter-Approved Public Finance Options There are multiple options available to the City of San José. Finance mechanisms that would create broad-based and stable funding for parks, recreation, and open space are discussed below.
Bonds To raise funds for capital improvements, such as land acquisition or building construction, counties, cities and districts may issue bonds.16 In California, the major types of bonds include: (1) general obligation (“GO”) bonds, which are guaranteed by the local taxing authority; (2) revenue bonds that are paid by project-generated revenue or dedicated revenue stream such as a particular tax or fee, and (3) limited tax bonds, which are paid by voter-approved transactions and use tax
13 See Cal. Government Code §§50075-50077.5 (containing additional requirements for voter-approved special taxes). 14 http://sgf.senate.ca.gov/sites/sgf.senate.ca.gov/files/REVENUESANDRESPONSIBILITIES.pdf 15 “A Look at Voter-Approval Requirement for Local Taxes.” Legislative Analyst’s Office – The California Legislature’s Nonpartisan Fiscal and Policy Advisor. March 20, 2014. Accessed June 10, 2016. http://www.lao.ca.gov/reports/2014/finance/local-taxes/voter-approval-032014.aspx 16 Cal. Public Resources Code §5305.
CITY OF SAN JOSÉ, CALIFORNIA | PARK FINANCE FEASIBILITY STUDY | JULY, 2017
13
revenue. Generally, bond proceeds are limited to capital investments in new or existing facilities and may not be used for regular operations and maintenance purposes.17
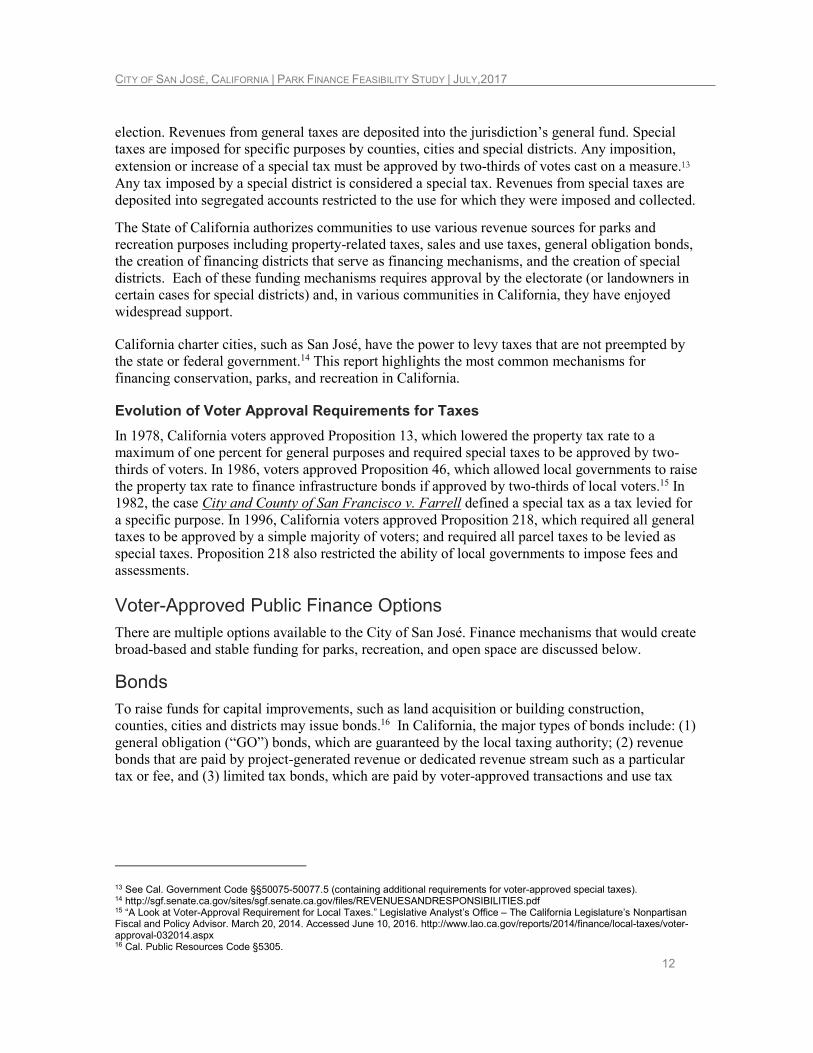
In California, general obligation bonds are repaid with proceeds from ad valorem property taxes. These are calculated based on the assessed value of land and improvements. Voters do not approve a fixed tax rate for general obligation bond indebtedness. Instead, the rate adjusts annually so that it raises the amount of money needed to pay the bond
costs.18
Voter-approved general obligation bonds provide the lowest cost of bond types and provide a new and dedicated revenue source in the form of additional ad valorem taxes to pay debt service. The issuance of a general obligation bond must be approved by a two-thirds majority of those voting on the bond proposition.19 The use of bond proceeds is limited to expenditures to construct, acquire, and make improvements to real property such as public buildings, roads, school facilities, and equipment.20 Statewide, the average property tax bill includes voter-approved debt rates that total about one-tenth of one percent of assessed value.21
This section will examine general obligation bonds only.
Debt and Property Tax in the City of San José
General obligation debt may not exceed 15 percent of the city’s total assessed value.22 For Fiscal Year 2016, this is $23.39 billion. In FY2016, the city had $387.4 million in general obligation bond debt. The city’s legal debt margin is approximately $23 billion. The total debt applicable to the limit is 1.7 percent. Debt per capita has decreased in recent years. General obligation debt does not
17 Federal government rules governing the issuance of tax-exempt bonds limit the use of proceeds to capital purposes such that only a small fraction of bond funds may be used for maintenance or operations of facilities. State and local laws may further limit the use of bond proceeds. 18 http://www.lao.ca.gov/reports/2012/tax/property-tax-primer-112912.aspx 19 California State Constitution, Article 16 – Public Finance, Section 18 20 California State Constitution, Article 16 – Public Finance, Section 16(c) 21 http://www.lao.ca.gov/reports/2012/tax/property-tax-primer-112912.aspx 22 San José City Charter Section 1216.
Fiscal YearG.O. Debt
Outstanding
2007 517,830,000$
2008 535,832,000$
2009 526,592,000$
2010 506,964,000$
2011 487,034,000$
2012 467,104,000$
2013 447,180,000$
2014 427,256,000$
2015 407,332,000$
2016 387,403,000$
G.O. Bonded Debt - Last 10
Years
CITY OF SAN JOSÉ, CALIFORNIA | PARK FINANCE FEASIBILITY STUDY | JULY,2017
14
include debt for the CSJFA, Airport, CWFA, or Successor Agency to the Redevelopment Agency, as well as any other revenue bonds.
Using General Obligation Bonds for Parks and Recreation Purposes in San José
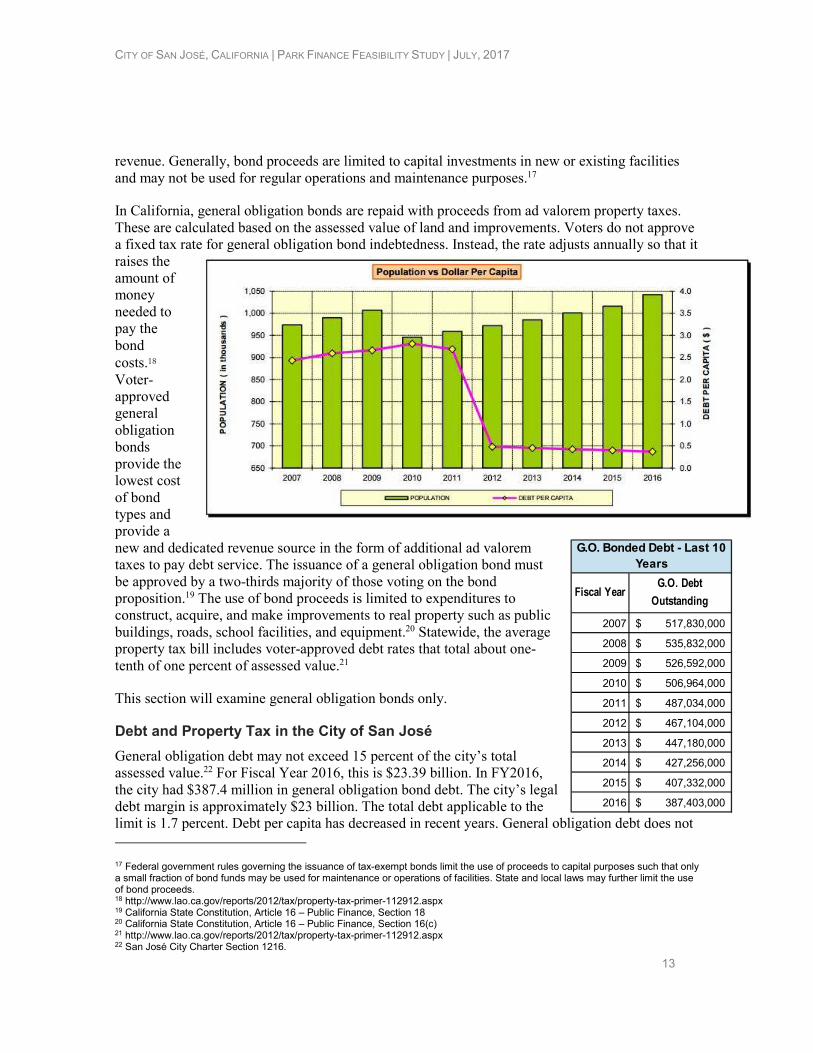
The City of San José could generate substantial funds for parks at a relatively low cost to taxpayers by issuing bonds. For instance, a $135 million, twenty-year general obligation bond for would require a property tax rate increase of $0.035 per $1,000 to meet the annual debt service and cost the average homeowner about $30 per year, or about eight cents per day. Revenue can only be used for capital projects and not for ongoing operations and maintenance.
The accompanying table illustrates the estimated annual debt service, required property tax increase, and annual household cost of different G.O. bond issues.
TPL’s bond cost calculations provide an estimate of debt service, tax increase, and cost to the average homeowner in the community of potential bond issuances for parks and land conservation. Assumptions include the following: the entire debt amount is issued in the first year and payments are equal until maturity; 20-year maturity; and four percent interest rate. Property tax estimates assume that the county would raise property taxes to pay the debt service on bonds; however other revenue streams may be used. The cost per household represents the average annual impact of increased property taxes levied to pay the debt service. The estimates do not take into account growth in the tax base due to new construction and annexation over the life of the bonds. The jurisdiction’s officials, financial advisors, bond counsel and underwriters would establish the actual terms of any bond. Typically, bond proceeds are limited to capital projects and may not be used for operations and maintenance purposes.23 The acquisition or development of conservation and park lands could result in the future need for additional funds for maintenance and operations.
Appendix I contains examples of successful ballot language for park and conservation bond measures in California.
23 Federal IRS rules governing the issuance of tax-exempt bonds limit the use of proceeds to capital purposes such that only a small fraction of bond funds may be used for maintenance or operations of facilities. State and local laws may further limit the use of bond proceeds.
Bond Issue Annual Debt ServiceProperty Tax
Rate Increase
Cost/Year/
$100k Value
Home
Cost/Year/Average
Home
$50,000,000 $3,679,088 0.024 $2.19 $11.06
$75,000,000 $5,518,631 0.035 $3.29 $16.59
$100,000,000 $7,358,175 0.047 $4.39 $22.13
$135,000,000 $9,933,536 0.064 $5.93 $29.87
$150,000,000 $11,037,263 0.071 $6.58 $33.19
$250,000,000 $18,395,438 0.118 $10.97 $55.32
$350,000,000 $25,753,613 0.165 $15.36 $77.44
Estimated General Obligation Bond Financing Costs - City of San Jose, CA
Figures from FY16 CAFR and Q32016 City Housing Market Report. Average assessed value
of a single family home is $475,793. $7,000 homeowners exemption. Assessed value as of
June 30, 2016 of $155.9 billion.
CITY OF SAN JOSÉ, CALIFORNIA | PARK FINANCE FEASIBILITY STUDY | JULY, 2017
15
Process for Implementation
The city council must pass a resolution, with a two-thirds majority of all its members, determining that the public interest or necessity demands the acquisition, construction or completion of any municipal improvement or capital investment in existing facilities.24
At any subsequent meeting, the city council must pass an ordinance, with a two-thirds majority vote of all its members, ordering the submission of the proposition of incurring bonded debt. The purpose of the bonded debt must be for the same purpose as set forth in the initial city council resolution.25
The ordinance must include the following information: the object and purpose of incurring the debt, the estimated cost of the public improvements, the amount of the principal on the indebtedness (which shall not exceed eight percent, and need not be recited if it does not exceed 4.5 percent), the date of the election, the manner of holding the election, and the procedure for voting for or against the proposition.26 The ordinance shall be published once a day for at least seven days in a newspaper published at least six days a week in the city.27
If two-thirds of those voting on the proposition vote for it, the measure passes and the bonds may be issued.28
The city council must pass an ordinance calling the election at least 88 days prior to the date of the election. At the same time or in conjunction with, the city council should adopt and file a resolution requesting a consolidation of the election with Santa Clara County. The city council must file this resolution with the Santa Clara County Board of Supervisors and a copy with the elections officials (County Clerk). The resolution must do all of the following:
• Request that the city election be consolidated with the statewide election
• Set forth the exact form of the question or proposition to be voted upon at the election, as it is to appear on the ballot.
• Acknowledge that the consolidated election will be held and conducted in the manner prescribed in California Elections Code Section 10418.
A Tax Rate Statement must also be filed by the 88th day before the election.
California law states that when a city planning commission and the legislative body approve a group of municipal projects as constituting a city plan, the legislative body may submit a single bond proposition covering the entire group of improvements.29
If the measure is approved, the city may begin levying the amount necessary to pay principal and interest on the bonds on the next property tax bill.30
24 California Elections Code §43607. 25 California Elections Code §43608. 26 California Elections Code §43610 27 California Elections Code §43611 28 California Elections Code §43614 29 California Elections Code §43603 30 “What is a General Obligation Bond?” California Tax Data. Accessed June 24, 2016. http://www.californiataxdata.com/pdf/GOBond.pdf
CITY OF SAN JOSÉ, CALIFORNIA | PARK FINANCE FEASIBILITY STUDY | JULY,2017
16
A local tax measure may be proposed via a local voter initiative. This process is explained further in the report, in the section entitled “Initiative and Referendum.”
Examples
California cities often pass bond measures for parks and recreation purposes. While cities also pass bond measures for a variety of purposes that include parks, this report focuses just on measures specifically for parks, recreation, and conservation purposes. Bond measures proposed by special districts for parks and recreation purposes are discussed in the special district section of this report.
San José
In 2000, city voters approved a $228 million bond, known as the San José Safe Neighborhood Parks and Recreation Bond or Measure P, with more than 78 percent support. Projects funded included the renovation of 90 play areas, 28 restrooms, and 9 community centers. It also included construction of a lighted softball complex and soccer complex, as well as enhancements to a number of parks and extension of trails.31 Ballot language for this measure is included in Appendix H. In total, the bond funded 97 projects. The last bond-funded projects were completed in 2016.32
Oakland
In Oakland, voters approved three bonds for parks and open space in the last 30 years. In 1990, voters approved a $60 million bond for open space, parks and recreation. In 1996, voters approved a $45.42 million bond for recreation and parks. In 2002, voters approved a $198.25 million bond for watershed protection and open space. Voters also approved a $600 infrastructure bond in November 2016 that contains approximately $35 million for parks and recreation projects.
Martinez
In 2008, voters in Martinez approved a $30 million bond to make safety improvements to neighborhood parks, playgrounds, sporting fields and a pool – as well as to renovate a library and improved disabled access to parks and libraries. The measure passed with nearly 69 percent support.33
Parcel Tax A parcel tax is a levy on parcels of property and is typically set at some fixed amount per parcel such as use, size, and/or number of units on each parcel. Parcel taxes cannot be based on a property’s value.34
The California Taxpayers Association identified the two most common types of parcel taxes as “fixed amount flat rate” and “fixed amount square footage” – both are described in more detail below. Parcel taxes are generally based upon the use, size and/or number of units on each parcel. Generally, state law requires that parcel taxes apply uniformly to all types of property. Some jurisdictions include exemptions for parcels owned by seniors, low income households, and taxpayers with disabilities.
31 http://www.sanJoséca.gov/DocumentCenter/Home/View/30 32 http://sanJoséca.gov/DocumentCenter/View/37052 33 http://www.smartvoter.org/2008/11/04/ca/cc/meas/H/ 34 “A Look at Voter-Approval Requirement for Local Taxes.” Legislative Analyst’s Office – The California Legislature’s Nonpartisan Fiscal and Policy Advisor. March 20, 2014. Accessed June 10, 2016. http://www.lao.ca.gov/reports/2014/finance/local-taxes/voter-approval-032014.aspx
CITY OF SAN JOSÉ, CALIFORNIA | PARK FINANCE FEASIBILITY STUDY | JULY, 2017
17
Parcel taxes are used to provide various local government and school services. Under Proposition 13, parcel taxes are the only source of locally-controlled, general purpose tax revenue for most special districts, school districts, and community college districts.35
A parcel tax is a special tax and requires two-thirds voter approval for implementation.
Most parcel taxes are flat-rate taxes –that is, the same regardless of the parcel’s size or use. From 2002 to 2012, flat rate taxes represented 86 percent of the 389 parcel taxes proposed by school districts, 51 percent of those proposed by cities, and 75 percent of those proposed by special districts. The median rate for all parcel taxes was $96 per parcel. Among cities that enacted flat-rate parcel taxes during this period, the median was $60 per parcel.
From 2002 to 2012, cities placed 124 parcel tax proposals on the ballot and 59 measures passed – a 48 percent success rate. In comparison, 60 percent of school district measures and 45 percent of special district measures passed.36 Flat rate taxes represented 51 percent of those proposed by cities. Local governments are not required to include a sunset date for parcel taxes. About one-third of parcel taxes are imposed in perpetuity.
Using the Parcel Tax for Parks and Land Conservation
California municipalities, counties and special districts often use parcel taxes to generate funding for parks and land conservation. Since 1990, nine communities have passed a parcel tax for land conservation and open space purposes.
In November 2016, nearly 75 percent of voters in Los Angeles County approved a parcel tax to fund parks in perpetuity. This measure is discussed in greater detail later in this report. County voters narrowly rejected a parcel tax for parks in 2014.
In June 2016, voters in the nine San Francisco Bay Area counties – Alameda, Contra Costa, Marin, Napa, San Francisco, San Mateo, Santa Clara, Solano, and Sonoma – approved a $12 per year per parcel tax to fund efforts for restoration efforts in the San Francisco Bay. This first of its kind measure is expected to generate $500 million over 25 years.
In 2014, voters in the Santa Clara County Open Space Authority approved a $24 per parcel tax for 15 years to improve parks, open spaces and trails and to protect land, water quality and wildlife habitat. In 2012, voters in the Santa Monica Mountains Recreation and Conservation Authority approved a $24 per parcel tax. In 2005, voters in the Marinwood Community Services District in Marin County approved a proposal to increase their parcel fee by $75 to $150 to support parks and open space.
In the early 2000s, voters in the California cities of Davis, Monrovia, San Carlos, and Santa Monica each approved parcel tax measures to fund the protection of open space, parks, trails, and recreation. California counties and special districts, including the Marin County Open Space District, Sacramento County, Santa Clara County Open Space Authority, and Mountains Recreation and Conservation Authority, also approved parcel tax measures to fund the protection of open space.
35 Ibid. 36 Sonstelle, Jon. Parcel Taxes as a Local Revenue Source in California. Public Policy Institute of California. April 2015, 4.
CITY OF SAN JOSÉ, CALIFORNIA | PARK FINANCE FEASIBILITY STUDY | JULY,2017
18
Voters also approve parcel tax measures to exclusively support park development and maintenance. Between 2008 and 2015, the time period for which extensive data is readily available, voters approved more than 15 parcel tax measures for parks and recreation purposes. These include cities such as Davis, Wildomar, Carmichael, Clayton and Berkeley.
The proceeds of a parcel tax may be used for multiple purposes, as long as such purposes are described in the ballot measure. State statutes are vague regarding for what purposes tax proceeds may be spent. Revenue could potentially be used to pay debt service on a city-issued bond. However, purposes would ultimately be restricted based on ballot language.
State statutes do not explicitly describe maximum terms for parcel taxes. Some jurisdictions impose parcel taxes for a specified number of years and others impose permanent parcel taxes. Examples of jurisdictions that impose permanent parcel taxes for parks, recreation, and conservation purposes include Los Angeles County, Monterey Peninsula Regional Park District, Santa Cruz County Park and Recreation District, Santa Monica, and Davis.
Appendix J contains examples of successful ballot language for park and conservation city parcel tax measures.
Using the Parcel Tax for Parks and Enhanced Park Access in San José
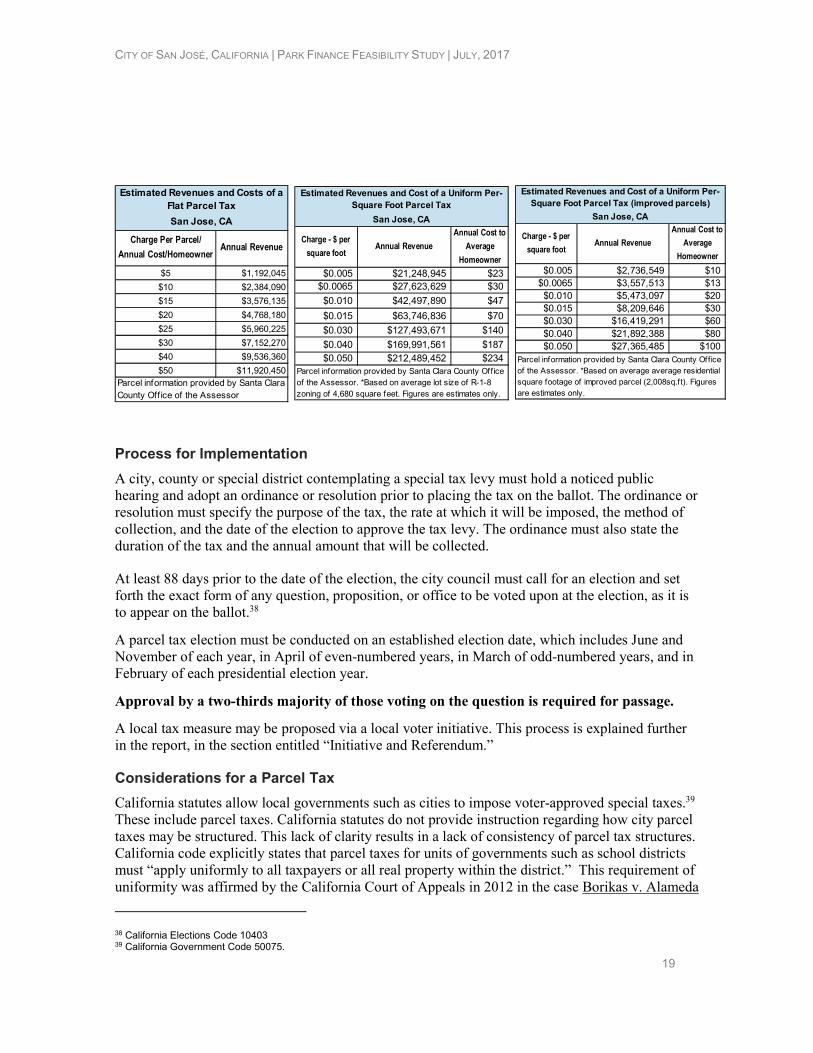
The City of San José could seek voter approval for a parcel tax for conservation, parks, and recreation purposes.37 The Trust for Public Land analyzed two primary options for imposing a parcel tax in San José: a flat per parcel tax and a tax based on the square footage of a parcel. Each is uniform in nature and uses readily available parcel data to estimate as described below. These estimates do not account for property exempt from property taxation as described in the California Constitution. Tables corresponding to each option are on the following page.
Uniform flat per parcel tax
Based on the number of taxable parcels in the city of San José (238,409), a relatively small parcel tax levied citywide would produce considerable annual revenue. For example, a flat $30 per parcel tax would generate about $7.1 million in annual revenue.
Uniform square-footage tax
Alternatively, a special parcel tax could be levied as a fixed amount per square footage on all parcels within the city. A modest charge per square foot would generate substantial revenue for the city. For example, a tax of $0.0065 per square foot would generate approximately $27.6 million in annual revenue and cost homeowners with an average sized home $30 annually. If only improved parcels are subject to the tax, then a tax of $0.015 would cost the average homeowner $30 and would general roughly $8.2 million annually. TPL’s per square foot of improved property estimates are based on the best available data but should be considered approximations
Other Parcel Tax Structures
Many California cities impose parcel taxes that impose rates in a non-uniform manner. Additional research and data would be necessary to estimate revenue and cost per household. Subsequent sections of this report discuss important considerations regarding a non-uniform parcel tax as well as examples of such taxes currently in place, including San José.
37 California Code §37100.5.
CITY OF SAN JOSÉ, CALIFORNIA | PARK FINANCE FEASIBILITY STUDY | JULY, 2017
19
Charge Per Parcel/
Annual Cost/HomeownerAnnual Revenue
$5 $1,192,045
$10 $2,384,090
$15 $3,576,135
$20 $4,768,180
$25 $5,960,225
$30 $7,152,270
$40 $9,536,360
$50 $11,920,450
Estimated Revenues and Costs of a
Flat Parcel Tax
San Jose, CA
Parcel information provided by Santa Clara County Off ice of the Assessor
Charge - $ per
square footAnnual Revenue
Annual Cost to
Average
Homeowner
$0.005 $21,248,945 $23$0.0065 $27,623,629 $30
$0.010 $42,497,890 $47
$0.015 $63,746,836 $70
$0.030 $127,493,671 $140
$0.040 $169,991,561 $187$0.050 $212,489,452 $234
Estimated Revenues and Cost of a Uniform Per-
Square Foot Parcel Tax
San Jose, CA
Parcel information provided by Santa Clara County Off ice of the Assessor. *Based on average lot size of R-1-8 zoning of 4,680 square feet. Figures are estimates only.
Charge - $ per
square footAnnual Revenue
Annual Cost to
Average
Homeowner
$0.005 $2,736,549 $10$0.0065 $3,557,513 $13$0.010 $5,473,097 $20$0.015 $8,209,646 $30$0.030 $16,419,291 $60$0.040 $21,892,388 $80$0.050 $27,365,485 $100
Parcel information provided by Santa Clara County Office of the Assessor. *Based on average average residential square footage of improved parcel (2,008sq.f t). Figures are estimates only.
Estimated Revenues and Cost of a Uniform Per-
Square Foot Parcel Tax (improved parcels)
San Jose, CA
Process for Implementation
A city, county or special district contemplating a special tax levy must hold a noticed public hearing and adopt an ordinance or resolution prior to placing the tax on the ballot. The ordinance or resolution must specify the purpose of the tax, the rate at which it will be imposed, the method of collection, and the date of the election to approve the tax levy. The ordinance must also state the duration of the tax and the annual amount that will be collected.
At least 88 days prior to the date of the election, the city council must call for an election and set forth the exact form of any question, proposition, or office to be voted upon at the election, as it is to appear on the ballot.38
A parcel tax election must be conducted on an established election date, which includes June and November of each year, in April of even-numbered years, in March of odd-numbered years, and in February of each presidential election year.
Approval by a two-thirds majority of those voting on the question is required for passage.
A local tax measure may be proposed via a local voter initiative. This process is explained further in the report, in the section entitled “Initiative and Referendum.”
Considerations for a Parcel Tax
California statutes allow local governments such as cities to impose voter-approved special taxes.39 These include parcel taxes. California statutes do not provide instruction regarding how city parcel taxes may be structured. This lack of clarity results in a lack of consistency of parcel tax structures. California code explicitly states that parcel taxes for units of governments such as school districts must “apply uniformly to all taxpayers or all real property within the district.” This requirement of uniformity was affirmed by the California Court of Appeals in 2012 in the case Borikas v. Alameda
38 California Elections Code 10403 39 California Government Code 50075.
CITY OF SAN JOSÉ, CALIFORNIA | PARK FINANCE FEASIBILITY STUDY | JULY,2017
20
Unified School District, which invalidated a parcel tax that charged different rates to homeowners and commercial property owners. This opinion could be read broadly to apply to all types of parcel taxes or narrowly just to school districts.
California statutes authorizing parcel taxes for school districts allow for limited exemptions or rate classifications. For example, community college districts may tax unimproved property at a lower rate than improved parcels. School districts may provide parcel tax exemptions for seniors and the disabled. Because statutes authorizing parcel taxes by other local governments such as cities do not provide specifically for exemptions or different rates, there is risk of challenge that the tax is not uniformly levied if other exemptions are authorized or different classifications are imposed. This challenge has been somewhat tempered by ballot language drafting that requires the tax to be levied uniformly on all properties and allows certain owners of parcels to apply annually for an exemption. In addition, many ordinances have provided that “annual” exemptions are available only to the “fullest extent permitted by law.”
While California statutes are silent as to whether cities and most other units of local government may impose parcel taxes allowing unimproved to be taxed at a lower rate than improved property, many parcel taxes do so. Vacant and unimproved land is often taxed at a lower rate than improved property and sometimes is not taxed at all under a local government’s parcel tax structure.40 Cities that impose parcel taxes that do not tax unimproved property include Livermore, San Leandro, Monterey Park, and El Paso de Robles. Other cities impose parcel taxes that do not exempt unimproved property, but tax it at a lower rate than improved property. These are just selected examples, The Trust for Public Land did not conduct a comprehensive review of city parcel taxes in California.
Examples
Los Angeles County
On November 8, 2016, Los Angeles County voters overwhelmingly approved a ballot measure that imposed a parcel tax to generate dedicated funding for park projects. Nearly 75 percent of voters supported the measure. The measure will generate about $95 million annually in perpetuity. The tax is levied by the Los Angeles County Regional Park and Open Space District. The tax imposes a 1.5-cent levy per square foot of building area and would cost a 1,500 square foot house about $22.50 a year. California statutes authorizing park and recreation districts allow districts to impose parcel taxes at a uniform rate to all taxpayers or for all properties, except that unimproved property may be taxed at a lower rate than improved property.41 The measure also allows for future increases based on inflation or any new improvements to building or land. County officials commissioned a parks needs assessment across the county, which found large disparities in park access across the county.42 The project represented an unprecedented effort to document existing parks and recreation facilities in cities and unincorporated communities and to use these data to determine the scope, scale, and location of park need in Los Angeles County. The needs assessment helped local officials, park agencies, and residents understand the future steps that need to be taken to ensure all
40 “Piecing Together California’s Parcel Taxes.” California Tax Foundation. September 2014. Accessed June 29, 2017. http://www.caltaxfoundation.org/reports/parceltax-fullreport.pdf 41 California Public Resource Code 5789.1. 42 Sewell, Abby. “L.A. County voters to decide on parks tax, possible homeless tax in November.” Los Angeles Times. July 5, 2016. Accessed July 12, 2016.
CITY OF SAN JOSÉ, CALIFORNIA | PARK FINANCE FEASIBILITY STUDY | JULY, 2017
21
communities have adequate access to thriving parks.43 The November 2016 measure reflected many of the important findings of the needs assessment.44 The measure includes an equity set-aside to ensure funding is available for park-poor communities where residents do not have adequate access to a park or open space.
Definition of Improved Property/ Application of the Tax
The special tax is levied on all improved parcels, based on the square footage of structural improvements on that parcel. Structural improvements means the building floor area on a parcel. Properties owned by public agencies devoted to a public use or to protect public health or safety will not be assessed the tax.45
San Jose
In June 2014, San José voters approved a measure that renewed an existing parcel tax originally approved in 2004 to support city libraries. The measure received more than 81 percent support and provided about $8 million annually, or roughly 22 percent of the total budget, for the library system.
The tax imposes different rates based on land use classifications. The initial rate for a single-family residential parcel is $29.84. Other land use classifications are multi-family residential, industrial, commercial, professional, and vacant land. The measure also includes additional surcharges based on parcels that exceed a base number of residential units or acreage. In addition, the city council may adjust the rates by the rate of inflation, not to exceed three percent. The measure included a sunset provision that allows the parcel tax to expire in 2040, includes independent audits, and citizen oversight. The measure also exempts parcels owned by churches, owned by religious organizations and used for religious worship, and parcels owned by governmental entities.
Ballot language and detailed fee structure for this parcel tax is included in Appendix R.
Berkeley
In November 2008, City of Berkeley voters approved a parcel tax for fire safety and emergency services. The tax was imposed at a rate of $0.04083 per square foot of improvements in dwelling units and $0.06179 per square foot on all other improvements. The measure also authorized the city council to increase the tax rate in future years based on CPI projections. In 2014, the tax was estimated to collected $4.095 million.
The measure passed with nearly 72 percent support.
Davis
In Davis (Yolo County), voters in 2012 passed a Park Maintenance Tax and Open Space Protection Tax with 84 percent of the vote. The tax was a continuation of an existing parcel tax. Voters
43 “Executive Summary of the Los Angeles Countywide Comprehensive Parks & Recreation Needs Assessment.” Los Angeles County Department of Parks & Recreation. May 3, 2016. Accessed August 4, 2016. http://lacountyparkneeds.org/wp-content/uploads/2016/05/Executive-Summary.pdf 44 “Los Angeles Countywide Comprehensive Parks & Recreation Needs Assessment.” Accessed August 4, 2016. Lacountyneeds.org 45 http://rposd.lacounty.gov/wp-content/uploads/2016/10/Measure_A_Ballot.pdf
CITY OF SAN JOSÉ, CALIFORNIA | PARK FINANCE FEASIBILITY STUDY | JULY,2017
22
previously approved the $49 per residential parcel tax in 2000 and 2006. This is a non-uniform parcel tax with different rates for different types of property. According to documents and reports prepared surrounding the 2012 extension, the tax generated approximately $1.37 million annually and accounted for about 25 percent of the money the city dedicates to maintaining parks.46
Qualified low-income homeowners may receive a full refund of the Davis Park Maintenance Tax and Open Space Protection Tax. This is an annual refund program, not an exemption from the tax that appears on a property tax bill.47
Sales Tax
Background
California’s state and local governments levy a tax on retail sales of tangible goods. This tax consists of a sales tax on retailers and a use tax on buyers. In 2003, Governor Davis signed SB566, which gave every county and every city authority to seek voter approval of a local transactions and use tax increase under certain conditions.
California has a state-mandated minimum sales tax of 7.25 percent. This consists of a 6.25 percent state sales tax and a uniform 1.0 percent uniform local tax for counties and cities.48 49 Many of California’s cities, counties, towns and communities have special taxing jurisdictions (districts), which may impose a transactions (sales) and use tax. These districts increase the tax rate in a particular area by adding the district tax to the statewide tax. The rates for these districts range from 0.10 percent to 1.00 percent per district. More than one district tax may be in effect in a given location.50
The total aggregate sales and use taxes for all taxing entities in Santa Clara County may not exceed two percent, for a total of 9.25 percent.51 52 In recent years, some localities have received permission from the state to levy a rate in excess of this maximum. As of August 2016, eight communities currently had a 9.75 percent sales tax rate. The state’s average rate was roughly 8.5 percent.
46 Sakash, Tom. “Davis voters to decide fate of parks tax.” The Davis Enterprise. April 27, 2012. Accessed July 18, 2016. http://www.davisenterprise.com/local-news/city/davis-voters-to-decide-fate-of-parks-tax/ 47 Local governments sometimes utilize the ―Measure A and Bǁ approach. In this case, the local agency places two measures before the voters: Measure A – a general tax and Measure B – an advisory measure requesting the local legislative body use funds raised by Measure A for a specific purpose. It is important to remember that while this approach may help garner voter support, the advisory measure is not legally binding. 48 Cal. Revenue and Taxation Code §6051, §6201; Cal. Const. Art. XIII, Sec. 35. 49 Cal. Revenue and Taxation Code §7202(a), §7203 (“the Bradley-Burns Uniform Local Sales and Use Tax Law”). 50 Cal. Revenue and Taxation Code §7202(a), §7203 Food for home consumption and utilities are exempted from sales and use taxes. 51 California Revenue and Taxation Code §7251.1. And http://info.sen.ca.gov/pub/bill/sen/sb_0551-0600/sb_566_cfa_20030910_013808_asm_floor.html. Prior to the passage of SB566 in 2003, cities had to first receive legislative approval to impose an additional sales tax. 52 Except for Los Angeles, Alameda and Contra Costa Counties where the maximum may not exceed 2.5 percent
CITY OF SAN JOSÉ, CALIFORNIA | PARK FINANCE FEASIBILITY STUDY | JULY, 2017
23
The proceeds of the sales tax for specific purposes may be used to finance capital outlay expenditures through the issuance of limited tax bonds – bonds which are secured by a specific tax or category of taxes.
Recent Trends
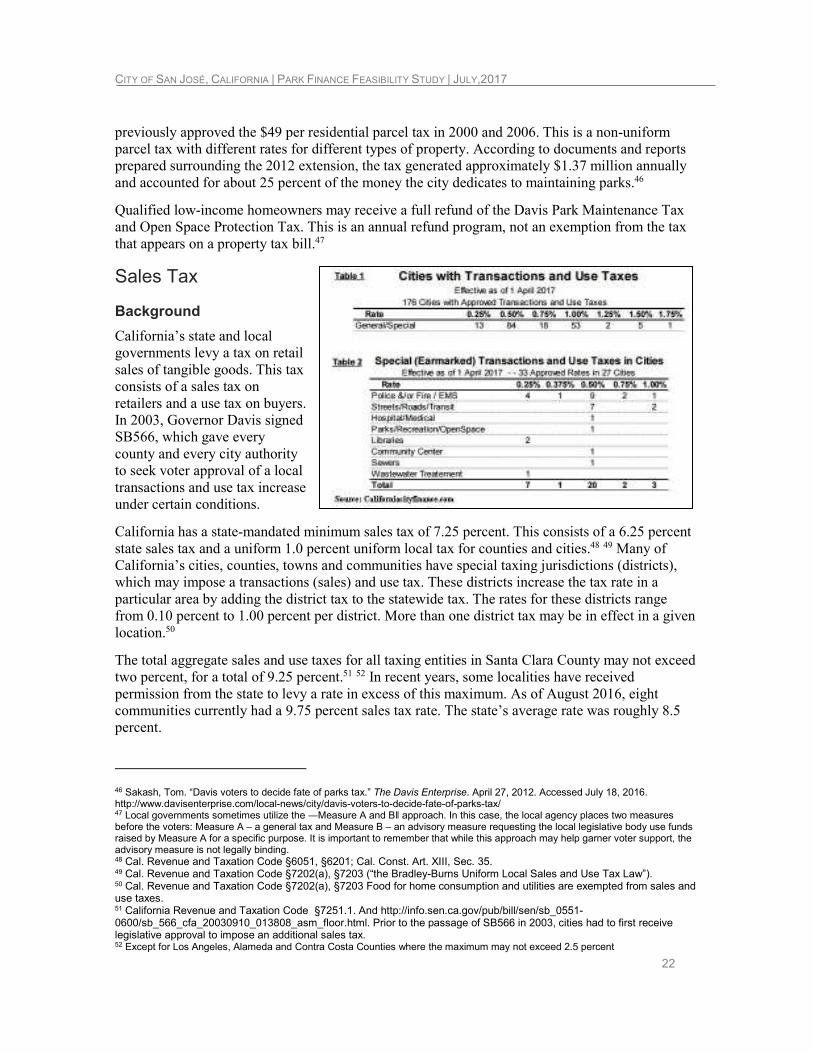
As of April 2016, there were currently 176 cities (not including San Francisco City/County) with voter approved transactions and use tax rates. Although most are general purpose, majority approval rates, twenty-33 cities have special purpose, two-thirds approval rates. Greenfield in Monterey County has the highest combination of city rates, 1.75 percent general purpose, including a one percent rate originally approved in 2012 and a 0.75 percent additional rate approved in November 2015.
From 1995 through November 2016, 537 proposals for local transactions and use taxes have been submitted to the voters. 230 of 324 general measures (71 percent) and 92 of 213 special measures (43) passed during this time period. This includes the passage of 226 out of 374 (60 percent) city measures and 59 out of 163 (36 percent) county and special district measures.53 The number of propositions submitted increased greatly following the passage of SB566 in 2003, which removed the restriction that local agencies needed special legislation to propose a transactions and use tax. General taxes (general purposes, majority voter approval) have become more common in recent years.
California Proposition 30
In November 2012, California voters approved a constitutional amendment that authorizes sales and income tax increases. The amendment temporarily raised the state’s portion of sales tax by 0.25 percent for four years, from January 1, 2013 through December 31, 2016. This increase expired at the end of 2016.
Sales Tax in the City of San José
In June 2016, San José voters approved Measure B, a 0.25 percent transactions and use (sales) tax. The measure is anticipated to generate approximately $40 million annually for the city. The measure will be in place for 15 years and will expire in September 2031, unless voters approve an extension. Although the measure is a general tax, meaning that it is not dedicated to any specific purpose and must be deposited into the city general fund, the city stated that new revenue generated by the tax will allow the city to address public safety, street maintenance, and other community service priorities. The city identified community priorities as improving police response to crimes, improving emergency medical response times, improving response times to fires, increasing the number of police officers patrolling city streets, maintaining the long-term financial stability of the city, and maintaining and repairing major streets. This measure increased the city’s share of the sales tax rate from 1 to 1.25 percent.54
The measure passed with 61 percent support. Ballot language for the measure is included in Appendix K.
53 http://californiacityfinance.com/CityTrUseTax1702.pdf 54 This section drawn from City of San José’s “Frequently Asked Questions About Measure B” and the City Attorney’s Impartial Analysis of Measure B.
CITY OF SAN JOSÉ, CALIFORNIA | PARK FINANCE FEASIBILITY STUDY | JULY,2017
24
Using the Sales for Park Improvements in San José
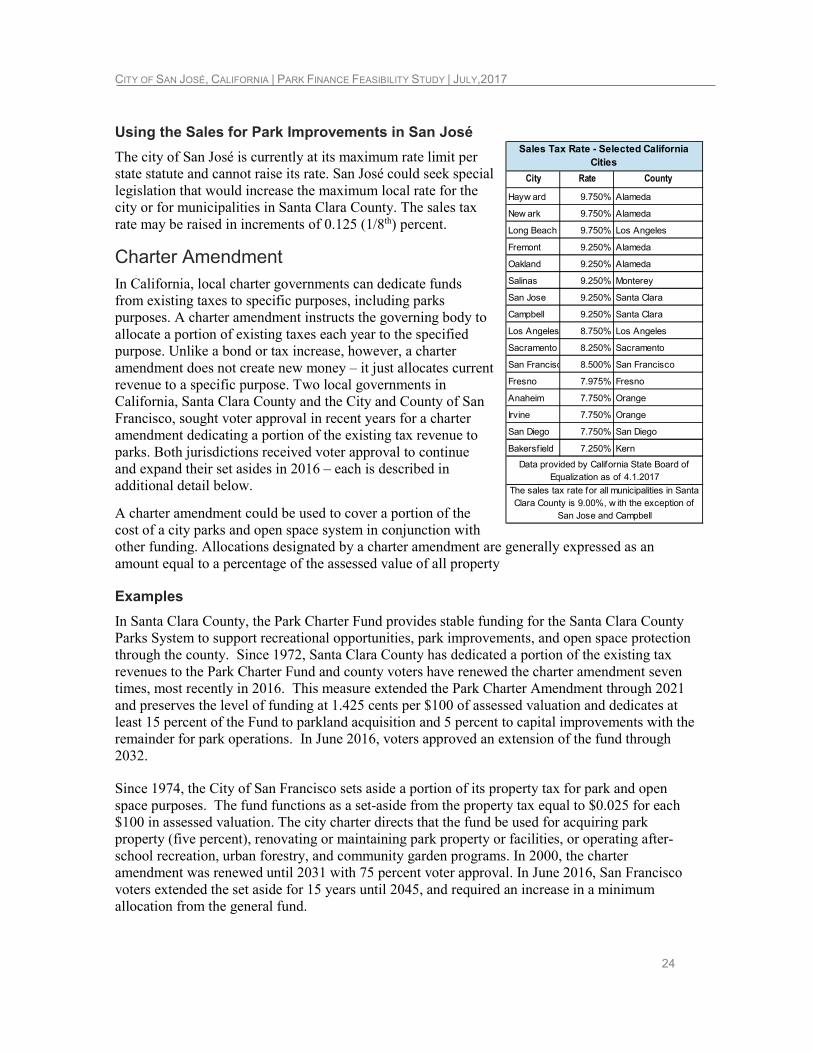
The city of San José is currently at its maximum rate limit per state statute and cannot raise its rate. San José could seek special legislation that would increase the maximum local rate for the city or for municipalities in Santa Clara County. The sales tax rate may be raised in increments of 0.125 (1/8th) percent.
Charter Amendment In California, local charter governments can dedicate funds from existing taxes to specific purposes, including parks purposes. A charter amendment instructs the governing body to allocate a portion of existing taxes each year to the specified purpose. Unlike a bond or tax increase, however, a charter amendment does not create new money – it just allocates current revenue to a specific purpose. Two local governments in California, Santa Clara County and the City and County of San Francisco, sought voter approval in recent years for a charter amendment dedicating a portion of the existing tax revenue to parks. Both jurisdictions received voter approval to continue and expand their set asides in 2016 – each is described in additional detail below.
A charter amendment could be used to cover a portion of the cost of a city parks and open space system in conjunction with other funding. Allocations designated by a charter amendment are generally expressed as an amount equal to a percentage of the assessed value of all property
Examples
In Santa Clara County, the Park Charter Fund provides stable funding for the Santa Clara County Parks System to support recreational opportunities, park improvements, and open space protection through the county. Since 1972, Santa Clara County has dedicated a portion of the existing tax revenues to the Park Charter Fund and county voters have renewed the charter amendment seven times, most recently in 2016. This measure extended the Park Charter Amendment through 2021 and preserves the level of funding at 1.425 cents per $100 of assessed valuation and dedicates at least 15 percent of the Fund to parkland acquisition and 5 percent to capital improvements with the remainder for park operations. In June 2016, voters approved an extension of the fund through 2032.
Since 1974, the City of San Francisco sets aside a portion of its property tax for park and open space purposes. The fund functions as a set-aside from the property tax equal to $0.025 for each $100 in assessed valuation. The city charter directs that the fund be used for acquiring park property (five percent), renovating or maintaining park property or facilities, or operating after-school recreation, urban forestry, and community garden programs. In 2000, the charter amendment was renewed until 2031 with 75 percent voter approval. In June 2016, San Francisco voters extended the set aside for 15 years until 2045, and required an increase in a minimum allocation from the general fund.
City Rate County
Hayw ard 9.750% Alameda
New ark 9.750% Alameda
Long Beach 9.750% Los Angeles
Fremont 9.250% Alameda
Oakland 9.250% Alameda
Salinas 9.250% Monterey
San Jose 9.250% Santa Clara
Campbell 9.250% Santa Clara
Los Angeles 8.750% Los Angeles
Sacramento 8.250% Sacramento
San Francisco 8.500% San Francisco
Fresno 7.975% Fresno
Anaheim 7.750% Orange
Irvine 7.750% Orange
San Diego 7.750% San Diego
Bakersfield 7.250% Kern
Sales Tax Rate - Selected California
Cities
Data provided by California State Board of Equalization as of 4.1.2017
The sales tax rate for all municipalities in Santa Clara County is 9.00%, w ith the exception of
San Jose and Campbell
CITY OF SAN JOSÉ, CALIFORNIA | PARK FINANCE FEASIBILITY STUDY | JULY, 2017
25
Process for Implementation
The San José City Council may submit a charter proposal to the voters, provided it does so at least 88 days prior to the election.
A charter amendment may also be submitted by citizen petition. A petition must be signed by 10 percent of the qualified electors of the city, which is computed by the total number of votes cast in the city for all candidates for Governor at the last general election at which a Governor was elected. Based on turnout for the November 2014 election, a petition would require 19,095 signatures.
A city charter may be amended by proposals submitted by the governing body or by petition, and must be submitted at least 88 days before the election.
Charter amendments must be approved by a majority of voters at a statewide general election.
Special Districts Special districts are a form of local government created by a community to meet a specific need. Limited tax bases and competing demands for existing taxes make it hard for cities and counties to provide all the services their citizens desire. When residents or landowners want new services or higher levels of services, they can form a district to pay for and administer them. California has roughly 3,400 special districts providing focused public services such as fire protection, sewers, water supply, electricity, parks, recreation, sanitation, cemeteries, and libraries. There are about 50 major types of special districts (and many subcategories) ranging from airport to cemetery to water conservation districts.
The city of San José could explore the creation of a special district, such as a recreation and park district, regional park, park and open space, and open space districts, a county service area, or a community service district, to acquire land for parks and to finance park improvements.
Recreation and Park District55
Recreation and park districts may acquire property for parks and open space, impose property taxes, levy assessments upon properties assessed within their boundaries because those properties are specifically benefited (either throughout the district or in zones of benefit), and incur indebtedness not to exceed five percent of the assessed valuation in the district. Such a district may be formed in incorporated or unincorporated areas and may or may not be contiguous. It may also enter joint powers agreements and work in cooperation with other public agencies and private organizations. However, the governing body of the district may not levy an assessment or tax until the assessment is first approved by a majority of landowners or the tax is approved by two-thirds of landowners within the district. Bond issuances require a resolution of the district board of directors and two-thirds approval of the landowners within the district.
In November 2016, more than 78 percent of voters in the Hayward Area Recreation and Park District – the agency that oversees parks in Hayward and nearby unincorporated areas – approved a
55 Cal. Public Resources Code §§5780 to 5790.17.
CITY OF SAN JOSÉ, CALIFORNIA | PARK FINANCE FEASIBILITY STUDY | JULY,2017
26
$250 million bond measure for deferred maintenance projects and new initiatives.56 All funding will be used for local park and recreation facility improvements.57 Special districts are described in further detail in a subsequent section of this report.
In November 2016, 69 percent of voters in the Coalinga-Huron Recreation and Park District in Fresno County approved a $14.9 million bond measure for park facility construction and maintenance.58
Ballot language for these measures is included in appendix M.
Regional Park, Park and Open Space, and Open Space District
One or more cities, together with any parcel or parcels of city or county territory, whether in the same or different counties, may organize and incorporate a regional park, park and open space, or open space district. All the territory in the proposed district must be contiguous. Regional park, park and open space, and open space districts may acquire property for parks and open space, levy assessments upon properties assessed within their boundaries because those properties are specifically benefited (either throughout the district or in zones of benefit), and incur indebtedness not to exceed five percent of the assessed valuation in the district. However, the governing body of the district may not levy a benefit assessment until the assessment is first approved by a majority of landowners (50 percent of more), or a special tax is approved by two-thirds of voters, or a bond issuance is approved by two thirds of the district board of directors and voters.59
Community Service District
A community service district may be formed by a city for a number of public purposes, including public recreation purposes which include, but are not limited to, aquatic parks and recreational harbors, equestrian trails, playgrounds, golf courses, swimming pools, or recreational buildings. Such a district may acquire real property by grant, purchase, gift, lease or eminent domain. A community service district may be formed by petition signed by at least ten percent of registered voters in the proposed district or by adoption of a resolution by the board of supervisors following a public hearing. As relevant to parks and open space funding, a community service district may issue bonds, general taxes, special taxes (including parcel taxes), and rates and other charges to carry out the purposes and objects of the district. The district may also form zones of benefit to finance capital improvements and services in limited areas of the district. To levy the tax, the district board of directors must state the purposes for which the taxes are necessary and must fix by ordinance the amount of money to be raised by taxation. To incur indebtedness, the district must hold a public hearing and electors residing in the portion of the district being benefited must approve the bonds at a special district election. A majority vote of electors in the district must approve the issuance of revenue bonds and a two-thirds vote is required for the issuance of general obligation bonds.60
Benefit Assessment Districts
A benefit assessment is a special charge levied on property to pay for public improvements that benefit property in a predetermined district. The philosophy behind benefit assessments (also
56 Moriki, Darin. “$250 million Hayward park bond on ballot.” San José Mercury-News. August 4, 2016. Accessed August 5, 2016. http://www.mercurynews.com/ci_30206772/250m-hayward-park-bond-ballot 57 http://www.haywardrec.org/AgendaCenter/ViewFile/Agenda/07252016-445 58 https://ballotpedia.org/Coalinga-Huron_Recreation_and_Park_District,_California,_Bond_Issue,_Measure_N_(November_2016) 59 Cal. Public Resources Code §§5500 to 5595 60 Cal. Government Code §§61600 to 61751.
CITY OF SAN JOSÉ, CALIFORNIA | PARK FINANCE FEASIBILITY STUDY | JULY, 2017
27
known as special assessments, or assessment ballot proceedings) is to link the cost of public improvements to those landowners who specifically benefit from those improvements. The amount of an assessment on a particular property is related to the amount of benefit that property receives. While parks and open space often do provide general amenities that may be enjoyed by the public at large, they also provide significant special benefit to local properties. The boundaries of a benefit assessment district may coincide exactly with those of another jurisdiction (e.g. city or county) or they may cover only part of those jurisdictions.
Prior to imposing a benefit assessment, the local government(s) must determine if the project or service provides a special benefit.61 California Proposition 218, approved by voters in 1996, established a strict definition of “special benefit” to mean “a particular and distinct benefit over and above general benefits conferred on real property located in the district or public at large. If it does, the amount of the special benefit and the general benefit must be estimated through a professional engineer’s report to allow local governments to recoup from the assessments only the proportionate share of costs to provide the special benefit. The local government must then set individual assessment charges so that no property owner pays more than his/her proportionate share of the total cost, which may require assessment rates to be set on a parcel-by-parcel basis.62 The assessment may be imposed only if 50 percent or more of the weighted ballots support it. Ballots are weighted according to the amount of the assessment. Assessments are secured by a lien on real property, and that lien is superior to all mortgages even if the mortgages pre-date the assessment lien.
In 2008, the California Supreme Court struck down an open-space assessment in Santa Clara County on the ground it did not demonstrate special benefit to the assessed property as required by Proposition 218 or Proposition 13 and because the amounts assessed were not proportional to the special benefits conferred. The unanimous decision sets out a new, more demanding standard of judicial review of local government assessment decisions and has significant implications for assessment financing in California.63 The court decision effectively will require local agencies to put such assessments before the voters, unless a fee hike is well-defined for a particular set of homeowners, such as to fund lighting or street improvements in a neighborhood. Therefore, assessment programs covering an entire jurisdiction, such as the geographic boundaries of a city or county, are vulnerable to a legal challenge. However, a benefit assessment may be plausible in a small area, such as the area around a neighborhood park.
Proposition 218 limits the abilities of local governments to exact revenue under special assessments. A citywide special assessment for parks, recreation, or open space purposes may be viewed as a special tax, which would require a two-thirds voter approval. Local governments may not impose assessments to pay for the cost of providing a general benefit to the community. Proposition 218 also emphasizes that general enhancement of property value does not constitute a special benefit. A special benefit must affect the assessed property in a way that is particular and distinct from its effect on other parcels and that real property in general and the public at large do not share. 64
61 General enhancement of property value does not constitute ‘special benefit.’” Cal. Const. Art. XIIIC, Sec. 2(i). 62 Understanding Proposition 218, Legislative Analyst’s Office (Dec. 1996). 63 Silicon Valley Taxpayers’ Assoc., Inc. v. Santa Clara County Open Space Auth., 187 P.3d 37 (Cal. 2008). 64 Ibid.
CITY OF SAN JOSÉ, CALIFORNIA | PARK FINANCE FEASIBILITY STUDY | JULY,2017
28
Other recent decisions have emphasized the significance of these requirements and have invalidated assessments where the agency's evidence fails to meet these burdens. (E.g., Beutz v.
County of Riverside (2010) Cal.4th Dist; Bonander v. Town of Tiburon (2009) 180 Cal.App.4th 1057.)
The Trust for Public Land recommends against further consideration of this financing mechanism for California cities and counties at this time.
Enhanced Infrastructure Financing Districts (EIFD)
Overview
As of 2015, cities may create enhanced infrastructure financing districts (EIFDs) to fund infrastructure projects using tax increment financing. These districts may adopt infrastructure financing plans and issue bonds, upon approval of 55 percent support of voters, to finance public capital facilities or other specified projects of community significance. This mechanism is an economic development tool intended to replace the gap created by the dissolution of California redevelopment agencies. Unlike with development agencies, there is no blight determination needed or any requirements for affordable housing. However, any housing built must have an affordable housing component.65
Districts may finance only public capital facilities or other specified projects of communitywide significance that provide significant benefits to the district or the surround community.66 Generally, eligible activities are the purchase, construction, expansion, improvement, seismic retrofit, or rehabilitation of any real or other tangible property with an estimated useful life of 15 years or longer.67 The facilities do not need to be physically located within the boundaries of the district, although facilities outside of the district must have a tangible connection to the work of the district.68 A district may include areas which are not contiguous.69 School districts do not contribute revenue to the increment.70
Parks, recreational facilities, and open space are eligible purposes that a district may finance.71 However, districts may not finance routine maintenance, repair work, or the costs of an ongoing operation or providing services of any kind.72 The district is overseen by a governing board known as a public financing authority.73
The process for creating an EIFD is complicated. A summary of the process for creating an EIFD and issuing voter-approved bonds is briefly described below. A city considering pursuing this option should seek further advice and research.
Restrictions apply to jurisdictions that previously created redevelopment agencies.
This is a new funding mechanism that has not yet been used for substantial parks, recreation, or
open space programs. The EIFD, and not the city, would be liable for the debt.
65 California Code 53398.56(e)(1) 66 California Code 53398.52(b) 67 California Code 53398.52(A) 68 California Code 53398.52(a)(2) 69 California Code 53398.55 70 California Code 53398.75(2)(d) 71 California Code 53398.52(a)(3) 72 California Code 53398.52(a)(3) 73 California Code 53398.51(i)
CITY OF SAN JOSÉ, CALIFORNIA | PARK FINANCE FEASIBILITY STUDY | JULY, 2017
29
Creating a District
The legislative body of the jurisdiction proposing formation of an EIFD, such as a city council, must pass a resolution stating its intent. This resolution must describe the boundaries of the proposed district, state the types of facilities or development to be financed, state the need and goals for the district, and state that incremental tax revenue may be used.74 An appropriate official, such as a city engineer, must prepare an infrastructure plan.75 The plan must specify the sources that will fund the district. The legislative body of the jurisdiction proposing formation must hold a public hearing prior to adopting the plan.76 The governing body of each affected taxing entity which is proposed to be subject to division of taxes through the increment financing must adopt a resolution approving the EIFD plan.77 If these requirements are met, the legislative body of the jurisdiction proposing formation may enact a resolution to form the district.
Issuing Voter-Approved Bonds
The public financing authority, the governing body of the district, may adopt a resolution stating its intent to issue tax increment bonds. A majority vote of the authority is required.78 The resolution must include the following items:
• a description of the facilities or developments to be financed with the proposed bond issue proceeds,
• the estimated cost of the facilities or developments, the estimated cost of preparing and issuing the bonds, and the principal amount of the proposed bond issuance,
• the maximum interest rate and discount on the proposed bond issuance,
• the date of the election on the proposed bond issuance and the manner of holding the election,
• a determination of the amount of tax revenue available or estimated to be available, for the payment of the principal of, and interest on, the bonds, and
• a finding that the amount necessary to pay the principal of, and interest on, the proposed bond issuance will be either less than or equal to the amount of tax revenue available or estimated to be available.79
If at least 12 people are registered to vote in the district for each of the 90 days preceding the hearing to submit the resolution, the electorate shall be the registered voters of the district.80 Bonds may be issued if 55 percent of the voters voting on the proposition vote in favor of issuing the bonds.81 The proposition may also include a question seeking authority to establish or change the appropriations limit, often referred to as the Gann Limit.82
74 California Code 53398.59 75 California Code 53398.62 76 California Code 53398.66 77 California Code 53398.68 78 California Code 53398.77 79 California Code 53398.78 80 California Code 53398.80 81 California Code 53398.81 82 California Code 53398.74
CITY OF SAN JOSÉ, CALIFORNIA | PARK FINANCE FEASIBILITY STUDY | JULY,2017
30
Community Facilities District
Overview
The Mello-Roos legislation of 1982 authorizes local governments to create special districts, known as community facility districts, which can impose parcel taxes to pay for capital improvements or services.
Revenue may be used to pay for facilities, services, or debt service used to finance facilities. The tax may be used for pay as you go items as well as for the principal and interest on bonded debt.
Eligible services include maintenance of parks, parkways, and open space.83 Environmental clean up and remediation services, as well as flood and storm protection services, are eligible.8485 Recreational program services, as well as operation and maintenance of museums and cultural facilities, are also eligible.86 Bonds may not be issued to fund any services, although bonds may be issued to fund capital facilities to be used in providing these services.87 Eligible facilities include local park, recreation, parkway, and open-space facilities.88 The district may also finance the acquisition, improvement, rehabilitation or maintenance of property for flood and storm protection services.89 Revenue may also be used to pay debt service.90
While Mello-Roos districts are typically used to finance facilities, they may also be used to finance services – or a combination of both. Generally, districts can use revenue for the purchase, construction, expansion, improvement, or rehabilitation of real property with a life span of five years or more. Parks, recreation, open space, and flood and storm protection are all examples of eligible services that Mello-Roos districts may finance.
The boundaries of the district do not need to match the jurisdictional boundaries of the city and do not need to be contiguous. Generally, boundaries cannot extend beyond the city’s borders unless the city enters into a joint powers agency. Financed facilities are not required to be located within the boundaries of the district.
Unlike general obligation bonds, Mello-Roos financing can fund improvements such as equipment and furnishings. Unlike a typical voter-approved general obligation bond, which can only fund capital improvements, a voter-approved Mello-Roos tax could fund both general obligation bonds and services.
Creating a District
The formation of a Mello-Roos district is complicated. The local agency must first consider and adopt local goals and policies.91The process to create a district may be initiated by either city council or a citizen petition. The legislative body of the public agency creating a district, such as city council, may initiate the process. Two members of the city council must submit a written request for establishment to the city council.92 A citizen petition may be filed. It must be signed by
83 California code 53313(d) 84 California Government Code 53313(f) 85 California Code 53313(e) 86 California Code 53313(c) 87 California Government Code 53313.5(g) 88 California Code 53313.5 89 California Government Code 5331.5(f) 90 California Government Code 53313.5(g) 91 California Government Code 53312.7(a) 92 California Government Code 53318(a)
CITY OF SAN JOSÉ, CALIFORNIA | PARK FINANCE FEASIBILITY STUDY | JULY, 2017
31
at least 10 percent of the registered voters residing in the territory that will be included. As of March 2016, this is 44,849 voters for a district coterminous with the boundaries of the city.93 This number will change in the future.
The city council must adopt a resolution of intent to establish a district within 90 days of either received a written request or valid petition.94 This resolution must include the following:95
• describe the boundaries of the district,
• the proposed name of the district. The name must be in substantially the same form as “Community Facilities District No. ___”
• describe the public facilities and services proposed to be financed,
• describe any financing plans that may be used,
• state that a special tax will pay for all facilities and services unless other funds are available,
• set a public hearing, describe any adjustment in the property taxation to pay prior indebtedness, and
• describe the proposed voting procedure.
The city council must direct officers to study the proposed district and file a report containing a description of the facilities and services required to adequately meet the needs of the district and to provide an estimate of the costs to provide these facilities and services.96
If at least 50 percent of registered voters file written complaints against the establishment of the district, the city may not pursue creating the district or authorizing a special tax to fund it for one year.97 If the majority protest complaints are against a specific type of facilities, services, or tax – those facilities, services, or taxes shall be eliminated from the resolution of the district formation.98
If the proposed tax has not been eliminated by majority protest, the council may adopt a resolution of formation establishing the district. The resolution must do the following: 99
• state that the proposed special tax to be levied has not been precluded by majority protest,
• identify any facilities or services proposed to be funded with the special tax, and
• other items described in state statute
The city council may then place a proposition on the ballot seeking approval of a special tax, as well as to establish or change the appropriations limit.100 The proposition must be voted on
93 California Government Code 53318(b) 94 California Government Code 53320. 95 California Government Code 53321 96 California Government Code 53321.5 97 California Government Code 53324(a). 98 California Government Code 53324 99 California Government Code 53325.1 100 California Government Code 53325.7, 53326(a)
CITY OF SAN JOSÉ, CALIFORNIA | PARK FINANCE FEASIBILITY STUDY | JULY,2017
32
between 90 and 180 days following the adoption of the resolution of formation.101 The formation of the district is approved if two-thirds of the votes cast in favor of levying the tax are in favor.102
The special tax is a parcel tax. The tax revenue may be used only to pay for the public
facilities, services, or debt service described in the proposition.
If the district seeks to issue bonds and incur debt, then it must seek voter approval. The authority to issue bonds may be included in the same proposition as the authority to levy a special tax. A two-thirds vote is also required for the issuance of bonds.103 Mello-Roos bonds provide different risk, interest rates, and considerations than a typical general obligation bond. These issues are not discussed as part of the scope of this research.
If the district receives approval for a special tax, the city may transfer money to the district prior to the first fiscal year in which the special tax may be levied.104 The city may also contribute revenue for the acquisition or construction of a facility, acquisition in property, or payment of debt service.105
Examples
There are instances of California communities creating citywide facility districts to finance park and open space improvements and services. These examples are intended to inform the city of models used throughout the state.
BERKELEY (ALAMEDA COUNTY)
The city of Berkeley has successfully sought voter approval in multiple instances in recent years for the creation of communities facilities districts to finance parks and recreation purposes.
In June 2010, the city of Berkeley sought voter approval to finance construction and renovation of swimming facilities, as well as to support the facilities. The district, which includes the entire city of Berkeley, is known officially as the City of Berkeley Community Facilities District No. 2 and is referred to as either “Berkeley Pools” or “CFD No.2”
The city sought a special tax composed of two pieces, one for facilities and one for services. The facilities tax is solely used to finance debt service on bonds and the services tax is solely used to finance the services necessary to maintain and operate the pools.106 The measure passed.
Ballot language for these measures is included in Appendix N.
SAN DIEGO (SAN DIEGO COUNTY)
In 1978, the San Diego City Council passed an ordinance creating the San Diego Open Space Park Facilities District No.1, a special district with boundaries coterminous with the city. The district is “empowered to acquire, construct, improve, maintain and operate park facilities.” This preceded a successful ballot measure in June 1978, where voters approved a measure to allow the district to incur and issue debt of up to $65 million. The debt was backed by a portion of the city’s environmental growth fund.
101 California Government Code 53326(a) 102 California Government Code 53328 103 California Government Code 53353.5, 53354,53355. 104 California Government Code 53314. 105 California Government Code 53314.8 106 http://www.ci.berkeley.ca.us/uploadedFiles/Clerk/Level_3_-_City_Council/2010/03Mar/Revised%20Pools.pdf
CITY OF SAN JOSÉ, CALIFORNIA | PARK FINANCE FEASIBILITY STUDY | JULY, 2017
33
These bonds funded San Diego’s open space acquisition program for many years. Funds were also used for open improvements at parks and recreational facilities.
While this district was created under the authorization of the Community Facilities Act of 1911, an authorization separate from the enabling legislation for community facilities districts, it does provide an example of a citywide district used for parks and open space improvements. This act which permitted cities to create districts that may issue bonds upon voter approval in the name of the city.107
CLAYTON (CONTRA COSTA COUNTY)
The city of Clayton, in Contra Costa County, established a citywide Community Facilities District
in 2007 to pay for costs related to the operation, maintenance, landscaping, irrigation, trails, and
open space. City parks are not maintained by the CFD and its associated special tax.108
Special Districts in San José
The Trust for Public Land did not examine existing special districts located in the city of San José, except for the Santa Clara County Open Space Authority, which is described earlier in this report.
Additional Funding Mechanisms Other taxes, such as a business license tax, construction and conveyance taxes, utility user tax, transient lodging tax, vehicle license fee, real property transfer tax, or soda tax – could potentially be used to generate additional funding for parks, recreation, and land conservation purposes in San José. Additional information on some of these funding mechanisms is included below.
Construction and Conveyance (C&C) Taxes
The construction and conveyance taxes (C&C) are a major source of revenue for San José parks. Construction taxes are imposed as an excise tax every person who constructs, alters, or improvements any building or structure in the city and conveyance taxes are based on the value of property transfers.109 There are numerous exemptions to this tax. The city has considered proposals to modify the tax in recent years. This includes increasing the tax or modifying the allocation formula.
107 San Diego Municipal Code 61.2000 108 http://ci.clayton.ca.us/government/trails-landscape-committee/measure-h-landscape-trails-maintenance-district-ballot-measure-june-2016/ 109 San José Code 4.46.040
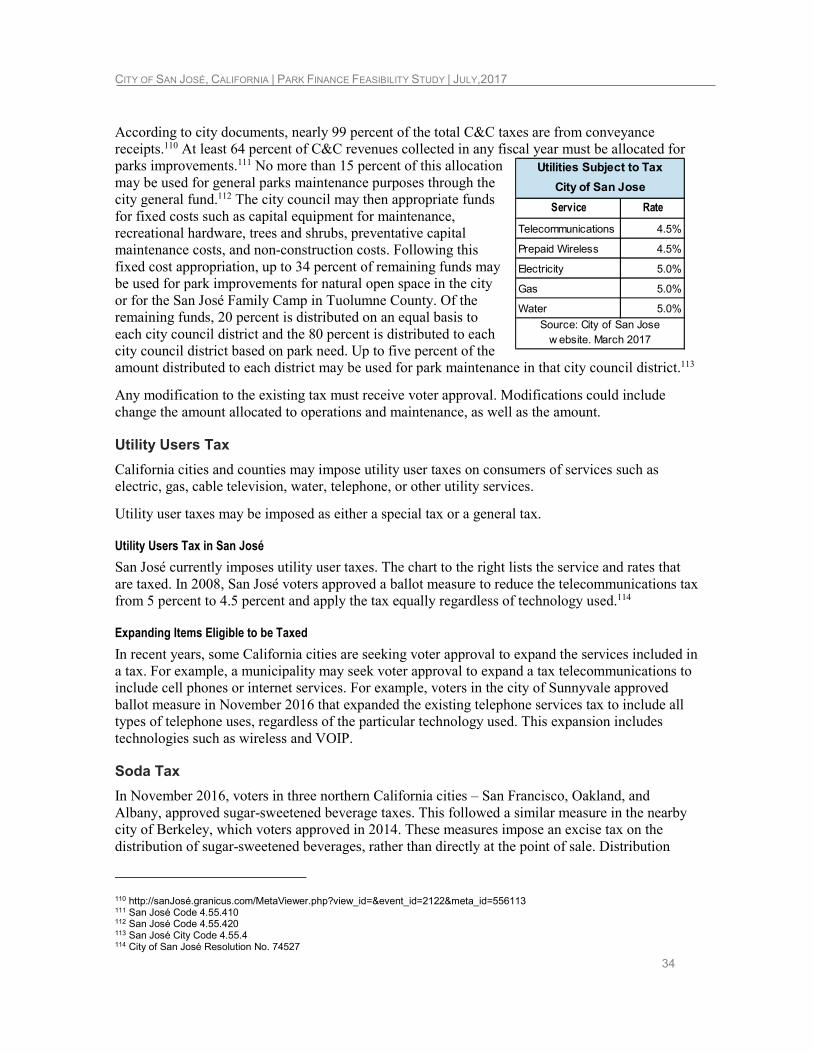
CITY OF SAN JOSÉ, CALIFORNIA | PARK FINANCE FEASIBILITY STUDY | JULY,2017
34
According to city documents, nearly 99 percent of the total C&C taxes are from conveyance receipts.110 At least 64 percent of C&C revenues collected in any fiscal year must be allocated for parks improvements.111 No more than 15 percent of this allocation may be used for general parks maintenance purposes through the city general fund.112 The city council may then appropriate funds for fixed costs such as capital equipment for maintenance, recreational hardware, trees and shrubs, preventative capital maintenance costs, and non-construction costs. Following this fixed cost appropriation, up to 34 percent of remaining funds may be used for park improvements for natural open space in the city or for the San José Family Camp in Tuolumne County. Of the remaining funds, 20 percent is distributed on an equal basis to each city council district and the 80 percent is distributed to each city council district based on park need. Up to five percent of the amount distributed to each district may be used for park maintenance in that city council district.113
Any modification to the existing tax must receive voter approval. Modifications could include change the amount allocated to operations and maintenance, as well as the amount.
Utility Users Tax
California cities and counties may impose utility user taxes on consumers of services such as electric, gas, cable television, water, telephone, or other utility services.
Utility user taxes may be imposed as either a special tax or a general tax.
Utility Users Tax in San José
San José currently imposes utility user taxes. The chart to the right lists the service and rates that are taxed. In 2008, San José voters approved a ballot measure to reduce the telecommunications tax from 5 percent to 4.5 percent and apply the tax equally regardless of technology used.114
Expanding Items Eligible to be Taxed
In recent years, some California cities are seeking voter approval to expand the services included in a tax. For example, a municipality may seek voter approval to expand a tax telecommunications to include cell phones or internet services. For example, voters in the city of Sunnyvale approved ballot measure in November 2016 that expanded the existing telephone services tax to include all types of telephone uses, regardless of the particular technology used. This expansion includes technologies such as wireless and VOIP.
Soda Tax
In November 2016, voters in three northern California cities – San Francisco, Oakland, and Albany, approved sugar-sweetened beverage taxes. This followed a similar measure in the nearby city of Berkeley, which voters approved in 2014. These measures impose an excise tax on the distribution of sugar-sweetened beverages, rather than directly at the point of sale. Distribution
110 http://sanJosé.granicus.com/MetaViewer.php?view_id=&event_id=2122&meta_id=556113 111 San José Code 4.55.410 112 San José Code 4.55.420 113 San José City Code 4.55.4 114 City of San José Resolution No. 74527
Service Rate
Telecommunications 4.5%
Prepaid Wireless 4.5%
Electricity 5.0%
Gas 5.0%
Water 5.0%
Utilities Subject to Tax
City of San Jose
Source: City of San Jose w ebsite. March 2017
CITY OF SAN JOSÉ, CALIFORNIA | PARK FINANCE FEASIBILITY STUDY | JULY, 2017
35
includes the sale of beverages or sweeteners by one business to another, such as a sale from a wholesale business to a retail business, or the transfer of beverages or sweeteners from a wholesale unit of a business to one of its retail units.
Oakland voters imposed a one cent per ounce tax on the distribution of sugar-sweetened beverages. This includes products such as soda, sports drinks, sweetened teas, and energy drinks. It exempts milk products, 100 percent juice, baby formula, and diet drinks. It also provides an exemption for small businesses.
The tax will be imposed beginning on July 1, 2017. Revenue will be deposited into the City’s general fund, and the City can use the revenue for any lawful government purpose. A newly established Community Advisory Board will make recommendations to the City Council on funding programs that prevent or reduce the health consequences of consuming sugar-sweetened beverages.
A sugar-sweetened beverage is defined as any beverage intended for human consumption to which one or more caloric sweeteners are added and contains 25 or more calories per 12 fluid ounces of beverage. Beverages subject to the tax include sodas, sports drinks, sweetened teas, energy drinks, and non-100 percent fruit drinks.115 Supporters of the measure stated that it would produce over $6 million a year.
The Rudd Center for Food Policy and Obesity at the University of Connecticut estimates that a one cent per ounce tax on sugar-sweetened beverages in the city of San Jose would generate between $30 and $33 million annually.
Park Trust Fund
The park trust fund is a significant source of revenue for parks funding in San José. implementation. The city requires the dedication of parkland or the payment of in lieu fees for new housing development. TPL did not analyze possible modifications to this program.
Business Tax/ Gross Receipts Tax
California cities may impose taxes on businesses. San José could consider imposing additional business taxes. The potential to impose new business taxes is not discussed in this report.
In 2015 and 2016, a group of San José residents sought a proposed initiative that would tax businesses based on their gross receipts. City leaders worked with the petition organizers to develop an alternative plan – a modernization of the existing business tax. The City Council placed Measure G on the November 2016 ballot, which proposed to modify the existing business tax.
The measure, a general tax, passed with nearly 66 percent of the vote.
Previously, the annual tax for most businesses was $150 for up to eight employees with an additional $18 tax for every additional employee located in San José, capped at $25,000 annually. The measure increased the minimum tax from $150 to $195, requires payment of the base tax by
115 This section largely excerpted from City Attorney’s Impartial Analysis of Measure HH and City Auditor’s Impartial Analysis of Measure HH. Accessed February 16, 2017. https://www.acgov.org/rov/elections/20161108/documents/MeasureHH.pdf
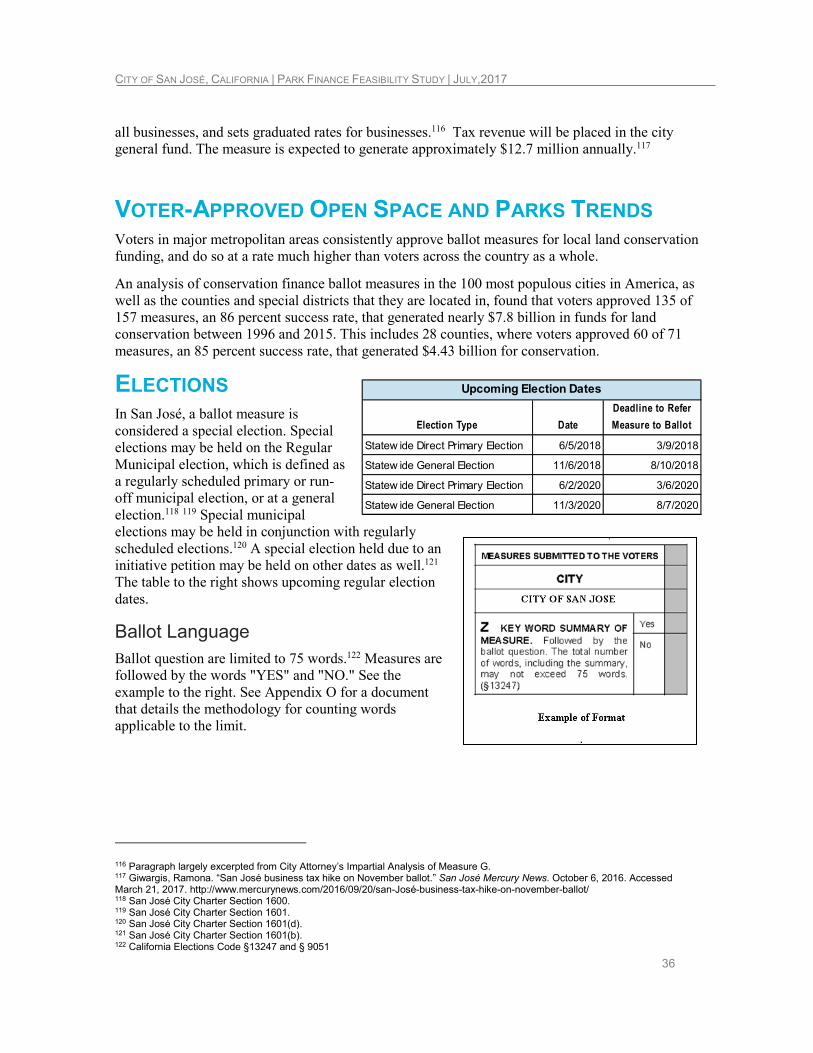
CITY OF SAN JOSÉ, CALIFORNIA | PARK FINANCE FEASIBILITY STUDY | JULY,2017
36
all businesses, and sets graduated rates for businesses.116 Tax revenue will be placed in the city general fund. The measure is expected to generate approximately $12.7 million annually.117
VOTER-APPROVED OPEN SPACE AND PARKS TRENDS Voters in major metropolitan areas consistently approve ballot measures for local land conservation funding, and do so at a rate much higher than voters across the country as a whole.
An analysis of conservation finance ballot measures in the 100 most populous cities in America, as well as the counties and special districts that they are located in, found that voters approved 135 of 157 measures, an 86 percent success rate, that generated nearly $7.8 billion in funds for land conservation between 1996 and 2015. This includes 28 counties, where voters approved 60 of 71 measures, an 85 percent success rate, that generated $4.43 billion for conservation.
ELECTIONS In San José, a ballot measure is considered a special election. Special elections may be held on the Regular Municipal election, which is defined as a regularly scheduled primary or run-off municipal election, or at a general election.118 119 Special municipal elections may be held in conjunction with regularly scheduled elections.120 A special election held due to an initiative petition may be held on other dates as well.121 The table to the right shows upcoming regular election dates.
Ballot Language Ballot question are limited to 75 words.122 Measures are followed by the words "YES" and "NO." See the example to the right. See Appendix O for a document that details the methodology for counting words applicable to the limit.
116 Paragraph largely excerpted from City Attorney’s Impartial Analysis of Measure G. 117 Giwargis, Ramona. “San José business tax hike on November ballot.” San José Mercury News. October 6, 2016. Accessed March 21, 2017. http://www.mercurynews.com/2016/09/20/san-José-business-tax-hike-on-november-ballot/ 118 San José City Charter Section 1600. 119 San José City Charter Section 1601. 120 San José City Charter Section 1601(d). 121 San José City Charter Section 1601(b). 122 California Elections Code §13247 and § 9051
Election Type Date
Deadline to Refer
Measure to Ballot
Statew ide Direct Primary Election 6/5/2018 3/9/2018
Statew ide General Election 11/6/2018 8/10/2018
Statew ide Direct Primary Election 6/2/2020 3/6/2020
Statew ide General Election 11/3/2020 8/7/2020
Upcoming Election Dates
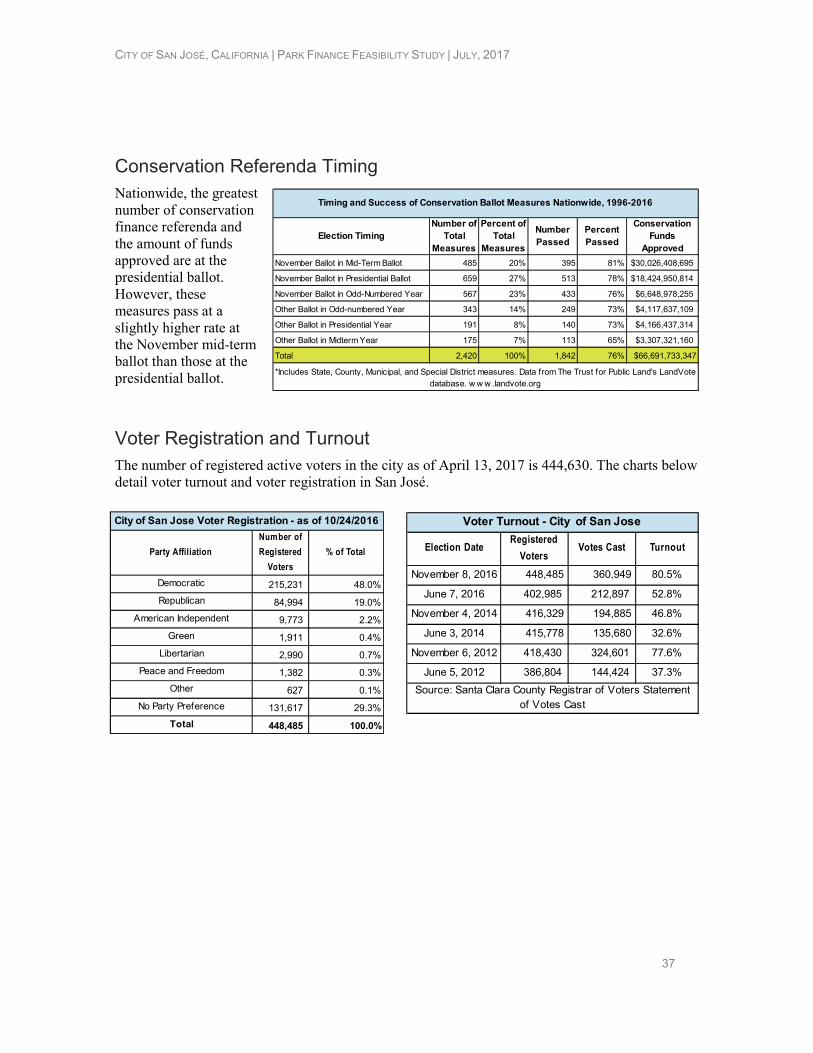
CITY OF SAN JOSÉ, CALIFORNIA | PARK FINANCE FEASIBILITY STUDY | JULY, 2017
37
Conservation Referenda Timing Nationwide, the greatest number of conservation finance referenda and the amount of funds approved are at the presidential ballot. However, these measures pass at a slightly higher rate at the November mid-term ballot than those at the presidential ballot.
Voter Registration and Turnout The number of registered active voters in the city as of April 13, 2017 is 444,630. The charts below detail voter turnout and voter registration in San José.
Election DateRegistered
VotersVotes Cast Turnout
November 8, 2016 448,485 360,949 80.5%
June 7, 2016 402,985 212,897 52.8%
November 4, 2014 416,329 194,885 46.8%
June 3, 2014 415,778 135,680 32.6%
November 6, 2012 418,430 324,601 77.6%
June 5, 2012 386,804 144,424 37.3%
Voter Turnout - City of San Jose
Source: Santa Clara County Registrar of Voters Statement of Votes Cast
Party Affiliation
Number of
Registered
Voters
% of Total
Democratic 215,231 48.0%
Republican 84,994 19.0%
American Independent 9,773 2.2%
Green 1,911 0.4%
Libertarian 2,990 0.7%
Peace and Freedom 1,382 0.3%
Other 627 0.1%
No Party Preference 131,617 29.3%
Total 448,485 100.0%
City of San Jose Voter Registration - as of 10/24/2016
Election Timing
Number of
Total
Measures
Percent of
Total
Measures
Number
Passed
Percent
Passed
Conservation
Funds
Approved
November Ballot in Mid-Term Ballot 485 20% 395 81% $30,026,408,695
November Ballot in Presidential Ballot 659 27% 513 78% $18,424,950,814
November Ballot in Odd-Numbered Year 567 23% 433 76% $6,648,978,255
Other Ballot in Odd-numbered Year 343 14% 249 73% $4,117,637,109
Other Ballot in Presidential Year 191 8% 140 73% $4,166,437,314
Other Ballot in Midterm Year 175 7% 113 65% $3,307,321,160
Total 2,420 100% 1,842 76% $66,691,733,347
Timing and Success of Conservation Ballot Measures Nationwide, 1996-2016
*Includes State, County, Municipal, and Special District measures. Data from The Trust for Public Land's LandVote database. w w w .landvote.org
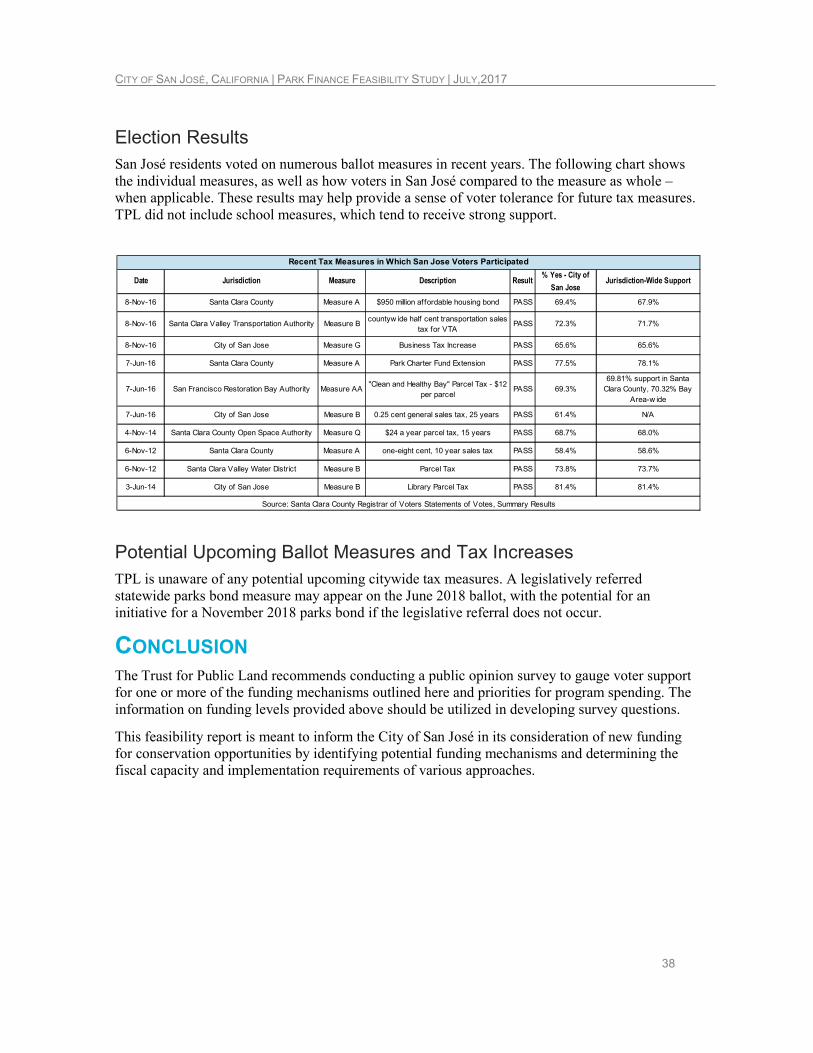
CITY OF SAN JOSÉ, CALIFORNIA | PARK FINANCE FEASIBILITY STUDY | JULY,2017
38
Election Results San José residents voted on numerous ballot measures in recent years. The following chart shows the individual measures, as well as how voters in San José compared to the measure as whole – when applicable. These results may help provide a sense of voter tolerance for future tax measures. TPL did not include school measures, which tend to receive strong support.
Potential Upcoming Ballot Measures and Tax Increases TPL is unaware of any potential upcoming citywide tax measures. A legislatively referred statewide parks bond measure may appear on the June 2018 ballot, with the potential for an initiative for a November 2018 parks bond if the legislative referral does not occur.
CONCLUSION The Trust for Public Land recommends conducting a public opinion survey to gauge voter support for one or more of the funding mechanisms outlined here and priorities for program spending. The information on funding levels provided above should be utilized in developing survey questions.
This feasibility report is meant to inform the City of San José in its consideration of new funding for conservation opportunities by identifying potential funding mechanisms and determining the fiscal capacity and implementation requirements of various approaches.
Date Jurisdiction Measure Description Result% Yes - City of
San JoseJurisdiction-Wide Support
8-Nov-16 Santa Clara County Measure A $950 million af fordable housing bond PASS 69.4% 67.9%
8-Nov-16 Santa Clara Valley Transportation Authority Measure Bcountyw ide half cent transportation sales
tax for VTAPASS 72.3% 71.7%
8-Nov-16 City of San Jose Measure G Business Tax Increase PASS 65.6% 65.6%
7-Jun-16 Santa Clara County Measure A Park Charter Fund Extension PASS 77.5% 78.1%
7-Jun-16 San Francisco Restoration Bay Authority Measure AA"Clean and Healthy Bay" Parcel Tax - $12
per parcelPASS 69.3%
69.81% support in Santa Clara County, 70.32% Bay
Area-w ide
7-Jun-16 City of San Jose Measure B 0.25 cent general sales tax, 25 years PASS 61.4% N/A
4-Nov-14 Santa Clara County Open Space Authority Measure Q $24 a year parcel tax, 15 years PASS 68.7% 68.0%
6-Nov-12 Santa Clara County Measure A one-eight cent, 10 year sales tax PASS 58.4% 58.6%
6-Nov-12 Santa Clara Valley Water District Measure B Parcel Tax PASS 73.8% 73.7%
3-Jun-14 City of San Jose Measure B Library Parcel Tax PASS 81.4% 81.4%
Recent Tax Measures in Which San Jose Voters Participated
Source: Santa Clara County Registrar of Voters Statements of Votes, Summary Results
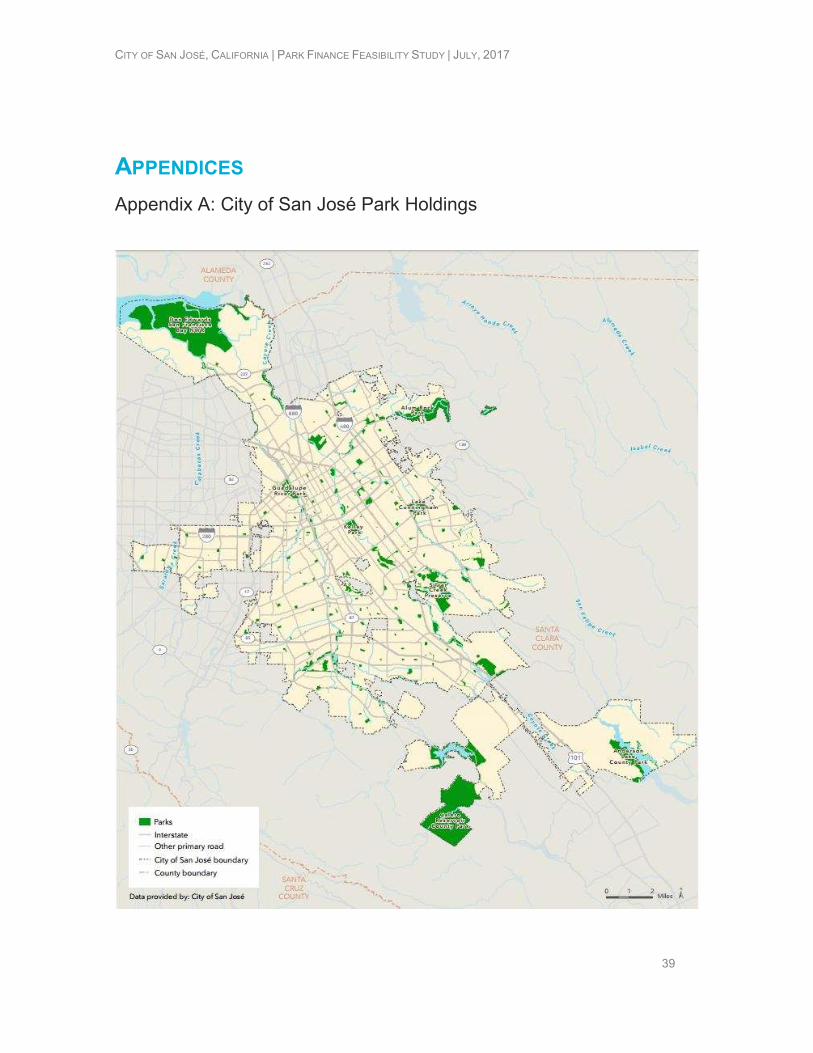
CITY OF SAN JOSÉ, CALIFORNIA | PARK FINANCE FEASIBILITY STUDY | JULY, 2017
39
APPENDICES
Appendix A: City of San José Park Holdings
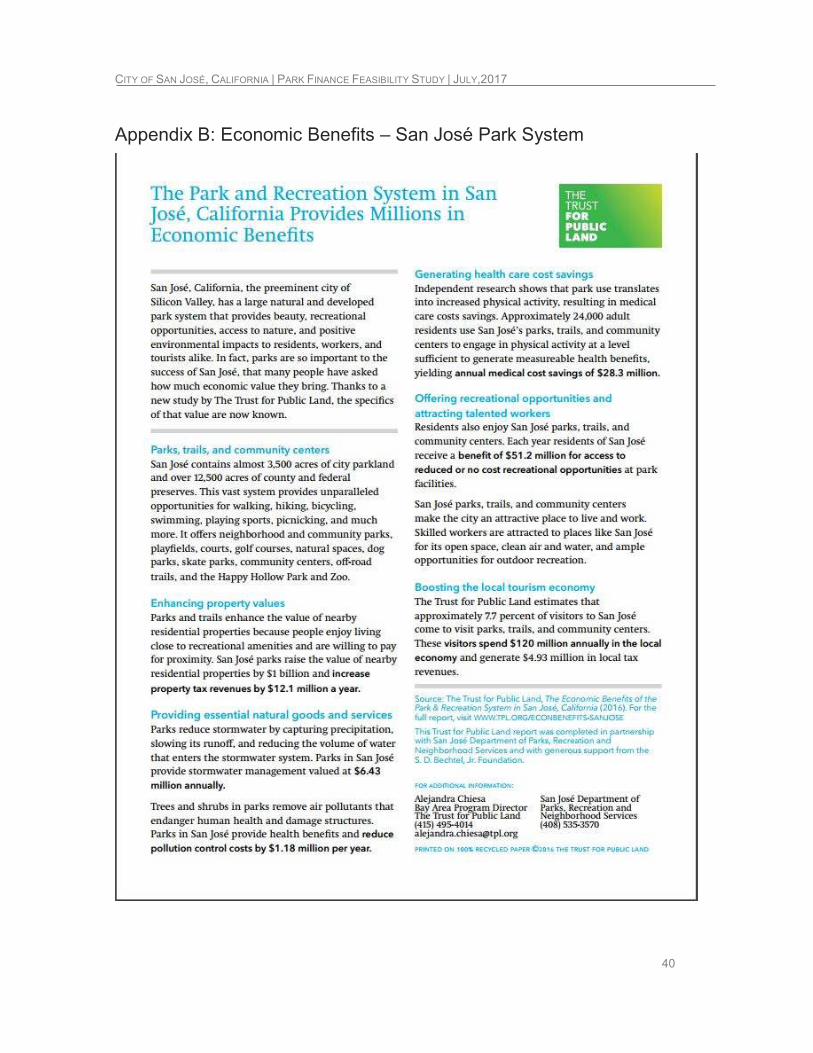
CITY OF SAN JOSÉ, CALIFORNIA | PARK FINANCE FEASIBILITY STUDY | JULY,2017
40
Appendix B: Economic Benefits – San José Park System
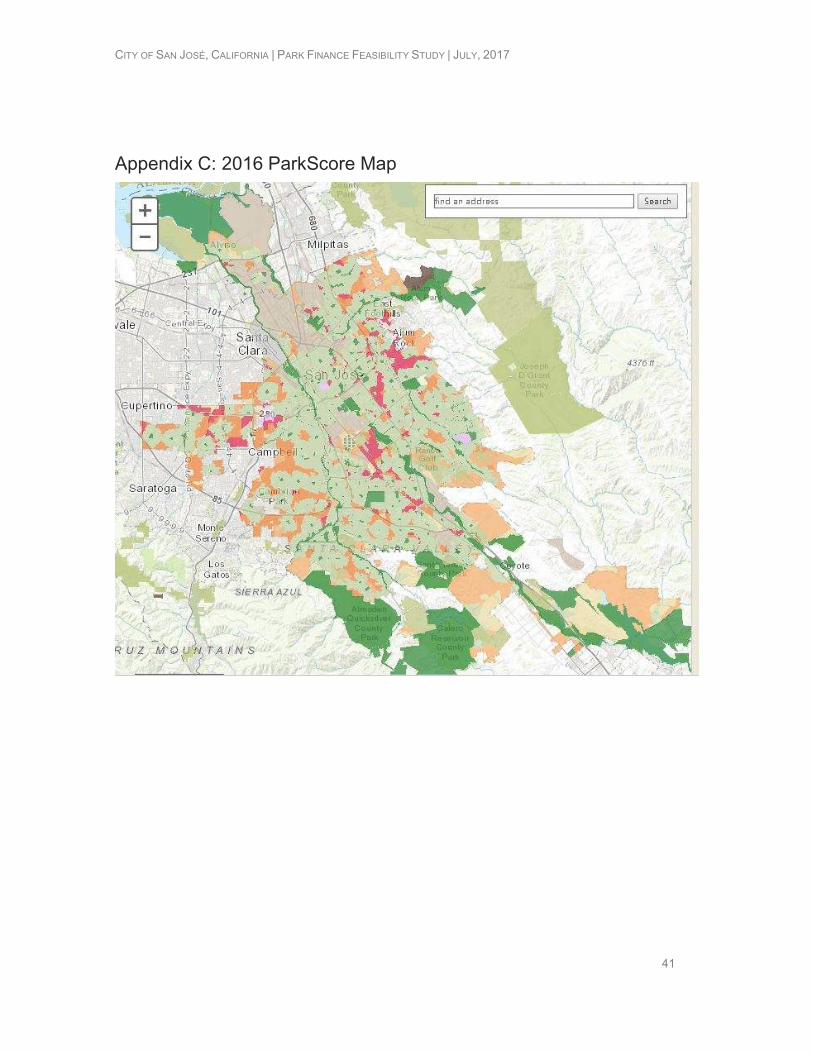
CITY OF SAN JOSÉ, CALIFORNIA | PARK FINANCE FEASIBILITY STUDY | JULY, 2017
41
Appendix C: 2016 ParkScore Map
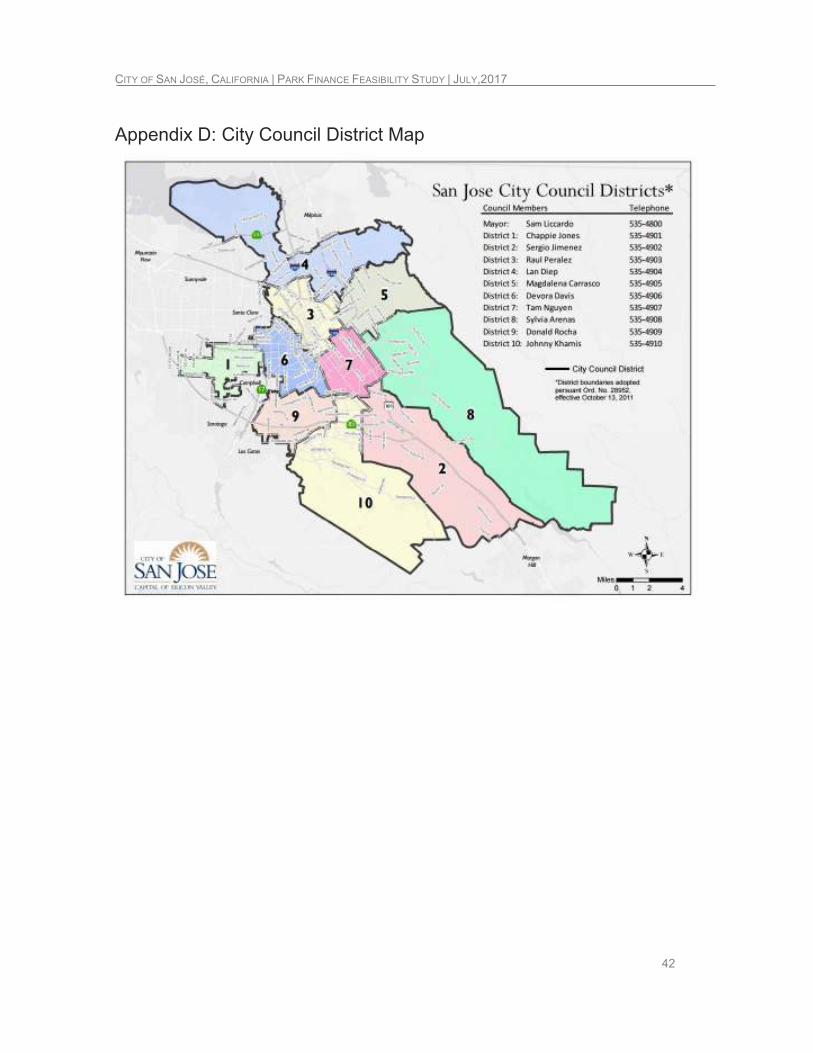
CITY OF SAN JOSÉ, CALIFORNIA | PARK FINANCE FEASIBILITY STUDY | JULY,2017
42
Appendix D: City Council District Map
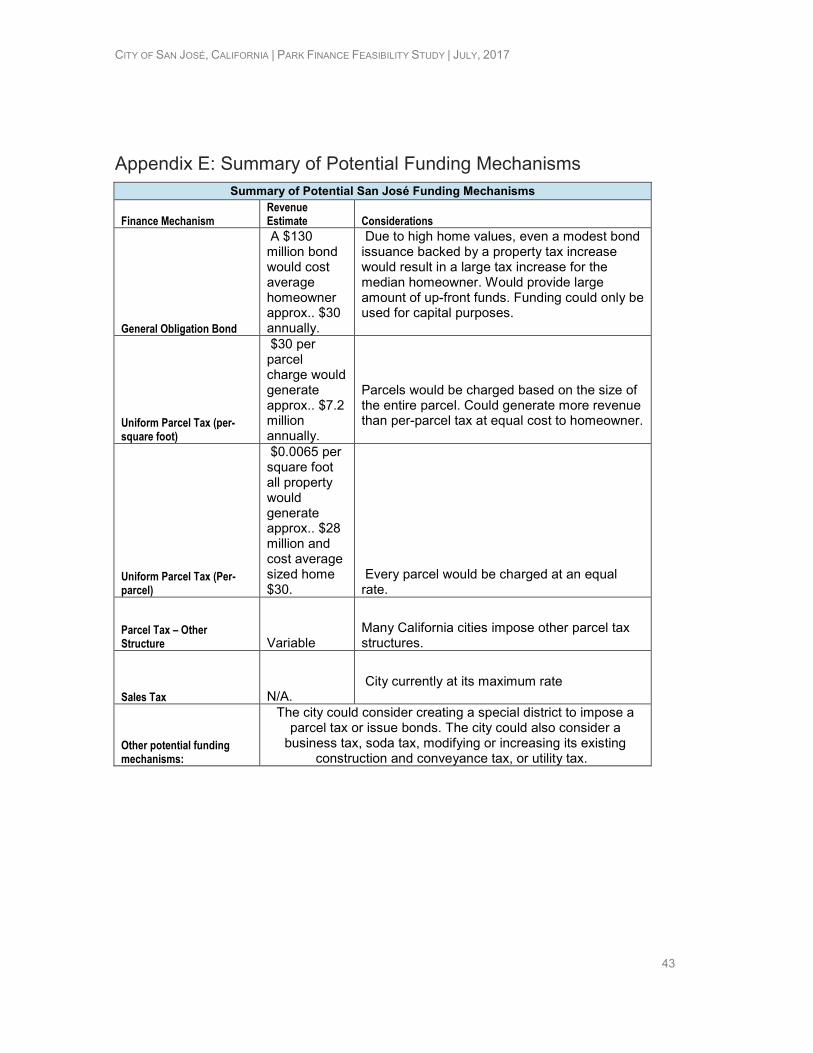
CITY OF SAN JOSÉ, CALIFORNIA | PARK FINANCE FEASIBILITY STUDY | JULY, 2017
43
Appendix E: Summary of Potential Funding Mechanisms Summary of Potential San José Funding Mechanisms
Finance Mechanism Revenue Estimate Considerations
General Obligation Bond
A $130 million bond would cost average homeowner approx.. $30 annually.
Due to high home values, even a modest bond issuance backed by a property tax increase would result in a large tax increase for the median homeowner. Would provide large amount of up-front funds. Funding could only be used for capital purposes.
Uniform Parcel Tax (per-square foot)
$30 per parcel charge would generate approx.. $7.2 million annually.
Parcels would be charged based on the size of the entire parcel. Could generate more revenue than per-parcel tax at equal cost to homeowner.
Uniform Parcel Tax (Per-parcel)
$0.0065 per square foot all property would generate approx.. $28 million and cost average sized home $30.
Every parcel would be charged at an equal rate.
Parcel Tax – Other Structure Variable
Many California cities impose other parcel tax structures.
Sales Tax N/A. City currently at its maximum rate
Other potential funding mechanisms:
The city could consider creating a special district to impose a parcel tax or issue bonds. The city could also consider a
business tax, soda tax, modifying or increasing its existing construction and conveyance tax, or utility tax.
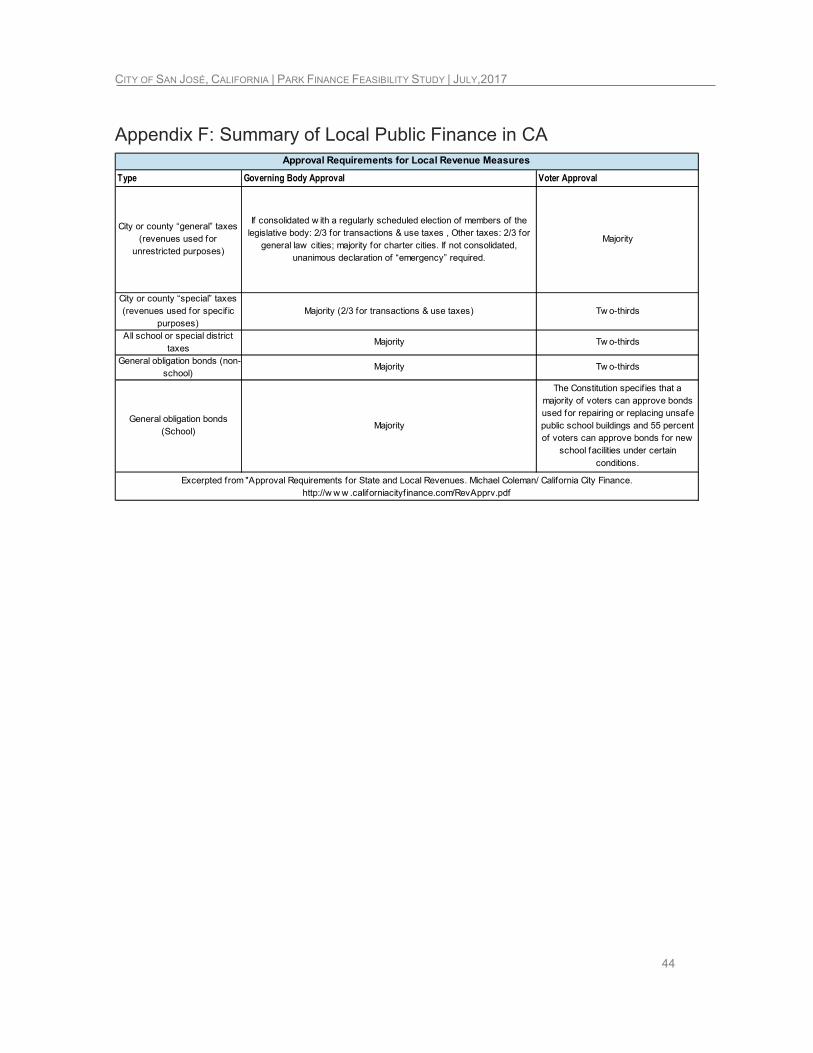
CITY OF SAN JOSÉ, CALIFORNIA | PARK FINANCE FEASIBILITY STUDY | JULY,2017
44
Appendix F: Summary of Local Public Finance in CA
Type Governing Body Approval Voter Approval
City or county “general” taxes (revenues used for
unrestricted purposes)
If consolidated w ith a regularly scheduled election of members of the legislative body: 2/3 for transactions & use taxes , Other taxes: 2/3 for
general law cities; majority for charter cities. If not consolidated, unanimous declaration of “emergency” required.
Majority
City or county “special” taxes (revenues used for specif ic
purposes)Majority (2/3 for transactions & use taxes) Tw o-thirds
All school or special district taxes
Majority Tw o-thirds
General obligation bonds (non-school)
Majority Tw o-thirds
General obligation bonds (School)
Majority
The Constitution specif ies that a majority of voters can approve bonds used for repairing or replacing unsafe public school buildings and 55 percent of voters can approve bonds for new
school facilities under certain conditions.
Excerpted from "Approval Requirements for State and Local Revenues. Michael Coleman/ California City Finance. http://w w w .californiacityf inance.com/RevApprv.pdf
Approval Requirements for Local Revenue Measures
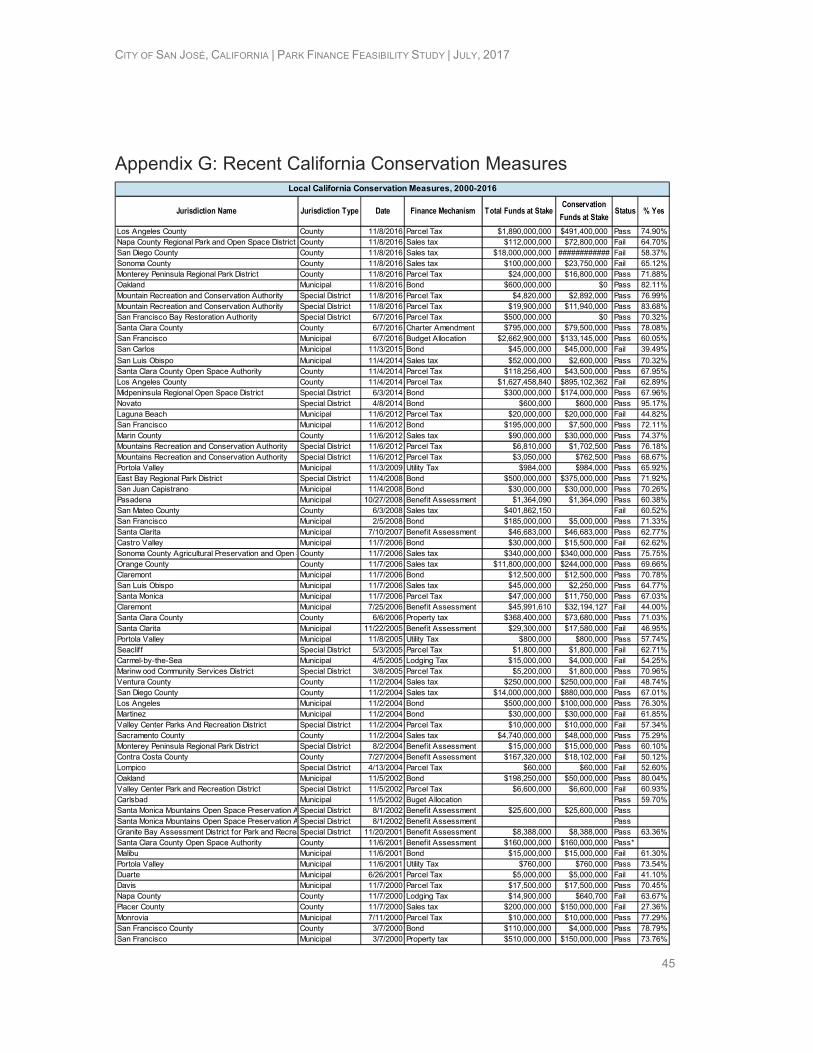
CITY OF SAN JOSÉ, CALIFORNIA | PARK FINANCE FEASIBILITY STUDY | JULY, 2017
45
Appendix G: Recent California Conservation Measures
Jurisdiction Name Jurisdiction Type Date Finance Mechanism Total Funds at StakeConservation
Funds at StakeStatus % Yes
Los Angeles County County 11/8/2016 Parcel Tax $1,890,000,000 $491,400,000 Pass 74.90%Napa County Regional Park and Open Space District County 11/8/2016 Sales tax $112,000,000 $72,800,000 Fail 64.70%San Diego County County 11/8/2016 Sales tax $18,000,000,000 ############ Fail 58.37%Sonoma County County 11/8/2016 Sales tax $100,000,000 $23,750,000 Fail 65.12%Monterey Peninsula Regional Park District County 11/8/2016 Parcel Tax $24,000,000 $16,800,000 Pass 71.88%Oakland Municipal 11/8/2016 Bond $600,000,000 $0 Pass 82.11%Mountain Recreation and Conservation Authority Special District 11/8/2016 Parcel Tax $4,820,000 $2,892,000 Pass 76.99%Mountain Recreation and Conservation Authority Special District 11/8/2016 Parcel Tax $19,900,000 $11,940,000 Pass 83.68%San Francisco Bay Restoration Authority Special District 6/7/2016 Parcel Tax $500,000,000 $0 Pass 70.32%Santa Clara County County 6/7/2016 Charter Amendment $795,000,000 $79,500,000 Pass 78.08%San Francisco Municipal 6/7/2016 Budget Allocation $2,662,900,000 $133,145,000 Pass 60.05%San Carlos Municipal 11/3/2015 Bond $45,000,000 $45,000,000 Fail 39.49%
San Luis Obispo Municipal 11/4/2014 Sales tax $52,000,000 $2,600,000 Pass 70.32%Santa Clara County Open Space Authority County 11/4/2014 Parcel Tax $118,256,400 $43,500,000 Pass 67.95%Los Angeles County County 11/4/2014 Parcel Tax $1,627,458,840 $895,102,362 Fail 62.89%Midpeninsula Regional Open Space District Special District 6/3/2014 Bond $300,000,000 $174,000,000 Pass 67.96%Novato Special District 4/8/2014 Bond $600,000 $600,000 Pass 95.17%Laguna Beach Municipal 11/6/2012 Parcel Tax $20,000,000 $20,000,000 Fail 44.82%San Francisco Municipal 11/6/2012 Bond $195,000,000 $7,500,000 Pass 72.11%Marin County County 11/6/2012 Sales tax $90,000,000 $30,000,000 Pass 74.37%Mountains Recreation and Conservation Authority Special District 11/6/2012 Parcel Tax $6,810,000 $1,702,500 Pass 76.18%Mountains Recreation and Conservation Authority Special District 11/6/2012 Parcel Tax $3,050,000 $762,500 Pass 68.67%Portola Valley Municipal 11/3/2009 Utility Tax $984,000 $984,000 Pass 65.92%East Bay Regional Park District Special District 11/4/2008 Bond $500,000,000 $375,000,000 Pass 71.92%San Juan Capistrano Municipal 11/4/2008 Bond $30,000,000 $30,000,000 Pass 70.26%Pasadena Municipal 10/27/2008 Benefit Assessment $1,364,090 $1,364,090 Pass 60.38%San Mateo County County 6/3/2008 Sales tax $401,862,150 Fail 60.52%San Francisco Municipal 2/5/2008 Bond $185,000,000 $5,000,000 Pass 71.33%Santa Clarita Municipal 7/10/2007 Benefit Assessment $46,683,000 $46,683,000 Pass 62.77%Castro Valley Municipal 11/7/2006 Bond $30,000,000 $15,500,000 Fail 62.62%Sonoma County Agricultural Preservation and Open Space DistrictCounty 11/7/2006 Sales tax $340,000,000 $340,000,000 Pass 75.75%Orange County County 11/7/2006 Sales tax $11,800,000,000 $244,000,000 Pass 69.66%Claremont Municipal 11/7/2006 Bond $12,500,000 $12,500,000 Pass 70.78%San Luis Obispo Municipal 11/7/2006 Sales tax $45,000,000 $2,250,000 Pass 64.77%Santa Monica Municipal 11/7/2006 Parcel Tax $47,000,000 $11,750,000 Pass 67.03%Claremont Municipal 7/25/2006 Benefit Assessment $45,991,610 $32,194,127 Fail 44.00%Santa Clara County County 6/6/2006 Property tax $368,400,000 $73,680,000 Pass 71.03%Santa Clarita Municipal 11/22/2005 Benefit Assessment $29,300,000 $17,580,000 Fail 46.95%Portola Valley Municipal 11/8/2005 Utility Tax $800,000 $800,000 Pass 57.74%Seaclif f Special District 5/3/2005 Parcel Tax $1,800,000 $1,800,000 Fail 62.71%Carmel-by-the-Sea Municipal 4/5/2005 Lodging Tax $15,000,000 $4,000,000 Fail 54.25%Marinw ood Community Services District Special District 3/8/2005 Parcel Tax $5,200,000 $1,800,000 Pass 70.96%Ventura County County 11/2/2004 Sales tax $250,000,000 $250,000,000 Fail 48.74%San Diego County County 11/2/2004 Sales tax $14,000,000,000 $880,000,000 Pass 67.01%Los Angeles Municipal 11/2/2004 Bond $500,000,000 $100,000,000 Pass 76.30%Martinez Municipal 11/2/2004 Bond $30,000,000 $30,000,000 Fail 61.85%Valley Center Parks And Recreation District Special District 11/2/2004 Parcel Tax $10,000,000 $10,000,000 Fail 57.34%Sacramento County County 11/2/2004 Sales tax $4,740,000,000 $48,000,000 Pass 75.29%Monterey Peninsula Regional Park District Special District 8/2/2004 Benefit Assessment $15,000,000 $15,000,000 Pass 60.10%Contra Costa County County 7/27/2004 Benefit Assessment $167,320,000 $18,102,000 Fail 50.12%Lompico Special District 4/13/2004 Parcel Tax $60,000 $60,000 Fail 52.60%Oakland Municipal 11/5/2002 Bond $198,250,000 $50,000,000 Pass 80.04%Valley Center Park and Recreation District Special District 11/5/2002 Parcel Tax $6,600,000 $6,600,000 Fail 60.93%Carlsbad Municipal 11/5/2002 Buget Allocation Pass 59.70%Santa Monica Mountains Open Space Preservation Assessment District 1Special District 8/1/2002 Benefit Assessment $25,600,000 $25,600,000 PassSanta Monica Mountains Open Space Preservation Assessment District 2Special District 8/1/2002 Benefit Assessment PassGranite Bay Assessment District for Park and RecreationSpecial District 11/20/2001 Benefit Assessment $8,388,000 $8,388,000 Pass 63.36%Santa Clara County Open Space Authority County 11/6/2001 Benefit Assessment $160,000,000 $160,000,000 Pass*Malibu Municipal 11/6/2001 Bond $15,000,000 $15,000,000 Fail 61.30%Portola Valley Municipal 11/6/2001 Utility Tax $760,000 $760,000 Pass 73.54%Duarte Municipal 6/26/2001 Parcel Tax $5,000,000 $5,000,000 Fail 41.10%Davis Municipal 11/7/2000 Parcel Tax $17,500,000 $17,500,000 Pass 70.45%Napa County County 11/7/2000 Lodging Tax $14,900,000 $640,700 Fail 63.67%Placer County County 11/7/2000 Sales tax $200,000,000 $150,000,000 Fail 27.36%Monrovia Municipal 7/11/2000 Parcel Tax $10,000,000 $10,000,000 Pass 77.29%San Francisco County County 3/7/2000 Bond $110,000,000 $4,000,000 Pass 78.79%San Francisco Municipal 3/7/2000 Property tax $510,000,000 $150,000,000 Pass 73.76%
Local California Conservation Measures, 2000-2016
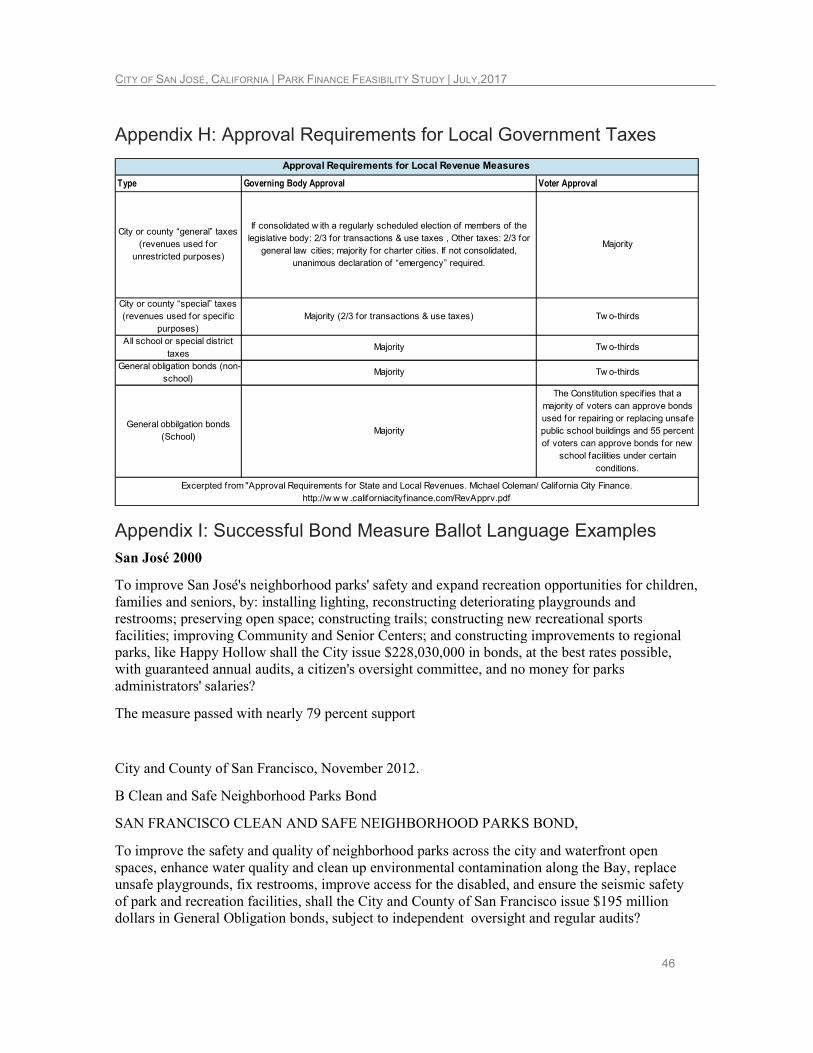
CITY OF SAN JOSÉ, CALIFORNIA | PARK FINANCE FEASIBILITY STUDY | JULY,2017
46
Appendix H: Approval Requirements for Local Government Taxes
Type Governing Body Approval Voter Approval
City or county “general” taxes (revenues used for
unrestricted purposes)
If consolidated w ith a regularly scheduled election of members of the legislative body: 2/3 for transactions & use taxes , Other taxes: 2/3 for
general law cities; majority for charter cities. If not consolidated, unanimous declaration of “emergency” required.
Majority
City or county “special” taxes (revenues used for specif ic
purposes)Majority (2/3 for transactions & use taxes) Tw o-thirds
All school or special district taxes
Majority Tw o-thirds
General obligation bonds (non-school)
Majority Tw o-thirds
General obbilgation bonds (School)
Majority
The Constitution specif ies that a majority of voters can approve bonds used for repairing or replacing unsafe public school buildings and 55 percent of voters can approve bonds for new
school facilities under certain conditions.
Excerpted from "Approval Requirements for State and Local Revenues. Michael Coleman/ California City Finance. http://w w w .californiacityfinance.com/RevApprv.pdf
Approval Requirements for Local Revenue Measures
Appendix I: Successful Bond Measure Ballot Language Examples San José 2000
To improve San José's neighborhood parks' safety and expand recreation opportunities for children, families and seniors, by: installing lighting, reconstructing deteriorating playgrounds and restrooms; preserving open space; constructing trails; constructing new recreational sports facilities; improving Community and Senior Centers; and constructing improvements to regional parks, like Happy Hollow shall the City issue $228,030,000 in bonds, at the best rates possible, with guaranteed annual audits, a citizen's oversight committee, and no money for parks administrators' salaries?
The measure passed with nearly 79 percent support
City and County of San Francisco, November 2012.
B Clean and Safe Neighborhood Parks Bond
SAN FRANCISCO CLEAN AND SAFE NEIGHBORHOOD PARKS BOND,
To improve the safety and quality of neighborhood parks across the city and waterfront open spaces, enhance water quality and clean up environmental contamination along the Bay, replace unsafe playgrounds, fix restrooms, improve access for the disabled, and ensure the seismic safety of park and recreation facilities, shall the City and County of San Francisco issue $195 million dollars in General Obligation bonds, subject to independent oversight and regular audits?

CITY OF SAN JOSÉ, CALIFORNIA | PARK FINANCE FEASIBILITY STUDY | JULY, 2017
47
The measure passed with 72 percent support.
Appendix J: Successful Parcel Tax Ballot Language Examples Los Angeles County Measure A – November 2016
Safe, Clean Neighborhood Parks, Open Space, Beaches, Rivers Protection, and Water Conservation Measure. To replace expiring local funding for safe, clean neighborhood/ city/ county parks; increase safe playgrounds, reduce gang activity; keep neighborhood recreation/ senior centers, drinking water safe; protect beaches, rivers, water resources, remaining natural areas/ open space; shall 1.5 cents be levied annually per square foot of improved property in Los Angeles County, with bond authority, requiring citizen oversight, independent audits, and funds used locally?
The measure passed with 74 percent support.
Appendix K: San José 2016 Measure B Text June 2016
To fund essential City services such as: improving police response to reduce violent crimes and burglaries; improving 911/emergency medical/fire response times; repairing potholes and streets; expanding gang prevention; and maintaining the City’s long-term financial stability, shall the City of San José enact a ¼ percent sales tax for 15 years, providing about $40 million annually, requiring Independent Citizens Oversight with public review of spending, and all revenues controlled locally?
The measure passed with 61 percent support.
Appendix L: Successful Sales Tax Measure Ballot Language City of San Luis Obispo, San Luis Obispo County. November 2014.
CITY OF SAN LUIS OBISPO
MEASURE G-14
To protect and maintain essential services and facilities -- such as open space preservation; bike lanes and sidewalks; public safety; neighborhood street paving and code enforcement; flood protection; senior programs; and other vital services and capital improvement projects -- shall the City’s Municipal Code be amended to extend the current one-half percent local sales tax for eight years, with independent annual audits, public goal-setting and budgeting, and a Citizens’ Oversight Commission?
The measure passed with 70 percent support. Voters approved the initial increase in 2006.
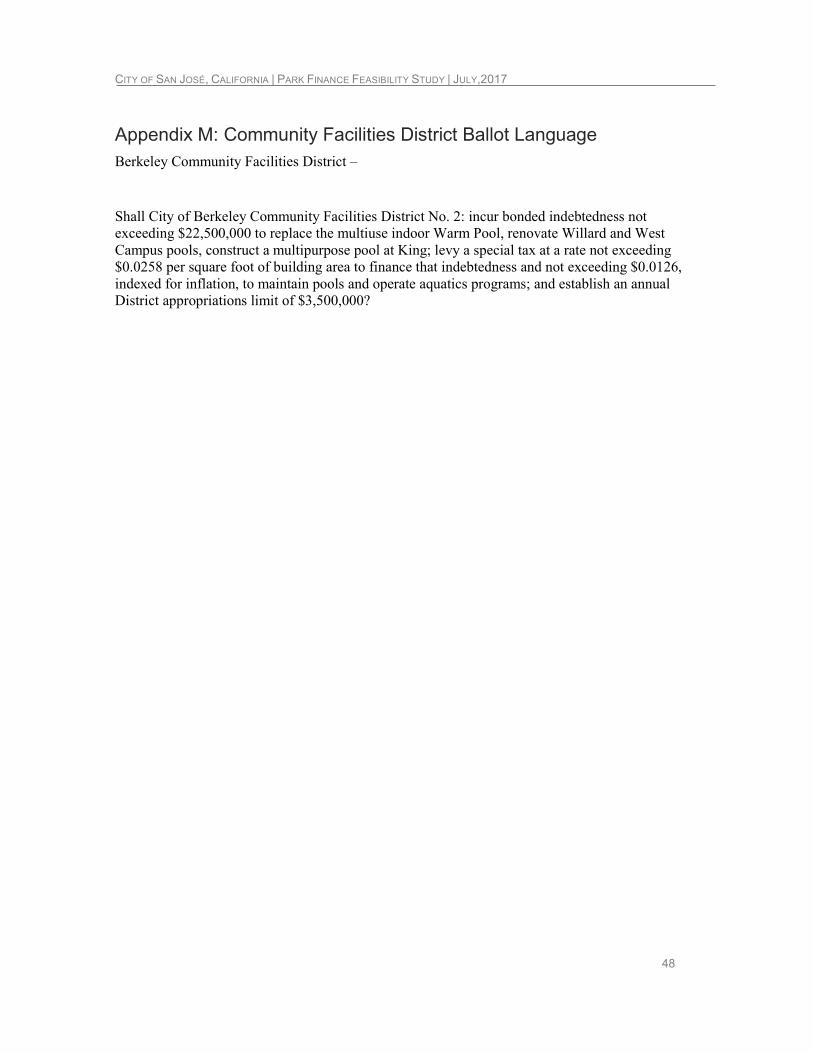
CITY OF SAN JOSÉ, CALIFORNIA | PARK FINANCE FEASIBILITY STUDY | JULY,2017
48
Appendix M: Community Facilities District Ballot Language Berkeley Community Facilities District –
Shall City of Berkeley Community Facilities District No. 2: incur bonded indebtedness not exceeding $22,500,000 to replace the multiuse indoor Warm Pool, renovate Willard and West Campus pools, construct a multipurpose pool at King; levy a special tax at a rate not exceeding $0.0258 per square foot of building area to finance that indebtedness and not exceeding $0.0126, indexed for inflation, to maintain pools and operate aquatics programs; and establish an annual District appropriations limit of $3,500,000?
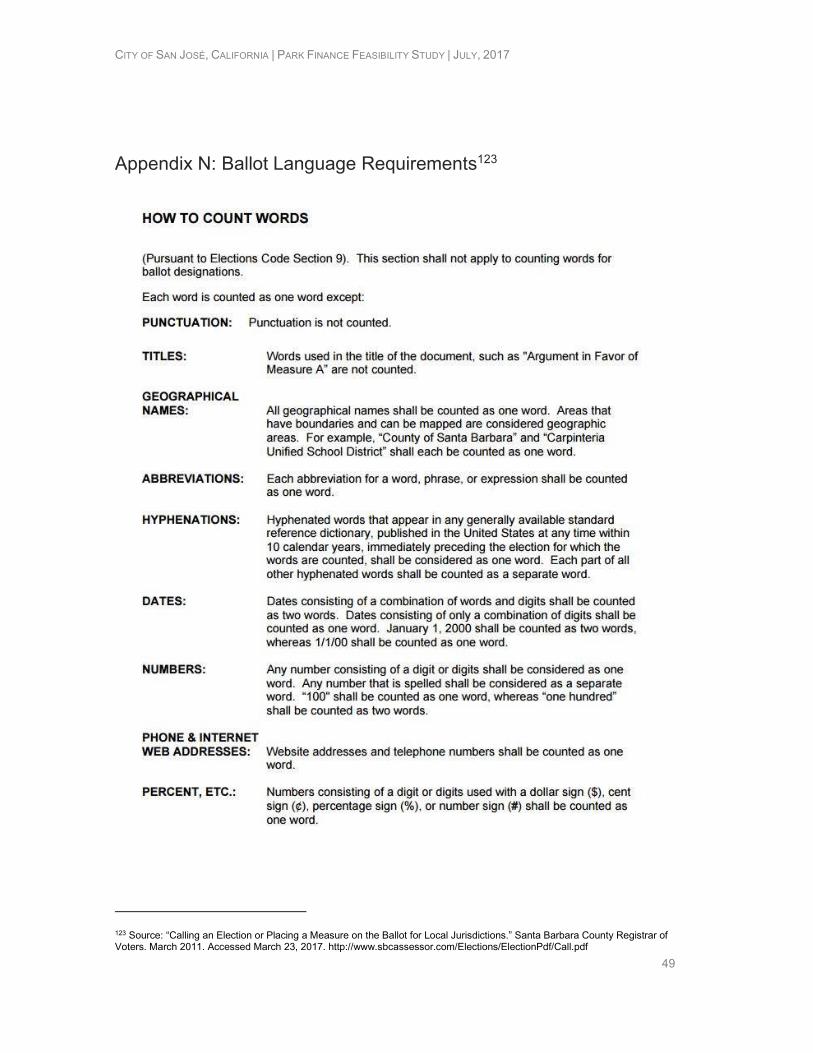
CITY OF SAN JOSÉ, CALIFORNIA | PARK FINANCE FEASIBILITY STUDY | JULY, 2017
49
Appendix N: Ballot Language Requirements123
123 Source: “Calling an Election or Placing a Measure on the Ballot for Local Jurisdictions.” Santa Barbara County Registrar of Voters. March 2011. Accessed March 23, 2017. http://www.sbcassessor.com/Elections/ElectionPdf/Call.pdf
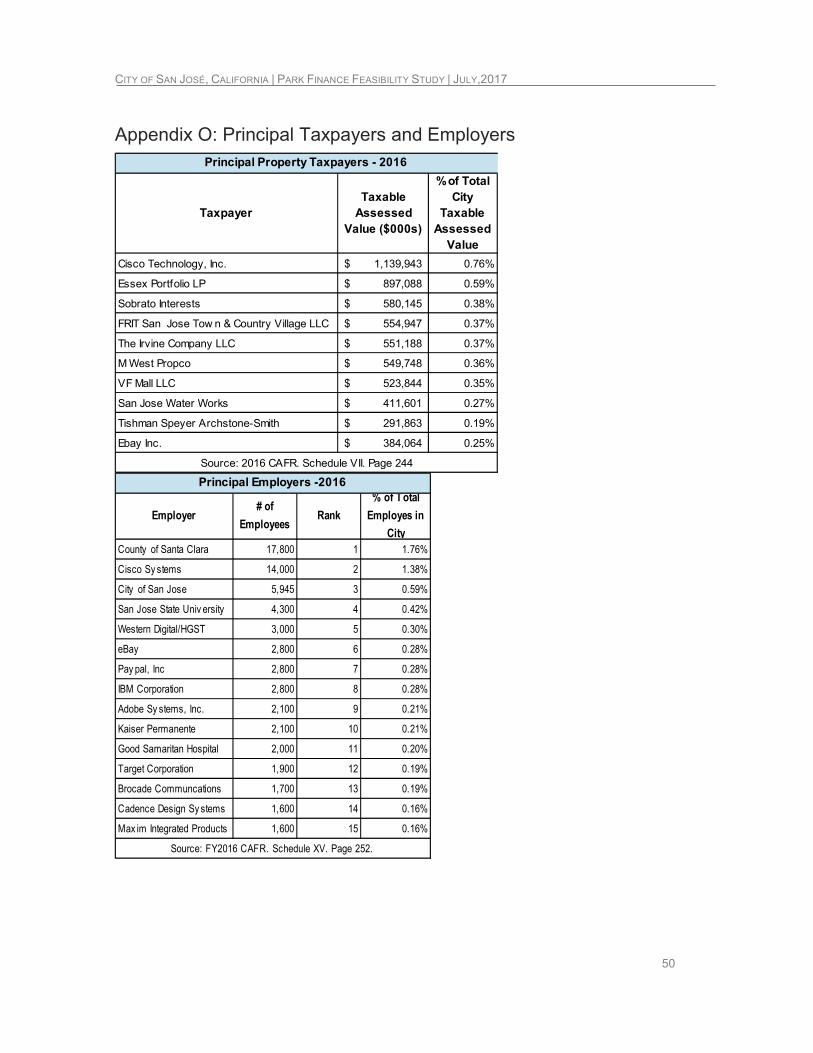
CITY OF SAN JOSÉ, CALIFORNIA | PARK FINANCE FEASIBILITY STUDY | JULY,2017
50
Appendix O: Principal Taxpayers and Employers
Taxpayer
Taxable
Assessed
Value ($000s)
% of Total
City
Taxable
Assessed
Value
Cisco Technology, Inc. 1,139,943$ 0.76%
Essex Portfolio LP 897,088$ 0.59%
Sobrato Interests 580,145$ 0.38%
FRIT San Jose Tow n & Country Village LLC 554,947$ 0.37%
The Irvine Company LLC 551,188$ 0.37%
M West Propco 549,748$ 0.36%
VF Mall LLC 523,844$ 0.35%
San Jose Water Works 411,601$ 0.27%
Tishman Speyer Archstone-Smith 291,863$ 0.19%
Ebay Inc. 384,064$ 0.25%
Principal Property Taxpayers - 2016
Source: 2016 CAFR. Schedule VII. Page 244
Employer# of
EmployeesRank
% of Total
Employes in
City
County of Santa Clara 17,800 1 1.76%
Cisco Sy stems 14,000 2 1.38%
City of San Jose 5,945 3 0.59%
San Jose State Univ ersity 4,300 4 0.42%
Western Digital/HGST 3,000 5 0.30%
eBay 2,800 6 0.28%
Pay pal, Inc 2,800 7 0.28%
IBM Corporation 2,800 8 0.28%
Adobe Sy stems, Inc. 2,100 9 0.21%
Kaiser Permanente 2,100 10 0.21%
Good Samaritan Hospital 2,000 11 0.20%
Target Corporation 1,900 12 0.19%
Brocade Communcations 1,700 13 0.19%
Cadence Design Sy stems 1,600 14 0.16%
Max im Integrated Products 1,600 15 0.16%
Source: FY2016 CAFR. Schedule XV. Page 252.
Principal Employers -2016
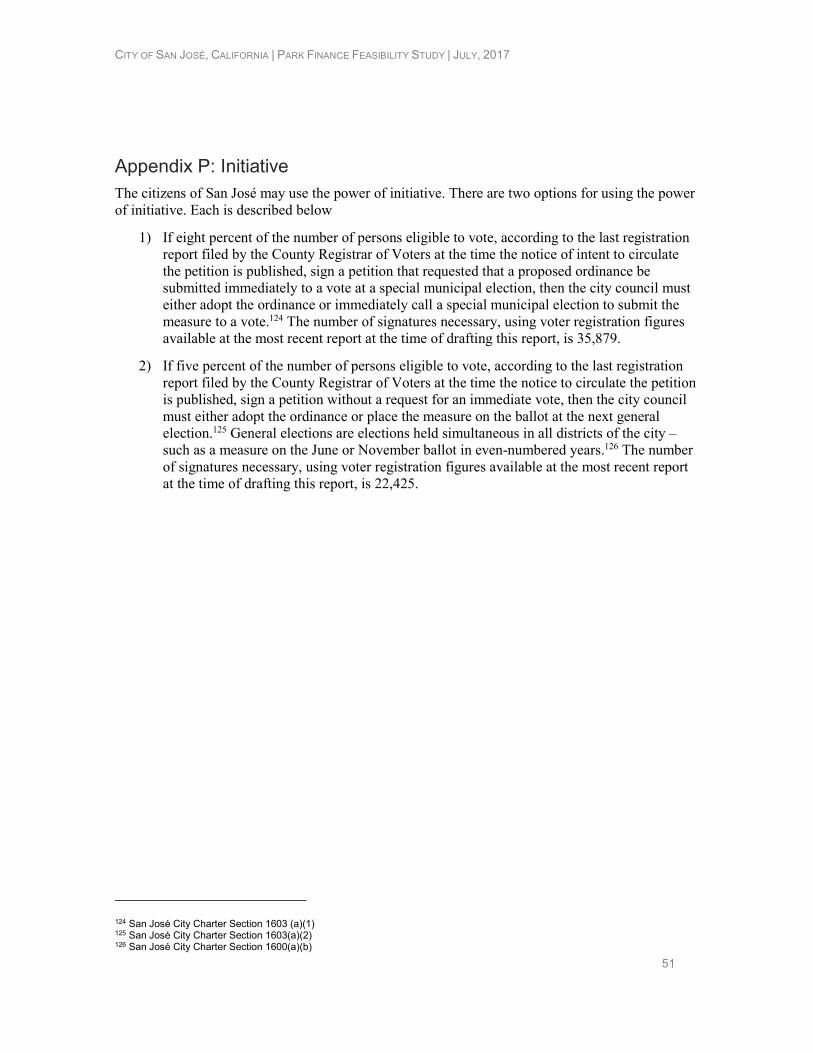
CITY OF SAN JOSÉ, CALIFORNIA | PARK FINANCE FEASIBILITY STUDY | JULY, 2017
51
Appendix P: Initiative The citizens of San José may use the power of initiative. There are two options for using the power of initiative. Each is described below
1) If eight percent of the number of persons eligible to vote, according to the last registration report filed by the County Registrar of Voters at the time the notice of intent to circulate the petition is published, sign a petition that requested that a proposed ordinance be submitted immediately to a vote at a special municipal election, then the city council must either adopt the ordinance or immediately call a special municipal election to submit the measure to a vote.124 The number of signatures necessary, using voter registration figures available at the most recent report at the time of drafting this report, is 35,879.
2) If five percent of the number of persons eligible to vote, according to the last registration report filed by the County Registrar of Voters at the time the notice to circulate the petition is published, sign a petition without a request for an immediate vote, then the city council must either adopt the ordinance or place the measure on the ballot at the next general election.125 General elections are elections held simultaneous in all districts of the city – such as a measure on the June or November ballot in even-numbered years.126 The number of signatures necessary, using voter registration figures available at the most recent report at the time of drafting this report, is 22,425.
124 San José City Charter Section 1603 (a)(1) 125 San José City Charter Section 1603(a)(2) 126 San José City Charter Section 1600(a)(b)
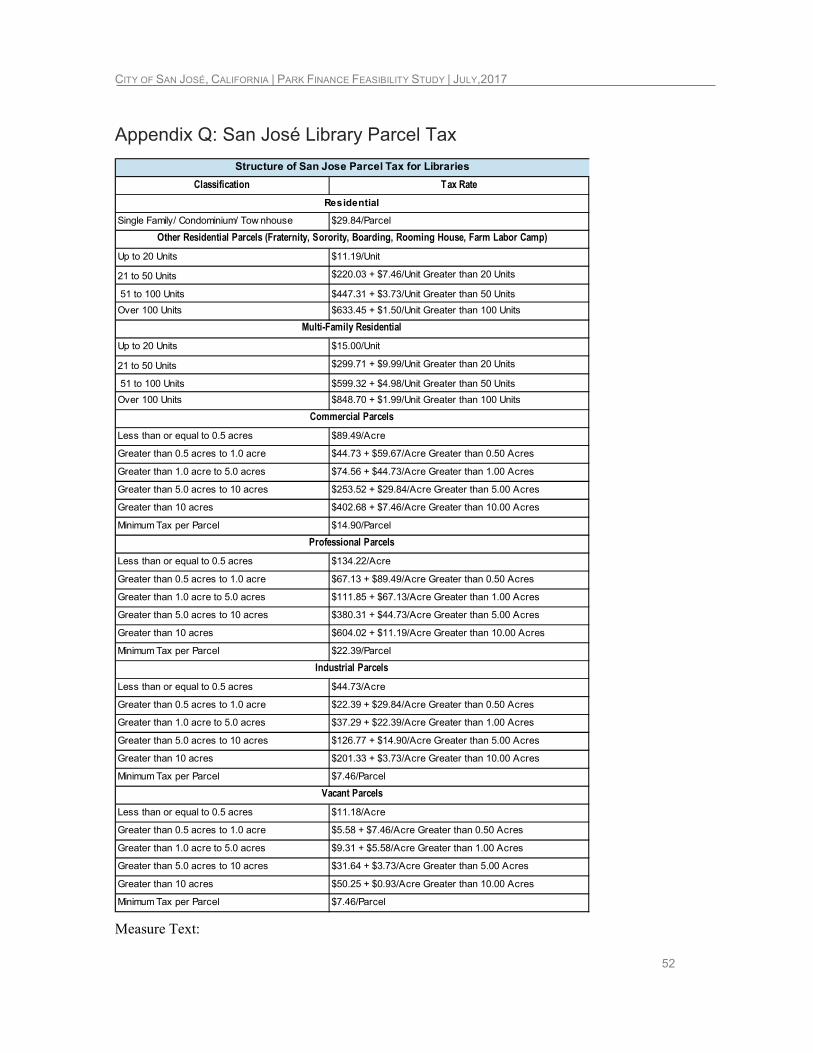
CITY OF SAN JOSÉ, CALIFORNIA | PARK FINANCE FEASIBILITY STUDY | JULY,2017
52
Appendix Q: San José Library Parcel Tax
Classification Tax Rate
Single Family/ Condominium/ Tow nhouse $29.84/Parcel
Up to 20 Units $11.19/Unit
21 to 50 Units $220.03 + $7.46/Unit Greater than 20 Units
51 to 100 Units $447.31 + $3.73/Unit Greater than 50 Units
Over 100 Units $633.45 + $1.50/Unit Greater than 100 Units
Up to 20 Units $15.00/Unit
21 to 50 Units $299.71 + $9.99/Unit Greater than 20 Units
51 to 100 Units $599.32 + $4.98/Unit Greater than 50 Units
Over 100 Units $848.70 + $1.99/Unit Greater than 100 Units
Less than or equal to 0.5 acres $89.49/Acre
Greater than 0.5 acres to 1.0 acre $44.73 + $59.67/Acre Greater than 0.50 Acres
Greater than 1.0 acre to 5.0 acres $74.56 + $44.73/Acre Greater than 1.00 Acres
Greater than 5.0 acres to 10 acres $253.52 + $29.84/Acre Greater than 5.00 Acres
Greater than 10 acres $402.68 + $7.46/Acre Greater than 10.00 Acres
Minimum Tax per Parcel $14.90/Parcel
Less than or equal to 0.5 acres $134.22/Acre
Greater than 0.5 acres to 1.0 acre $67.13 + $89.49/Acre Greater than 0.50 Acres
Greater than 1.0 acre to 5.0 acres $111.85 + $67.13/Acre Greater than 1.00 Acres
Greater than 5.0 acres to 10 acres $380.31 + $44.73/Acre Greater than 5.00 Acres
Greater than 10 acres $604.02 + $11.19/Acre Greater than 10.00 Acres
Minimum Tax per Parcel $22.39/Parcel
Less than or equal to 0.5 acres $44.73/Acre
Greater than 0.5 acres to 1.0 acre $22.39 + $29.84/Acre Greater than 0.50 Acres
Greater than 1.0 acre to 5.0 acres $37.29 + $22.39/Acre Greater than 1.00 Acres
Greater than 5.0 acres to 10 acres $126.77 + $14.90/Acre Greater than 5.00 Acres
Greater than 10 acres $201.33 + $3.73/Acre Greater than 10.00 Acres
Minimum Tax per Parcel $7.46/Parcel
Less than or equal to 0.5 acres $11.18/Acre
Greater than 0.5 acres to 1.0 acre $5.58 + $7.46/Acre Greater than 0.50 Acres
Greater than 1.0 acre to 5.0 acres $9.31 + $5.58/Acre Greater than 1.00 Acres
Greater than 5.0 acres to 10 acres $31.64 + $3.73/Acre Greater than 5.00 Acres
Greater than 10 acres $50.25 + $0.93/Acre Greater than 10.00 Acres
Minimum Tax per Parcel $7.46/Parcel
Structure of San Jose Parcel Tax for Libraries
Vacant Parcels
Other Residential Parcels (Fraternity, Sorority, Boarding, Rooming House, Farm Labor Camp)
Multi-Family Residential
Professional Parcels
Commercial Parcels
Industrial Parcels
Residential
Measure Text:
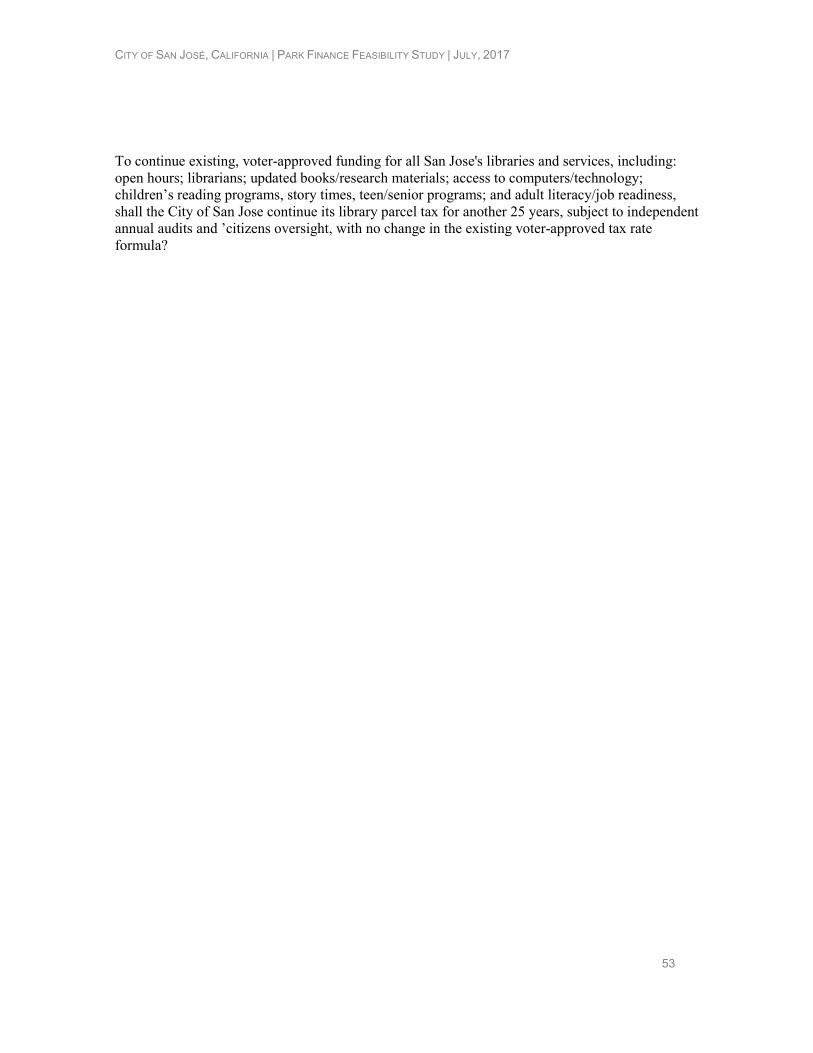
CITY OF SAN JOSÉ, CALIFORNIA | PARK FINANCE FEASIBILITY STUDY | JULY, 2017
53
To continue existing, voter-approved funding for all San Jose's libraries and services, including: open hours; librarians; updated books/research materials; access to computers/technology; children’s reading programs, story times, teen/senior programs; and adult literacy/job readiness, shall the City of San Jose continue its library parcel tax for another 25 years, subject to independent annual audits and ’citizens oversight, with no change in the existing voter-approved tax rate formula?
CITY OF SAN JOSÉ, CALIFORNIA | PARK FINANCE FEASIBILITY STUDY | JULY,2017
54
With any questions or for more information please contact:
Mary Creasman
California Director of Government Affairs The Trust for Public Land
415-800-5309 [email protected]
or
Andrew Flynn
Conservation Finance Research Associate The Trust for Public Land
415-800-5270 [email protected]
www.tpl.org