tpl life · automobile assembler, power generation and distribution, oil and gas marketing...
TRANSCRIPT

June 2017
August 2019
Fund Performance Report
TPL LIFE
July 2015
2 of 7
August 2019
FUND MANAGER REPORT
Yield Curve
Macro Review and Outlook:
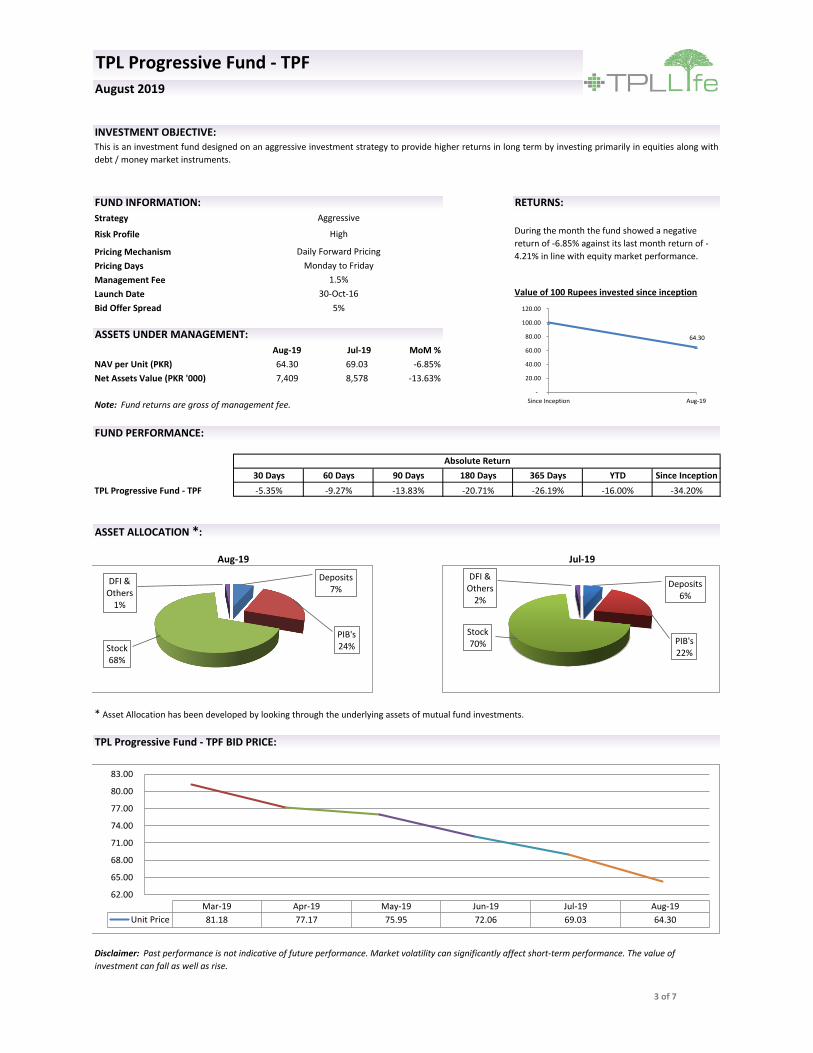
The KSE-100 Index closed negative for seventh consecutive month in August 2019, closing at
29,672 points down 7.10%. The index remained under pressure as concerns regarding Pak-
India tension over Kashmir, weakening economy and persistent current account deficit
weighed down on the investor sentiments.
Sectors that outperformed the benchmark during the period included Engineering, Fertilizer,
Cement and Commercial Banks. Sectors that underperformed the benchmark included
Automobile Assembler, Power Generation and Distribution, Oil and Gas Marketing Companies
and Oil and Gas Exploration Companies. This was on the back of rising interest and financing
rates, increased dependency on RLNG based power generation and PKR devaluation.
Moving ahead, Pakistan equities are expected to remain range bound due to tough
macroeconomic environment. Currently the market is trading at a P.E multiple of 5.20x and
has a dividend yield of 9.50%.
During the month of August 2019, SBP conducted two T-bill auctions with a cumulative target
of PKR 2,600 billion against the maturity of PKR 3,341 billion. The total accepted amount was
PKR 1,887 billion majorly belonging to 3M tenor. The cut-off yields were 13.75%, 13.94% and
14.24% for 3M, 6M and 12M tenor respectively.
SBP conducted Fixed PIB auction with a target of PKR 100 billion against the maturity of PKR 9
billion. Cumulative participation of PKR 877.80 billion was received in 3Y, 5Y and 10Y tenors.
The government accepted PKR 368.40 billion, PKR 46.20 billion and PKR 19.40 billion in the 3Y,
5Y and 10Y tenors respectively. The cut off yields were 14.25%, 13.55% and 13.15%
respectively. In the floating PIB auction the government accepted PKR 42 billion and set spread
at a cut-off of 75bps over the benchmark.
Going forward, we believe that market may continue its positive momentum in the coming
month. However, any unexpected change in inflationary numbers will be critical in setting the
direction of the market.
Equity Market Review and Outlook:
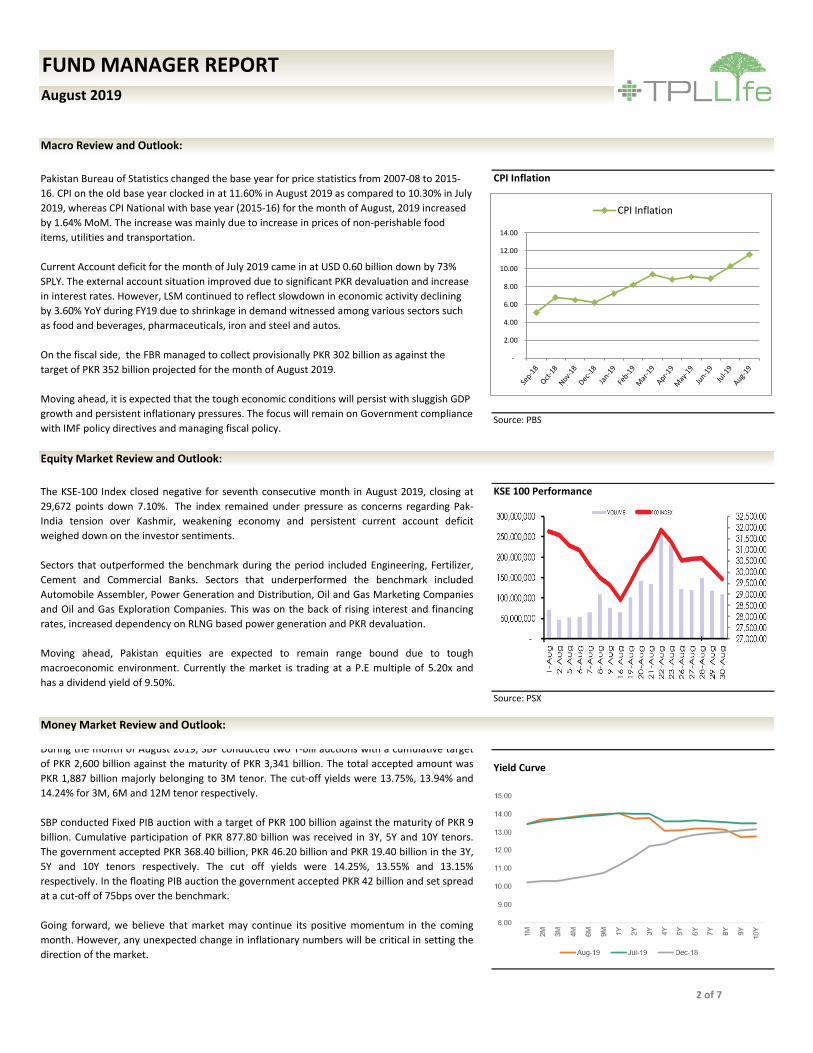
Pakistan Bureau of Statistics changed the base year for price statistics from 2007-08 to 2015-
16. CPI on the old base year clocked in at 11.60% in August 2019 as compared to 10.30% in July
2019, whereas CPI National with base year (2015-16) for the month of August, 2019 increased
by 1.64% MoM. The increase was mainly due to increase in prices of non-perishable food
items, utilities and transportation.
Current Account deficit for the month of July 2019 came in at USD 0.60 billion down by 73%
SPLY. The external account situation improved due to significant PKR devaluation and increase
in interest rates. However, LSM continued to reflect slowdown in economic activity declining
by 3.60% YoY during FY19 due to shrinkage in demand witnessed among various sectors such
as food and beverages, pharmaceuticals, iron and steel and autos.
On the fiscal side, the FBR managed to collect provisionally PKR 302 billion as against the
target of PKR 352 billion projected for the month of August 2019.
Moving ahead, it is expected that the tough economic conditions will persist with sluggish GDP
growth and persistent inflationary pressures. The focus will remain on Government compliance
with IMF policy directives and managing fiscal policy.
CPI Inflation
Source: PBS
KSE 100 Performance
Source: PSX
Money Market Review and Outlook:
-
2.00
4.00
6.00
8.00
10.00
12.00
14.00
CPI Inflation
Strategy
Risk Profile
Pricing Mechanism
Pricing Days
Management Fee
Launch Date
Bid Offer Spread 5%
Aug-19 Jul-19 MoM %
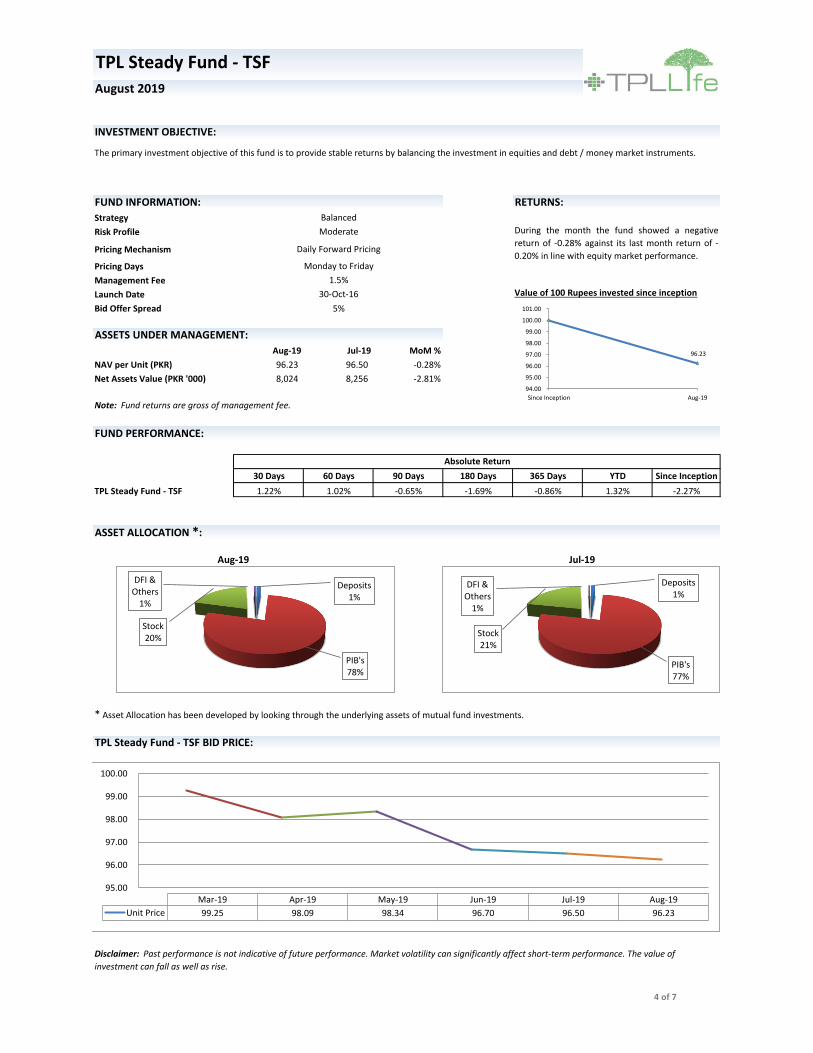
NAV per Unit (PKR) 64.30 69.03 -6.85%
Net Assets Value (PKR '000) 7,409 8,578 -13.63%
30 Days 60 Days 90 Days 180 Days 365 Days YTD Since Inception
TPL Progressive Fund - TPF -5.35% -9.27% -13.83% -20.71% -26.19% -16.00% -34.20%
* Asset Allocation has been developed by looking through the underlying assets of mutual fund investments.
June 2017
3 of 7
TPL Progressive Fund - TPF
INVESTMENT OBJECTIVE:This is an investment fund designed on an aggressive investment strategy to provide higher returns in long term by investing primarily in equities along with
debt / money market instruments.
FUND INFORMATION: RETURNS:
August 2019
Note: Fund returns are gross of management fee.
ASSETS UNDER MANAGEMENT:
Absolute Return
TPL Progressive Fund - TPF BID PRICE:
During the month the fund showed a negative
return of -6.85% against its last month return of -
4.21% in line with equity market performance.
Value of 100 Rupees invested since inception
Aggressive
High
Daily Forward Pricing
Monday to Friday
1.5%
30-Oct-16
Disclaimer: Past performance is not indicative of future performance. Market volatility can significantly affect short-term performance. The value of
investment can fall as well as rise.
ASSET ALLOCATION *:
Aug-19 Jul-19
FUND PERFORMANCE:
62.00
65.00
68.00
71.00
74.00
77.00
80.00
83.00
Mar-19 Apr-19 May-19 Jun-19 Jul-19 Aug-19
Unit Price 81.18 77.17 75.95 72.06 69.03 64.30
Deposits6%
PIB's22%
Stock70%
DFI & Others
2%
Deposits7%
PIB's24%Stock
68%
DFI & Others
1%
64.30
-
20.00
40.00
60.00
80.00
100.00
120.00
Since Inception Aug-19
Strategy
Risk Profile
Pricing Mechanism
Pricing Days
Management Fee
Launch Date
Bid Offer Spread 5%
Aug-19 Jul-19 MoM %
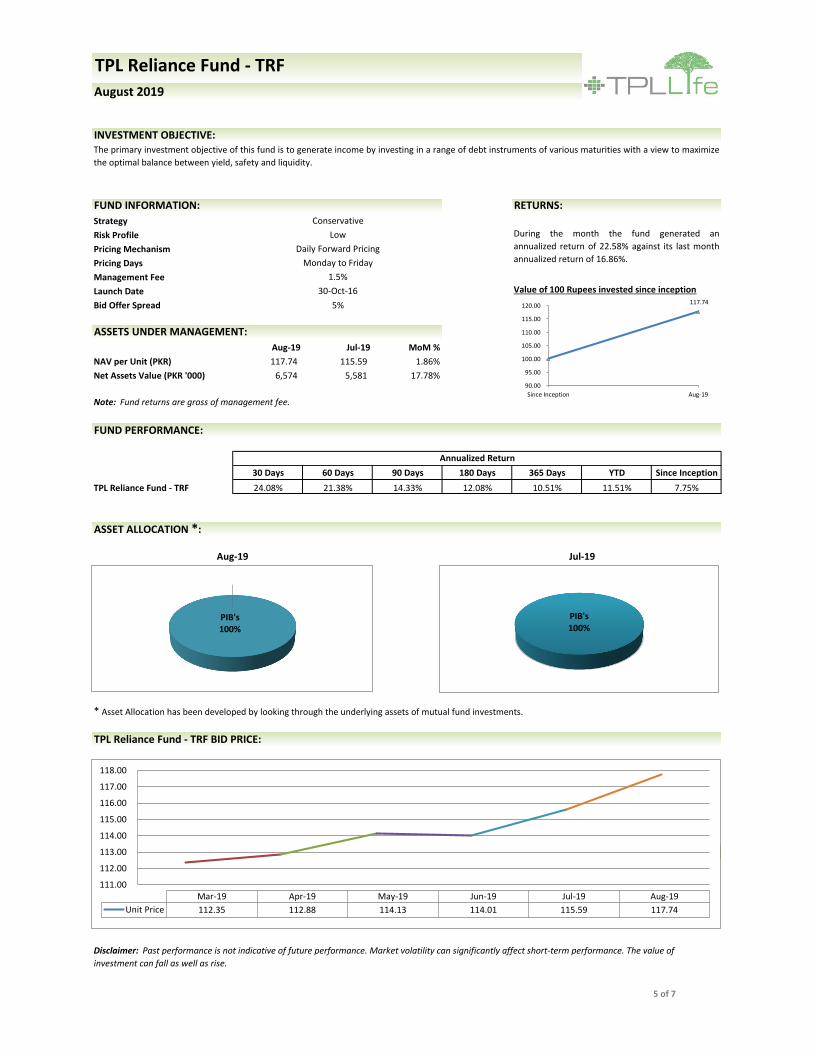
NAV per Unit (PKR) 96.23 96.50 -0.28%
Net Assets Value (PKR '000) 8,024 8,256 -2.81%
30 Days 60 Days 90 Days 180 Days 365 Days YTD Since Inception
TPL Steady Fund - TSF 1.22% 1.02% -0.65% -1.69% -0.86% 1.32% -2.27%
* Asset Allocation has been developed by looking through the underlying assets of mutual fund investments.
June 2017
4 of 7
Balanced
Moderate
Daily Forward Pricing
Monday to Friday
1.5%
TPL Steady Fund - TSF
INVESTMENT OBJECTIVE:
The primary investment objective of this fund is to provide stable returns by balancing the investment in equities and debt / money market instruments.
FUND INFORMATION: RETURNS:
August 2019
Note: Fund returns are gross of management fee.
ASSETS UNDER MANAGEMENT:
Absolute Return
TPL Steady Fund - TSF BID PRICE:
During the month the fund showed a negative
return of -0.28% against its last month return of -
0.20% in line with equity market performance.
Value of 100 Rupees invested since inception30-Oct-16
Disclaimer: Past performance is not indicative of future performance. Market volatility can significantly affect short-term performance. The value of
investment can fall as well as rise.
ASSET ALLOCATION *:
Aug-19 Jul-19
FUND PERFORMANCE:
95.00
96.00
97.00
98.00
99.00
100.00
Mar-19 Apr-19 May-19 Jun-19 Jul-19 Aug-19
Unit Price 99.25 98.09 98.34 96.70 96.50 96.23
Deposits1%
PIB's77%
Stock21%
DFI & Others
1%
96.23
94.00
95.00
96.00
97.00
98.00
99.00
100.00
101.00
Since Inception Aug-19
Deposits1%
PIB's78%
Stock20%
DFI & Others
1%
Strategy
Risk Profile
Pricing Mechanism
Pricing Days
Management Fee
Launch Date
Bid Offer Spread 5%
Aug-19 Jul-19 MoM %
NAV per Unit (PKR) 117.74 115.59 1.86%
Net Assets Value (PKR '000) 6,574 5,581 17.78%
30 Days 60 Days 90 Days 180 Days 365 Days YTD Since Inception
TPL Reliance Fund - TRF 24.08% 21.38% 14.33% 12.08% 10.51% 11.51% 7.75%
* Asset Allocation has been developed by looking through the underlying assets of mutual fund investments.
June 2017
5 of 7
30-Oct-16
During the month the fund generated an
annualized return of 22.58% against its last month
annualized return of 16.86%.
Value of 100 Rupees invested since inception
INVESTMENT OBJECTIVE:The primary investment objective of this fund is to generate income by investing in a range of debt instruments of various maturities with a view to maximize
the optimal balance between yield, safety and liquidity.
FUND INFORMATION: RETURNS:
Conservative
Annualized Return
TPL Reliance Fund - TRF BID PRICE:
TPL Reliance Fund - TRF
IGI Conservative Fund - ICF BID PRICE:
Disclaimer: Past performance is not indicative of future performance. Market volatility can significantly affect short-term performance. The value of
investment can fall as well as rise.
ASSET ALLOCATION *:
Aug-19 Jul-19
FUND PERFORMANCE:
Note: Fund returns are gross of management fee.
ASSETS UNDER MANAGEMENT:
Low
Daily Forward Pricing
Monday to Friday
1.5%
August 2019
111.00
112.00
113.00
114.00
115.00
116.00
117.00
118.00
Mar-19 Apr-19 May-19 Jun-19 Jul-19 Aug-19
Unit Price 112.35 112.88 114.13 114.01 115.59 117.74
PIB's100%
PIB's100%
117.74
90.00
95.00
100.00
105.00
110.00
115.00
120.00
Since Inception Aug-19
Strategy
Risk Profile
Pricing Mechanism
Pricing Days
Management Fee
Launch Date
Bid Offer Spread 0%
Aug-19 Jul-19 MoM %
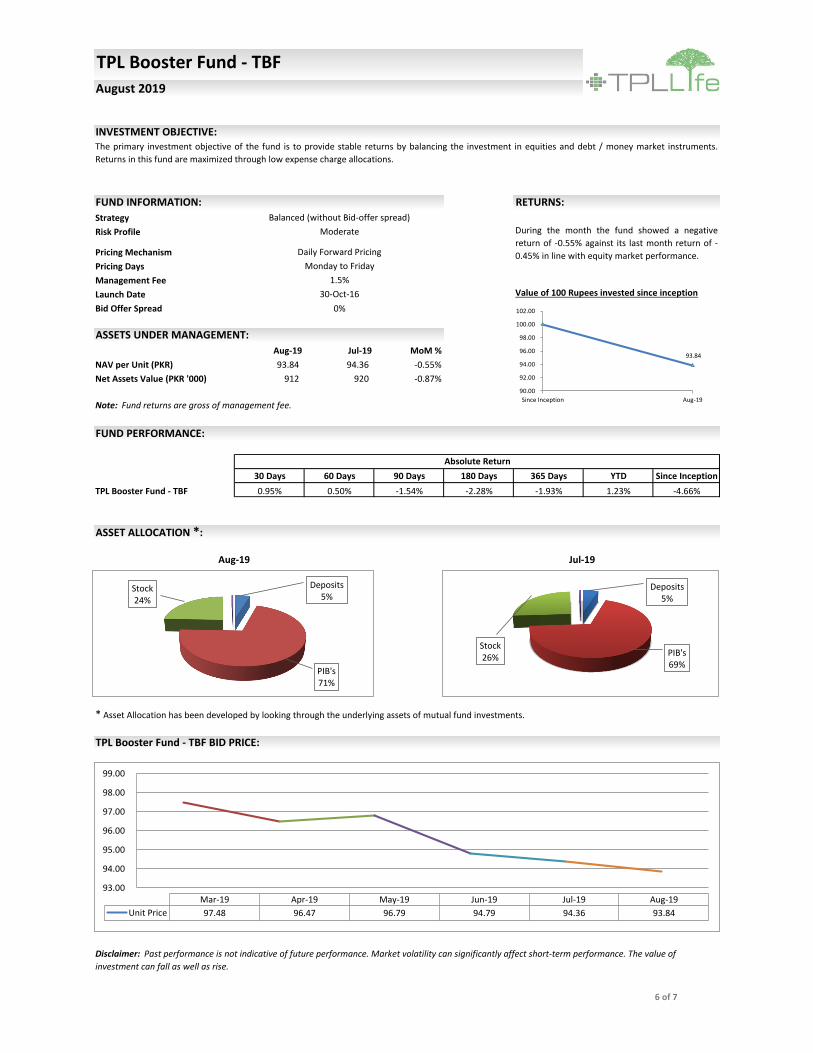
NAV per Unit (PKR) 93.84 94.36 -0.55%
Net Assets Value (PKR '000) 912 920 -0.87%
30 Days 60 Days 90 Days 180 Days 365 Days YTD Since Inception
TPL Booster Fund - TBF 0.95% 0.50% -1.54% -2.28% -1.93% 1.23% -4.66%
* Asset Allocation has been developed by looking through the underlying assets of mutual fund investments.
June 2017
6 of 7
Balanced (without Bid-offer spread)
Moderate
Daily Forward Pricing
Monday to Friday
1.5%
TPL Booster Fund - TBF
INVESTMENT OBJECTIVE:The primary investment objective of the fund is to provide stable returns by balancing the investment in equities and debt / money market instruments.
Returns in this fund are maximized through low expense charge allocations.
FUND INFORMATION: RETURNS:
August 2019
Note: Fund returns are gross of management fee.
ASSETS UNDER MANAGEMENT:
Absolute Return
TPL Booster Fund - TBF BID PRICE:
During the month the fund showed a negative
return of -0.55% against its last month return of -
0.45% in line with equity market performance.
Value of 100 Rupees invested since inception30-Oct-16
Disclaimer: Past performance is not indicative of future performance. Market volatility can significantly affect short-term performance. The value of
investment can fall as well as rise.
ASSET ALLOCATION *:
Aug-19 Jul-19
FUND PERFORMANCE:
93.00
94.00
95.00
96.00
97.00
98.00
99.00
Mar-19 Apr-19 May-19 Jun-19 Jul-19 Aug-19
Unit Price 97.48 96.47 96.79 94.79 94.36 93.84
Deposits5%
PIB's69%
Stock26%
Deposits5%
PIB's71%
Stock24%
93.84
90.00
92.00
94.00
96.00
98.00
100.00
102.00
Since Inception Aug-19
Strategy
Risk Profile
Pricing Mechanism
Pricing Days
Management Fee
Launch Date
Bid Offer Spread 5%
Aug-19 Jul-19 MoM %
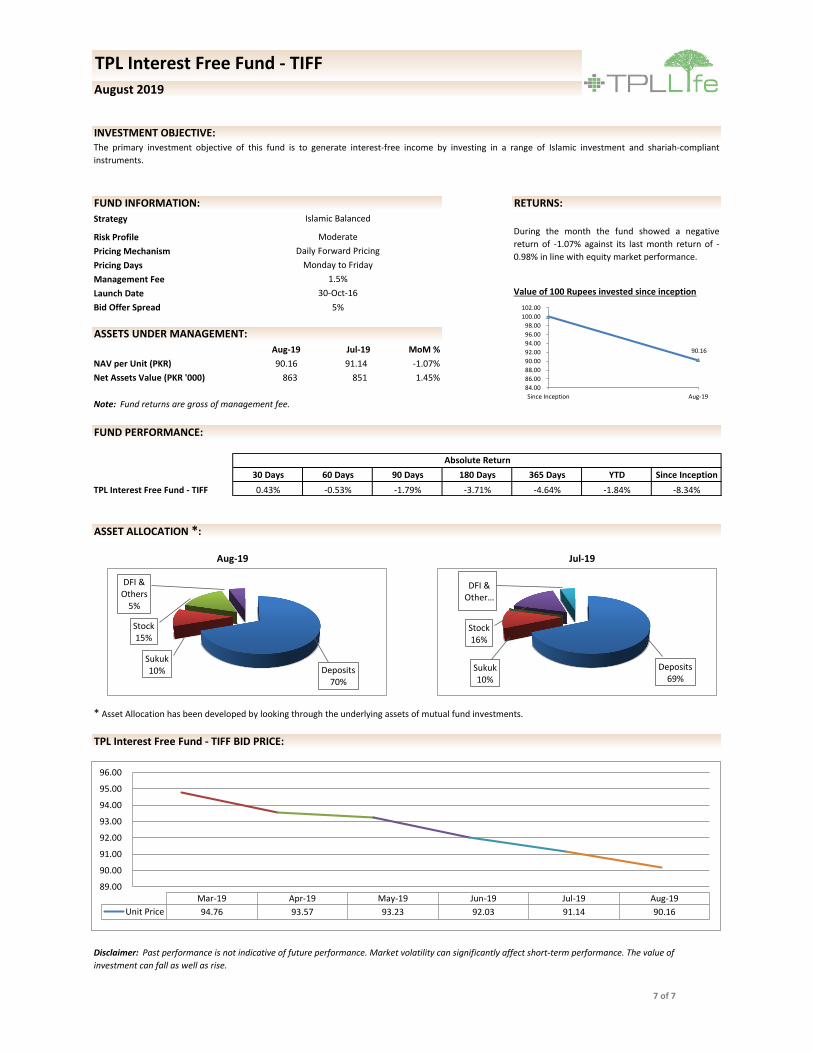
NAV per Unit (PKR) 90.16 91.14 -1.07%
Net Assets Value (PKR '000) 863 851 1.45%
30 Days 60 Days 90 Days 180 Days 365 Days YTD Since Inception
TPL Interest Free Fund - TIFF 0.43% -0.53% -1.79% -3.71% -4.64% -1.84% -8.34%
* Asset Allocation has been developed by looking through the underlying assets of mutual fund investments.
June 2017
7 of 7
Islamic Balanced
Moderate
Daily Forward Pricing
Monday to Friday
1.5%
TPL Interest Free Fund - TIFF
INVESTMENT OBJECTIVE:The primary investment objective of this fund is to generate interest-free income by investing in a range of Islamic investment and shariah-compliant
instruments.
FUND INFORMATION: RETURNS:
August 2019
Note: Fund returns are gross of management fee.
ASSETS UNDER MANAGEMENT:
Absolute Return
TPL Interest Free Fund - TIFF BID PRICE:
During the month the fund showed a negative
return of -1.07% against its last month return of -
0.98% in line with equity market performance.
Value of 100 Rupees invested since inception30-Oct-16
Disclaimer: Past performance is not indicative of future performance. Market volatility can significantly affect short-term performance. The value of
investment can fall as well as rise.
ASSET ALLOCATION *:
Aug-19 Jul-19
FUND PERFORMANCE:
89.00
90.00
91.00
92.00
93.00
94.00
95.00
96.00
Mar-19 Apr-19 May-19 Jun-19 Jul-19 Aug-19
Unit Price 94.76 93.57 93.23 92.03 91.14 90.16
Deposits69%
Sukuk10%
Stock16%
DFI & Other…
90.16
84.00
86.00
88.00
90.00
92.00
94.00
96.00
98.00
100.00
102.00
Since Inception Aug-19
Deposits70%
Sukuk10%
Stock15%
DFI & Others
5%