town centres floorspace needs assessment retail …c7361322-1611-45e9-8706-04f2b7bc...town centres...
TRANSCRIPT
GVA Grimley Ltd 10 Stratton Street London W1J 8JR 08449 020304 www.gvagrimley.co.uk
LONDON BOROUGH OF BARNET
Town Centres Floorspace Needs Assessment Retail Capacity Update
July 2010
London Borough of Barnet Town Centres Floorspace Needs Assessment
Retail Capacity Update July 2010
1
CONTENTS
1. BACKGROUND/SCOPE OF WORKS............................................................................. 2
2. CONVENIENCE GOODS ASSESSMENT....................................................................... 6
3. COMPARISON GOODS ASSESSMENT ...................................................................... 10
4. SUMMARY ..................................................................................................................... 13
PLANS
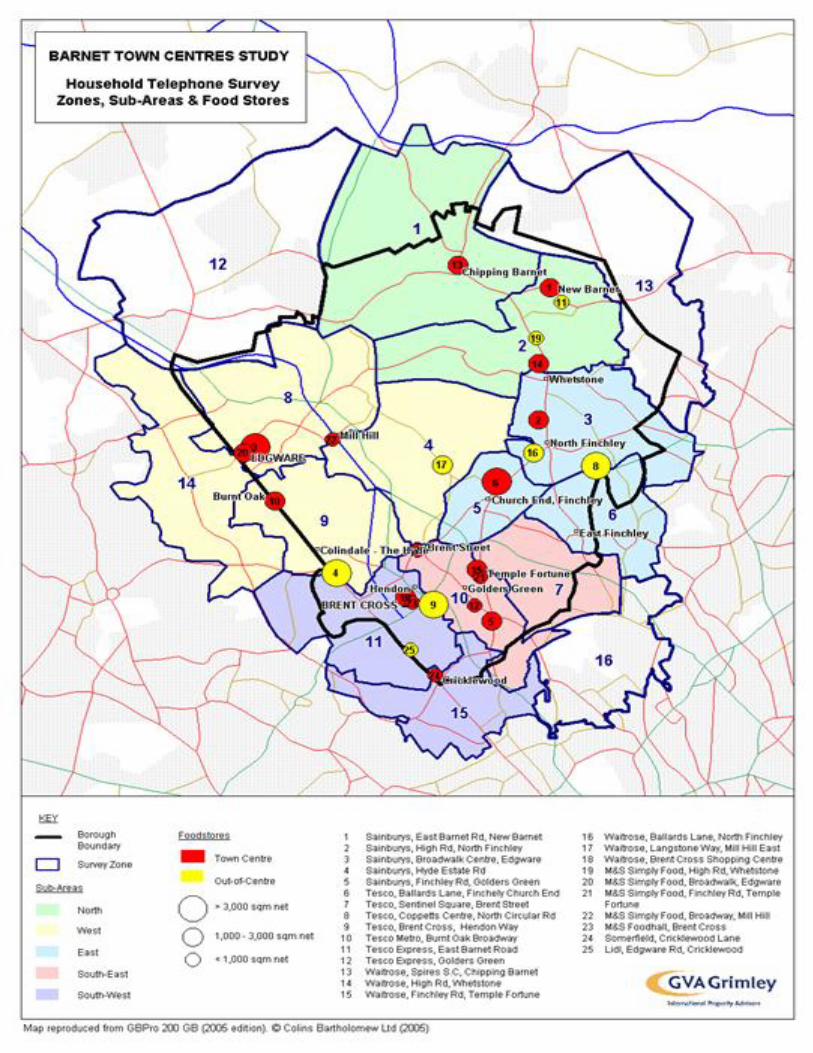
Plan 1: Study Area & Survey Zones
Plan 2: Barnet Sub-Areas and Foodstores
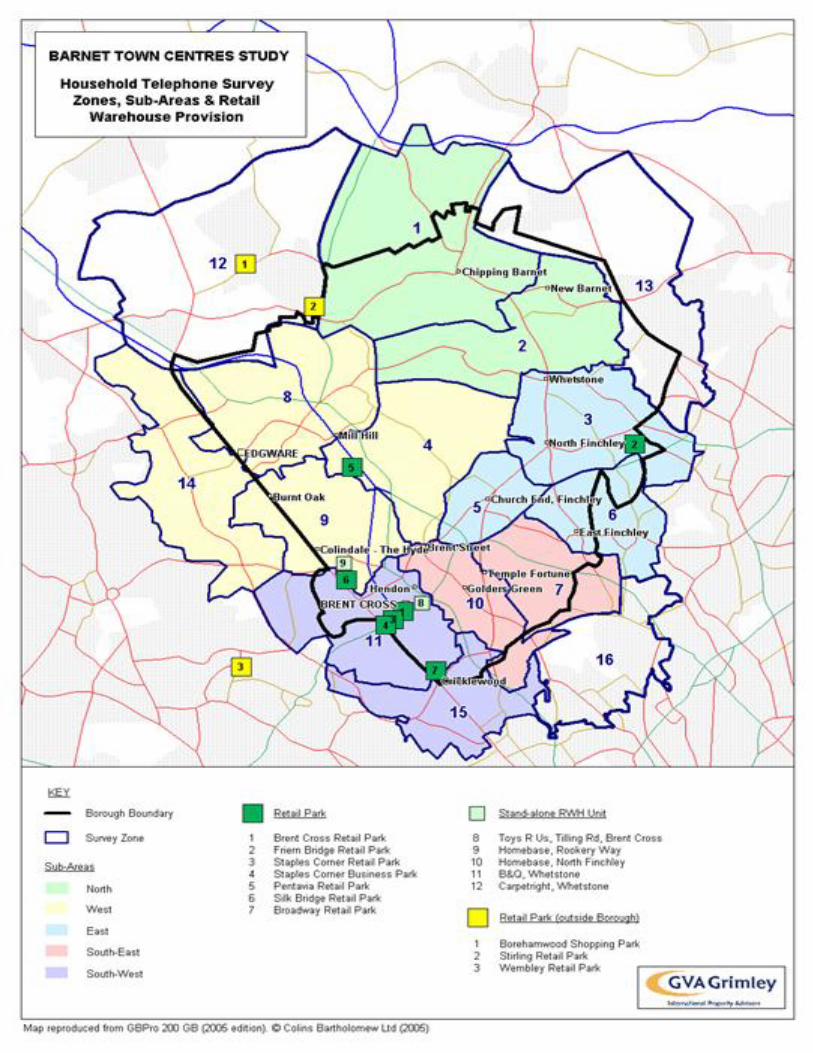
Plan 3: Barnet Sub-Areas and Retail Warehouses
APPENDICES
Appendix 1: Capacity Projections: Convenience Goods
Appendix 2: Capacity Projections: Comparison Goods
London Borough of Barnet Town Centres Floorspace Needs Assessment
Retail Capacity Update July 2010
2
1. BACKGROUND/SCOPE OF WORKS
1.1 GVA Grimley has been instructed by the London Borough of Barnet to update retail capacity
projections previously set out in the Town Centres Floorspace Needs Assessment (TCFNA) 2009.
Recent economic circumstances have led to the need for a further review of the assessment and
need for new floorspace in the Borough. This paper sets out the findings of our update, and
forecasts the need for further convenience and comparison retail floorspace to the period 2026,
incorporating interim years of 2011, 2016 and 2021. The capacity tables accompanying this
assessment are attached in Appendix 1 and 2.
1.2 We should note with caution the growing margins of error when forecasting over such lengthy time
periods, and as recommended in policy, the Council should review these forecasts at appropriate
times throughout the LDF period, generally no longer than 5 year intervals. Nevertheless, long term
forecasting gives a good indication of the broad levels of growth expected between 2010 and 2016,
based on current research and evidence.
1.3 This piece of work has been commissioned in order to take into account planning commitments for
additional retail floorspace granted consent since the 2009 study; to take into account the recent
economic circumstances/recession; and to assist in the consideration of recent investor interest in the
Borough leading to proposals for further convenience and comparison goods retail floorspace.
1.4 Using the same approach incorporated in the 2009 TCFNA, we have explored the capacity for further
comparison and convenience goods retail floorspace within two scenarios. First, we forecast
capacity at a global level for the whole of the Borough; and second, we forecast capacity within the
defined sub-areas illustrated on Plan 2.
Population
1.5 Using the same approach adopted in the TCFNA we have established the baseline population at
2010 using the Experian E-Marketer system which provides estimates of population based on trend
line projections and the 2001 census for small, localised areas. Using the latest data from the
Council and GLA’s forecasts we have calculated individual growth rates for each zone broadly within
the Borough boundary (Zones 1-11). These growth rates have been applied to the Experian baseline
at 2010. We have adopted Experian’s population forecasts at 2011, 2016, 2021 and 2026 for Zones
12-16.
1.6 The survey area and breakdown of zones is illustrated on Plan 1. The survey area extends beyond
the Borough boundary (broadly Zones 1-11) to include parts of neighbouring Boroughs (Enfield,
Haringey, Camden, Brent, Harrow and Hertsmere). This is intended to capture the combined sphere
of influence of Barnet’s centres across the wider area.
London Borough of Barnet Town Centres Floorspace Needs Assessment
Retail Capacity Update July 2010
3
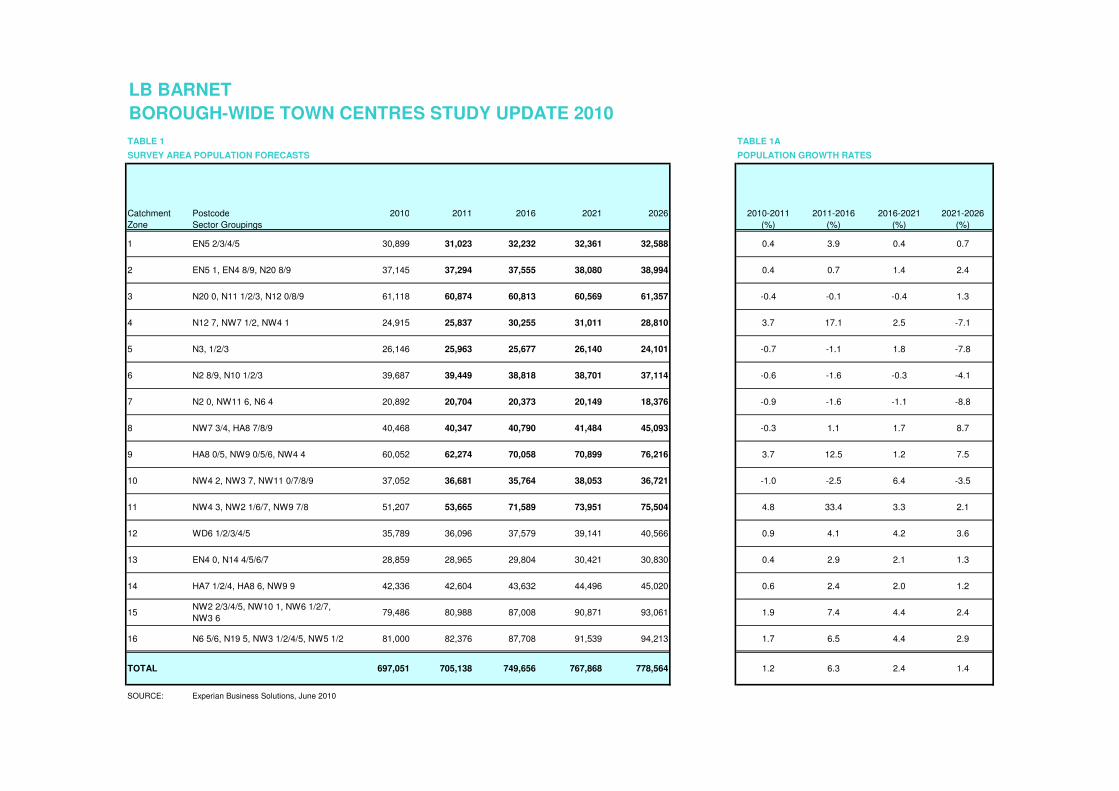
1.7 We estimate the overall population of the survey area is currently 697,051 (2010). The total
population of the survey area is forecast to grow to 705,633 by 2011, to 745,957 by 2016, to 772,043
by 2021 and to 784,892 by 2026 (Table 1, Appendix 1). These figures represent an overall growth of
12.6% between 2010 and 2026.
Expenditure Growth
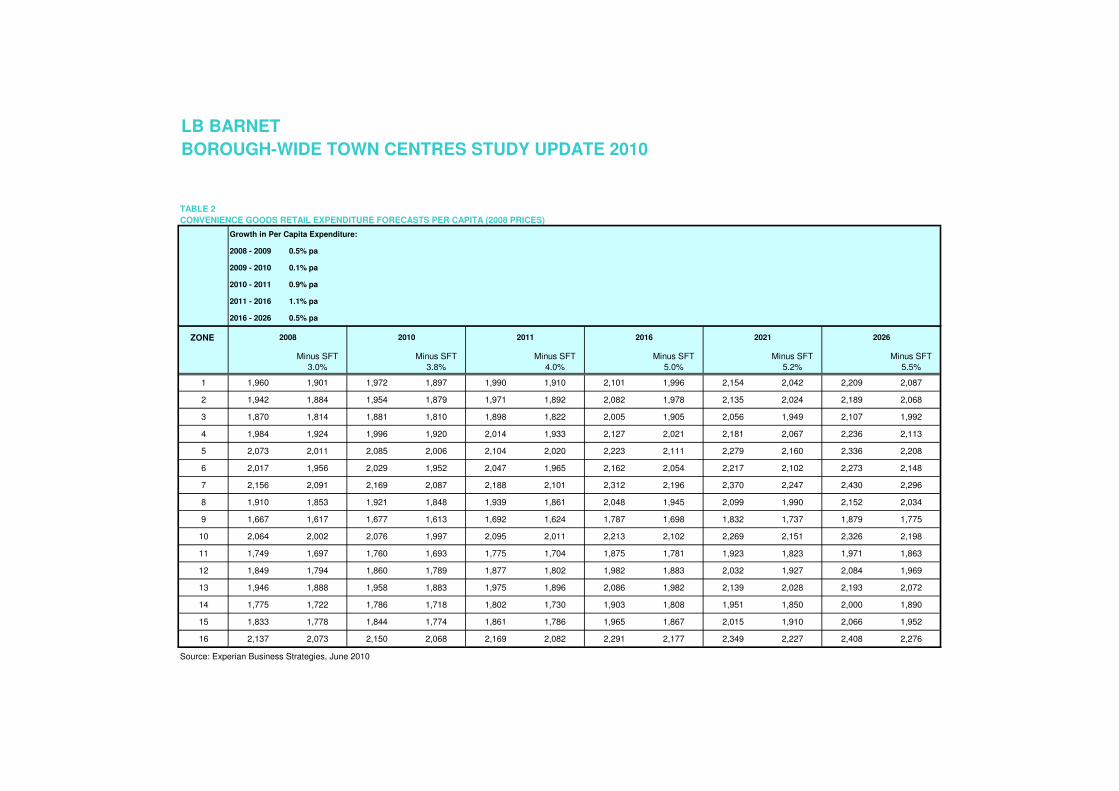
1.8 The Experian E-Marketer database also provides estimates of per capita expenditure for
convenience and comparison goods in 2008 prices. We have made deductions for special forms of
trading which represents expenditure not available to spend in the shops, i.e. internet and catalogue
shopping. We have applied per capita expenditure for convenience and comparison goods within
each zone to the population forecasts.
1.9 Since the TCFNA was undertaken the economy has gone through a period of rapid deterioration
which has had far-reaching implications on available income, and consequently expenditure. Recent
research by Verdict suggests that ‘growth will be lacklustre. However, as GDP growth improves
through 2012 onwards, retail expenditure should also benefit’1.
1.10 Growth projections used in Retail Studies and supporting retail statements for planning applications
should therefore respond to advice in respect of the most recent economic expectations, followed by
ultra long term trends in the longer term projections. Paragraph B.21, Appendix B of the Good
Practice Guide on Need, Impact and the Sequential Approach states that expenditure growth rates
should draw on national long-term trends, but may also have regard to expectations about future
regional economic performance and to recent evidence of retail growth. It recommends that growth
rates should generally adopt a conservative level of growth in order to reflect the inherent uncertainty
in economic forecasts, and the cyclical nature of the retail sector.
1.11 The growth projections used within this update have therefore responded to advice in respect of the
use of trend line (historic) growth rates and forecast growth rates based on consumer expectations.
Due to the retail expenditure boom in the latter half of the 1990s and the first half of the 2000s and
the more recent economic recession, there are significant differences between these two
approaches.
1.12 Trend growth rates have, until recently, been influenced by the spending boom of recent years (until
2007). Trend line forecasting, based on these historic trends, incorporate booms and busts since the
1960s and therefore provide a flat rate average over long and ultra long-time periods, i.e. beyond
2021. These are no longer appropriate for short-term retail projections given the current slow-down
in the economy. The period up to 2016 will be affected noticeably by the recession and the weak
upturn that is likely to follow. The time period required to enable growth rates to return to ‘boom’
levels is unknown, but it is clear that this is unlikely to happen before 2016.
1 Verdict Datamonitor, July 2010, UK Retail Futures 2014: Retail & the Economy
London Borough of Barnet Town Centres Floorspace Needs Assessment
Retail Capacity Update July 2010
4
1.13 On this basis we are advised to use economic forecasts prepared by MapInfo/Oxford Economic
Forecasting and Experian Business Strategies which take into consideration current and future
economic instability. Evidently, the growth rates used for our retail capacity forecasting have
changed as a consequence, and have considerable implications on the levels of floorspace town
centres can sustain in the short-to-medium term, i.e. up to 2016. In the previous study we applied a
consistent growth rate of 0.3% per annum for convenience goods and 3.7% per annum for
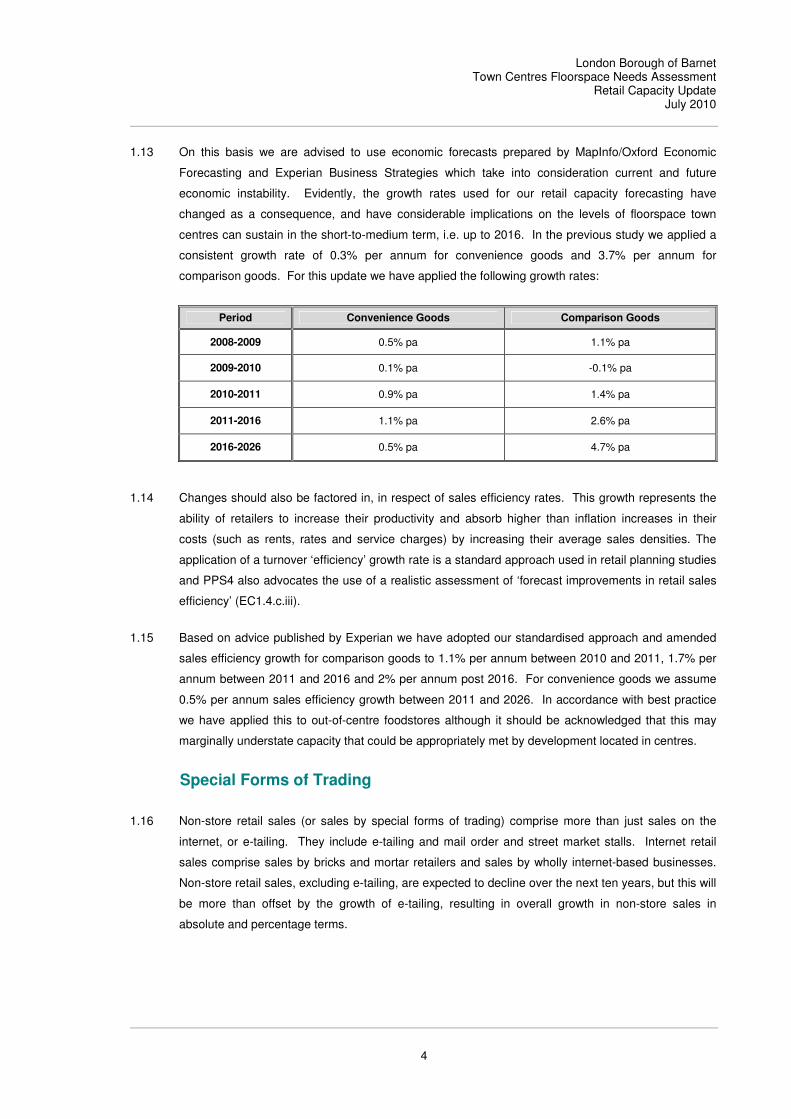
comparison goods. For this update we have applied the following growth rates:
Period Convenience Goods Comparison Goods
2008-2009 0.5% pa 1.1% pa
2009-2010 0.1% pa -0.1% pa
2010-2011 0.9% pa 1.4% pa
2011-2016 1.1% pa 2.6% pa
2016-2026 0.5% pa 4.7% pa
1.14 Changes should also be factored in, in respect of sales efficiency rates. This growth represents the
ability of retailers to increase their productivity and absorb higher than inflation increases in their
costs (such as rents, rates and service charges) by increasing their average sales densities. The
application of a turnover ‘efficiency’ growth rate is a standard approach used in retail planning studies
and PPS4 also advocates the use of a realistic assessment of ‘forecast improvements in retail sales
efficiency’ (EC1.4.c.iii).
1.15 Based on advice published by Experian we have adopted our standardised approach and amended
sales efficiency growth for comparison goods to 1.1% per annum between 2010 and 2011, 1.7% per
annum between 2011 and 2016 and 2% per annum post 2016. For convenience goods we assume
0.5% per annum sales efficiency growth between 2011 and 2026. In accordance with best practice
we have applied this to out-of-centre foodstores although it should be acknowledged that this may
marginally understate capacity that could be appropriately met by development located in centres.
Special Forms of Trading
1.16 Non-store retail sales (or sales by special forms of trading) comprise more than just sales on the
internet, or e-tailing. They include e-tailing and mail order and street market stalls. Internet retail
sales comprise sales by bricks and mortar retailers and sales by wholly internet-based businesses.
Non-store retail sales, excluding e-tailing, are expected to decline over the next ten years, but this will
be more than offset by the growth of e-tailing, resulting in overall growth in non-store sales in
absolute and percentage terms.
London Borough of Barnet Town Centres Floorspace Needs Assessment
Retail Capacity Update July 2010
5
1.17 Total non-store convenience retail sales (including e-tailing) are expected to increase from 3.8% of
sales in 2010, to 4.0% in 2011, to 5.0% in 2016 and 5.2% in 2021. These special forms of trading
(SFT) are expected to stabilise around 5.5% at 2025. Total comparison non-store retail sales are
expected to increase from 9.1% in 2010, to 9.7% in 2011 before stabilising at 11.5% from 2016
onwards.
1.18 These growth forecasts take into account Experian’s latest forecasts published in the Retail Planner
note on non-store retailing (March 2010). The revised figures assume lower growth than that
assumed in the 2009 study which forecast growth in SFT up to 8.1% by 2016 for convenience goods
and 13.9% by 2016 for comparison goods.
Available Expenditure
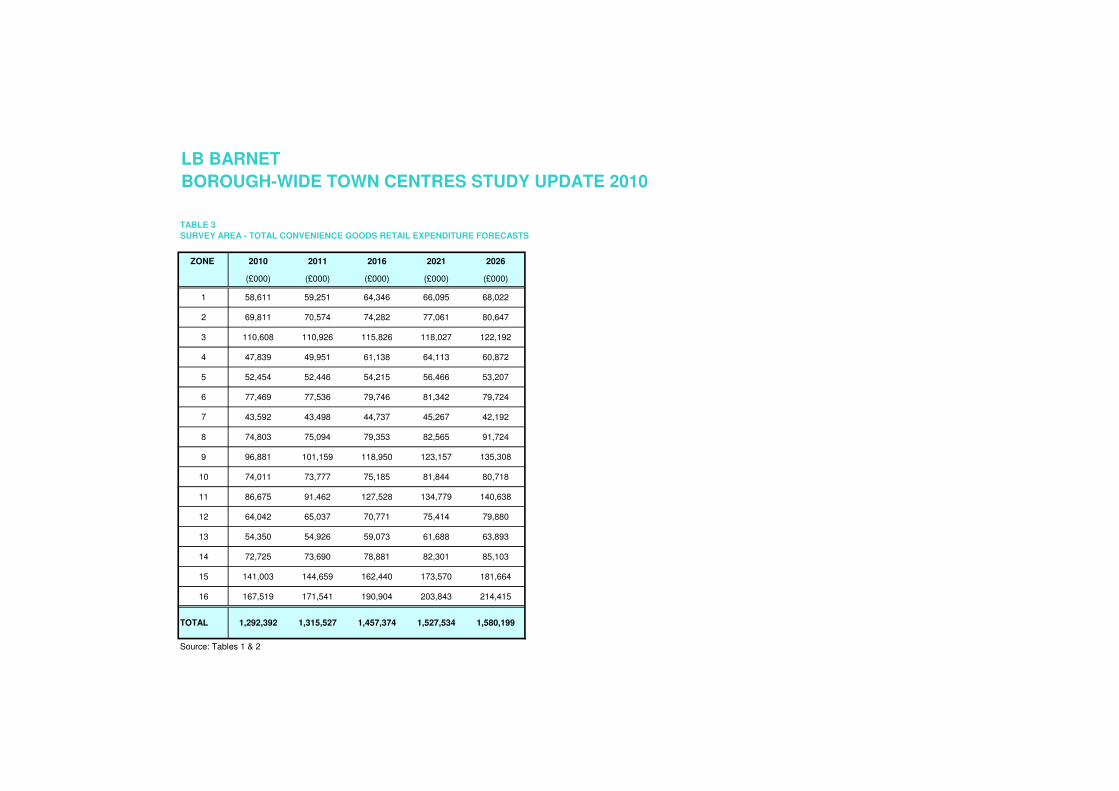
1.19 Table 2 in Appendices 1 and 2 applies per capita expenditure to the population forecasts, which
indicates that total available convenience goods expenditure within the survey area is currently
£1.292billion (b from hereon). This is forecast to grow to £1.317b by 2011, to £1.450b by 2016, to
£1.532b by 2021, and to £1.588b by 2026. This equates to an overall growth of £296m (23%)
between 2010 and 2026. This is greater than the level of growth estimated in the 2009 study (15%
between 2009 and 2026) reflecting variations in the growth rates applied.
1.20 Total available comparison goods expenditure within the survey area is currently £2.020b, and is
forecast to grow to £2.060b by 2011, to £2.415b by 2016, to £2.138b by 2021 and to £4.000b by
2026. This equates to an overall growth of £1.979b (98%) between 2010 and 2026. This is lower
than the 2009 study which identified growth in the region of 107%; however this update reflects the
significant implications of the economic downturn, particularly to the period 2016.
Quantifying Retail Need
1.21 We have used a conventional step-by-step methodology, consistent with best practice, to examine
quantitative need across the survey area. This draws on the results of the household telephone
survey of existing shopping patterns to model the flows of available expenditure to different retail
destinations. The model illustrates the total available pot of convenience goods expenditure and then
identifies claims on this expenditure in respect of existing retail floorspace (both in and out-of-centre)
and the ability of this to increase their sales efficiency in the future, special forms of trading and finally
retail planning commitments not yet implemented. When existing claims on expenditure have been
deducted, we can identify the pot of residual expenditure to support new retail floorspace in the
future.
London Borough of Barnet Town Centres Floorspace Needs Assessment
Retail Capacity Update July 2010
6
2. CONVENIENCE GOODS ASSESSMENT
2.1 In the TCFNA we identified baseline global capacity for 103 sqm net at 2011, increasing to 3,233
sqm net by 2016 and 5,028 by 2021. Addressing each sub-area across the Borough in turn, we
have reviewed shopping patterns derived from the 2008 telephone survey results, and the
performance of existing convenience goods floorspace based on the updated population and
expenditure forecasts (Appendix 1).
Existing Claims on Capacity
2.2 Through discussions with the Council it is apparent that there have been several new foodstore
developments since the previous study, in addition to other committed convenience goods retail
floorspace which needs to be taken into account in our model as a claim on the existing pot of
available expenditure.
2.3 In the 2009 study we modelled five commitments with a combined convenience floorspace of
1,628 sqm. As part of this update, we have carried four of these commitments forward (the fifth
has now expired) along with a further 13 commitments which have been granted consent since
the previous study. All commitments combined amount to a convenience floorspace of 5,673 sqm
net. We have included a comprehensive list of all commitments (both built and unbuilt) which
have been factored into our analysis in Appendix 1. In addition to identified commitments, we
expect that there are likely to be other commitments for additional floorspace located outside the
Borough which may also have potential to absorb capacity and impact on centres within the
Borough.
2.4 Based on company average sales derived from Verdict (2009) where possible, we estimate that
the current level of additional floorspace identified as commitments will generate a combined
turnover in the region of £31.7m at 2011 (Table 59, Appendix 1).
Convenience Goods Capacity
2.5 Based on current market shares, on a global scale we project capacity to support 4,323 sqm net
at 2011, increasing to 8,240 sqm net by 2016, 9,878 sqm net by 2021 and 9,888 sqm net by 2026
(Table 61, Appendix 1). This is higher level of capacity than identified in the previous study,
reflecting marginally higher population and expenditure growth and lower deductions for SFT.
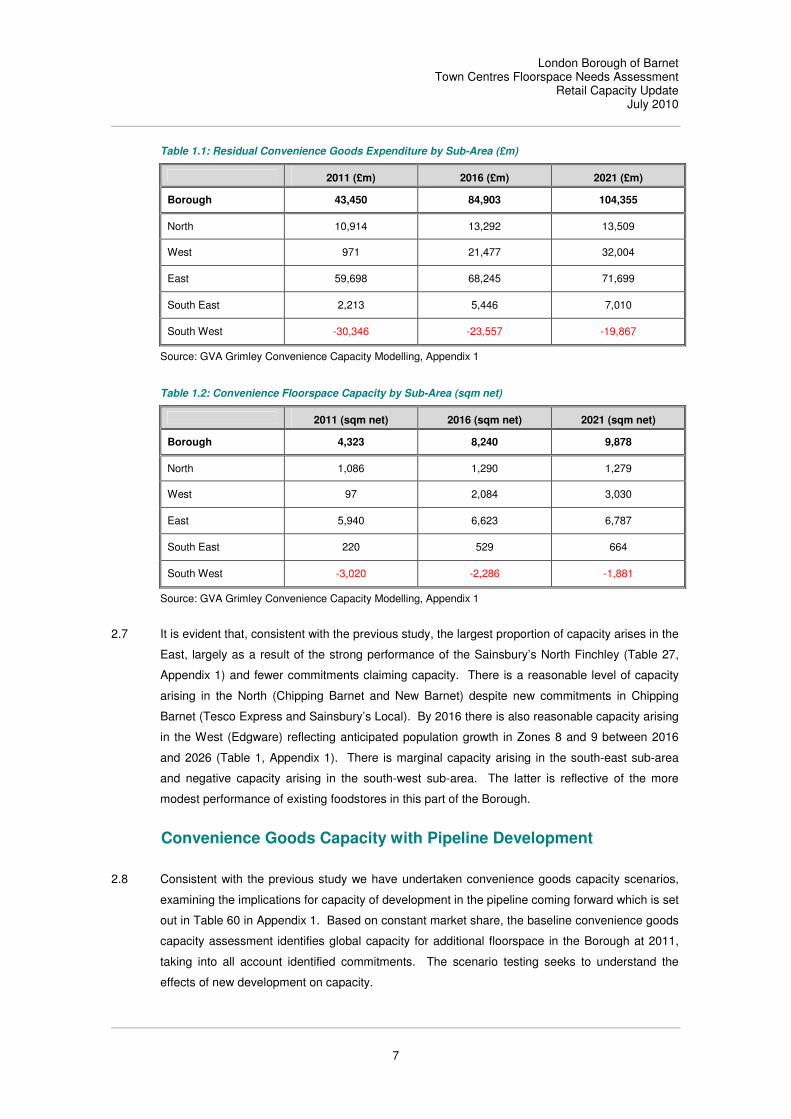
2.6 Tables 1.1 and 1.2 below demonstrate the breakdown of available expenditure and floorspace
capacity for additional convenience goods floorspace in the different sub-areas of the Borough.
London Borough of Barnet Town Centres Floorspace Needs Assessment
Retail Capacity Update July 2010
7
Table 1.1: Residual Convenience Goods Expenditure by Sub-Area (£m)
2011 (£m) 2016 (£m) 2021 (£m)
Borough 43,450 84,903 104,355
North 10,914 13,292 13,509
West 971 21,477 32,004
East 59,698 68,245 71,699
South East 2,213 5,446 7,010
South West -30,346 -23,557 -19,867
Source: GVA Grimley Convenience Capacity Modelling, Appendix 1
Table 1.2: Convenience Floorspace Capacity by Sub-Area (sqm net)
2011 (sqm net) 2016 (sqm net) 2021 (sqm net)
Borough 4,323 8,240 9,878
North 1,086 1,290 1,279
West 97 2,084 3,030
East 5,940 6,623 6,787
South East 220 529 664
South West -3,020 -2,286 -1,881
Source: GVA Grimley Convenience Capacity Modelling, Appendix 1
2.7 It is evident that, consistent with the previous study, the largest proportion of capacity arises in the
East, largely as a result of the strong performance of the Sainsbury’s North Finchley (Table 27,
Appendix 1) and fewer commitments claiming capacity. There is a reasonable level of capacity
arising in the North (Chipping Barnet and New Barnet) despite new commitments in Chipping
Barnet (Tesco Express and Sainsbury’s Local). By 2016 there is also reasonable capacity arising
in the West (Edgware) reflecting anticipated population growth in Zones 8 and 9 between 2016
and 2026 (Table 1, Appendix 1). There is marginal capacity arising in the south-east sub-area
and negative capacity arising in the south-west sub-area. The latter is reflective of the more
modest performance of existing foodstores in this part of the Borough.
Convenience Goods Capacity with Pipeline Development
2.8 Consistent with the previous study we have undertaken convenience goods capacity scenarios,
examining the implications for capacity of development in the pipeline coming forward which is set
out in Table 60 in Appendix 1. Based on constant market share, the baseline convenience goods
capacity assessment identifies global capacity for additional floorspace in the Borough at 2011,
taking into all account identified commitments. The scenario testing seeks to understand the
effects of new development on capacity.
London Borough of Barnet Town Centres Floorspace Needs Assessment
Retail Capacity Update July 2010
8
2.9 For the scenario testing we have sought to anticipate when development is likely to come forward.
The timing of development affects the estimates of capacity as there will be more growth and
expenditure to support new floorspace over a longer timescale. Given that a planning application
for the Tesco Express at Great North Road has already been submitted to the Council, it is
possible that this store, subject to approval, could realistically come forward by 2011. We have
anticipated that residual floorspace allocated within the Mill Hill and Colindale AAPs2 would not
come forward until at least 2016. Finally, we understand that the replacement Tesco Extra store
and unit shops at Brent Cross South would not come forward until 2018 so we have factored this
development into our forecasts for 2021.
2.10 Table 1.3 demonstrates the effects of pipeline development coming forward at the different
intervals stated above, on the capacity in South-West, West and North sub-areas of the Borough.
There are no identified pipeline developments emerging in the East or South-East sub-areas.
Table 1.3: Scenario Testing of Convenience Goods Capacity by Sub-Area (sqm net)
2011 (sqm net) 2016 (sqm net) 2021 (sqm net)
Global Baseline Capacity 4,323 8,240 9,878
Residual Capacity assuming Pipeline development* comes forward
3,847 7,235 2,218
North Baseline Capacity 1,086 1,290 1,279
Residual Capacity assuming Pipeline development* comes forward
609 813 802
West Baseline Capacity 97 2,084 3,030
Residual Capacity assuming Pipeline development* comes forward
97 1,556 2,501
East Baseline Capacity 5,940 6,623 6,787
South East Baseline Capacity 220 529 664
South West Baseline Capacity -3,020 -2,286 -1,881
Residual Capacity assuming Pipeline development* comes forward
-3,020 -2,286 -8,536
Source: GVA Grimley Convenience Capacity Modelling, Appendix 1 *listed in Table 60, Appendix 1
2.11 In the North sub-area there is capacity to support the Tesco Express at Great North Road at 2011
and marginal residual capacity (609 sqm net) available over and above this.
2.12 In the West sub-area there is capacity to support residual floorspace allocated within the Mill Hill
and Colindale AAPs and residual capacity to support a further 1,556 sqm net of additional
convenience goods floorspace.
2 Some of the allocated floorspace has already been granted planning consent and has therefore been factored in as a
commitment.
London Borough of Barnet Town Centres Floorspace Needs Assessment
Retail Capacity Update July 2010
9
2.13 In the South West sub-area we anticipate that the replacement Tesco Extra store and unit shops
and Brent Cross South would have been built by 2018 and we have therefore made an allowance
for this in our forecasts at 2021. As previously highlighted, on the basis of current market share
this level of development would create a significant oversupply of convenience goods floorspace
in the sub-area. This surplus could be to the extent of -8,536 sqm net by 2021 and -8,374 by
2026 (Table 72, Appendix 1). However, as previously acknowledged, the whole ethos for Brent
Cross Cricklewood is to create a new town centre we anticipate that there will be a significant
increase in market share such that the new convenience floorspace would be supported.
London Borough of Barnet Town Centres Floorspace Needs Assessment
Retail Capacity Update July 2010
10
3. COMPARISON GOODS ASSESSMENT
3.1 In the TCFNA we identified baseline global capacity for 11,356 sqm net at 2011, increasing to
47,917 sqm net by 2016 and 81,024 by 2021. Addressing each sub-area across the Borough in
turn, we have reviewed shopping patterns derived from the 2008 telephone survey results, and
the performance of existing convenience goods floorspace based on the updated population and
expenditure forecasts (Appendix 2).
Existing Claims on Capacity
3.2 When forecasting capacity for new comparison goods floorspace in the Borough, our model has
taken into consideration commitments for new comparison goods floorspace. The previous study
identified four commitments which were, on the whole, of a reasonably small scale. As part of this
update we have carried three previously identified commitments forward and factored in ten
additional commitments. Again these are generally small-scale individually, however in total we
have identified 7,046 sqm net additional comparison goods floorspace coming forward across the
Borough (Table 55, Appendix 2) with could achieve a combined turnover of £21.4m at 2011.
Comparison Goods Capacity
3.3 Based on current market shares and reflecting the slowdown in the economy, we have not
identified any capacity in the short-term. In contrast to our previous findings we project an
oversupply of floorspace, in the region of -2,268 sqm net, by 2011 (Table 57, Appendix 2).
However, reflecting anticipated improvements in economic growth in the longer term, by 2016 we
forecast capacity to support 13,762 sqm net, increasing to 50,853 sqm net by 2021.
3.4 Tables 1.4 and 1.5 demonstrate the breakdown of available expenditure and floorspace capacity
for additional comparison goods floorspace in the different sub-areas of the Borough. It is evident
that, consistent with our previous assessment, the majority of capacity is arising in the South-
West sub-area (Brent Cross/Cricklewood). There is also some modest capacity arising in the
East (North Finchley), West (Edgware) and North (Chipping Barnet).
3.5 We do not project any capacity in the South-East (Golders Green/Temple Fortune) sub-area in
the short-medium term and by 2021 we project only marginal capacity to support 302 sqm net
additional comparison goods floorspace.
London Borough of Barnet Town Centres Floorspace Needs Assessment
Retail Capacity Update July 2010
11
Table 1.4: Residual Comparison Goods Expenditure by Sub-Area (£000)
2011 (£000) 2016 (£000) 2021 (£000)
Borough -12,613 83,255 339,652
North -163 698 5,463
West -940 15,199 46,902
East -2,592 2,820 32,949
South East -423 -26 2,019
South West -8,495 64,564 252,320
Source: GVA Grimley Comparison Capacity Modelling, Appendix 2
Table 1.5: Comparison Floorspace Capacity by Sub-Area (sqm net)
2011 (sqm net) 2016 (sqm net) 2021 (sqm net)
Borough -2,268 13,762 50,853
North -29 115 818
West -169 2,512 7,022
East -466 466 4,933
South East -76 -4 302
South West -1,528 10,673 37,777
Source: GVA Grimley Comparison Capacity Modelling, Appendix 2
Comparison Goods Capacity with Pipeline Development
3.6 As part of our update assessment, we have examined the implications for capacity of comparison
developments coming forward (Table 56, Appendix 2). As before, we have drawn on estimates
by GVA Grimley and information provided by the Council.
3.7 Brent Cross Cricklewood remains the most significant retail development in the pipeline. The
outline planning application has been approved by the Secretary of State however the S.106
agreement is still awaiting completion and therefore formal planning consent has yet to be
granted. The development has potential to provide approximately 28,590 sqm net of new
comparison goods floorspace, likely to be built by 2018, which could equate to a turnover of
£208m by 2021.
3.8 We also anticipate some comparison floorspace coming forward as part of the offer in the
replacement Tesco Extra store at Brent Cross South Retail Park and as part of the residual
floorspace allocated within the Colindale AAP.
London Borough of Barnet Town Centres Floorspace Needs Assessment
Retail Capacity Update July 2010
12
3.9 We have anticipated that new comparison floorspace could come forward Colindale by 2016
whilst development at Brent Cross South and Brent Cross Cricklewood has been factored in by
2021.
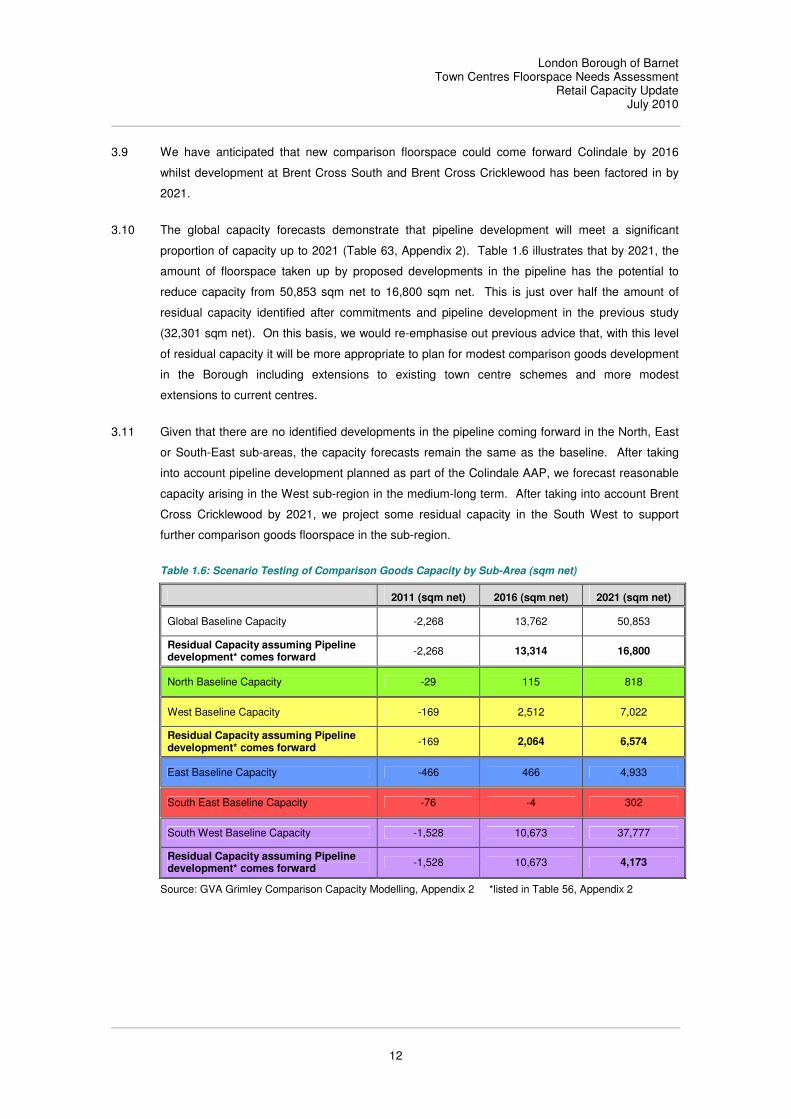
3.10 The global capacity forecasts demonstrate that pipeline development will meet a significant
proportion of capacity up to 2021 (Table 63, Appendix 2). Table 1.6 illustrates that by 2021, the
amount of floorspace taken up by proposed developments in the pipeline has the potential to
reduce capacity from 50,853 sqm net to 16,800 sqm net. This is just over half the amount of
residual capacity identified after commitments and pipeline development in the previous study
(32,301 sqm net). On this basis, we would re-emphasise out previous advice that, with this level
of residual capacity it will be more appropriate to plan for modest comparison goods development
in the Borough including extensions to existing town centre schemes and more modest
extensions to current centres.
3.11 Given that there are no identified developments in the pipeline coming forward in the North, East
or South-East sub-areas, the capacity forecasts remain the same as the baseline. After taking
into account pipeline development planned as part of the Colindale AAP, we forecast reasonable
capacity arising in the West sub-region in the medium-long term. After taking into account Brent
Cross Cricklewood by 2021, we project some residual capacity in the South West to support
further comparison goods floorspace in the sub-region.
Table 1.6: Scenario Testing of Comparison Goods Capacity by Sub-Area (sqm net)
2011 (sqm net) 2016 (sqm net) 2021 (sqm net)
Global Baseline Capacity -2,268 13,762 50,853
Residual Capacity assuming Pipeline development* comes forward
-2,268 13,314 16,800
North Baseline Capacity -29 115 818
West Baseline Capacity -169 2,512 7,022
Residual Capacity assuming Pipeline development* comes forward
-169 2,064 6,574
East Baseline Capacity -466 466 4,933
South East Baseline Capacity -76 -4 302
South West Baseline Capacity -1,528 10,673 37,777
Residual Capacity assuming Pipeline development* comes forward
-1,528 10,673 4,173
Source: GVA Grimley Comparison Capacity Modelling, Appendix 2 *listed in Table 56, Appendix 2
London Borough of Barnet Town Centres Floorspace Needs Assessment
Retail Capacity Update July 2010
13
4. SUMMARY
4.1 The focus of this update has been to take into consideration changes in the economic outlook
following the recent recession and to consider the effect of additional commitments and pipeline
developments having come forward since the previous study.
4.2 Reflecting the recent recession, it is evident that growth in comparison goods expenditure is much
lower than previously anticipated. In contrast, our projections for convenience goods expenditure
have improved. Forecast growth of SFT (including internet spending) for both comparison and
convenience goods, is now thought to be lower than previously anticipated. These key changes
have obviously had an impact on the overall level of capacity identified in the Borough. In short,
the pot of available comparison goods expenditure floorspace has fallen whilst available
convenience goods expenditure has increased.
4.3 Another key variable has been the change in commitments since the previous study. In terms of
convenience goods, we previously modelled five commitments with a combined convenience
floorspace of 1,628 sqm. As part of this update, we have carried four of these commitments
forward (the fifth has now expired) along with a further 13 commitments which have been granted
consent since the previous study. All commitments combined amount to a convenience
floorspace of 5,673 sqm net with potential to turnover £31m.
4.4 Despite an increase in claims on available convenience goods expenditure, our revised forecasts
indicate that there will be residual global capacity arising to support additional convenience goods
floorspace at 2011 over and above these commitments. However, given the concentration of
commitments within the South-West sub-area this does result in an oversupply of floorspace in
this sub-area for the remainder of the plan period. This oversupply is compounded at 2021 when
we factor in development in the pipeline, notably the Tesco Extra at Brent Cross, although this is
likely to be supportable given the significant increase in market share anticipated following the
establishment of the new town centre envisaged for Brent Cross Cricklewood.
4.5 We have not taken into account any additional convenience goods provision at New Barnet and
as such there is residual global capacity to support 2,218 sqm net additional convenience goods
provision over and above existing commitments and pipeline developments and the Council
should plan to meet this need in accordance with PPS4 Policy EC5. This capacity represents a
global figure that could be met by several small-scale developments across the Borough and
does not necessarily suggest capacity for a single large supermarket.
4.6 In terms of comparison goods, we have carried three commitments forward and factored in ten
additional commitments amounting to a total of 7,046 sqm net. We estimate that these
commitments have potential to turnover £21m.
London Borough of Barnet Town Centres Floorspace Needs Assessment
Retail Capacity Update July 2010
14
4.7 As highlighted above, the change in economic growth over the plan period has significantly
reduced available expenditure and subsequent capacity to support additional comparison goods
floorspace in the Borough. As a result our forecasts now show negative capacity in the short term
and a much lower level of capacity arising by 2016 and 2021 compared our previous assessment.
4.8 Notwithstanding this, there is still capacity to support identified commitments and pipeline
developments by 2016 and Brent Cross Cricklewood by 2021. Our forecasts also show that there
will be residual capacity over and above existing commitments and pipeline development to
support further comparison goods floorspace over the plan period. Consistent with our previous
advice, Edgware, North Finchley and Chipping Barnet should be the priority for new comparison
goods development. In accordance with PPS4, it will be necessary to direct global capacity to
town centres in the first instance before giving consideration to edge of centre sites; after which
out-of-centre sites may be considered as a last resort.
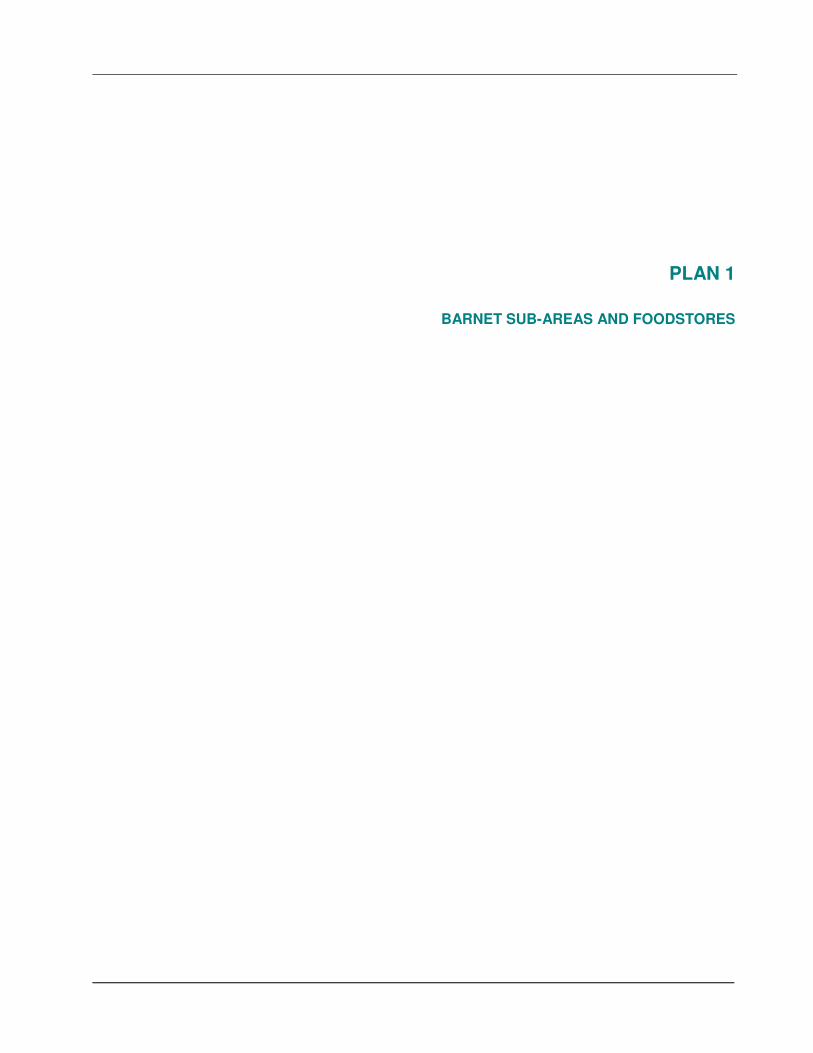
PLAN 1
BARNET SUB-AREAS AND FOODSTORES
PLAN 2
BARNET SUB-AREAS AND RETAIL WAREHOUSES
APPENDIX 1
CAPACITY PROJECTIONS: CONVENIENCE GOODS
BOROUGH-WIDE TOWN CENTRES STUDY UPDATE 2010
TABLE 1 TABLE 1A
SURVEY AREA POPULATION FORECASTS POPULATION GROWTH RATES
Catchment Postcode 2010 2011 2016 2021 2026 2010-2011 2011-2016 2016-2021 2021-2026
Zone Sector Groupings (%) (%) (%) (%)
1 EN5 2/3/4/5 30,899 31,023 32,232 32,361 32,588 0.4 3.9 0.4 0.7
2 EN5 1, EN4 8/9, N20 8/9 37,145 37,294 37,555 38,080 38,994 0.4 0.7 1.4 2.4
3 N20 0, N11 1/2/3, N12 0/8/9 61,118 60,874 60,813 60,569 61,357 -0.4 -0.1 -0.4 1.3
4 N12 7, NW7 1/2, NW4 1 24,915 25,837 30,255 31,011 28,810 3.7 17.1 2.5 -7.1
5 N3, 1/2/3 26,146 25,963 25,677 26,140 24,101 -0.7 -1.1 1.8 -7.8
6 N2 8/9, N10 1/2/3 39,687 39,449 38,818 38,701 37,114 -0.6 -1.6 -0.3 -4.1
7 N2 0, NW11 6, N6 4 20,892 20,704 20,373 20,149 18,376 -0.9 -1.6 -1.1 -8.8
8 NW7 3/4, HA8 7/8/9 40,468 40,347 40,790 41,484 45,093 -0.3 1.1 1.7 8.7
9 HA8 0/5, NW9 0/5/6, NW4 4 60,052 62,274 70,058 70,899 76,216 3.7 12.5 1.2 7.5
10 NW4 2, NW3 7, NW11 0/7/8/9 37,052 36,681 35,764 38,053 36,721 -1.0 -2.5 6.4 -3.5
11 NW4 3, NW2 1/6/7, NW9 7/8 51,207 53,665 71,589 73,951 75,504 4.8 33.4 3.3 2.1
12 WD6 1/2/3/4/5 35,789 36,096 37,579 39,141 40,566 0.9 4.1 4.2 3.6
13 EN4 0, N14 4/5/6/7 28,859 28,965 29,804 30,421 30,830 0.4 2.9 2.1 1.3
14 HA7 1/2/4, HA8 6, NW9 9 42,336 42,604 43,632 44,496 45,020 0.6 2.4 2.0 1.2
15NW2 2/3/4/5, NW10 1, NW6 1/2/7,
NW3 679,486 80,988 87,008 90,871 93,061 1.9 7.4 4.4 2.4
16 N6 5/6, N19 5, NW3 1/2/4/5, NW5 1/2 81,000 82,376 87,708 91,539 94,213 1.7 6.5 4.4 2.9
TOTAL 697,051 705,138 749,656 767,868 778,564 1.2 6.3 2.4 1.4
SOURCE: Experian Business Solutions, June 2010
LB BARNET
BOROUGH-WIDE TOWN CENTRES STUDY UPDATE 2010
TABLE 2
CONVENIENCE GOODS RETAIL EXPENDITURE FORECASTS PER CAPITA (2008 PRICES)
Growth in Per Capita Expenditure:
2008 - 2009 0.5% pa
2009 - 2010 0.1% pa
2010 - 2011 0.9% pa
2011 - 2016 1.1% pa
2016 - 2026 0.5% pa
ZONE
Minus SFT
3.0%
Minus SFT
3.8%
Minus SFT
4.0%
Minus SFT
5.0%
Minus SFT
5.2%
Minus SFT
5.5%
1 1,960 1,901 1,972 1,897 1,990 1,910 2,101 1,996 2,154 2,042 2,209 2,087
2 1,942 1,884 1,954 1,879 1,971 1,892 2,082 1,978 2,135 2,024 2,189 2,068
3 1,870 1,814 1,881 1,810 1,898 1,822 2,005 1,905 2,056 1,949 2,107 1,992
4 1,984 1,924 1,996 1,920 2,014 1,933 2,127 2,021 2,181 2,067 2,236 2,113
5 2,073 2,011 2,085 2,006 2,104 2,020 2,223 2,111 2,279 2,160 2,336 2,208
6 2,017 1,956 2,029 1,952 2,047 1,965 2,162 2,054 2,217 2,102 2,273 2,148
7 2,156 2,091 2,169 2,087 2,188 2,101 2,312 2,196 2,370 2,247 2,430 2,296
8 1,910 1,853 1,921 1,848 1,939 1,861 2,048 1,945 2,099 1,990 2,152 2,034
9 1,667 1,617 1,677 1,613 1,692 1,624 1,787 1,698 1,832 1,737 1,879 1,775
10 2,064 2,002 2,076 1,997 2,095 2,011 2,213 2,102 2,269 2,151 2,326 2,198
11 1,749 1,697 1,760 1,693 1,775 1,704 1,875 1,781 1,923 1,823 1,971 1,863
12 1,849 1,794 1,860 1,789 1,877 1,802 1,982 1,883 2,032 1,927 2,084 1,969
13 1,946 1,888 1,958 1,883 1,975 1,896 2,086 1,982 2,139 2,028 2,193 2,072
14 1,775 1,722 1,786 1,718 1,802 1,730 1,903 1,808 1,951 1,850 2,000 1,890
15 1,833 1,778 1,844 1,774 1,861 1,786 1,965 1,867 2,015 1,910 2,066 1,952
16 2,137 2,073 2,150 2,068 2,169 2,082 2,291 2,177 2,349 2,227 2,408 2,276
Source: Experian Business Strategies, June 2010
2026
LB BARNET
2010 2011 2016 20212008
LB BARNET
BOROUGH-WIDE TOWN CENTRES STUDY UPDATE 2010
TABLE 3
SURVEY AREA - TOTAL CONVENIENCE GOODS RETAIL EXPENDITURE FORECASTS
ZONE 2010 2011 2016 2021 2026
(£000) (£000) (£000) (£000) (£000)
1 58,611 59,251 64,346 66,095 68,022
2 69,811 70,574 74,282 77,061 80,647
3 110,608 110,926 115,826 118,027 122,192
4 47,839 49,951 61,138 64,113 60,872
5 52,454 52,446 54,215 56,466 53,207
6 77,469 77,536 79,746 81,342 79,724
7 43,592 43,498 44,737 45,267 42,192
8 74,803 75,094 79,353 82,565 91,724
9 96,881 101,159 118,950 123,157 135,308
10 74,011 73,777 75,185 81,844 80,718
11 86,675 91,462 127,528 134,779 140,638
12 64,042 65,037 70,771 75,414 79,880
13 54,350 54,926 59,073 61,688 63,893
14 72,725 73,690 78,881 82,301 85,103
15 141,003 144,659 162,440 173,570 181,664
16 167,519 171,541 190,904 203,843 214,415
TOTAL 1,292,392 1,315,527 1,457,374 1,527,534 1,580,199
Source: Tables 1 & 2
BOROUGH-WIDE TOWN CENTRES STUDY UPDATE 2010
TABLE 4
CONVENIENCE GOODS ALLOCATION - % MARKET SHARE
Catchment
Zone2010 2011 2016 2021 2026 2010 2011 2016 2021 2026 2010 2011 2016 2021 2026
(%) (%) (%) (%) (%) (%) (%) (%) (%) (%) (%) (%) (%) (%) (%)
1 0 0 0 0 0 0 0 0 0 0 0 0 0 0 0
2 0 0 0 0 0 0 0 0 0 0 0 0 0 0 0
3 0 0 0 0 0 0 0 0 0 0 0 0 0 0 0
4 3 3 3 3 3 0 0 0 0 0 3 3 3 3 3
5 0 0 0 0 0 1 1 1 1 1 1 1 1 1 1
6 0 0 0 0 0 1 1 1 1 1 1 1 1 1 1
7 3 3 3 3 3 0 0 0 0 0 3 3 3 3 3
8 1 1 1 1 1 0 0 0 0 0 1 1 1 1 1
9 2 2 2 2 2 0 0 0 0 0 2 2 2 2 2
10 3 3 3 3 3 1 1 1 1 1 4 4 4 4 4
11 9 9 9 9 9 2 2 2 2 2 11 11 11 11 11
12 0 0 0 0 0 0 0 0 0 0 0 0 0 0 0
13 0 0 0 0 0 0 0 0 0 0 0 0 0 0 0
14 0 0 0 0 0 0 0 0 0 0 0 0 0 0 0
15 2 2 2 2 2 1 1 1 1 1 4 4 4 4 4
16 3 3 3 3 3 0 0 0 0 0 3 3 3 3 3
SOURCE: Household Survey, September 2008
TABLE 5
CONVENIENCE GOODS ALLOCATION - SPEND (£) 2008 PRICES
Catchment
Zone2010 2011 2016 2021 2026 2010 2011 2016 2021 2026 2010 2011 2016 2021 2026
(£000) (£000) (£000) (£000) (£000) (£000) (£000) (£000) (£000) (£000) (£000) (£000) (£000) (£000) (£000)
1 0 0 0 0 0 0 0 0 0 0 0 0 0 0 0
2 0 0 0 0 0 0 0 0 0 0 0 0 0 0 0
3 0 0 0 0 0 0 0 0 0 0 0 0 0 0 0
4 1,363 1,424 1,742 1,827 1,735 0 0 0 0 0 1,363 1,424 1,742 1,827 1,735
5 0 0 0 0 0 590 590 610 635 599 590 590 610 635 599
6 0 0 0 0 0 581 582 598 610 598 581 582 598 610 598
7 1,515 1,512 1,555 1,573 1,466 0 0 0 0 0 1,515 1,512 1,555 1,573 1,466
8 1,066 1,070 1,131 1,177 1,307 0 0 0 0 0 1,066 1,070 1,131 1,177 1,307
9 2,180 2,276 2,676 2,771 3,044 0 0 0 0 0 2,180 2,276 2,676 2,771 3,044
10 2,461 2,453 2,500 2,721 2,684 555 553 564 614 605 3,016 3,006 3,064 3,335 3,289
11 8,017 8,460 11,796 12,467 13,009 1,495 1,578 2,200 2,325 2,426 9,513 10,038 13,996 14,792 15,435
12 0 0 0 0 0 0 0 0 0 0 0 0 0 0 0
13 0 0 0 0 0 0 0 0 0 0 0 0 0 0 0
14 0 0 0 0 0 0 0 0 0 0 0 0 0 0 0
15 3,384 3,472 3,899 4,166 4,360 1,622 1,664 1,868 1,996 2,089 5,006 5,135 5,767 6,162 6,449
16 5,067 5,189 5,775 6,166 6,486 503 515 573 612 643 5,570 5,704 6,348 6,778 7,129
TOTALS 25,054 25,856 31,074 32,868 34,091 5,345 5,481 6,413 6,792 6,960 30,399 31,336 37,486 39,660 41,052
SOURCE: Tables 3 & 4
LB BARNET
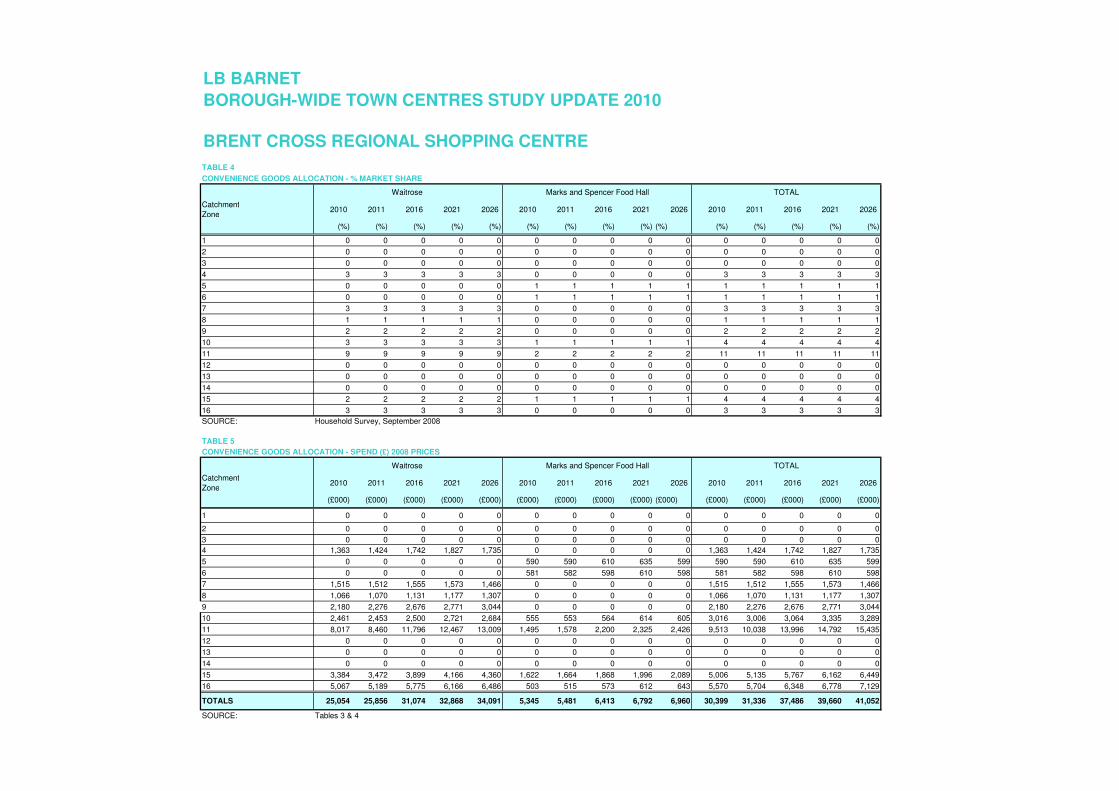
BRENT CROSS REGIONAL SHOPPING CENTRE
Marks and Spencer Food HallWaitrose TOTAL
Waitrose Marks and Spencer Food Hall TOTAL
BOROUGH-WIDE TOWN CENTRES STUDY UPDATE 2010
TABLE 6
CONVENIENCE GOODS ALLOCATION - % MARKET SHARE
Catchment
Zone2010 2011 2016 2021 2026 2010 2011 2016 2021 2026 2010 2011 2016 2021 2026 2010 2011 2016 2021 2026
(%) (%) (%) (%) (%) (%) (%) (%) (%) (%) (%) (%) (%) (%) (%) (%) (%) (%) (%) (%)
1 0 0 0 0 0 0 0 0 0 0 0 0 0 0 0 0 0 0 0 0
2 0 0 0 0 0 0 0 0 0 0 0 0 0 0 0 0 0 0 0 0
3 0 0 0 0 0 0 0 0 0 0 0 0 0 0 0 0 0 0 0 0
4 5 5 5 5 5 0 0 0 0 0 2 2 2 2 2 7 7 7 7 7
5 0 0 0 0 0 0 0 0 0 0 0 0 0 0 0 0 0 0 0 0
6 0 0 0 0 0 0 0 0 0 0 0 0 0 0 0 0 0 0 0 0
7 0 0 0 0 0 1 1 1 1 1 1 1 1 1 1 2 2 2 2 2
8 29 29 29 29 29 3 3 3 3 3 0 0 0 0 0 32 32 32 32 32
9 8 8 8 8 8 0 0 0 0 0 0 0 0 0 0 9 9 9 9 9
10 0 0 0 0 0 0 0 0 0 0 6 6 6 6 6 6 6 6 6 6
11 0 0 0 0 0 0 0 0 0 0 8 8 8 8 8 9 9 9 9 9
12 0 0 0 0 0 0 0 0 0 0 0 0 0 0 0 0 0 0 0 0
13 0 0 0 0 0 0 0 0 0 0 0 0 0 0 0 0 0 0 0 0
14 12 12 12 12 12 2 2 2 2 2 0 0 0 0 0 14 14 14 14 14
15 1 1 1 1 1 0 0 0 0 0 2 2 2 2 2 3 3 3 3 3
16 2 2 2 2 2 0 0 0 0 0 0 0 0 0 0 2 2 2 2 2
SOURCE: Household Survey, September 2008
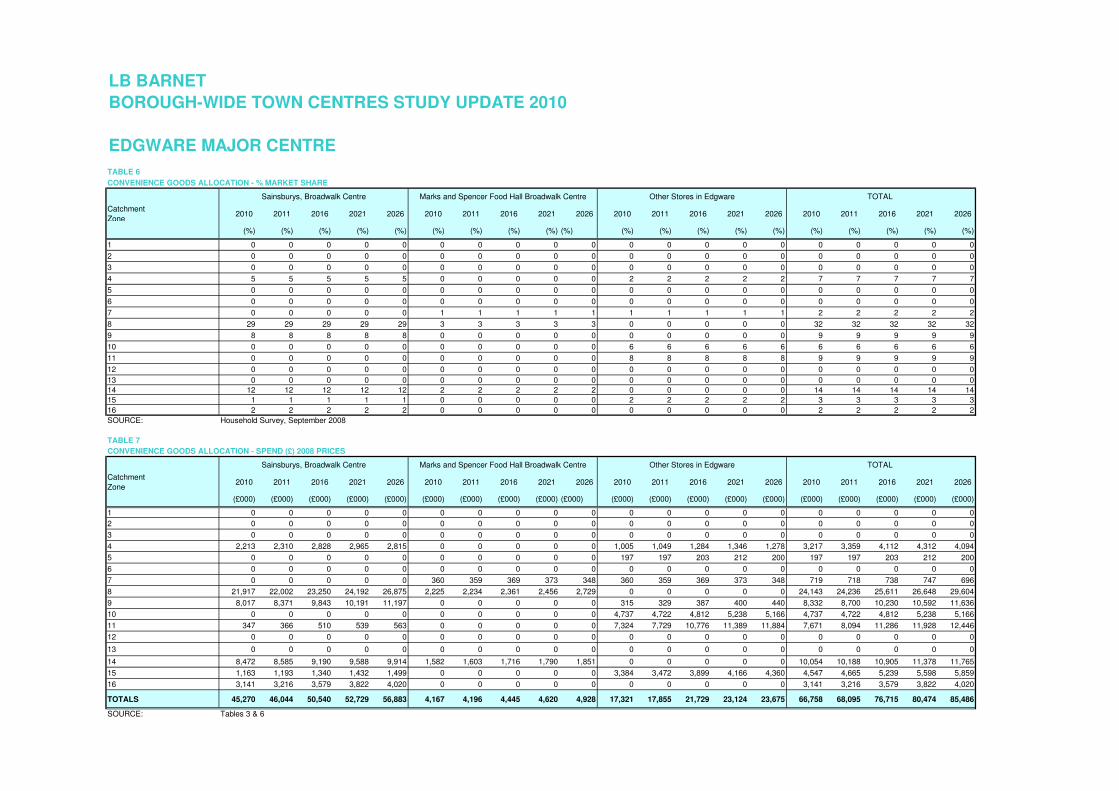
TABLE 7
CONVENIENCE GOODS ALLOCATION - SPEND (£) 2008 PRICES
Catchment
Zone2010 2011 2016 2021 2026 2010 2011 2016 2021 2026 2010 2011 2016 2021 2026 2010 2011 2016 2021 2026
(£000) (£000) (£000) (£000) (£000) (£000) (£000) (£000) (£000) (£000) (£000) (£000) (£000) (£000) (£000) (£000) (£000) (£000) (£000) (£000)
1 0 0 0 0 0 0 0 0 0 0 0 0 0 0 0 0 0 0 0 0
2 0 0 0 0 0 0 0 0 0 0 0 0 0 0 0 0 0 0 0 0
3 0 0 0 0 0 0 0 0 0 0 0 0 0 0 0 0 0 0 0 0
4 2,213 2,310 2,828 2,965 2,815 0 0 0 0 0 1,005 1,049 1,284 1,346 1,278 3,217 3,359 4,112 4,312 4,094
5 0 0 0 0 0 0 0 0 0 0 197 197 203 212 200 197 197 203 212 200
6 0 0 0 0 0 0 0 0 0 0 0 0 0 0 0 0 0 0 0 0
7 0 0 0 0 0 360 359 369 373 348 360 359 369 373 348 719 718 738 747 696
8 21,917 22,002 23,250 24,192 26,875 2,225 2,234 2,361 2,456 2,729 0 0 0 0 0 24,143 24,236 25,611 26,648 29,604
9 8,017 8,371 9,843 10,191 11,197 0 0 0 0 0 315 329 387 400 440 8,332 8,700 10,230 10,592 11,636
10 0 0 0 0 0 0 0 0 0 0 4,737 4,722 4,812 5,238 5,166 4,737 4,722 4,812 5,238 5,166
11 347 366 510 539 563 0 0 0 0 0 7,324 7,729 10,776 11,389 11,884 7,671 8,094 11,286 11,928 12,446
12 0 0 0 0 0 0 0 0 0 0 0 0 0 0 0 0 0 0 0 0
13 0 0 0 0 0 0 0 0 0 0 0 0 0 0 0 0 0 0 0 0
14 8,472 8,585 9,190 9,588 9,914 1,582 1,603 1,716 1,790 1,851 0 0 0 0 0 10,054 10,188 10,905 11,378 11,765
15 1,163 1,193 1,340 1,432 1,499 0 0 0 0 0 3,384 3,472 3,899 4,166 4,360 4,547 4,665 5,239 5,598 5,859
16 3,141 3,216 3,579 3,822 4,020 0 0 0 0 0 0 0 0 0 0 3,141 3,216 3,579 3,822 4,020
TOTALS 45,270 46,044 50,540 52,729 56,883 4,167 4,196 4,445 4,620 4,928 17,321 17,855 21,729 23,124 23,675 66,758 68,095 76,715 80,474 85,486
SOURCE: Tables 3 & 6
TOTAL
LB BARNET
EDGWARE MAJOR CENTRE
Other Stores in Edgware TOTAL
Sainsburys, Broadwalk Centre Marks and Spencer Food Hall Broadwalk Centre Other Stores in Edgware
Marks and Spencer Food Hall Broadwalk CentreSainsburys, Broadwalk Centre
BOROUGH-WIDE TOWN CENTRES STUDY UPDATE 2010
TABLE 8
CONVENIENCE GOODS ALLOCATION - % MARKET SHARE
Catchment
Zone2010 2011 2016 2021 2026 2010 2011 2016 2021 2026 2010 2011 2016 2021 2026
(%) (%) (%) (%) (%) (%) (%) (%) (%) (%) (%) (%) (%) (%) (%)
1 0 0 0 0 0 0 0 0 0 0 0 0 0 0 0
2 0 0 0 0 0 0 0 0 0 0 0 0 0 0 0
3 0 0 0 0 0 0 0 0 0 0 0 0 0 0 0
4 5 5 5 5 5 1 1 1 1 1 6 6 6 6 6
5 1 1 1 1 1 0 0 0 0 0 1 1 1 1 1
6 0 0 0 0 0 0 0 0 0 0 0 0 0 0 0
7 0 0 0 0 0 0 0 0 0 0 0 0 0 0 0
8 0 0 0 0 0 0 0 0 0 0 0 0 0 0 0
9 1 1 1 1 1 0 0 0 0 0 1 1 1 1 1
10 11 11 11 11 11 0 0 0 0 0 11 11 11 11 11
11 0 0 0 0 0 0 0 0 0 0 0 0 0 0 0
12 0 0 0 0 0 0 0 0 0 0 0 0 0 0 0
13 0 0 0 0 0 0 0 0 0 0 0 0 0 0 0
14 0 0 0 0 0 0 0 0 0 0 0 0 0 0 0
15 0 0 0 0 0 0 0 0 0 0 0 0 0 0 0
16 0 0 0 0 0 0 0 0 0 0 0 0 0 0 0
SOURCE: Household Survey, September 2008
TABLE 9
CONVENIENCE GOODS ALLOCATION - SPEND (£) 2008 PRICES
Catchment
Zone2010 2011 2016 2021 2026 2010 2011 2016 2021 2026 2010 2011 2016 2021 2026
(£000) (£000) (£000) (£000) (£000) (£000) (£000) (£000) (£000) (£000) (£000) (£000) (£000) (£000) (£000)
1 0 0 0 0 0 0 0 0 0 0 0 0 0 0 0
2 0 0 0 0 0 0 0 0 0 0 0 0 0 0 0
3 0 0 0 0 0 0 0 0 0 0 0 0 0 0 0
4 2,404 2,510 3,072 3,222 3,059 419 437 535 561 533 2,822 2,947 3,607 3,783 3,591
5 393 393 407 423 399 0 0 0 0 0 393 393 407 423 399
6 0 0 0 0 0 0 0 0 0 0 0 0 0 0 0
7 0 0 0 0 0 0 0 0 0 0 0 0 0 0 0
8 0 0 0 0 0 0 0 0 0 0 0 0 0 0 0
9 1,041 1,087 1,279 1,324 1,455 0 0 0 0 0 1,041 1,087 1,279 1,324 1,455
10 7,845 7,820 7,970 8,675 8,556 0 0 0 0 0 7,845 7,820 7,970 8,675 8,556
11 347 366 510 539 563 0 0 0 0 0 347 366 510 539 563
12 0 0 0 0 0 0 0 0 0 0 0 0 0 0 0
13 0 0 0 0 0 0 0 0 0 0 0 0 0 0 0
14 0 0 0 0 0 0 0 0 0 0 0 0 0 0 0
15 0 0 0 0 0 0 0 0 0 0 0 0 0 0 0
16 0 0 0 0 0 0 0 0 0 0 0 0 0 0 0
TOTALS 12,031 12,177 13,237 14,184 14,031 419 437 535 561 533 12,449 12,614 13,772 14,745 14,564
SOURCE: Tables 3 & 8
TOTAL
TOTAL
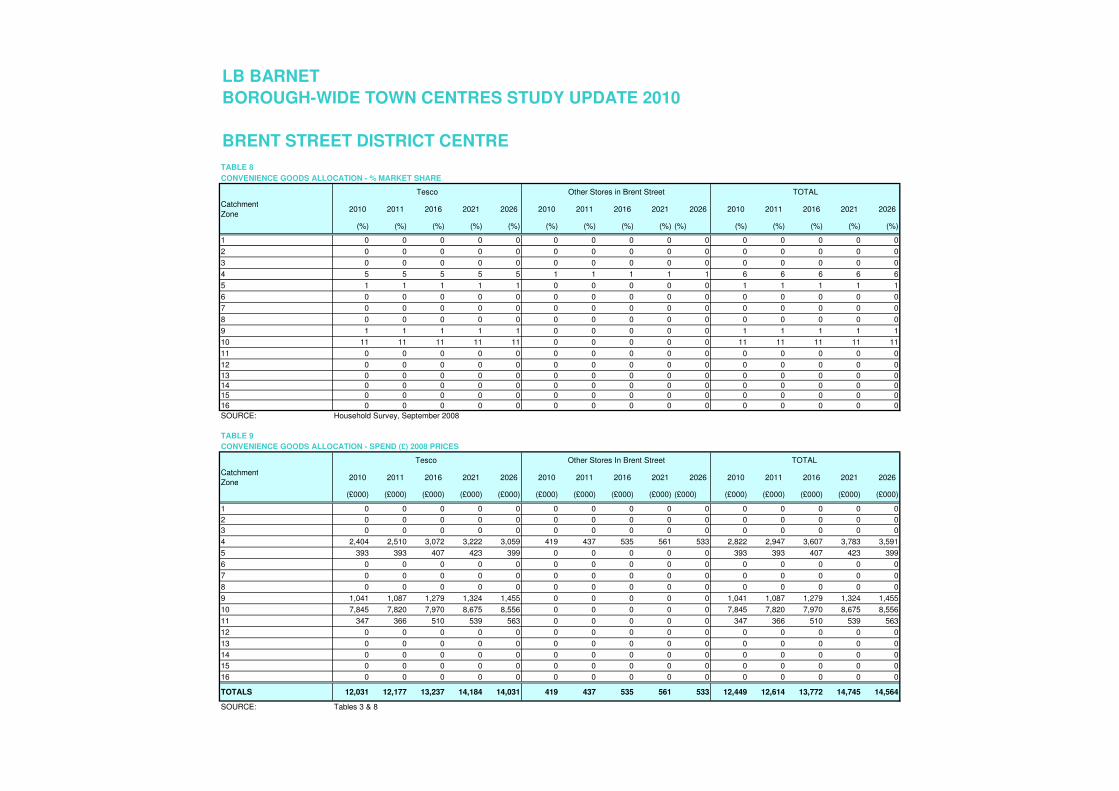
Other Stores in Brent Street
Tesco Other Stores In Brent Street
Tesco
LB BARNET
BRENT STREET DISTRICT CENTRE
BOROUGH-WIDE TOWN CENTRES STUDY UPDATE 2010
TABLE 10
CONVENIENCE GOODS ALLOCATION - % MARKET SHARE
Catchment
Zone2010 2011 2016 2021 2026 2010 2011 2016 2021 2026 2010 2011 2016 2021 2026
(%) (%) (%) (%) (%) (%) (%) (%) (%) (%) (%) (%) (%) (%) (%)
1 24 24 24 24 24 3 3 3 3 3 27 27 27 27 27
2 3 3 3 3 3 0 0 0 0 0 3 3 3 3 3
3 0 0 0 0 0 0 0 0 0 0 1 1 1 1 1
4 0 0 0 0 0 0 0 0 0 0 0 0 0 0 0
5 1 1 1 1 1 0 0 0 0 0 1 1 1 1 1
6 0 0 0 0 0 0 0 0 0 0 0 0 0 0 0
7 0 0 0 0 0 0 0 0 0 0 0 0 0 0 0
8 0 0 0 0 0 0 0 0 0 0 0 0 0 0 0
9 0 0 0 0 0 2 2 2 2 2 2 2 2 2 2
10 0 0 0 0 0 0 0 0 0 0 0 0 0 0 0
11 0 0 0 0 0 0 0 0 0 0 0 0 0 0 0
12 0 0 0 0 0 1 1 1 1 1 1 1 1 1 1
13 3 3 3 3 3 0 0 0 0 0 3 3 3 3 3
14 0 0 0 0 0 1 1 1 1 1 1 1 1 1 1
15 0 0 0 0 0 0 0 0 0 0 0 0 0 0 0
16 0 0 0 0 0 0 0 0 0 0 0 0 0 0 0
SOURCE: Household Survey, September 2008
TABLE 11
CONVENIENCE GOODS ALLOCATION - SPEND (£) 2008 PRICES
Catchment
Zone2010 2011 2016 2021 2026 2010 2011 2016 2021 2026 2010 2011 2016 2021 2026
(£000) (£000) (£000) (£000) (£000) (£000) (£000) (£000) (£000) (£000) (£000) (£000) (£000) (£000) (£000)
1 14,213 14,368 15,604 16,028 16,495 1,832 1,852 2,011 2,065 2,126 16,045 16,220 17,615 18,094 18,621
2 2,374 2,400 2,526 2,620 2,742 0 0 0 0 0 2,374 2,400 2,526 2,620 2,742
3 332 333 347 354 367 332 333 347 354 367 664 666 695 708 733
4 144 150 183 192 183 0 0 0 0 0 144 150 183 192 183
5 393 393 407 423 399 0 0 0 0 0 393 393 407 423 399
6 0 0 0 0 0 232 233 239 244 239 232 233 239 244 239
7 0 0 0 0 0 0 0 0 0 0 0 0 0 0 0
8 224 225 238 248 275 0 0 0 0 0 224 225 238 248 275
9 0 0 0 0 0 1,574 1,644 1,933 2,001 2,199 1,574 1,644 1,933 2,001 2,199
10 0 0 0 0 0 0 0 0 0 0 0 0 0 0 0
11 0 0 0 0 0 0 0 0 0 0 0 0 0 0 0
12 0 0 0 0 0 480 488 531 566 599 480 488 531 566 599
13 1,563 1,579 1,698 1,774 1,837 0 0 0 0 0 1,563 1,579 1,698 1,774 1,837
14 0 0 0 0 0 545 553 592 617 638 545 553 592 617 638
15 0 0 0 0 0 0 0 0 0 0 0 0 0 0 0
16 0 0 0 0 0 0 0 0 0 0 0 0 0 0 0
TOTALS 19,242 19,448 21,003 21,639 22,298 4,996 5,101 5,653 5,848 6,168 24,238 24,550 26,656 27,487 28,465
SOURCE: Tables 3 & 10
Waitrose, The Spires Other Stores in Chipping Barnet TOTAL
TOTAL
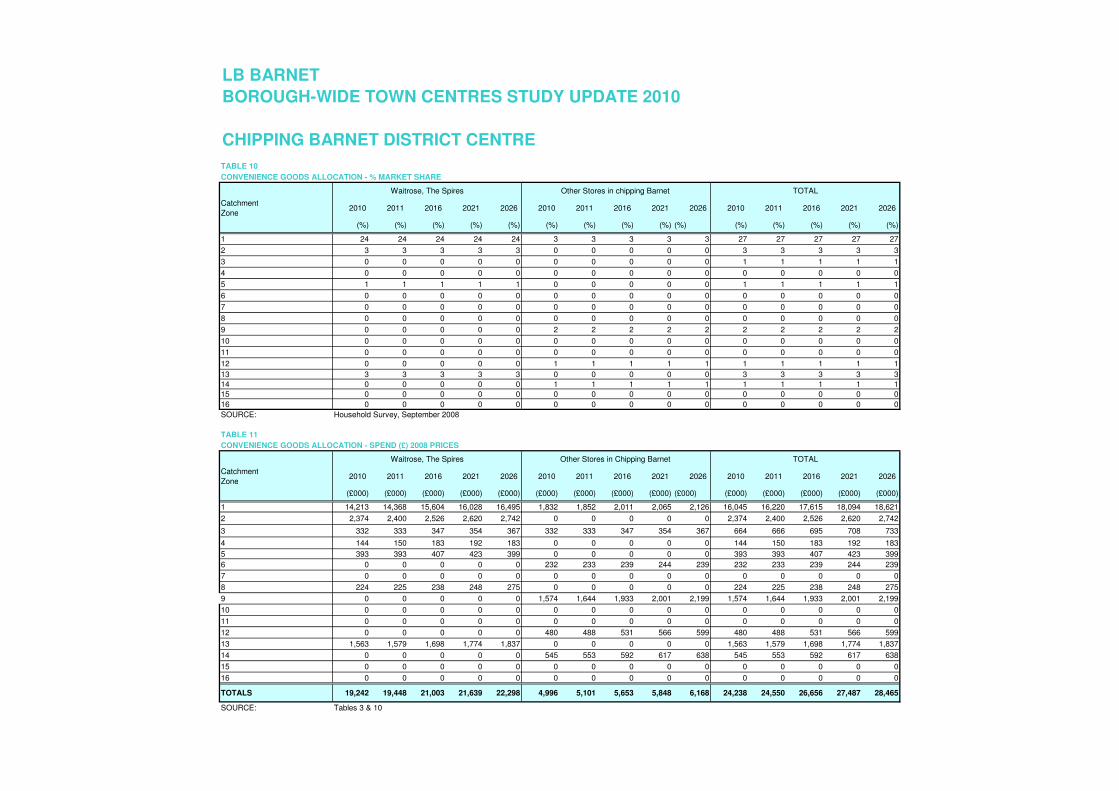
CHIPPING BARNET DISTRICT CENTRE
LB BARNET
Waitrose, The Spires Other Stores in chipping Barnet
BOROUGH-WIDE TOWN CENTRES STUDY UPDATE 2010
TABLE 12
CONVENIENCE GOODS ALLOCATION - % MARKET SHARE
Catchment
Zone2010 2011 2016 2021 2026 2010 2011 2016 2021 2026 2010 2011 2016 2021 2026
(%) (%) (%) (%) (%) (%) (%) (%) (%) (%) (%) (%) (%) (%) (%)
1 0 0 0 0 0 0 0 0 0 0 0 0 0 0 0
2 0 0 0 0 0 0 0 0 0 0 0 0 0 0 0
3 0 0 0 0 0 0 0 0 0 0 0 0 0 0 0
4 16 16 16 16 16 0 0 0 0 0 16 16 16 16 16
5 34 34 34 34 34 0 0 0 0 0 34 34 34 34 34
6 5 5 5 5 5 0 0 0 0 0 5 5 5 5 5
7 3 3 3 3 3 0 0 0 0 0 3 3 3 3 3
8 0 0 0 0 0 0 0 0 0 0 0 0 0 0 0
9 0 0 0 0 0 0 0 0 0 0 0 0 0 0 0
10 1 1 1 1 1 0 0 0 0 0 1 1 1 1 1
11 0 0 0 0 0 0 0 0 0 0 0 0 0 0 0
12 0 0 0 0 0 0 0 0 0 0 0 0 0 0 0
13 0 0 0 0 0 0 0 0 0 0 0 0 0 0 0
14 0 0 0 0 0 0 0 0 0 0 0 0 0 0 0
15 0 0 0 0 0 0 0 0 0 0 0 0 0 0 0
16 1 1 1 1 1 0 0 0 0 0 1 1 1 1 1
SOURCE: Household Survey, September 2008
TABLE 13
CONVENIENCE GOODS ALLOCATION - SPEND (£) 2008 PRICES
Catchment
Zone2010 2011 2016 2021 2026 2010 2011 2016 2021 2026 2010 2011 2016 2021 2026
(£000) (£000) (£000) (£000) (£000) (£000) (£000) (£000) (£000) (£000) (£000) (£000) (£000) (£000) (£000)
1 0 0 0 0 0 0 0 0 0 0 0 0 0 0 0
2 0 0 0 0 0 0 0 0 0 0 0 0 0 0 0
3 0 0 0 0 0 0 0 0 0 0 0 0 0 0 0
4 7,594 7,930 9,706 10,178 9,663 0 0 0 0 0 7,594 7,930 9,706 10,178 9,663
5 17,703 17,701 18,298 19,057 17,957 197 197 203 212 200 17,900 17,897 18,501 19,269 18,157
6 4,125 4,129 4,246 4,331 4,245 0 0 0 0 0 4,125 4,129 4,246 4,331 4,245
7 1,515 1,512 1,555 1,573 1,466 0 0 0 0 0 1,515 1,512 1,555 1,573 1,466
8 0 0 0 0 0 0 0 0 0 0 0 0 0 0 0
9 0 0 0 0 0 0 0 0 0 0 0 0 0 0 0
10 555 553 564 614 605 0 0 0 0 0 555 553 564 614 605
11 0 0 0 0 0 0 0 0 0 0 0 0 0 0 0
12 0 0 0 0 0 0 0 0 0 0 0 0 0 0 0
13 163 165 177 185 192 0 0 0 0 0 163 165 177 185 192
14 0 0 0 0 0 0 0 0 0 0 0 0 0 0 0
15 0 0 0 0 0 0 0 0 0 0 0 0 0 0 0
16 1,382 1,415 1,575 1,682 1,769 0 0 0 0 0 1,382 1,415 1,575 1,682 1,769
TOTALS 33,038 33,404 36,120 37,620 35,898 197 197 203 212 200 33,235 33,601 36,324 37,832 36,098
SOURCE: Tables 3 & 12
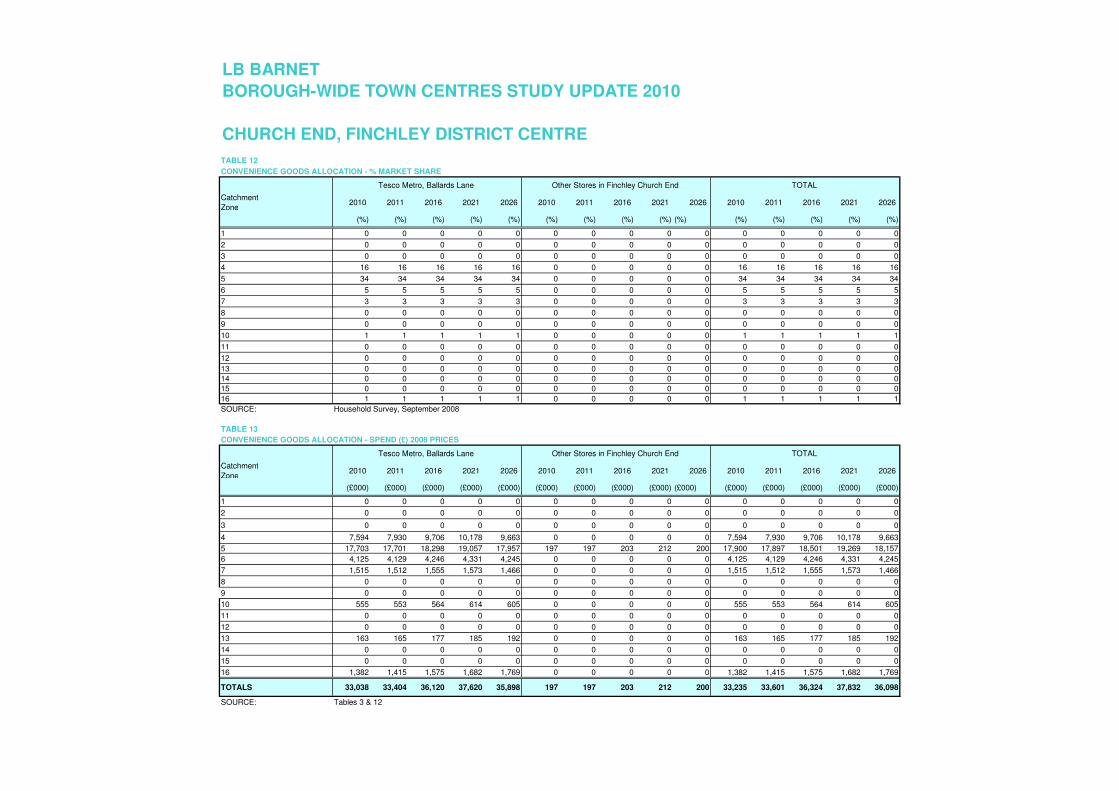
Tesco Metro, Ballards Lane Other Stores in Finchley Church End TOTAL
LB BARNET
CHURCH END, FINCHLEY DISTRICT CENTRE
TOTAL Tesco Metro, Ballards Lane Other Stores in Finchley Church End
BOROUGH-WIDE TOWN CENTRES STUDY UPDATE 2010
TABLE 14
CONVENIENCE GOODS ALLOCATION - % MARKET SHARE
Catchment
Zone2010 2011 2016 2021 2026
(%) (%) (%) (%) (%)
1 0 0 0 0 0
2 0 0 0 0 0
3 0 0 0 0 0
4 0 0 0 0 0
5 0 0 0 0 0
6 4 4 4 4 4
7 3 3 3 3 3
8 0 0 0 0 0
9 0 0 0 0 0
10 0 0 0 0 0
11 0 0 0 0 0
12 0 0 0 0 0
13 0 0 0 0 0
14 0 0 0 0 0
15 0 0 0 0 0
16 0 0 0 0 0
SOURCE: Household Survey, September 2008
TABLE 15
CONVENIENCE GOODS ALLOCATION - SPEND (£) 2008 PRICES
Catchment
Zone2010 2011 2016 2021 2026
(£000) (£000) (£000) (£000) (£000)
1 0 0 0 0 0
2 0 0 0 0 0
3 0 0 0 0 0
4 0 0 0 0 0
5 0 0 0 0 0
6 3,312 3,315 3,409 3,477 3,408
7 1,351 1,348 1,387 1,403 1,308
8 0 0 0 0 0
9 0 0 0 0 0
10 0 0 0 0 0
11 0 0 0 0 0
12 0 0 0 0 0
13 0 0 0 0 0
14 0 0 0 0 0
15 0 0 0 0 0
16 0 0 0 0 0
TOTALS 4,663 4,663 4,796 4,881 4,716
SOURCE: Tables 3 & 14
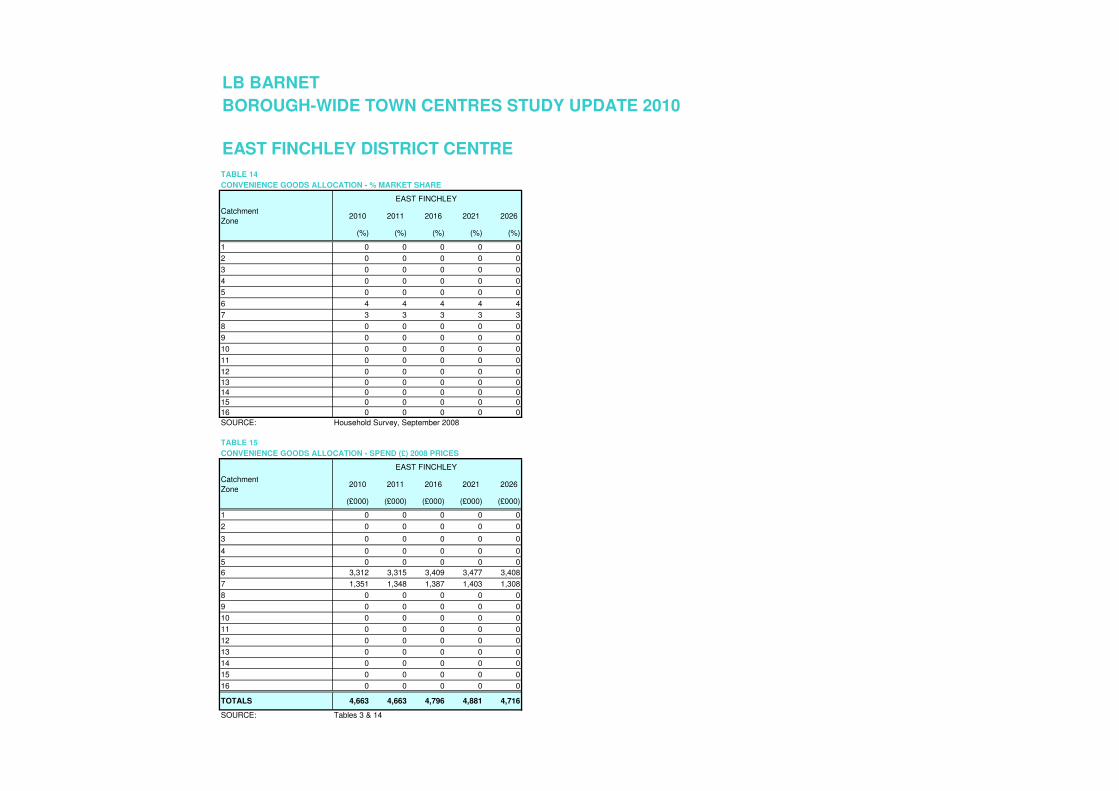
EAST FINCHLEY
EAST FINCHLEY
LB BARNET
EAST FINCHLEY DISTRICT CENTRE
BOROUGH-WIDE TOWN CENTRES STUDY UPDATE 2010
TABLE 16
CONVENIENCE GOODS ALLOCATION - % MARKET SHARE
Catchment
Zone2010 2011 2016 2021 2026
(%) (%) (%) (%) (%)
1 0 0 0 0 0
2 0 0 0 0 0
3 0 0 0 0 0
4 1 1 1 1 1
5 1 1 1 1 1
6 0 0 0 0 0
7 0 0 0 0 0
8 2 2 2 2 2
9 0 0 0 0 0
10 0 0 0 0 0
11 0 0 0 0 0
12 0 0 0 0 0
13 0 0 0 0 0
14 0 0 0 0 0
15 0 0 0 0 0
16 0 0 0 0 0
SOURCE: Household Survey, September 2008
TABLE 17
CONVENIENCE GOODS ALLOCATION - SPEND (£) 2008 PRICES
Catchment
Zone2010 2011 2016 2021 2026
(£000) (£000) (£000) (£000) (£000)
1 0 0 0 0 0
2 0 0 0 0 0
3 0 0 0 0 0
4 562 587 718 753 715
5 393 393 407 423 399
6 0 0 0 0 0
7 142 141 145 147 137
8 1,608 1,615 1,706 1,775 1,972
9 0 0 0 0 0
10 0 0 0 0 0
11 0 0 0 0 0
12 0 0 0 0 0
13 0 0 0 0 0
14 0 0 0 0 0
15 0 0 0 0 0
16 0 0 0 0 0
TOTALS 2,705 2,736 2,976 3,099 3,223
SOURCE: Tables 3 & 16
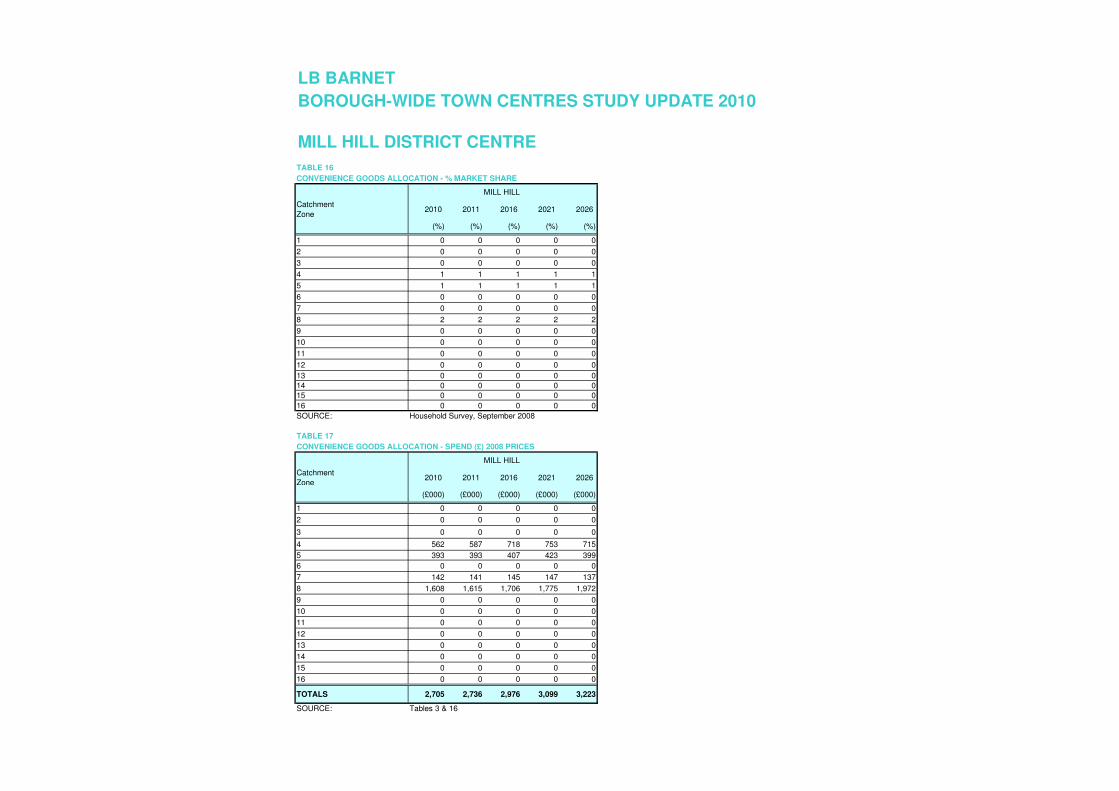
MILL HILL DISTRICT CENTRE
MILL HILL
MILL HILL
LB BARNET
BOROUGH-WIDE TOWN CENTRES STUDY UPDATE 2010
TABLE 18
CONVENIENCE GOODS ALLOCATION - % MARKET SHARE
Catchment
Zone2010 2011 2016 2021 2026
(%) (%) (%) (%) (%)
1 0 0 0 0 0
2 0 0 0 0 0
3 0 0 0 0 0
4 0 0 0 0 0
5 0 0 0 0 0
6 0 0 0 0 0
7 0 0 0 0 0
8 0 0 0 0 0
9 1 1 1 1 1
10 0 0 0 0 0
11 0 0 0 0 0
12 0 0 0 0 0
13 0 0 0 0 0
14 0 0 0 0 0
15 0 0 0 0 0
16 0 0 0 0 0
SOURCE: Household Survey, September 2008
TABLE 19
CONVENIENCE GOODS ALLOCATION - SPEND (£) 2008 PRICES
Catchment
Zone2010 2011 2016 2021 2026
(£000) (£000) (£000) (£000) (£000)
1 0 0 0 0 0
2 0 0 0 0 0
3 0 0 0 0 0
4 0 0 0 0 0
5 0 0 0 0 0
6 0 0 0 0 0
7 0 0 0 0 0
8 0 0 0 0 0
9 1,259 1,315 1,546 1,601 1,759
10 0 0 0 0 0
11 347 366 510 539 563
12 0 0 0 0 0
13 0 0 0 0 0
14 0 0 0 0 0
15 0 0 0 0 0
16 0 0 0 0 0
TOTALS 1,606 1,681 2,056 2,140 2,322
SOURCE: Tables 3 & 18
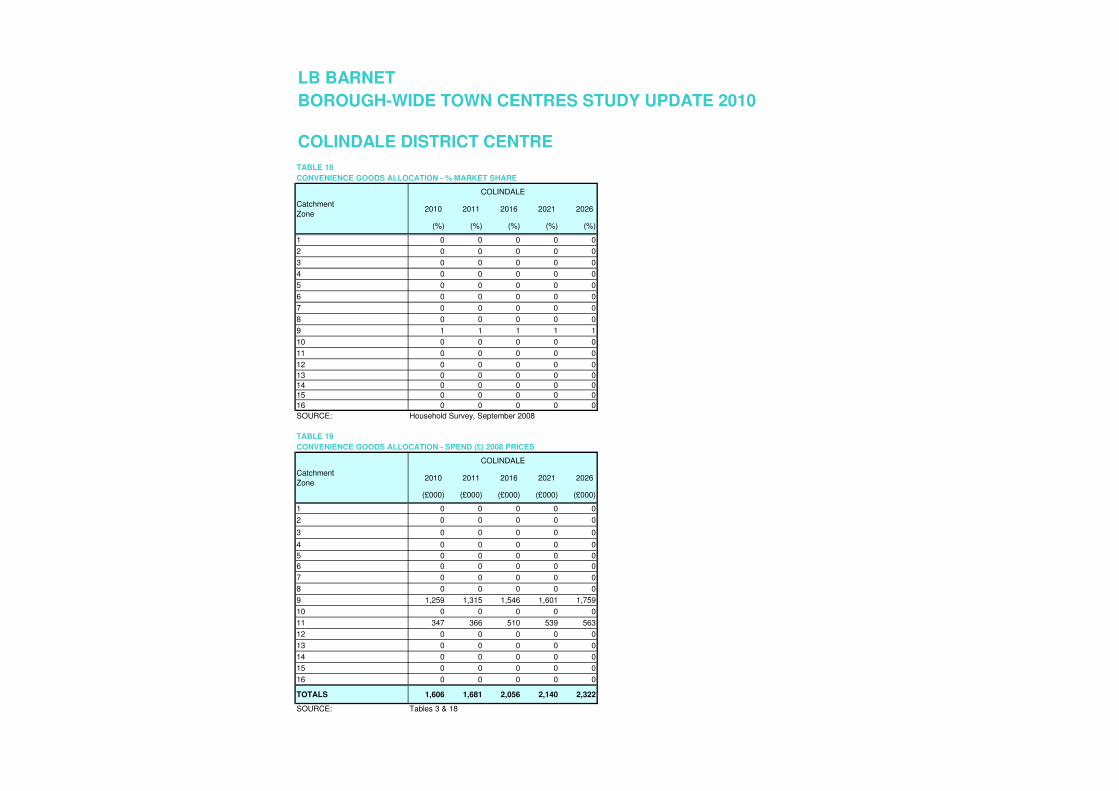
COLINDALE
LB BARNET
COLINDALE DISTRICT CENTRE
COLINDALE
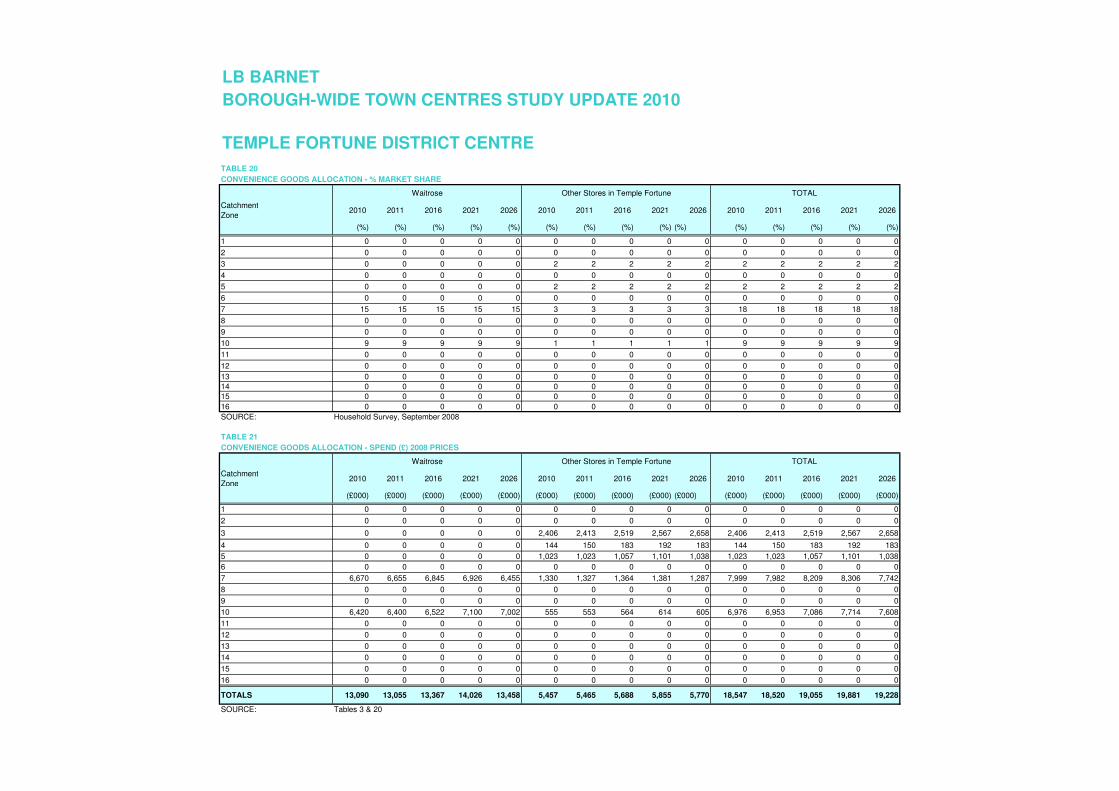
BOROUGH-WIDE TOWN CENTRES STUDY UPDATE 2010
TABLE 20
CONVENIENCE GOODS ALLOCATION - % MARKET SHARE
Catchment
Zone2010 2011 2016 2021 2026 2010 2011 2016 2021 2026 2010 2011 2016 2021 2026
(%) (%) (%) (%) (%) (%) (%) (%) (%) (%) (%) (%) (%) (%) (%)
1 0 0 0 0 0 0 0 0 0 0 0 0 0 0 0
2 0 0 0 0 0 0 0 0 0 0 0 0 0 0 0
3 0 0 0 0 0 2 2 2 2 2 2 2 2 2 2
4 0 0 0 0 0 0 0 0 0 0 0 0 0 0 0
5 0 0 0 0 0 2 2 2 2 2 2 2 2 2 2
6 0 0 0 0 0 0 0 0 0 0 0 0 0 0 0
7 15 15 15 15 15 3 3 3 3 3 18 18 18 18 18
8 0 0 0 0 0 0 0 0 0 0 0 0 0 0 0
9 0 0 0 0 0 0 0 0 0 0 0 0 0 0 0
10 9 9 9 9 9 1 1 1 1 1 9 9 9 9 9
11 0 0 0 0 0 0 0 0 0 0 0 0 0 0 0
12 0 0 0 0 0 0 0 0 0 0 0 0 0 0 0
13 0 0 0 0 0 0 0 0 0 0 0 0 0 0 0
14 0 0 0 0 0 0 0 0 0 0 0 0 0 0 0
15 0 0 0 0 0 0 0 0 0 0 0 0 0 0 0
16 0 0 0 0 0 0 0 0 0 0 0 0 0 0 0
SOURCE: Household Survey, September 2008
TABLE 21
CONVENIENCE GOODS ALLOCATION - SPEND (£) 2008 PRICES
Catchment
Zone2010 2011 2016 2021 2026 2010 2011 2016 2021 2026 2010 2011 2016 2021 2026
(£000) (£000) (£000) (£000) (£000) (£000) (£000) (£000) (£000) (£000) (£000) (£000) (£000) (£000) (£000)
1 0 0 0 0 0 0 0 0 0 0 0 0 0 0 0
2 0 0 0 0 0 0 0 0 0 0 0 0 0 0 0
3 0 0 0 0 0 2,406 2,413 2,519 2,567 2,658 2,406 2,413 2,519 2,567 2,658
4 0 0 0 0 0 144 150 183 192 183 144 150 183 192 183
5 0 0 0 0 0 1,023 1,023 1,057 1,101 1,038 1,023 1,023 1,057 1,101 1,038
6 0 0 0 0 0 0 0 0 0 0 0 0 0 0 0
7 6,670 6,655 6,845 6,926 6,455 1,330 1,327 1,364 1,381 1,287 7,999 7,982 8,209 8,306 7,742
8 0 0 0 0 0 0 0 0 0 0 0 0 0 0 0
9 0 0 0 0 0 0 0 0 0 0 0 0 0 0 0
10 6,420 6,400 6,522 7,100 7,002 555 553 564 614 605 6,976 6,953 7,086 7,714 7,608
11 0 0 0 0 0 0 0 0 0 0 0 0 0 0 0
12 0 0 0 0 0 0 0 0 0 0 0 0 0 0 0
13 0 0 0 0 0 0 0 0 0 0 0 0 0 0 0
14 0 0 0 0 0 0 0 0 0 0 0 0 0 0 0
15 0 0 0 0 0 0 0 0 0 0 0 0 0 0 0
16 0 0 0 0 0 0 0 0 0 0 0 0 0 0 0
TOTALS 13,090 13,055 13,367 14,026 13,458 5,457 5,465 5,688 5,855 5,770 18,547 18,520 19,055 19,881 19,228
SOURCE: Tables 3 & 20
Other Stores in Temple Fortune
TOTAL Other Stores in Temple FortuneWaitrose
Waitrose TOTAL
LB BARNET
TEMPLE FORTUNE DISTRICT CENTRE
BOROUGH-WIDE TOWN CENTRES STUDY UPDATE 2010
TABLE 22
CONVENIENCE GOODS ALLOCATION - % MARKET SHARE
Catchment
Zone2010 2011 2016 2021 2026 2010 2011 2016 2021 2026 2010 2011 2016 2021 2026
(%) (%) (%) (%) (%) (%) (%) (%) (%) (%) (%) (%) (%) (%) (%)
1 0 0 0 0 0 0 0 0 0 0 0 0 0 0 0
2 0 0 0 0 0 0 0 0 0 0 0 0 0 0 0
3 0 0 0 0 0 0 0 0 0 0 0 0 0 0 0
4 1 1 1 1 1 0 0 0 0 0 1 1 1 1 1
5 0 0 0 0 0 0 0 0 0 0 0 0 0 0 0
6 0 0 0 0 0 0 0 0 0 0 0 0 0 0 0
7 0 0 0 0 0 0 0 0 0 0 0 0 0 0 0
8 1 1 1 1 1 1 1 1 1 1 2 2 2 2 2
9 7 7 7 7 7 3 3 3 3 3 10 10 10 10 10
10 0 0 0 0 0 0 0 0 0 0 0 0 0 0 0
11 0 0 0 0 0 2 2 2 2 2 2 2 2 2 2
12 0 0 0 0 0 0 0 0 0 0 0 0 0 0 0
13 0 0 0 0 0 0 0 0 0 0 0 0 0 0 0
14 0 0 0 0 0 0 0 0 0 0 0 0 0 0 0
15 0 0 0 0 0 1 1 1 1 1 1 1 1 1 1
16 0 0 0 0 0 0 0 0 0 0 0 0 0 0 0
SOURCE: Household Survey, September 2008
TABLE 23
CONVENIENCE GOODS ALLOCATION - SPEND (£) 2008 PRICES
Catchment
Zone2010 2011 2016 2021 2026 2010 2011 2016 2021 2026 2010 2011 2016 2021 2026
(£000) (£000) (£000) (£000) (£000) (£000) (£000) (£000) (£000) (£000) (£000) (£000) (£000) (£000) (£000)
1 0 0 0 0 0 0 0 0 0 0 0 0 0 0 0
2 0 0 0 0 0 0 0 0 0 0 0 0 0 0 0
3 0 0 0 0 0 0 0 0 0 0 0 0 0 0 0
4 359 375 459 481 457 0 0 0 0 0 359 375 459 481 457
5 0 0 0 0 0 0 0 0 0 0 0 0 0 0 0
6 0 0 0 0 0 0 0 0 0 0 0 0 0 0 0
7 0 0 0 0 0 0 0 0 0 0 0 0 0 0 0
8 916 920 972 1,011 1,124 561 563 595 619 688 1,477 1,483 1,567 1,631 1,812
9 6,975 7,283 8,564 8,867 9,742 2,616 2,731 3,212 3,325 3,653 9,591 10,015 11,776 12,193 13,395
10 0 0 0 0 0 0 0 0 0 0 0 0 0 0 0
11 0 0 0 0 0 1,690 1,784 2,487 2,628 2,742 1,690 1,784 2,487 2,628 2,742
12 0 0 0 0 0 0 0 0 0 0 0 0 0 0 0
13 0 0 0 0 0 0 0 0 0 0 0 0 0 0 0
14 0 0 0 0 0 0 0 0 0 0 0 0 0 0 0
15 0 0 0 0 0 1,340 1,374 1,543 1,649 1,726 1,340 1,374 1,543 1,649 1,726
16 0 0 0 0 0 0 0 0 0 0 0 0 0 0 0
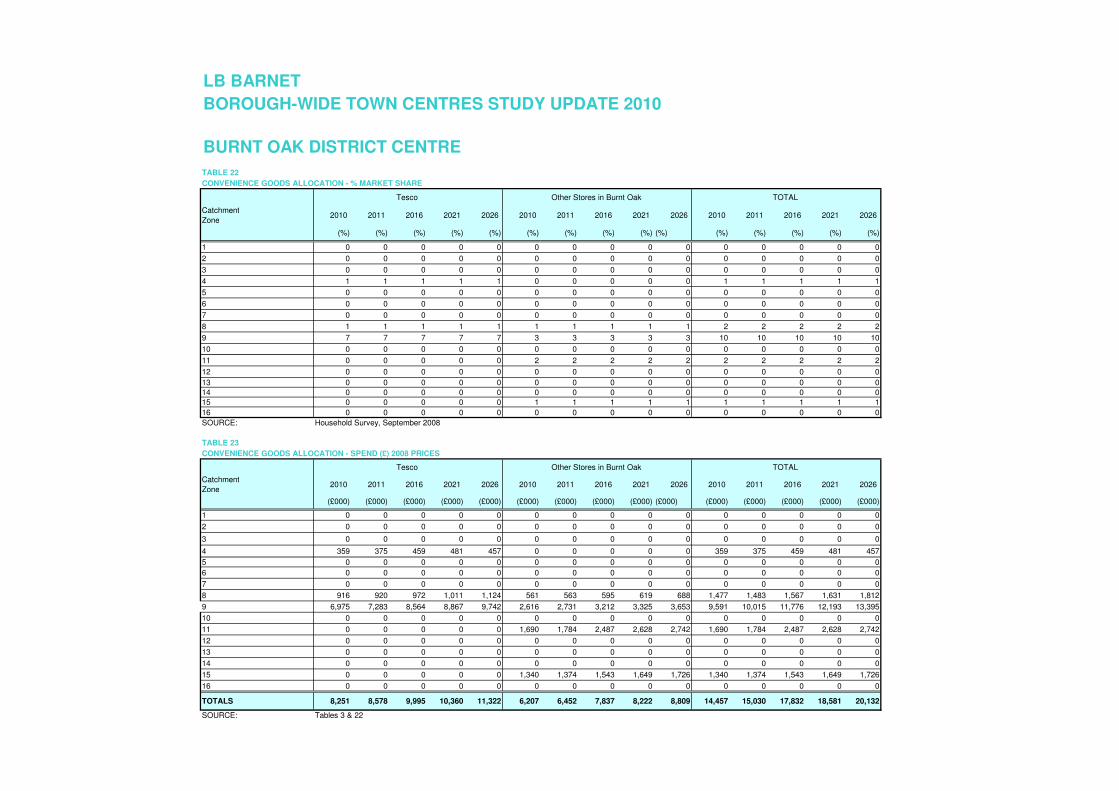
TOTALS 8,251 8,578 9,995 10,360 11,322 6,207 6,452 7,837 8,222 8,809 14,457 15,030 17,832 18,581 20,132
SOURCE: Tables 3 & 22
TOTAL
LB BARNET
BURNT OAK DISTRICT CENTRE
TOTAL Tesco Other Stores in Burnt Oak
Tesco Other Stores in Burnt Oak
BOROUGH-WIDE TOWN CENTRES STUDY UPDATE 2010
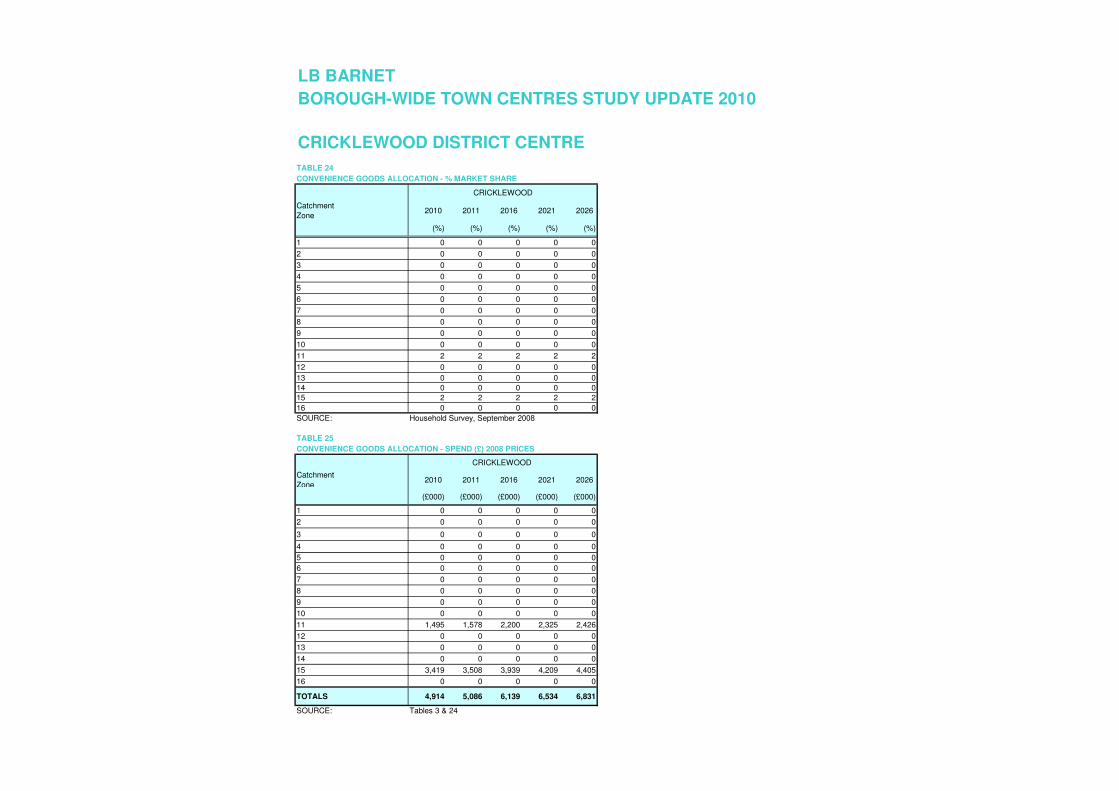
CRICKLEWOOD DISTRICT CENTRE
TABLE 24
CONVENIENCE GOODS ALLOCATION - % MARKET SHARE
Catchment
Zone2010 2011 2016 2021 2026
(%) (%) (%) (%) (%)
1 0 0 0 0 0
2 0 0 0 0 0
3 0 0 0 0 0
4 0 0 0 0 0
5 0 0 0 0 0
6 0 0 0 0 0
7 0 0 0 0 0
8 0 0 0 0 0
9 0 0 0 0 0
10 0 0 0 0 0
11 2 2 2 2 2
12 0 0 0 0 0
13 0 0 0 0 0
14 0 0 0 0 0
15 2 2 2 2 2
16 0 0 0 0 0
SOURCE: Household Survey, September 2008
TABLE 25
CONVENIENCE GOODS ALLOCATION - SPEND (£) 2008 PRICES
Catchment
Zone2010 2011 2016 2021 2026
(£000) (£000) (£000) (£000) (£000)
1 0 0 0 0 0
2 0 0 0 0 0
3 0 0 0 0 0
4 0 0 0 0 0
5 0 0 0 0 0
6 0 0 0 0 0
7 0 0 0 0 0
8 0 0 0 0 0
9 0 0 0 0 0
10 0 0 0 0 0
11 1,495 1,578 2,200 2,325 2,426
12 0 0 0 0 0
13 0 0 0 0 0
14 0 0 0 0 0
15 3,419 3,508 3,939 4,209 4,405
16 0 0 0 0 0
TOTALS 4,914 5,086 6,139 6,534 6,831
SOURCE: Tables 3 & 24
CRICKLEWOOD
CRICKLEWOOD
LB BARNET
BOROUGH-WIDE TOWN CENTRES STUDY UPDATE 2010
TABLE 26
CONVENIENCE GOODS ALLOCATION - % MARKET SHARE
Catchment
Zone2010 2011 2016 2021 2026 2010 2011 2016 2021 2026 2010 2011 2016 2021 2026
(%) (%) (%) (%) (%) (%) (%) (%) (%) (%) (%) (%) (%) (%) (%)
1 0 0 0 0 0 0 0 0 0 0 0 0 0 0 0
2 3 3 3 3 3 1 1 1 1 1 4 4 4 4 4
3 20 20 20 20 20 0 0 0 0 0 20 20 20 20 20
4 5 5 5 5 5 0 0 0 0 0 5 5 5 5 5
5 3 3 3 3 3 0 0 0 0 0 3 3 3 3 3
6 2 2 2 2 2 0 0 0 0 0 2 2 2 2 2
7 4 4 4 4 4 0 0 0 0 0 4 4 4 4 4
8 0 0 0 0 0 0 0 0 0 0 0 0 0 0 0
9 1 1 1 1 1 0 0 0 0 0 1 1 1 1 1
10 1 1 1 1 1 0 0 0 0 0 1 1 1 1 1
11 0 0 0 0 0 0 0 0 0 0 0 0 0 0 0
12 0 0 0 0 0 0 0 0 0 0 0 0 0 0 0
13 1 1 1 1 1 0 0 0 0 0 1 1 1 1 1
14 0 0 0 0 0 0 0 0 0 0 0 0 0 0 0
15 2 2 2 2 2 0 0 0 0 0 2 2 2 2 2
16 1 1 1 1 1 0 0 0 0 0 1 1 1 1 1
SOURCE: Household Survey, September 2008
TABLE 27
CONVENIENCE GOODS ALLOCATION - SPEND (£) 2008 PRICES
Catchment
Zone2010 2011 2016 2021 2026 2010 2011 2016 2021 2026 2010 2011 2016 2021 2026
(£000) (£000) (£000) (£000) (£000) (£000) (£000) (£000) (£000) (£000) (£000) (£000) (£000) (£000) (£000)
1 0 0 0 0 0 0 0 0 0 0 0 0 0 0 0
2 2,374 2,400 2,526 2,620 2,742 471 476 501 520 544 2,845 2,876 3,027 3,140 3,286
3 21,845 21,908 22,876 23,310 24,133 0 0 0 0 0 21,845 21,908 22,876 23,310 24,133
4 2,356 2,460 3,011 3,158 2,998 0 0 0 0 0 2,356 2,460 3,011 3,158 2,998
5 1,416 1,416 1,464 1,525 1,437 0 0 0 0 0 1,416 1,416 1,464 1,525 1,437
6 1,917 1,919 1,974 2,013 1,973 0 0 0 0 0 1,917 1,919 1,974 2,013 1,973
7 1,874 1,870 1,924 1,946 1,814 0 0 0 0 0 1,874 1,870 1,924 1,946 1,814
8 0 0 0 0 0 0 0 0 0 0 0 0 0 0 0
9 1,041 1,087 1,279 1,324 1,455 0 0 0 0 0 1,041 1,087 1,279 1,324 1,455
10 796 793 808 880 868 0 0 0 0 0 796 793 808 880 868
11 0 0 0 0 0 0 0 0 0 0 0 0 0 0 0
12 0 0 0 0 0 0 0 0 0 0 0 0 0 0 0
13 571 577 620 648 671 0 0 0 0 0 571 577 620 648 671
14 0 0 0 0 0 0 0 0 0 0 0 0 0 0 0
15 3,243 3,327 3,736 3,992 4,178 0 0 0 0 0 3,243 3,327 3,736 3,992 4,178
16 1,382 1,415 1,575 1,682 1,769 0 0 0 0 0 1,382 1,415 1,575 1,682 1,769
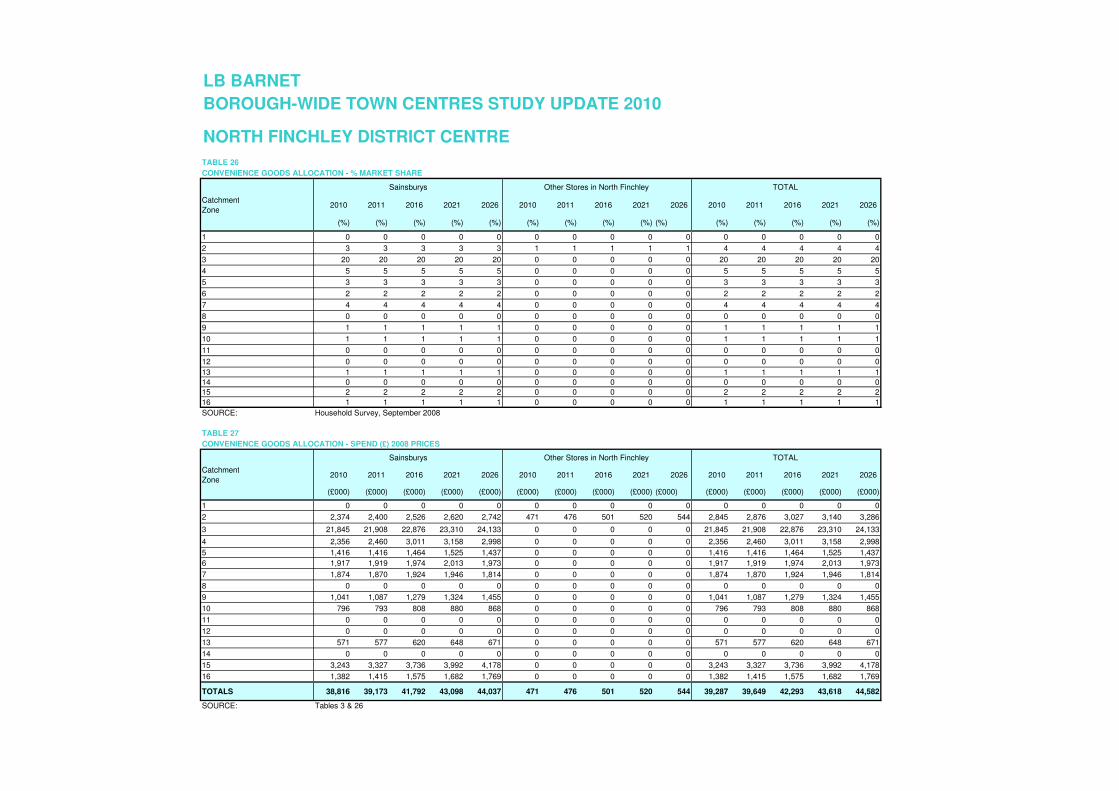
TOTALS 38,816 39,173 41,792 43,098 44,037 471 476 501 520 544 39,287 39,649 42,293 43,618 44,582
SOURCE: Tables 3 & 26
Other Stores in North Finchley Sainsburys TOTAL
NORTH FINCHLEY DISTRICT CENTRE
Sainsburys
LB BARNET
TOTAL Other Stores in North Finchley
BOROUGH-WIDE TOWN CENTRES STUDY UPDATE 2010
TABLE 28
CONVENIENCE GOODS ALLOCATION - % MARKET SHARE
Catchment
Zone2010 2011 2016 2021 2026 2010 2011 2016 2021 2026 2010 2011 2016 2021 2026
(%) (%) (%) (%) (%) (%) (%) (%) (%) (%) (%) (%) (%) (%) (%)
1 28 28 28 28 28 0 0 0 0 0 28 28 28 28 28
2 34 34 34 34 34 2 2 2 2 2 36 36 36 36 36
3 1 1 1 1 1 0 0 0 0 0 1 1 1 1 1
4 0 0 0 0 0 0 0 0 0 0 0 0 0 0 0
5 0 0 0 0 0 1 1 1 1 1 1 1 1 1 1
6 0 0 0 0 0 4 4 4 4 4 4 4 4 4 4
7 0 0 0 0 0 2 2 2 2 2 2 2 2 2 2
8 0 0 0 0 0 0 0 0 0 0 0 0 0 0 0
9 0 0 0 0 0 0 0 0 0 0 0 0 0 0 0
10 0 0 0 0 0 0 0 0 0 0 0 0 0 0 0
11 0 0 0 0 0 0 0 0 0 0 0 0 0 0 0
12 0 0 0 0 0 0 0 0 0 0 0 0 0 0 0
13 4 4 4 4 4 0 0 0 0 0 4 4 4 4 4
14 0 0 0 0 0 0 0 0 0 0 0 0 0 0 0
15 0 0 0 0 0 0 0 0 0 0 0 0 0 0 0
16 0 0 0 0 0 1 1 1 1 1 1 1 1 1 1
SOURCE: Household Survey, September 2008
TABLE 29
CONVENIENCE GOODS ALLOCATION - SPEND (£) 2008 PRICES
Catchment
Zone2010 2011 2016 2021 2026 2010 2011 2016 2021 2026 2010 2011 2016 2021 2026
(£000) (£000) (£000) (£000) (£000) (£000) (£000) (£000) (£000) (£000) (£000) (£000) (£000) (£000) (£000)
1 16,557 16,738 18,178 18,672 19,216 0 0 0 0 0 16,557 16,738 18,178 18,672 19,216
2 23,544 23,801 25,052 25,989 27,198 1,326 1,341 1,411 1,464 1,532 24,870 25,142 26,463 27,453 28,731
3 830 832 869 885 916 0 0 0 0 0 830 832 869 885 916
4 0 0 0 0 0 144 150 183 192 183 144 150 183 192 183
5 0 0 0 0 0 393 393 407 423 399 393 393 407 423 399
6 0 0 0 0 0 3,176 3,179 3,270 3,335 3,269 3,176 3,179 3,270 3,335 3,269
7 0 0 0 0 0 719 718 738 747 696 719 718 738 747 696
8 0 0 0 0 0 0 0 0 0 0 0 0 0 0 0
9 0 0 0 0 0 0 0 0 0 0 0 0 0 0 0
10 0 0 0 0 0 0 0 0 0 0 0 0 0 0 0
11 0 0 0 0 0 0 0 0 0 0 0 0 0 0 0
12 0 0 0 0 0 0 0 0 0 0 0 0 0 0 0
13 2,079 2,101 2,260 2,360 2,444 0 0 0 0 0 2,079 2,101 2,260 2,360 2,444
14 0 0 0 0 0 0 0 0 0 0 0 0 0 0 0
15 0 0 0 0 0 0 0 0 0 0 0 0 0 0 0
16 0 0 0 0 0 1,047 1,072 1,193 1,274 1,340 1,047 1,072 1,193 1,274 1,340
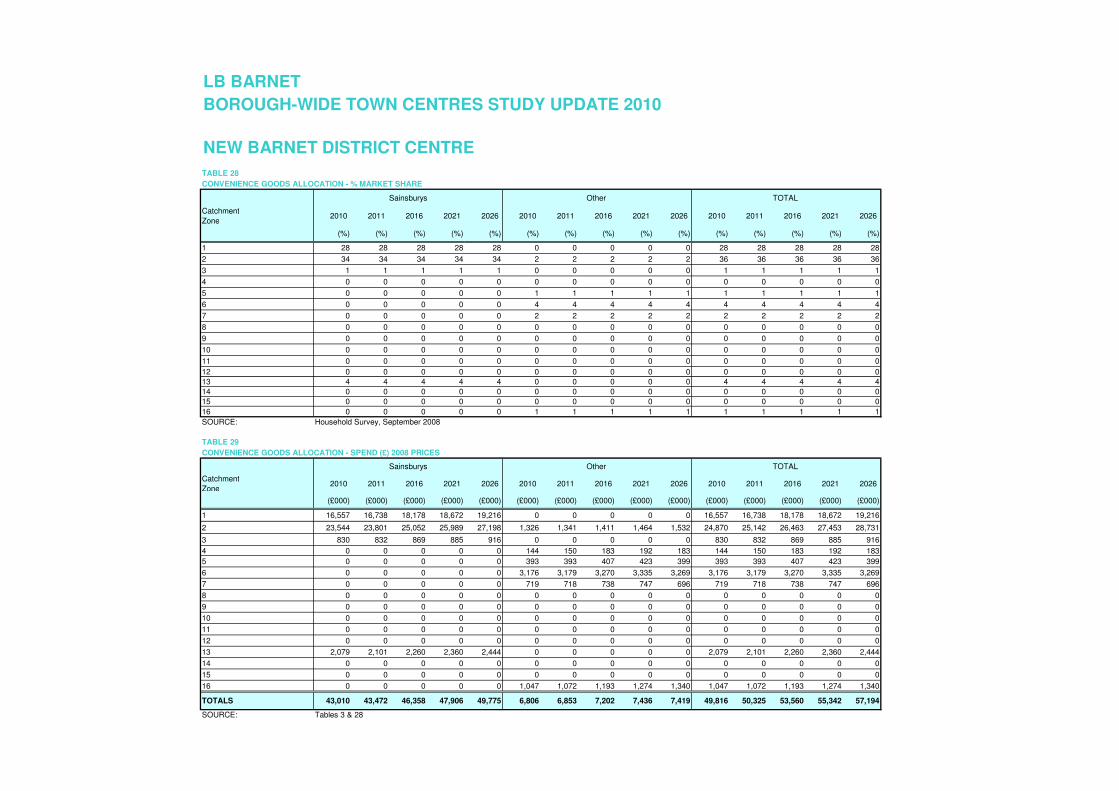
TOTALS 43,010 43,472 46,358 47,906 49,775 6,806 6,853 7,202 7,436 7,419 49,816 50,325 53,560 55,342 57,194
SOURCE: Tables 3 & 28
Other
NEW BARNET DISTRICT CENTRE
Sainsburys Other
Sainsburys TOTAL
LB BARNET
TOTAL
BOROUGH-WIDE TOWN CENTRES STUDY UPDATE 2010
TABLE 30
CONVENIENCE GOODS ALLOCATION - % MARKET SHARE
Catchment
Zone2010 2011 2016 2021 2026 2010 2011 2016 2021 2026 2010 2011 2016 2021 2026
(%) (%) (%) (%) (%) (%) (%) (%) (%) (%) (%) (%) (%) (%) (%)
1 1 1 1 1 1 0 0 0 0 0 1 1 1 1 1
2 11 11 11 11 11 0 0 0 0 0 11 11 11 11 11
3 5 5 5 5 5 0 0 0 0 0 5 5 5 5 5
4 0 0 0 0 0 0 0 0 0 0 0 0 0 0 0
5 0 0 0 0 0 0 0 0 0 0 0 0 0 0 0
6 0 0 0 0 0 0 0 0 0 0 0 0 0 0 0
7 0 0 0 0 0 0 0 0 0 0 0 0 0 0 0
8 0 0 0 0 0 6 6 6 6 6 6 6 6 6 6
9 0 0 0 0 0 2 2 2 2 2 2 2 2 2 2
10 0 0 0 0 0 0 0 0 0 0 0 0 0 0 0
11 0 0 0 0 0 0 0 0 0 0 0 0 0 0 0
12 0 0 0 0 0 0 0 0 0 0 0 0 0 0 0
13 2 2 2 2 2 0 0 0 0 0 2 2 2 2 2
14 0 0 0 0 0 1 1 1 1 1 1 1 1 1 1
15 0 0 0 0 0 0 0 0 0 0 0 0 0 0 0
16 0 0 0 0 0 0 0 0 0 0 0 0 0 0 0
SOURCE: Household Survey, September 2008
TABLE 31
CONVENIENCE GOODS ALLOCATION - SPEND (£) 2008 PRICES
Catchment
Zone2010 2011 2016 2021 2026 2010 2011 2016 2021 2026 2010 2011 2016 2021 2026
(£000) (£000) (£000) (£000) (£000) (£000) (£000) (£000) (£000) (£000) (£000) (£000) (£000) (£000) (£000)
1 440 444 483 496 510 0 0 0 0 0 440 444 483 496 510
2 7,417 7,499 7,892 8,188 8,569 0 0 0 0 0 7,417 7,499 7,892 8,188 8,569
3 5,890 5,907 6,168 6,285 6,507 0 0 0 0 0 5,890 5,907 6,168 6,285 6,507
4 144 150 183 192 183 0 0 0 0 0 144 150 183 192 183
5 0 0 0 0 0 0 0 0 0 0 0 0 0 0 0
6 0 0 0 0 0 0 0 0 0 0 0 0 0 0 0
7 0 0 0 0 0 0 0 0 0 0 0 0 0 0 0
8 0 0 0 0 0 4,395 4,412 4,662 4,851 5,389 4,395 4,412 4,662 4,851 5,389
9 0 0 0 0 0 1,671 1,745 2,052 2,124 2,334 1,671 1,745 2,052 2,124 2,334
10 0 0 0 0 0 0 0 0 0 0 0 0 0 0 0
11 0 0 0 0 0 0 0 0 0 0 0 0 0 0 0
12 0 0 0 0 0 0 0 0 0 0 0 0 0 0 0
13 978 989 1,063 1,110 1,150 0 0 0 0 0 978 989 1,063 1,110 1,150
14 0 0 0 0 0 491 497 532 556 574 491 497 532 556 574
15 0 0 0 0 0 0 0 0 0 0 0 0 0 0 0
16 0 0 0 0 0 0 0 0 0 0 0 0 0 0 0
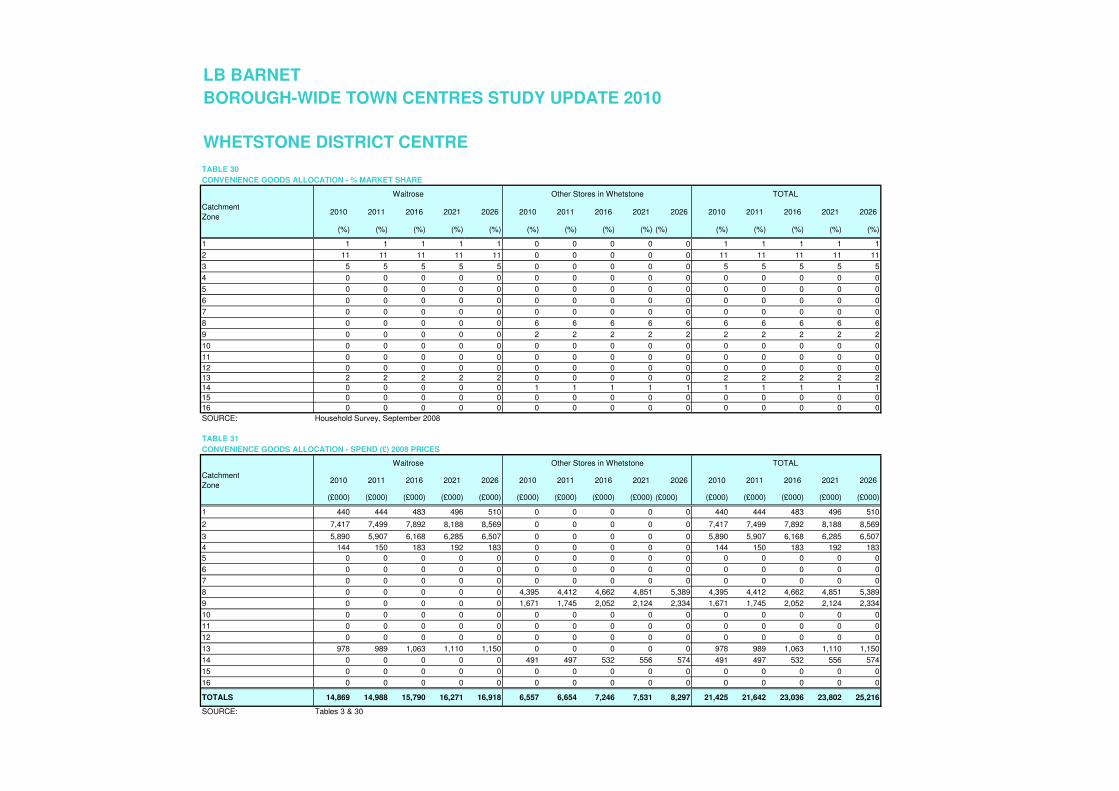
TOTALS 14,869 14,988 15,790 16,271 16,918 6,557 6,654 7,246 7,531 8,297 21,425 21,642 23,036 23,802 25,216
SOURCE: Tables 3 & 30
TOTAL
LB BARNET
Waitrose
WHETSTONE DISTRICT CENTRE
Other Stores in Whetstone TOTAL
Waitrose Other Stores in Whetstone
BOROUGH-WIDE TOWN CENTRES STUDY UPDATE 2010
TABLE 32
CONVENIENCE GOODS ALLOCATION - % MARKET SHARE
Catchment
Zone2010 2011 2016 2021 2026
(%) (%) (%) (%) (%)
1 0 0 0 0 0
2 0 0 0 0 0
3 0 0 0 0 0
4 0 0 0 0 0
5 0 0 0 0 0
6 0 0 0 0 0
7 0 0 0 0 0
8 0 0 0 0 0
9 0 0 0 0 0
10 1 1 1 1 1
11 0 0 0 0 0
12 0 0 0 0 0
13 0 0 0 0 0
14 0 0 0 0 0
15 0 0 0 0 0
16 0 0 0 0 0
SOURCE: Household Survey, September 2008
TABLE 33
CONVENIENCE GOODS ALLOCATION - SPEND (£) 2008 PRICES
Catchment
Zone2010 2011 2016 2021 2026
(£000) (£000) (£000) (£000) (£000)
1 0 0 0 0 0
2 0 0 0 0 0
3 0 0 0 0 0
4 144 150 183 192 183
5 0 0 0 0 0
6 0 0 0 0 0
7 0 0 0 0 0
8 0 0 0 0 0
9 315 329 387 400 440
10 481 480 489 532 525
11 0 0 0 0 0
12 0 0 0 0 0
13 0 0 0 0 0
14 0 0 0 0 0
15 0 0 0 0 0
16 0 0 0 0 0
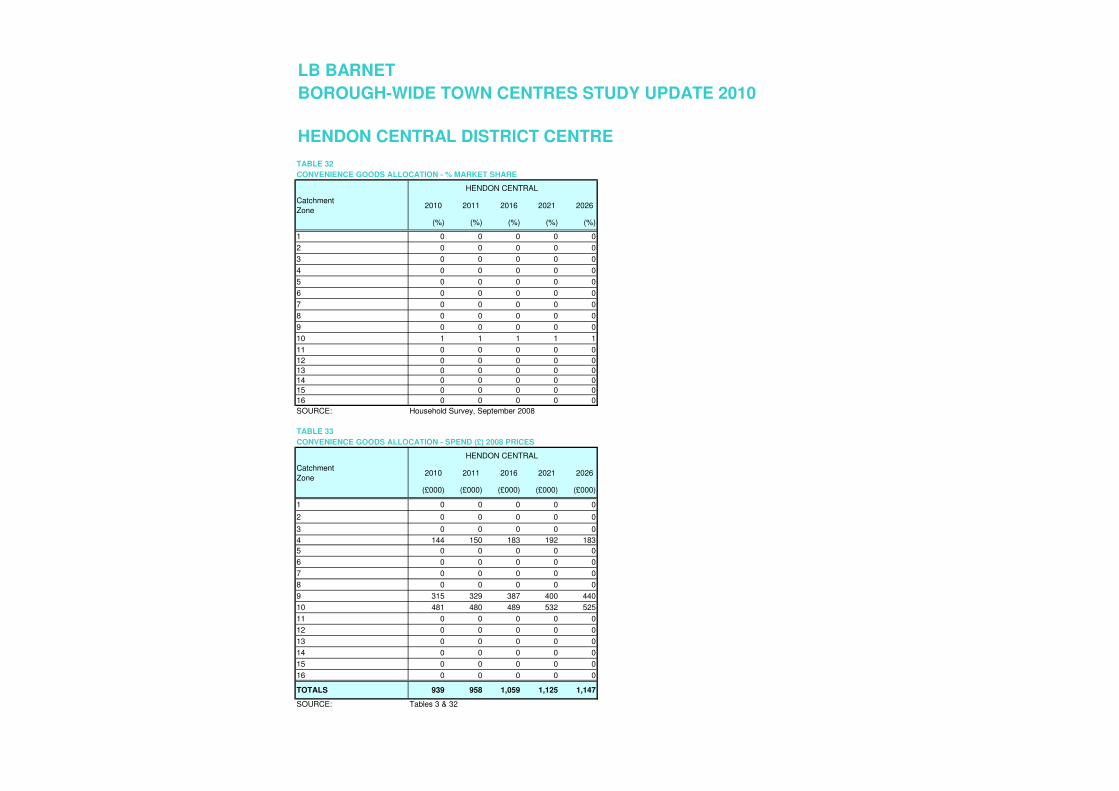
TOTALS 939 958 1,059 1,125 1,147
SOURCE: Tables 3 & 32
HENDON CENTRAL
LB BARNET
HENDON CENTRAL
HENDON CENTRAL DISTRICT CENTRE
BOROUGH-WIDE TOWN CENTRES STUDY UPDATE 2010
TABLE 34
CONVENIENCE GOODS ALLOCATION - % MARKET SHARE
Catchment
Zone2010 2011 2016 2021 2026 2010 2011 2016 2021 2026 2010 2011 2016 2021 2026 2010 2011 2016 2021 2026
(%) (%) (%) (%) (%) (%) (%) (%) (%) (%) (%) (%) (%) (%) (%) (%) (%) (%) (%) (%)
1 0 0 0 0 0 0 0 0 0 0 0 0 0 0 0 0 0 0 0 0
2 0 0 0 0 0 2 2 2 2 2 0 0 0 0 0 2 2 2 2 2
3 0 0 0 0 0 0 0 0 0 0 0 0 0 0 0 0 0 0 0 0
4 0 0 0 0 0 0 0 0 0 0 0 0 0 0 0 0 0 0 0 0
5 0 0 0 0 0 0 0 0 0 0 1 1 1 1 1 1 1 1 1 1
6 0 0 0 0 0 1 1 1 1 1 0 0 0 0 0 1 1 1 1 1
7 3 3 3 3 3 1 1 1 1 1 0 0 0 0 0 4 4 4 4 4
8 0 0 0 0 0 0 0 0 0 0 0 0 0 0 0 0 0 0 0 0
9 0 0 0 0 0 0 0 0 0 0 0 0 0 0 0 0 0 0 0 0
10 9 9 9 9 9 3 3 3 3 3 3 3 3 3 3 14 14 14 14 14
11 2 2 2 2 2 0 0 0 0 0 0 0 0 0 0 2 2 2 2 2
12 0 0 0 0 0 0 0 0 0 0 0 0 0 0 0 0 0 0 0 0
13 0 0 0 0 0 0 0 0 0 0 0 0 0 0 0 0 0 0 0 0
14 0 0 0 0 0 0 0 0 0 0 0 0 0 0 0 0 0 0 0 0
15 7 7 7 7 7 1 1 1 1 1 0 0 0 0 0 8 8 8 8 8
16 5 5 5 5 5 0 0 0 0 0 0 0 0 0 0 5 5 5 5 5
SOURCE: Household Survey, September 2008
TABLE 35
CONVENIENCE GOODS ALLOCATION - SPEND (£) 2008 PRICES
Catchment
Zone2010 2011 2016 2021 2026 2010 2011 2016 2021 2026 2010 2011 2016 2021 2026 2010 2011 2016 2021 2026
(£000) (£000) (£000) (£000) (£000) (£000) (£000) (£000) (£000) (£000) (£000) (£000) (£000) (£000) (£000) (£000) (£000) (£000) (£000) (£000)
1 0 0 0 0 0 0 0 0 0 0 0 0 0 0 0 0 0 0 0 0
2 0 0 0 0 0 1,100 1,112 1,170 1,214 1,270 0 0 0 0 0 1,100 1,112 1,170 1,214 1,270
3 0 0 0 0 0 0 0 0 0 0 0 0 0 0 0 0 0 0 0 0
4 0 0 0 0 0 0 0 0 0 0 0 0 0 0 0 0 0 0 0 0
5 0 0 0 0 0 0 0 0 0 0 590 590 610 635 599 590 590 610 635 599
6 232 232 232 232 232 581 582 598 610 598 0 0 0 0 0 813 814 837 854 837
7 1,515 1,515 1,515 1,515 1,515 360 359 369 373 348 0 0 0 0 0 1,874 1,870 1,924 1,946 1,814
8 0 0 0 0 0 0 0 0 0 0 0 0 0 0 0 0 0 0 0 0
9 0 0 0 0 0 0 0 0 0 0 0 0 0 0 0 0 0 0 0 0
10 6,420 6,420 6,420 6,420 6,420 2,072 2,066 2,105 2,292 2,260 1,924 1,918 1,955 2,128 2,099 10,417 10,384 10,582 11,520 11,361
11 1,842 1,842 1,842 1,842 1,842 0 0 0 0 0 0 0 0 0 0 1,842 1,944 2,710 2,864 2,989
12 0 0 0 0 0 0 0 0 0 0 0 0 0 0 0 0 0 0 0 0
13 0 0 0 0 0 0 0 0 0 0 0 0 0 0 0 0 0 0 0 0
14 0 0 0 0 0 0 0 0 0 0 0 0 0 0 0 0 0 0 0 0
15 9,271 9,271 9,271 9,271 9,271 1,622 1,664 1,868 1,996 2,089 0 0 0 0 0 10,892 11,175 12,548 13,408 14,034
16 8,418 8,418 8,418 8,418 8,418 0 0 0 0 0 0 0 0 0 0 8,418 8,620 9,593 10,243 10,774
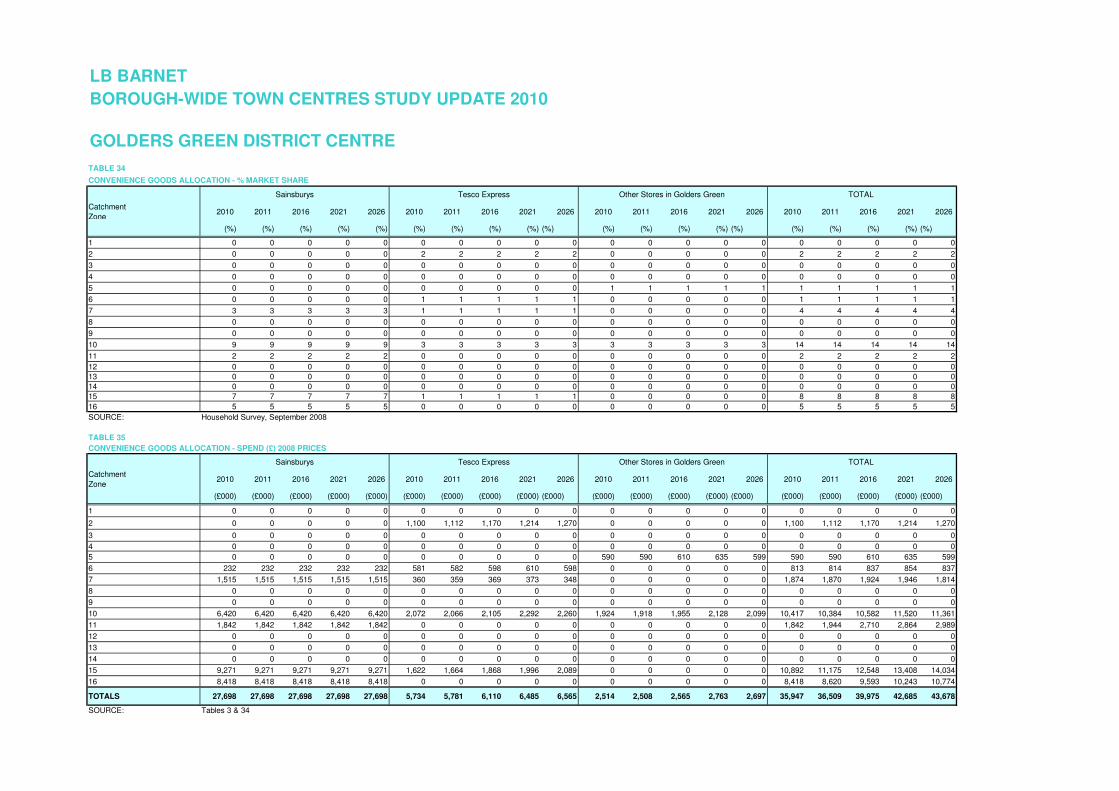
TOTALS 27,698 27,698 27,698 27,698 27,698 5,734 5,781 6,110 6,485 6,565 2,514 2,508 2,565 2,763 2,697 35,947 36,509 39,975 42,685 43,678
SOURCE: Tables 3 & 34
Tesco Express
LB BARNET
GOLDERS GREEN DISTRICT CENTRE
TOTAL
TOTAL
Other Stores in Golders Green
Sainsburys Tesco Express Other Stores in Golders Green
Sainsburys
BOROUGH-WIDE TOWN CENTRES STUDY UPDATE 2010
TABLE 36
CONVENIENCE GOODS ALLOCATION - % MARKET SHARE
Catchment
Zone2010 2011 2016 2021 2026
(%) (%) (%) (%) (%)
1 0 0 0 0 0
2 2 2 2 2 2
3 2 2 2 2 2
4 0 0 0 0 0
5 0 0 0 0 0
6 0 0 0 0 0
7 1 1 1 1 1
8 0 0 0 0 0
9 0 0 0 0 0
10 1 1 1 1 1
11 0 0 0 0 0
12 0 0 0 0 0
13 0 0 0 0 0
14 0 0 0 0 0
15 0 0 0 0 0
16 1 1 1 1 1
SOURCE: Household Survey, September 2008
TABLE 37
CONVENIENCE GOODS ALLOCATION - SPEND (£) 2008 PRICES
Catchment
Zone2010 2011 2016 2021 2026
(£000) (£000) (£000) (£000) (£000)
1 176 178 193 198 204
2 1,326 1,341 1,411 1,464 1,532
3 2,046 2,052 2,143 2,183 2,261
4 0 0 0 0 0
5 0 0 0 0 0
6 0 0 0 0 0
7 283 283 291 294 274
8 0 0 0 0 0
9 0 0 0 0 0
10 481 480 489 532 525
11 347 366 510 539 563
12 0 0 0 0 0
13 0 0 0 0 0
14 0 0 0 0 0
15 458 470 528 564 590
16 2,429 2,487 2,768 2,956 3,109
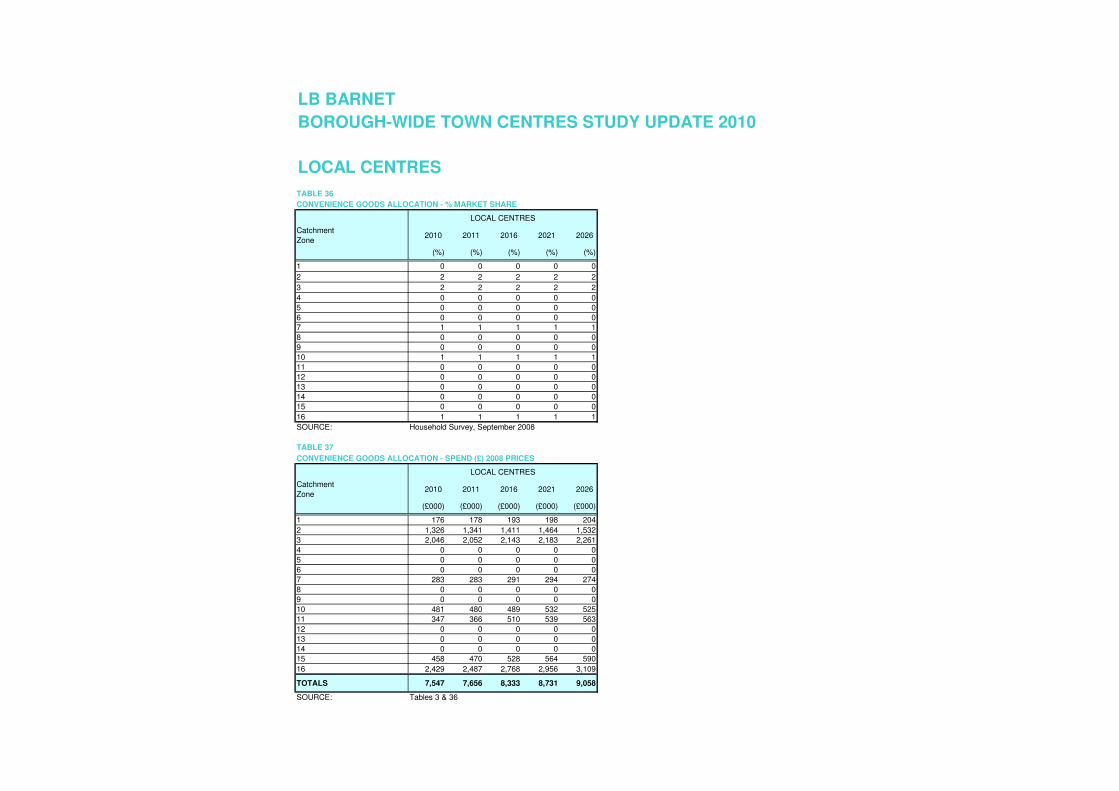
TOTALS 7,547 7,656 8,333 8,731 9,058
SOURCE: Tables 3 & 36
LB BARNET
LOCAL CENTRES
LOCAL CENTRES
LOCAL CENTRES
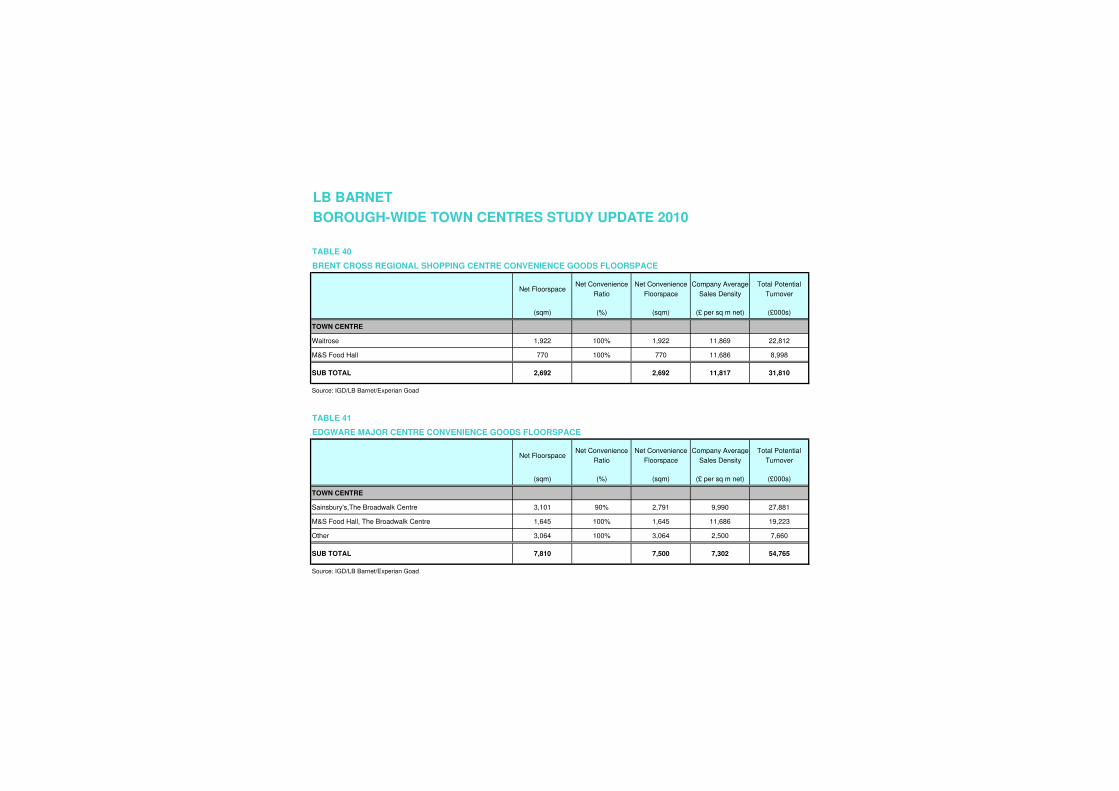
TABLE 40
BRENT CROSS REGIONAL SHOPPING CENTRE CONVENIENCE GOODS FLOORSPACE
Net FloorspaceNet Convenience
Ratio
Net Convenience
Floorspace
Company Average
Sales Density
Total Potential
Turnover
(sqm) (%) (sqm) (£ per sq m net) (£000s)
TOWN CENTRE
Waitrose 1,922 100% 1,922 11,869 22,812
M&S Food Hall 770 100% 770 11,686 8,998
SUB TOTAL 2,692 2,692 11,817 31,810
Source: IGD/LB Barnet/Experian Goad
TABLE 41
EDGWARE MAJOR CENTRE CONVENIENCE GOODS FLOORSPACE
Net FloorspaceNet Convenience
Ratio
Net Convenience
Floorspace
Company Average
Sales Density
Total Potential
Turnover
(sqm) (%) (sqm) (£ per sq m net) (£000s)
TOWN CENTRE
Sainsbury's,The Broadwalk Centre 3,101 90% 2,791 9,990 27,881
M&S Food Hall, The Broadwalk Centre 1,645 100% 1,645 11,686 19,223
Other 3,064 100% 3,064 2,500 7,660
SUB TOTAL 7,810 7,500 7,302 54,765
Source: IGD/LB Barnet/Experian Goad
LB BARNET
BOROUGH-WIDE TOWN CENTRES STUDY UPDATE 2010
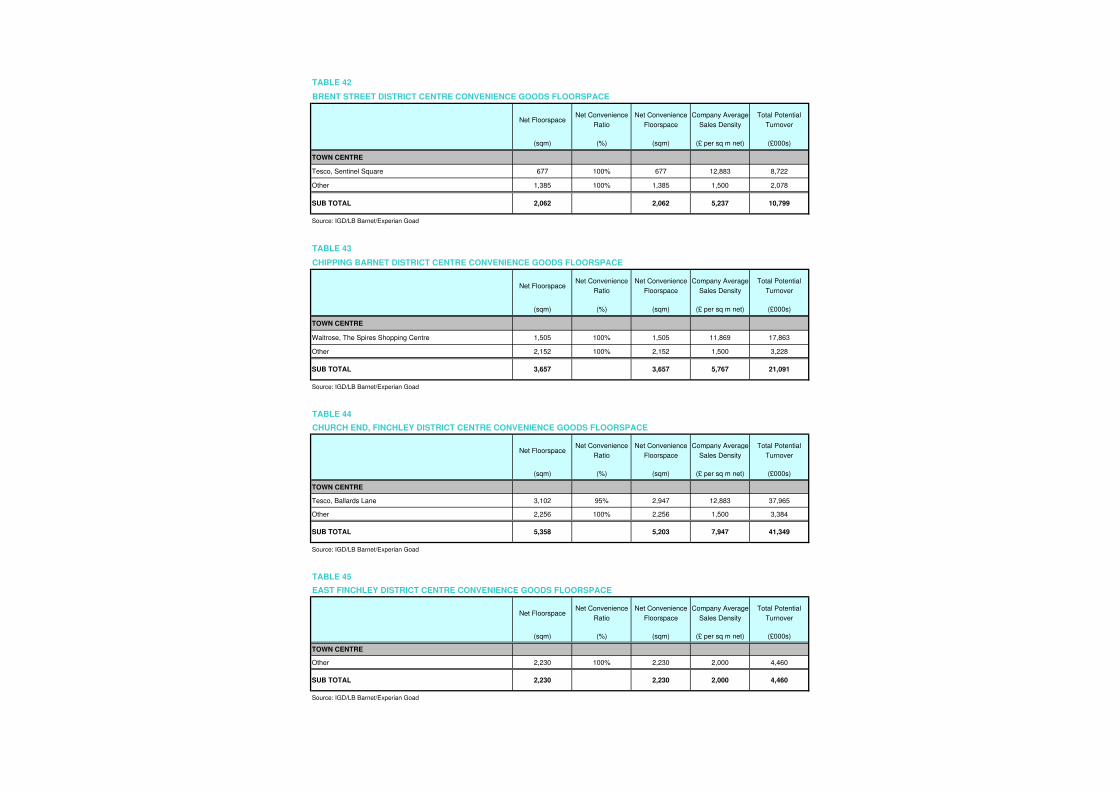
TABLE 42
BRENT STREET DISTRICT CENTRE CONVENIENCE GOODS FLOORSPACE
Net FloorspaceNet Convenience
Ratio
Net Convenience
Floorspace
Company Average
Sales Density
Total Potential
Turnover
(sqm) (%) (sqm) (£ per sq m net) (£000s)
TOWN CENTRE
Tesco, Sentinel Square 677 100% 677 12,883 8,722
Other 1,385 100% 1,385 1,500 2,078
SUB TOTAL 2,062 2,062 5,237 10,799
Source: IGD/LB Barnet/Experian Goad
TABLE 43
CHIPPING BARNET DISTRICT CENTRE CONVENIENCE GOODS FLOORSPACE
Net FloorspaceNet Convenience
Ratio
Net Convenience
Floorspace
Company Average
Sales Density
Total Potential
Turnover
(sqm) (%) (sqm) (£ per sq m net) (£000s)
TOWN CENTRE
Waitrose, The Spires Shopping Centre 1,505 100% 1,505 11,869 17,863
Other 2,152 100% 2,152 1,500 3,228
SUB TOTAL 3,657 3,657 5,767 21,091
Source: IGD/LB Barnet/Experian Goad
TABLE 44
CHURCH END, FINCHLEY DISTRICT CENTRE CONVENIENCE GOODS FLOORSPACE
Net FloorspaceNet Convenience
Ratio
Net Convenience
Floorspace
Company Average
Sales Density
Total Potential
Turnover
(sqm) (%) (sqm) (£ per sq m net) (£000s)
TOWN CENTRE
Tesco, Ballards Lane 3,102 95% 2,947 12,883 37,965
Other 2,256 100% 2,256 1,500 3,384
SUB TOTAL 5,358 5,203 7,947 41,349
Source: IGD/LB Barnet/Experian Goad
TABLE 45
EAST FINCHLEY DISTRICT CENTRE CONVENIENCE GOODS FLOORSPACE
Net FloorspaceNet Convenience
Ratio
Net Convenience
Floorspace
Company Average
Sales Density
Total Potential
Turnover
(sqm) (%) (sqm) (£ per sq m net) (£000s)
TOWN CENTRE
Other 2,230 100% 2,230 2,000 4,460
SUB TOTAL 2,230 2,230 2,000 4,460
Source: IGD/LB Barnet/Experian Goad
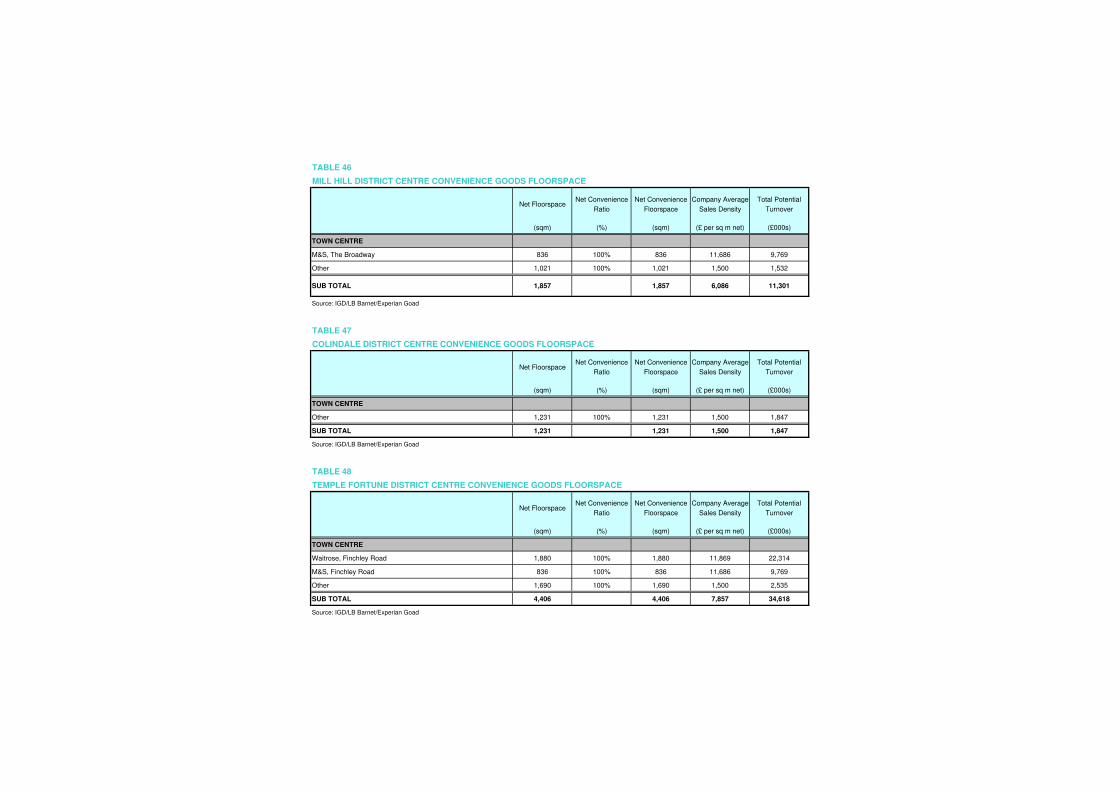
TABLE 46
MILL HILL DISTRICT CENTRE CONVENIENCE GOODS FLOORSPACE
Net FloorspaceNet Convenience
Ratio
Net Convenience
Floorspace
Company Average
Sales Density
Total Potential
Turnover
(sqm) (%) (sqm) (£ per sq m net) (£000s)
TOWN CENTRE
M&S, The Broadway 836 100% 836 11,686 9,769
Other 1,021 100% 1,021 1,500 1,532
SUB TOTAL 1,857 1,857 6,086 11,301
Source: IGD/LB Barnet/Experian Goad
TABLE 47
COLINDALE DISTRICT CENTRE CONVENIENCE GOODS FLOORSPACE
Net FloorspaceNet Convenience
Ratio
Net Convenience
Floorspace
Company Average
Sales Density
Total Potential
Turnover
(sqm) (%) (sqm) (£ per sq m net) (£000s)
TOWN CENTRE
Other 1,231 100% 1,231 1,500 1,847
SUB TOTAL 1,231 1,231 1,500 1,847
Source: IGD/LB Barnet/Experian Goad
TABLE 48
TEMPLE FORTUNE DISTRICT CENTRE CONVENIENCE GOODS FLOORSPACE
Net FloorspaceNet Convenience
Ratio
Net Convenience
Floorspace
Company Average
Sales Density
Total Potential
Turnover
(sqm) (%) (sqm) (£ per sq m net) (£000s)
TOWN CENTRE
Waitrose, Finchley Road 1,880 100% 1,880 11,869 22,314
M&S, Finchley Road 836 100% 836 11,686 9,769
Other 1,690 100% 1,690 1,500 2,535
SUB TOTAL 4,406 4,406 7,857 34,618
Source: IGD/LB Barnet/Experian Goad
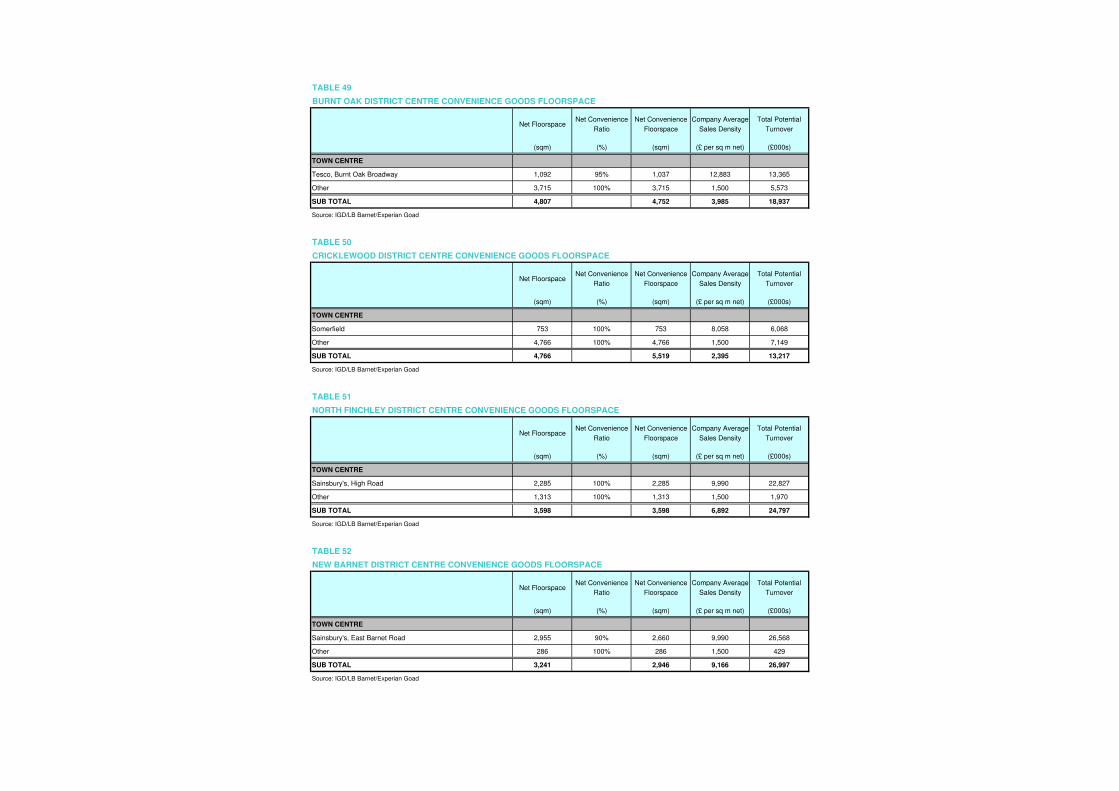
TABLE 49
BURNT OAK DISTRICT CENTRE CONVENIENCE GOODS FLOORSPACE
Net FloorspaceNet Convenience
Ratio
Net Convenience
Floorspace
Company Average
Sales Density
Total Potential
Turnover
(sqm) (%) (sqm) (£ per sq m net) (£000s)
TOWN CENTRE
Tesco, Burnt Oak Broadway 1,092 95% 1,037 12,883 13,365
Other 3,715 100% 3,715 1,500 5,573
SUB TOTAL 4,807 4,752 3,985 18,937
Source: IGD/LB Barnet/Experian Goad
TABLE 50
CRICKLEWOOD DISTRICT CENTRE CONVENIENCE GOODS FLOORSPACE
Net FloorspaceNet Convenience
Ratio
Net Convenience
Floorspace
Company Average
Sales Density
Total Potential
Turnover
(sqm) (%) (sqm) (£ per sq m net) (£000s)
TOWN CENTRE
Somerfield 753 100% 753 8,058 6,068
Other 4,766 100% 4,766 1,500 7,149
SUB TOTAL 4,766 5,519 2,395 13,217
Source: IGD/LB Barnet/Experian Goad
TABLE 51
NORTH FINCHLEY DISTRICT CENTRE CONVENIENCE GOODS FLOORSPACE
Net FloorspaceNet Convenience
Ratio
Net Convenience
Floorspace
Company Average
Sales Density
Total Potential
Turnover
(sqm) (%) (sqm) (£ per sq m net) (£000s)
TOWN CENTRE
Sainsbury's, High Road 2,285 100% 2,285 9,990 22,827
Other 1,313 100% 1,313 1,500 1,970
SUB TOTAL 3,598 3,598 6,892 24,797
Source: IGD/LB Barnet/Experian Goad
TABLE 52
NEW BARNET DISTRICT CENTRE CONVENIENCE GOODS FLOORSPACE
Net FloorspaceNet Convenience
Ratio
Net Convenience
Floorspace
Company Average
Sales Density
Total Potential
Turnover
(sqm) (%) (sqm) (£ per sq m net) (£000s)
TOWN CENTRE
Sainsbury's, East Barnet Road 2,955 90% 2,660 9,990 26,568
Other 286 100% 286 1,500 429
SUB TOTAL 3,241 2,946 9,166 26,997
Source: IGD/LB Barnet/Experian Goad
TABLE 53
WHETSTONE DISTRICT CENTRE CONVENIENCE GOODS FLOORSPACE
Net FloorspaceNet Convenience
Ratio
Net Convenience
Floorspace
Company Average
Sales Density
Total Potential
Turnover
(sqm) (%) (sqm) (£ per sq m net) (£000s)
TOWN CENTRE
Waitrose, High Road 1,496 100% 1,496 11,869 17,756
Other 644 100% 644 1,500 966
SUB TOTAL 2,140 2,140 8,749 18,722
Source: IGD/LB Barnet/Experian Goad
TABLE 54
HENDON CENTRAL DISTRICT CENTRE CONVENIENCE GOODS FLOORSPACE
Net FloorspaceNet Convenience
Ratio
Net Convenience
Floorspace
Company Average
Sales Density
Total Potential
Turnover
(sqm) (%) (sqm) (£ per sq m net) (£000s)
TOWN CENTRE
Other 1,768 100% 1,768 1,500 2,652
SUB TOTAL 1,768 1,768 1,500 2,652
Source: IGD/LB Barnet/Experian Goad
TABLE 55
GOLDERS GREEN DISTRICT CENTRE CONVENIENCE GOODS FLOORSPACE
Net FloorspaceNet Convenience
Ratio
Net Convenience
Floorspace
Company Average
Sales Density
Total Potential
Turnover
(sqm) (%) (sqm) (£ per sq m net) (£000s)
TOWN CENTRE
Sainsbury's, Finchley Road 1,260 100% 1,260 9,990 12,587
Tesco Express, Golders Green Road 262 100% 262 12,883 3,375
Other 1,580 100% 1,580 1,500 2,370
SUB TOTAL 3,102 3,102 5,910 18,333
Source: IGD/LB Barnet/Experian Goad
TABLE 56
LOCAL CENTRE CONVENIENCE GOODS FLOORSPACE
Net FloorspaceNet Convenience
Ratio
Net Convenience
Floorspace
Company Average
Sales Density
Total Potential
Turnover
(sqm) (%) (sqm) (£ per sq m net) (£000s)
Local Centres 1,274 100% 1,274 1,500 1,911
Source: IGD/LB Barnet/Experian Goad
TABLE 57
OUT OF CENTRE CONVENIENCE GOODS FLOORSPACE
Net FloorspaceNet Convenience
Ratio
Net Convenience
Floorspace
Company Average
Sales Density
Total Potential
Turnover
(sqm) (%) (sqm) (£ per sq m net) (£000s)
Lidl, Edgware Road, Cricklewood 741 100% 741
M&S, High Road, Whetstone 836 100% 836 11,686 9,769
Sainsbury's, Hyde Estate Road 3,506 90% 3,155 9,990 31,522
Tesco, Brent Cross Retail Park, Cricklewood 3,681 75% 2,761 12,883 35,567
Tesco, Colney Hatch/North Circular Road 4,212 71% 3,007 12,883 38,739
Tesco Express East Barnet Road 233 100% 233 12,883 3,002
Waitrose, Ballards Lane, North Finchley 2,516 100% 2,516 11,869 29,862
Waitrose, Mill Hill East 1,685 100% 1,685 11,869 19,999
SUB TOTAL 17,410 14,193 11,869 168,461
Source: IGD/LB Barnet/Experian Goad
TABLE 58
TOTAL CONVENIENCE GOODS FLOORSPACE
Net FloorspaceNet Convenience
Ratio
Net Convenience
Floorspace
Company Average
Sales Density
Total Potential
Turnover
(sqm) (%) (sqm) (£ per sq m net) (£000s)
North 7,967 7,672 7,933 60,859
West 20,896 20,181 6,857 138,371
East 20,054 18,694 8,448 157,929
South West 11,139 12,740 6,534 83,246
South East 9,570 9,570 6,661 63,750
TOTAL 69,626 68,856 7,322 504,156
Source: IGD/LB Barnet/Experian Goad
TABLE 59
RETAIL CONVENIENCE COMMITMENTS
Net Net Convenience Net Co Average Average Average Average Average Average
Floorspace Status Ratio Convenience Sales Turnover 2010 Turnover 2011 Turnover 2016 Turnover 2021 Turnover 2026
(sqm) (%) (sqm) (£ per sq m net) (£000s) (£000s) (£000s) (£000s) (£000s)
Extention to Tesco, Colney Hatch/North Circular Road 308 Completed 100% 308 3,000 924 929 952 976 1,001
Former Courts Unit, Staples Corner Retail Park, Edgware Road 402 Completed 100% 402 3,000 1,206 1,212 1,243 1,274 1,306
Grahame Park Estate, Lanacre Avenue 351 Not Started 100% 351 3,000 1,053 1,058 1,085 1,112 1,140
Unit 1C Brent Cross Shopping Centre 161 Completed 100% 161 3,000 482 484 496 509 521
NEW COMMITMENTS
West Hendon Estate, West Hendon 750 Not Started 100% 750 3,000 2,250 2,261 2,318 2,377 2,437
Land at the former RAF East Camp Site, Aerodrome
Road/Grahame Park Way, Hendon 400 Not Started 100% 400 3,000 1,199 1,204 1,235 1,266 1,298
204-206 Ballards Lane 408 Completed 100% 408 3,000 1,224 1,230 1,261 1,293 1,326
713 Finchley Road 370 Not Started 100% 370 3,000 1,110 1,116 1,144 1,173 1,202
Colindale Hospital, Colindale Avenue 45 Site cleared 100% 45 3,000 135 136 139 143 146
Land at Station House and part of Colindale Hospital, Colindale
Avenue390 Not Started 100% 390 3,000 1,170 1,176 1,206 1,236 1,267
1285 Finchley Road 329 Under Construction 100% 329 3,000 987 992 1,017 1,043 1,069
Tesco Express, Hale Lane, Edgware 494 Completed 100% 494 12,883 6,364 6,396 6,558 6,723 6,893
Tesco Express, 64-66 High Street, Barnet 208 Completed 100% 208 12,883 2,680 2,693 2,761 2,831 2,902
Sainsbury's Local, 146 High Street, Barnet 250 Completed 100% 250 9,990 2,494 2,506 2,569 2,634 2,701
Tesco Express, Beaufort Park, Unit 3, Block B 235 Completed 100% 235 12,883 3,031 3,047 3,123 3,202 3,283
Iceland, 43 The Broadway, Mill Hill 319 Completed 100% 319 6,244 1,989 1,999 2,049 2,101 2,154
Tesco Express, 7-11 Victoria Road, East Barnet 255 Completed 100% 255 12,883 3,283 3,299 3,382 3,468 3,555
TOTAL 5,673 5,673 31,579 31,737 32,538 33,360 34,202
Source: LB Barnet
LB BARNET
BOROUGH-WIDE TOWN CENTRES STUDY UPDATE 2010
LB BARNET
BOROUGH-WIDE TOWN CENTRES STUDY UPDATE 2010
TABLE 60
RETAIL PIPELINE - CONVENIENCE GOODSNet Net Convenience Net Co Average Total Total Total Total Total
Floorspace Ratio Convenience Sales Turnover 2010 Turnover 2011 Turnover 2016 Turnover 2021 Turnover 2026
(sqm) (%) (sqm) (£ per sqm net) (£000s) (£000s) (£000s) (£000s) (£000s)
Brent Cross, Tesco Extra plus unit shops (Replacement Flsp
Only)7,380 70% 5,166 12,883 66,554 66,887 68,576 70,308 72,083
Mill Hill AAP 1,000 100% 1,000 2,500 2,500 2,513 2,576 2,641 2,708
Colindale AAP 1,114 100% 1,114 2,500 2,786 2,800 2,871 2,943 3,017
NEW PIPELINE DEVELOPMENTS
Tesco Express, 7-9 Greenhill Parade, Great North Road, 370 100% 370 12,883 4,767 4,791 4,912 5,036 5,163
TOTAL 9,864 7,650 76,607 76,990 78,934 80,927 82,971
Source: LB Barnet
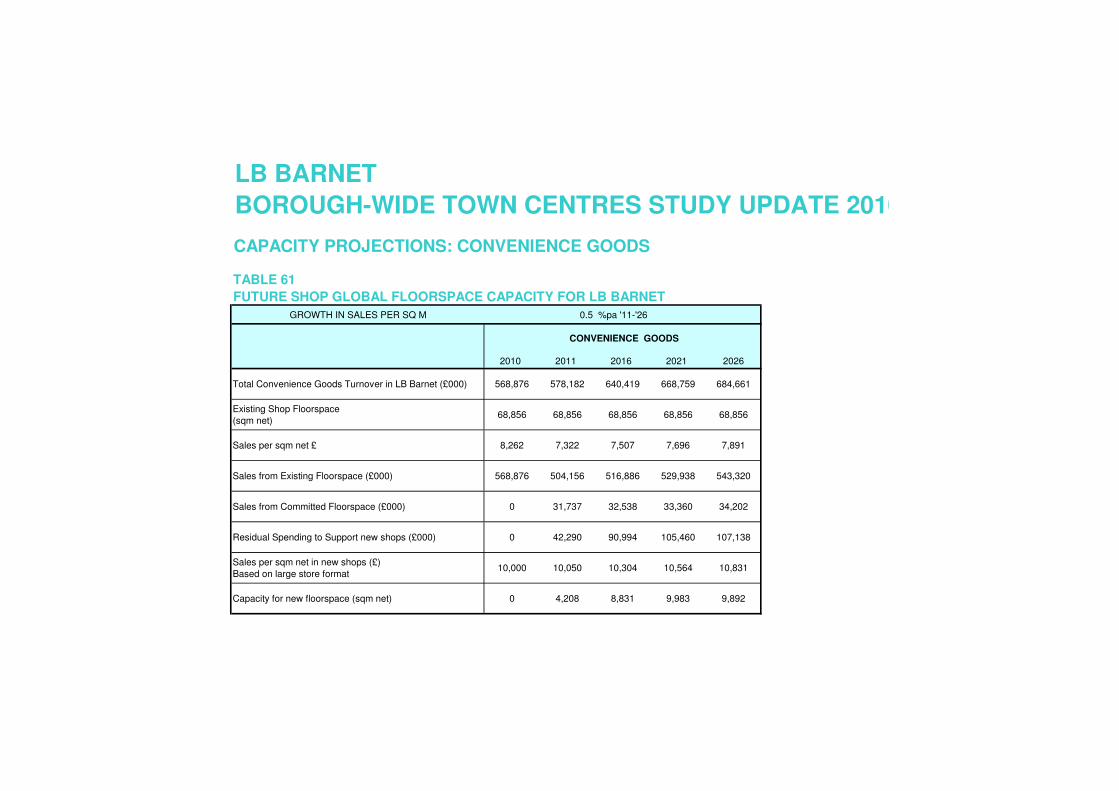
LB BARNET
BOROUGH-WIDE TOWN CENTRES STUDY UPDATE 2010
CAPACITY PROJECTIONS: CONVENIENCE GOODS
TABLE 61
FUTURE SHOP GLOBAL FLOORSPACE CAPACITY FOR LB BARNET
GROWTH IN SALES PER SQ M 0.5 %pa '11-'26
2010 2011 2016 2021 2026
Total Convenience Goods Turnover in LB Barnet (£000) 568,876 578,182 640,419 668,759 684,661
Existing Shop Floorspace
(sqm net) 68,856 68,856 68,856 68,856 68,856
Sales per sqm net £ 8,262 7,322 7,507 7,696 7,891
Sales from Existing Floorspace (£000) 568,876 504,156 516,886 529,938 543,320
Sales from Committed Floorspace (£000) 0 31,737 32,538 33,360 34,202
Residual Spending to Support new shops (£000) 0 42,290 90,994 105,460 107,138
Sales per sqm net in new shops (£)
Based on large store format10,000 10,050 10,304 10,564 10,831
Capacity for new floorspace (sqm net) 0 4,208 8,831 9,983 9,892
CONVENIENCE GOODS
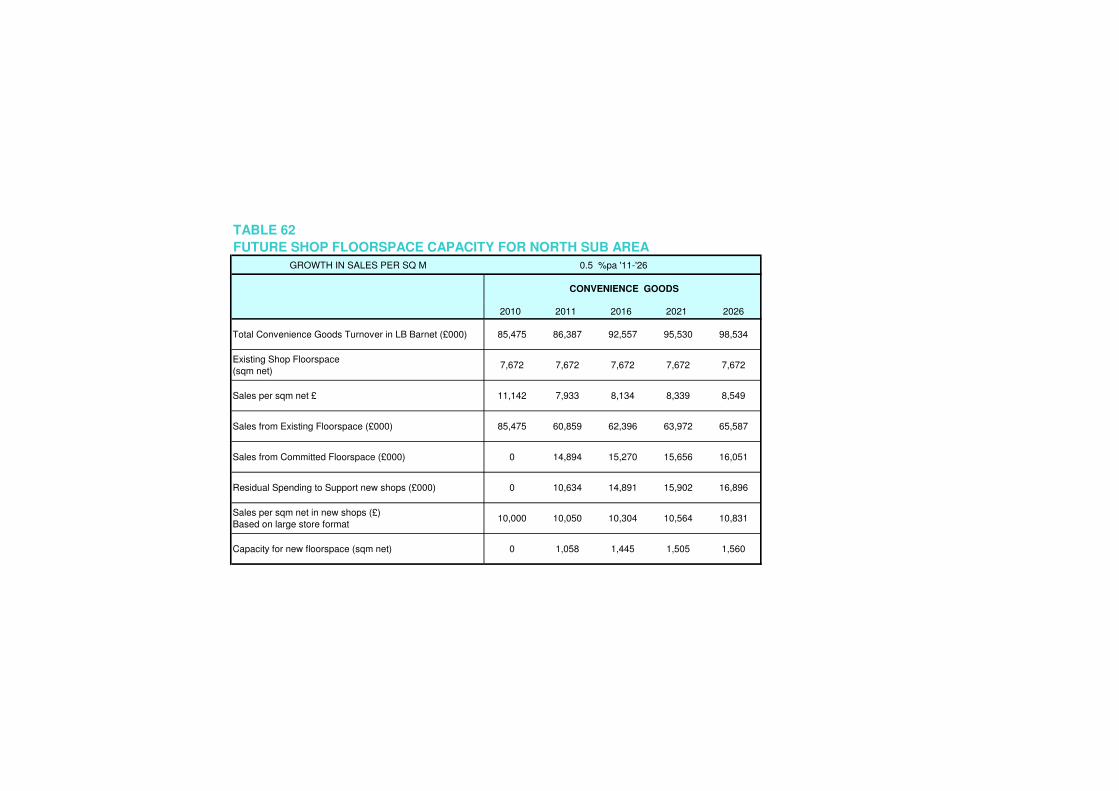
TABLE 62
FUTURE SHOP FLOORSPACE CAPACITY FOR NORTH SUB AREA
GROWTH IN SALES PER SQ M 0.5 %pa '11-'26
2010 2011 2016 2021 2026
Total Convenience Goods Turnover in LB Barnet (£000) 85,475 86,387 92,557 95,530 98,534
Existing Shop Floorspace
(sqm net) 7,672 7,672 7,672 7,672 7,672
Sales per sqm net £ 11,142 7,933 8,134 8,339 8,549
Sales from Existing Floorspace (£000) 85,475 60,859 62,396 63,972 65,587
Sales from Committed Floorspace (£000) 0 14,894 15,270 15,656 16,051
Residual Spending to Support new shops (£000) 0 10,634 14,891 15,902 16,896
Sales per sqm net in new shops (£)
Based on large store format10,000 10,050 10,304 10,564 10,831
Capacity for new floorspace (sqm net) 0 1,058 1,445 1,505 1,560
CONVENIENCE GOODS
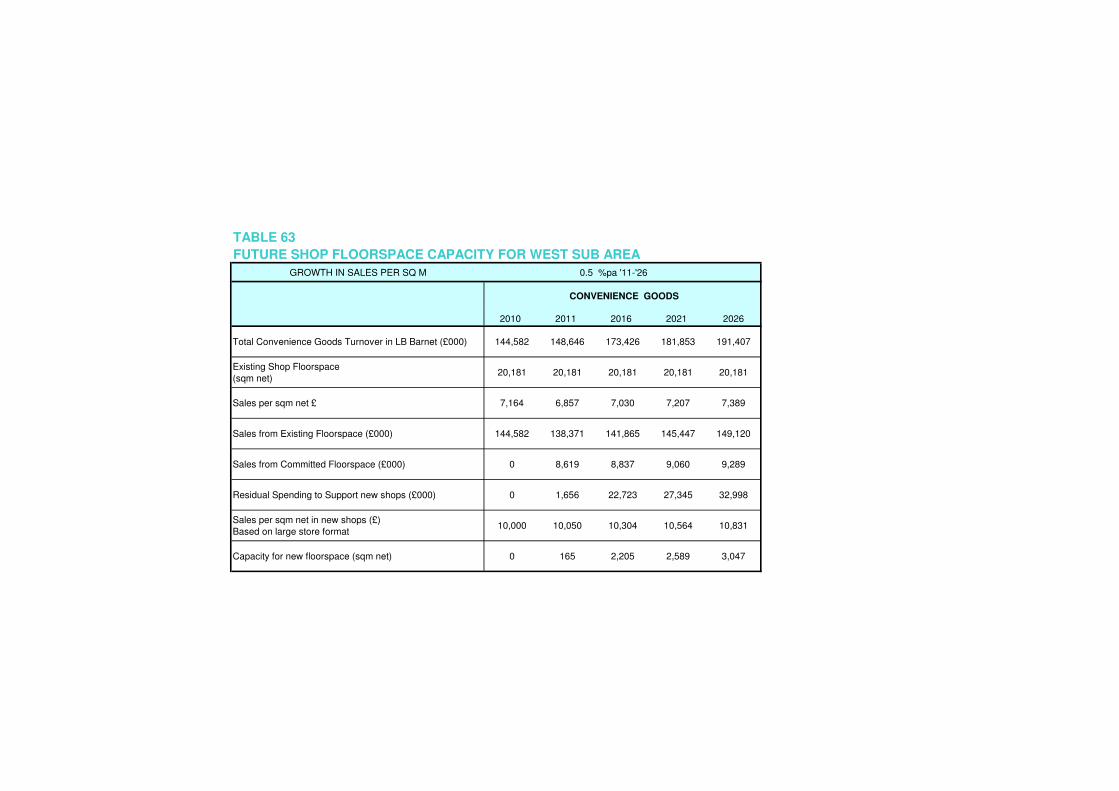
TABLE 63
FUTURE SHOP FLOORSPACE CAPACITY FOR WEST SUB AREA
GROWTH IN SALES PER SQ M 0.5 %pa '11-'26
2010 2011 2016 2021 2026
Total Convenience Goods Turnover in LB Barnet (£000) 144,582 148,646 173,426 181,853 191,407
Existing Shop Floorspace
(sqm net) 20,181 20,181 20,181 20,181 20,181
Sales per sqm net £ 7,164 6,857 7,030 7,207 7,389
Sales from Existing Floorspace (£000) 144,582 138,371 141,865 145,447 149,120
Sales from Committed Floorspace (£000) 0 8,619 8,837 9,060 9,289
Residual Spending to Support new shops (£000) 0 1,656 22,723 27,345 32,998
Sales per sqm net in new shops (£)
Based on large store format10,000 10,050 10,304 10,564 10,831
Capacity for new floorspace (sqm net) 0 165 2,205 2,589 3,047
CONVENIENCE GOODS

TABLE 64
FUTURE SHOP FLOORSPACE CAPACITY FOR EAST SUB AREA
GROWTH IN SALES PER SQ M 0.5 %pa '11-'26
2010 2011 2016 2021 2026
Total Convenience Goods Turnover in LB Barnet (£000) 216,102 218,199 234,357 242,805 243,713
Existing Shop Floorspace
(sqm net) 18,694 18,694 18,694 18,694 18,694
Sales per sqm net £ 11,560 8,448 8,661 8,880 9,104
Sales from Existing Floorspace (£000) 216,102 157,929 161,917 166,006 170,198
Sales from Committed Floorspace (£000) 0 2,159 2,213 2,269 2,326
Residual Spending to Support new shops (£000) 0 58,111 70,227 74,530 71,189
Sales per sqm net in new shops (£)
Based on large store format10,000 10,050 10,304 10,564 10,831
Capacity for new floorspace (sqm net) 0 5,782 6,816 7,055 6,573
CONVENIENCE GOODS
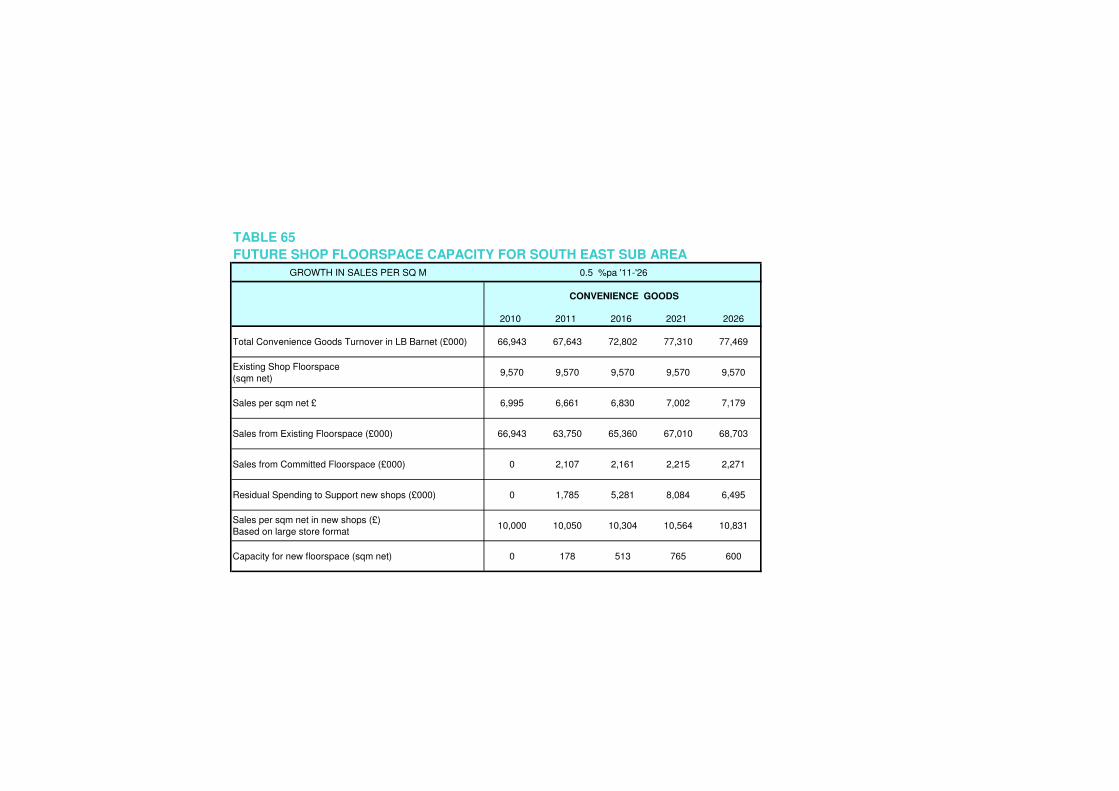
TABLE 65
FUTURE SHOP FLOORSPACE CAPACITY FOR SOUTH EAST SUB AREA
GROWTH IN SALES PER SQ M 0.5 %pa '11-'26
2010 2011 2016 2021 2026
Total Convenience Goods Turnover in LB Barnet (£000) 66,943 67,643 72,802 77,310 77,469
Existing Shop Floorspace
(sqm net) 9,570 9,570 9,570 9,570 9,570
Sales per sqm net £ 6,995 6,661 6,830 7,002 7,179
Sales from Existing Floorspace (£000) 66,943 63,750 65,360 67,010 68,703
Sales from Committed Floorspace (£000) 0 2,107 2,161 2,215 2,271
Residual Spending to Support new shops (£000) 0 1,785 5,281 8,084 6,495
Sales per sqm net in new shops (£)
Based on large store format10,000 10,050 10,304 10,564 10,831
Capacity for new floorspace (sqm net) 0 178 513 765 600
CONVENIENCE GOODS

TABLE 66
FUTURE SHOP FLOORSPACE CAPACITY FOR SOUTH WEST SUB AREA
GROWTH IN SALES PER SQ M 0.5 %pa '11-'26
2010 2011 2016 2021 2026
Total Convenience Goods Turnover in LB Barnet (£000) 55,773 57,307 67,277 71,261 73,537
Existing Shop Floorspace
(sqm net) 12,740 12,740 12,740 12,740 12,740
Sales per sqm net £ 4,378 6,534 6,699 6,869 7,042
Sales from Existing Floorspace (£000) 55,773 83,246 85,348 87,503 89,713
Sales from Committed Floorspace (£000) 0 3,957 4,057 4,160 4,265
Residual Spending to Support new shops (£000) 0 -29,896 -22,128 -20,402 -20,440
Sales per sqm net in new shops (£)
Based on large store format10,000 10,050 10,304 10,564 10,831
Capacity for new floorspace (sqm net) 0 -2,975 -2,148 -1,931 -1,887
CONVENIENCE GOODS
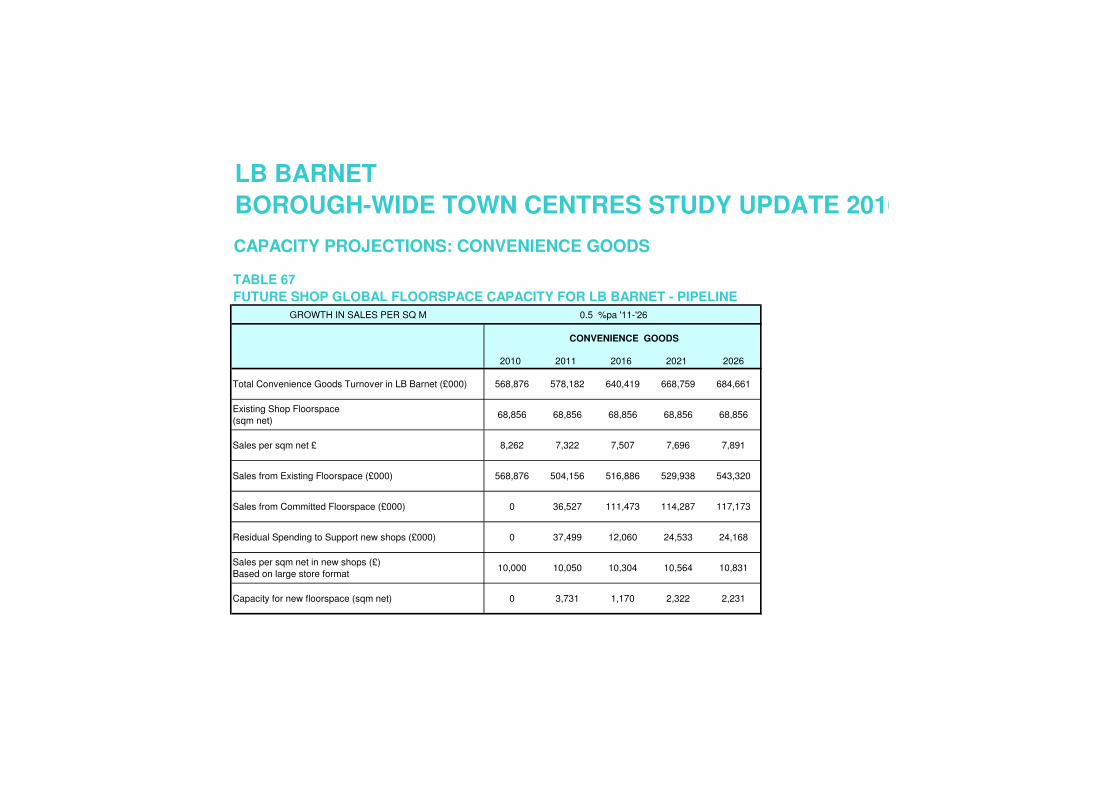
LB BARNET
BOROUGH-WIDE TOWN CENTRES STUDY UPDATE 2010
CAPACITY PROJECTIONS: CONVENIENCE GOODS
TABLE 67
FUTURE SHOP GLOBAL FLOORSPACE CAPACITY FOR LB BARNET - PIPELINE
GROWTH IN SALES PER SQ M 0.5 %pa '11-'26
2010 2011 2016 2021 2026
Total Convenience Goods Turnover in LB Barnet (£000) 568,876 578,182 640,419 668,759 684,661
Existing Shop Floorspace
(sqm net) 68,856 68,856 68,856 68,856 68,856
Sales per sqm net £ 8,262 7,322 7,507 7,696 7,891
Sales from Existing Floorspace (£000) 568,876 504,156 516,886 529,938 543,320
Sales from Committed Floorspace (£000) 0 36,527 111,473 114,287 117,173
Residual Spending to Support new shops (£000) 0 37,499 12,060 24,533 24,168
Sales per sqm net in new shops (£)
Based on large store format10,000 10,050 10,304 10,564 10,831
Capacity for new floorspace (sqm net) 0 3,731 1,170 2,322 2,231
CONVENIENCE GOODS

TABLE 68
FUTURE SHOP FLOORSPACE CAPACITY FOR NORTH SUB AREA - PIPELINE
GROWTH IN SALES PER SQ M 0.5 %pa '11-'26
2010 2011 2016 2021 2026
Total Convenience Goods Turnover in LB Barnet (£000) 85,475 86,387 92,557 95,530 98,534
Existing Shop Floorspace
(sqm net) 7,672 7,672 7,672 7,672 7,672
Sales per sqm net £ 11,142 7,933 8,134 8,339 8,549
Sales from Existing Floorspace (£000) 85,475 60,859 62,396 63,972 65,587
Sales from Committed Floorspace (£000) 0 19,685 20,182 20,691 21,214
Residual Spending to Support new shops (£000) 0 5,843 9,979 10,867 11,733
Sales per sqm net in new shops (£)
Based on large store format10,000 10,050 10,304 10,564 10,831
Capacity for new floorspace (sqm net) 0 581 969 1,029 1,083
CONVENIENCE GOODS
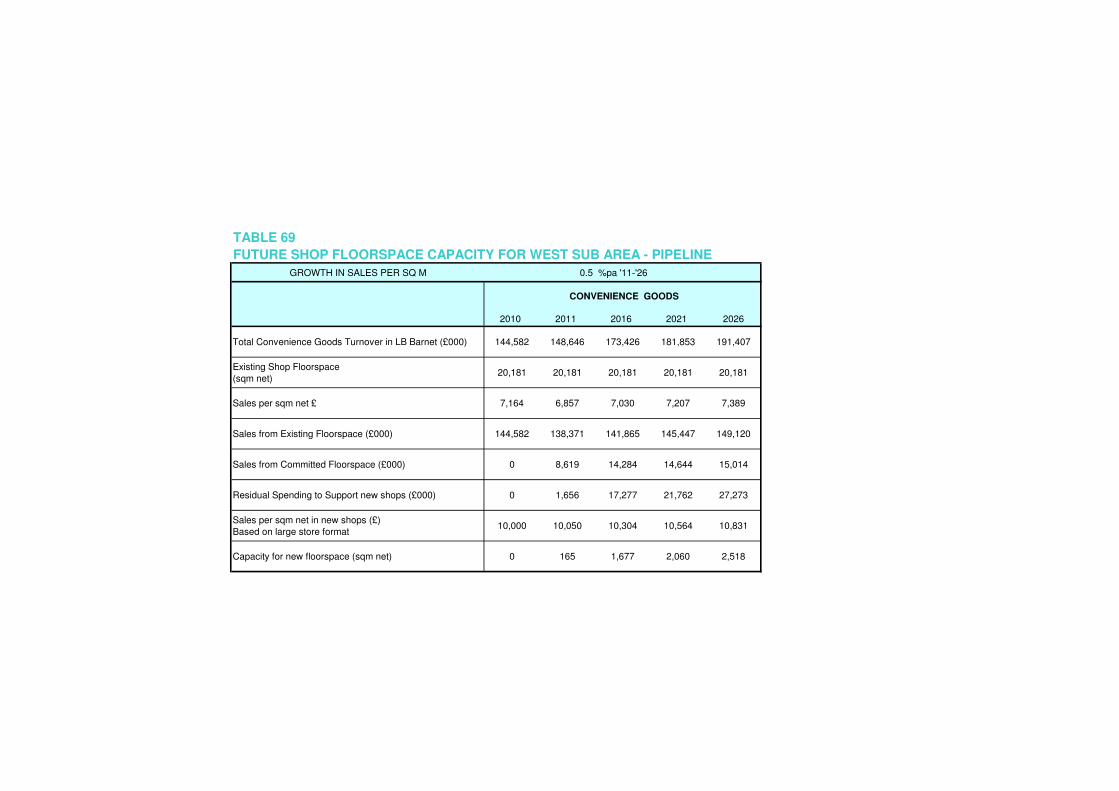
TABLE 69
FUTURE SHOP FLOORSPACE CAPACITY FOR WEST SUB AREA - PIPELINE
GROWTH IN SALES PER SQ M 0.5 %pa '11-'26
2010 2011 2016 2021 2026
Total Convenience Goods Turnover in LB Barnet (£000) 144,582 148,646 173,426 181,853 191,407
Existing Shop Floorspace
(sqm net) 20,181 20,181 20,181 20,181 20,181
Sales per sqm net £ 7,164 6,857 7,030 7,207 7,389
Sales from Existing Floorspace (£000) 144,582 138,371 141,865 145,447 149,120
Sales from Committed Floorspace (£000) 0 8,619 14,284 14,644 15,014
Residual Spending to Support new shops (£000) 0 1,656 17,277 21,762 27,273
Sales per sqm net in new shops (£)
Based on large store format10,000 10,050 10,304 10,564 10,831
Capacity for new floorspace (sqm net) 0 165 1,677 2,060 2,518
CONVENIENCE GOODS
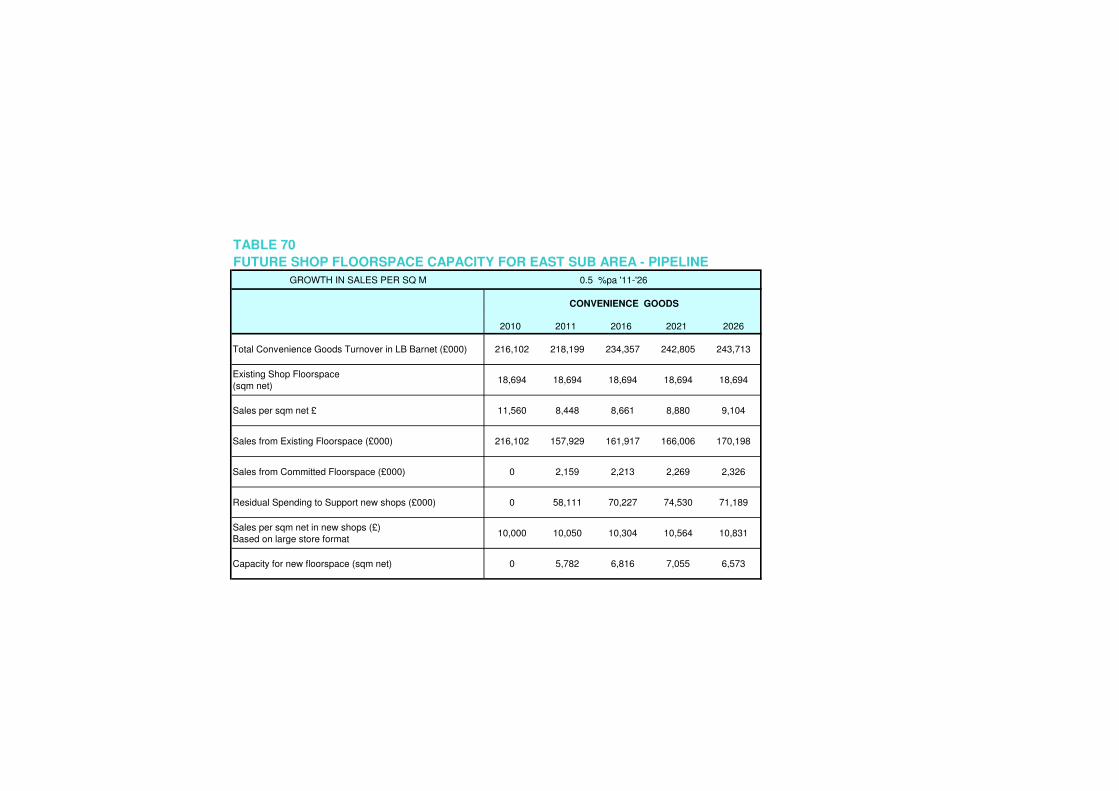
TABLE 70
FUTURE SHOP FLOORSPACE CAPACITY FOR EAST SUB AREA - PIPELINE
GROWTH IN SALES PER SQ M 0.5 %pa '11-'26
2010 2011 2016 2021 2026
Total Convenience Goods Turnover in LB Barnet (£000) 216,102 218,199 234,357 242,805 243,713
Existing Shop Floorspace
(sqm net) 18,694 18,694 18,694 18,694 18,694
Sales per sqm net £ 11,560 8,448 8,661 8,880 9,104
Sales from Existing Floorspace (£000) 216,102 157,929 161,917 166,006 170,198
Sales from Committed Floorspace (£000) 0 2,159 2,213 2,269 2,326
Residual Spending to Support new shops (£000) 0 58,111 70,227 74,530 71,189
Sales per sqm net in new shops (£)
Based on large store format10,000 10,050 10,304 10,564 10,831
Capacity for new floorspace (sqm net) 0 5,782 6,816 7,055 6,573
CONVENIENCE GOODS
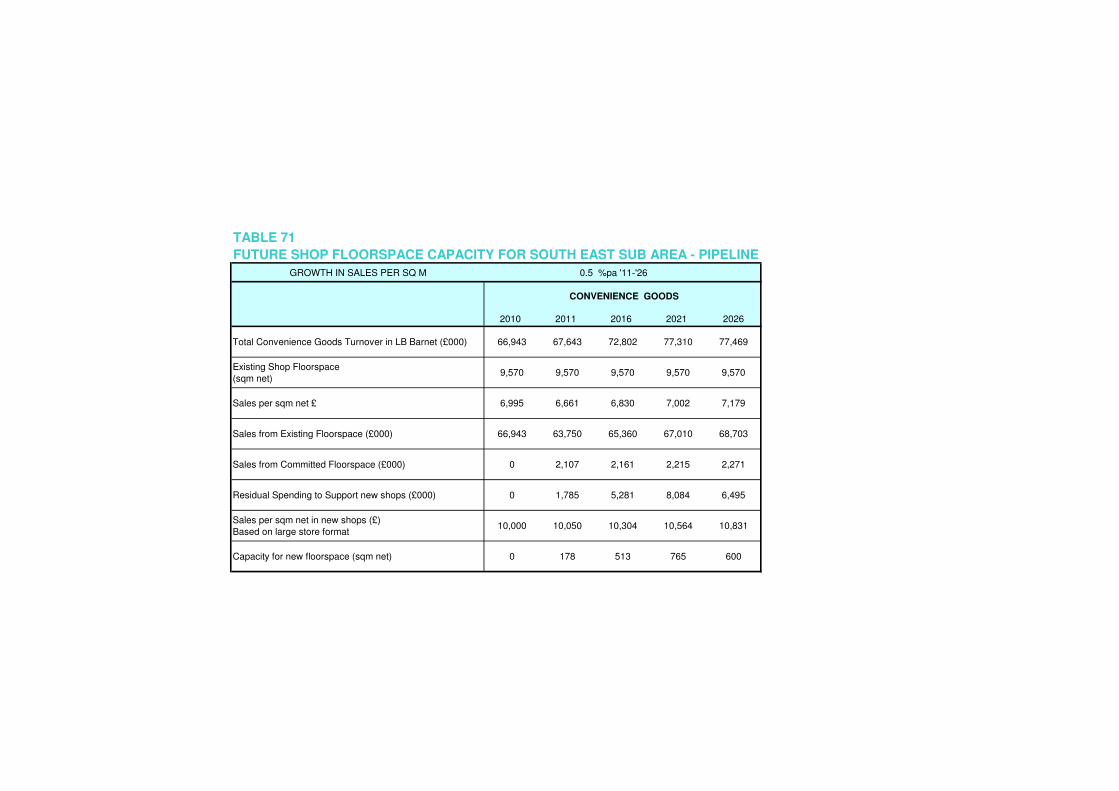
TABLE 71
FUTURE SHOP FLOORSPACE CAPACITY FOR SOUTH EAST SUB AREA - PIPELINE
GROWTH IN SALES PER SQ M 0.5 %pa '11-'26
2010 2011 2016 2021 2026
Total Convenience Goods Turnover in LB Barnet (£000) 66,943 67,643 72,802 77,310 77,469
Existing Shop Floorspace
(sqm net) 9,570 9,570 9,570 9,570 9,570
Sales per sqm net £ 6,995 6,661 6,830 7,002 7,179
Sales from Existing Floorspace (£000) 66,943 63,750 65,360 67,010 68,703
Sales from Committed Floorspace (£000) 0 2,107 2,161 2,215 2,271
Residual Spending to Support new shops (£000) 0 1,785 5,281 8,084 6,495
Sales per sqm net in new shops (£)
Based on large store format10,000 10,050 10,304 10,564 10,831
Capacity for new floorspace (sqm net) 0 178 513 765 600
CONVENIENCE GOODS

TABLE 72
FUTURE SHOP FLOORSPACE CAPACITY FOR SOUTH WEST SUB AREA - PIPELINE
GROWTH IN SALES PER SQ M 0.5 %pa '11-'26
2010 2011 2016 2021 2026
Total Convenience Goods Turnover in LB Barnet (£000) 55,773 57,307 67,277 71,261 73,537
Existing Shop Floorspace
(sqm net) 12,740 12,740 12,740 12,740 12,740
Sales per sqm net £ 4,378 6,534 6,699 6,869 7,042
Sales from Existing Floorspace (£000) 55,773 83,246 85,348 87,503 89,713
Sales from Committed Floorspace (£000) 0 3,957 72,633 74,467 76,348
Residual Spending to Support new shops (£000) 0 -29,896 -90,704 -90,710 -92,523
Sales per sqm net in new shops (£)
Based on large store format10,000 10,050 10,304 10,564 10,831
Capacity for new floorspace (sqm net) 0 -2,975 -8,803 -8,587 -8,543
CONVENIENCE GOODS
APPENDIX 2
CAPACITY PROJECTIONS: COMPARISON GOODS
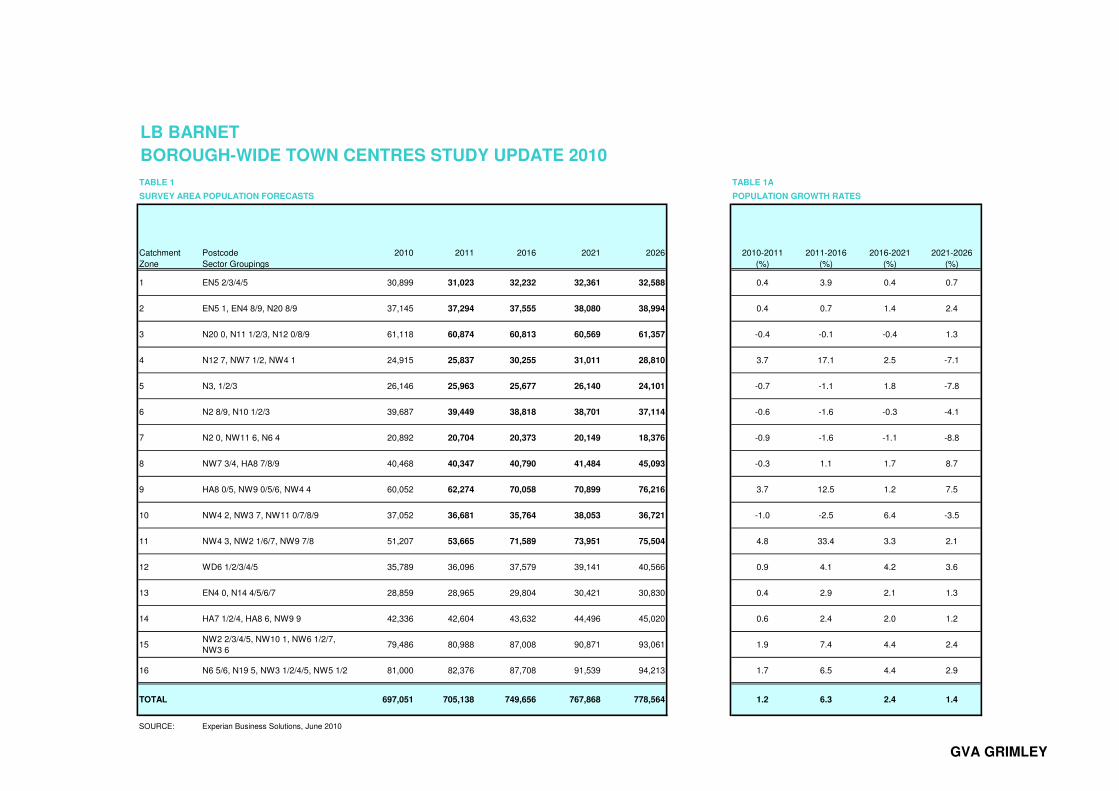
BOROUGH-WIDE TOWN CENTRES STUDY UPDATE 2010
TABLE 1 TABLE 1A
SURVEY AREA POPULATION FORECASTS POPULATION GROWTH RATES
Catchment Postcode 2010 2011 2016 2021 2026 2010-2011 2011-2016 2016-2021 2021-2026
Zone Sector Groupings (%) (%) (%) (%)
1 EN5 2/3/4/5 30,899 31,023 32,232 32,361 32,588 0.4 3.9 0.4 0.7
2 EN5 1, EN4 8/9, N20 8/9 37,145 37,294 37,555 38,080 38,994 0.4 0.7 1.4 2.4
3 N20 0, N11 1/2/3, N12 0/8/9 61,118 60,874 60,813 60,569 61,357 -0.4 -0.1 -0.4 1.3
4 N12 7, NW7 1/2, NW4 1 24,915 25,837 30,255 31,011 28,810 3.7 17.1 2.5 -7.1
5 N3, 1/2/3 26,146 25,963 25,677 26,140 24,101 -0.7 -1.1 1.8 -7.8
6 N2 8/9, N10 1/2/3 39,687 39,449 38,818 38,701 37,114 -0.6 -1.6 -0.3 -4.1
7 N2 0, NW11 6, N6 4 20,892 20,704 20,373 20,149 18,376 -0.9 -1.6 -1.1 -8.8
8 NW7 3/4, HA8 7/8/9 40,468 40,347 40,790 41,484 45,093 -0.3 1.1 1.7 8.7
9 HA8 0/5, NW9 0/5/6, NW4 4 60,052 62,274 70,058 70,899 76,216 3.7 12.5 1.2 7.5
10 NW4 2, NW3 7, NW11 0/7/8/9 37,052 36,681 35,764 38,053 36,721 -1.0 -2.5 6.4 -3.5
11 NW4 3, NW2 1/6/7, NW9 7/8 51,207 53,665 71,589 73,951 75,504 4.8 33.4 3.3 2.1
12 WD6 1/2/3/4/5 35,789 36,096 37,579 39,141 40,566 0.9 4.1 4.2 3.6
13 EN4 0, N14 4/5/6/7 28,859 28,965 29,804 30,421 30,830 0.4 2.9 2.1 1.3
14 HA7 1/2/4, HA8 6, NW9 9 42,336 42,604 43,632 44,496 45,020 0.6 2.4 2.0 1.2
15NW2 2/3/4/5, NW10 1, NW6 1/2/7,
NW3 679,486 80,988 87,008 90,871 93,061 1.9 7.4 4.4 2.4
16 N6 5/6, N19 5, NW3 1/2/4/5, NW5 1/2 81,000 82,376 87,708 91,539 94,213 1.7 6.5 4.4 2.9
TOTAL 697,051 705,138 749,656 767,868 778,564 1.2 6.3 2.4 1.4
SOURCE: Experian Business Solutions, June 2010
LB BARNET
GVA GRIMLEY
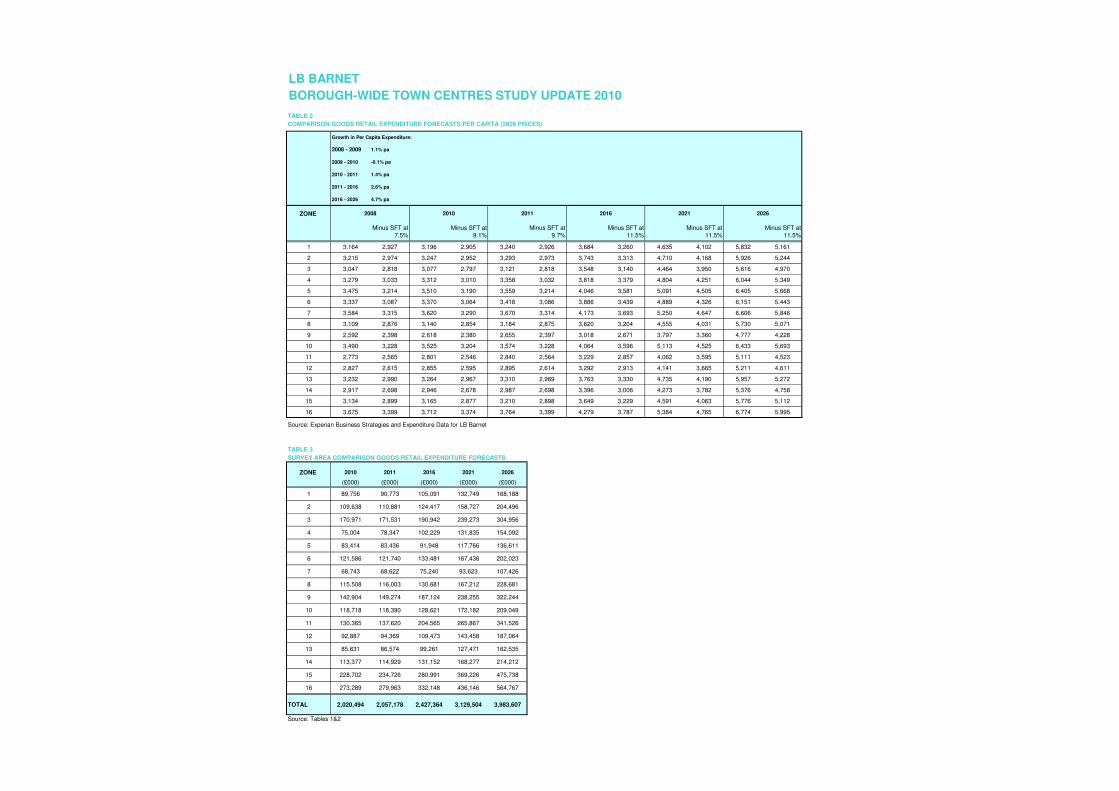
LB BARNET
BOROUGH-WIDE TOWN CENTRES STUDY UPDATE 2010
TABLE 2
COMPARISON GOODS RETAIL EXPENDITURE FORECASTS PER CAPITA (2008 PRICES)
Growth in Per Capita Expenditure:
2008 - 2009 1.1% pa
2009 - 2010 -0.1% pa
2010 - 2011 1.4% pa
2011 - 2016 2.6% pa
2016 - 2026 4.7% pa
ZONE
Minus SFT at
7.5%
Minus SFT at
9.1%
Minus SFT at
9.7%
Minus SFT at
11.5%
Minus SFT at
11.5%
Minus SFT at
11.5%
1 3,164 2,927 3,196 2,905 3,240 2,926 3,684 3,260 4,635 4,102 5,832 5,161
2 3,215 2,974 3,247 2,952 3,293 2,973 3,743 3,313 4,710 4,168 5,926 5,244
3 3,047 2,818 3,077 2,797 3,121 2,818 3,548 3,140 4,464 3,950 5,616 4,970
4 3,279 3,033 3,312 3,010 3,358 3,032 3,818 3,379 4,804 4,251 6,044 5,349
5 3,475 3,214 3,510 3,190 3,559 3,214 4,046 3,581 5,091 4,505 6,405 5,668
6 3,337 3,087 3,370 3,064 3,418 3,086 3,886 3,439 4,889 4,326 6,151 5,443
7 3,584 3,315 3,620 3,290 3,670 3,314 4,173 3,693 5,250 4,647 6,606 5,846
8 3,109 2,876 3,140 2,854 3,184 2,875 3,620 3,204 4,555 4,031 5,730 5,071
9 2,592 2,398 2,618 2,380 2,655 2,397 3,018 2,671 3,797 3,360 4,777 4,228
10 3,490 3,228 3,525 3,204 3,574 3,228 4,064 3,596 5,113 4,525 6,433 5,693
11 2,773 2,565 2,801 2,546 2,840 2,564 3,229 2,857 4,062 3,595 5,111 4,523
12 2,827 2,615 2,855 2,595 2,895 2,614 3,292 2,913 4,141 3,665 5,211 4,611
13 3,232 2,990 3,264 2,967 3,310 2,989 3,763 3,330 4,735 4,190 5,957 5,272
14 2,917 2,698 2,946 2,678 2,987 2,698 3,396 3,006 4,273 3,782 5,376 4,758
15 3,134 2,899 3,165 2,877 3,210 2,898 3,649 3,229 4,591 4,063 5,776 5,112
16 3,675 3,399 3,712 3,374 3,764 3,399 4,279 3,787 5,384 4,765 6,774 5,995
Source: Experian Business Strategies and Expenditure Data for LB Barnet
TABLE 3
SURVEY AREA COMPARISON GOODS RETAIL EXPENDITURE FORECASTS
ZONE 2010 2011 2016 2021 2026
(£000) (£000) (£000) (£000) (£000)
1 89,756 90,773 105,091 132,749 168,188
2 109,638 110,881 124,417 158,727 204,496
3 170,971 171,531 190,942 239,273 304,956
4 75,004 78,347 102,229 131,835 154,092
5 83,414 83,436 91,948 117,766 136,611
6 121,586 121,740 133,481 167,436 202,023
7 68,743 68,622 75,240 93,623 107,426
8 115,508 116,003 130,681 167,212 228,681
9 142,904 149,274 187,124 238,255 322,244
10 118,718 118,390 128,621 172,182 209,049
11 130,365 137,620 204,565 265,867 341,526
12 92,887 94,369 109,473 143,458 187,064
13 85,631 86,574 99,261 127,471 162,535
14 113,377 114,929 131,152 168,277 214,212
15 228,702 234,726 280,991 369,226 475,738
16 273,289 279,963 332,148 436,146 564,767
TOTAL 2,020,494 2,057,178 2,427,364 3,129,504 3,983,607
Source: Tables 1&2
2021 20262008 2010 2011 2016
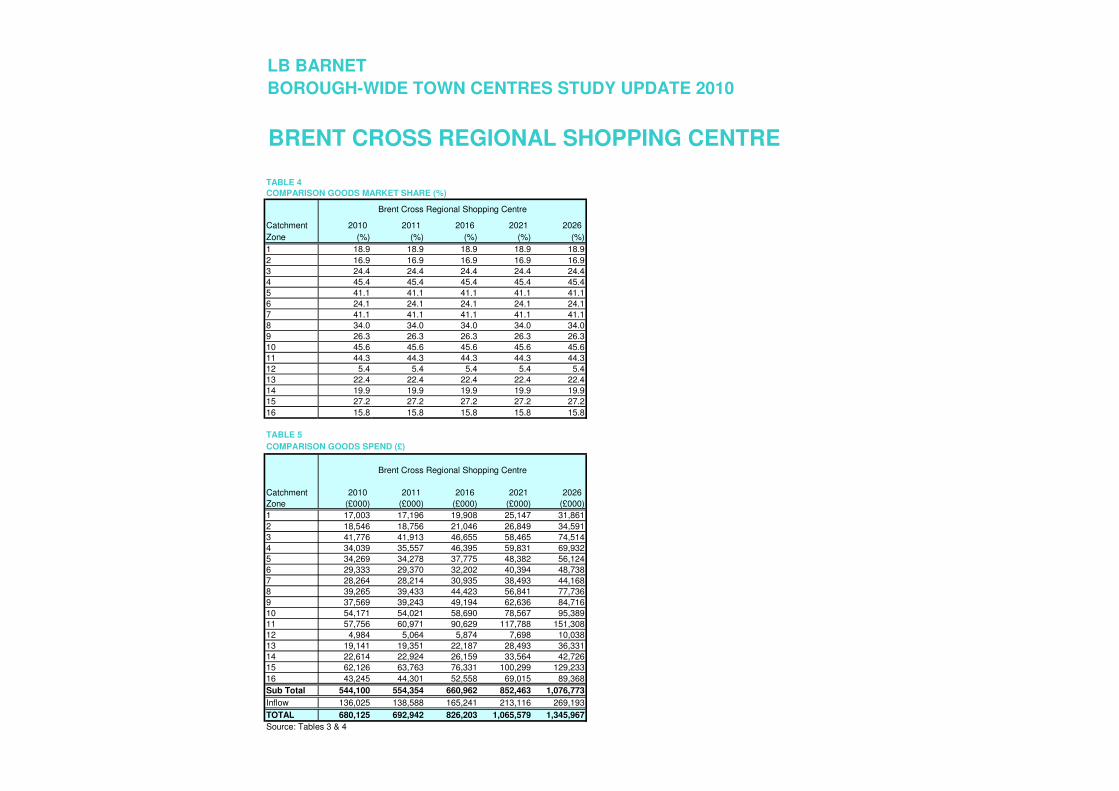
LB BARNET
BOROUGH-WIDE TOWN CENTRES STUDY UPDATE 2010
TABLE 4
Catchment 2010 2011 2016 2021 2026
Zone (%) (%) (%) (%) (%)
1 18.9 18.9 18.9 18.9 18.9
2 16.9 16.9 16.9 16.9 16.9
3 24.4 24.4 24.4 24.4 24.4
4 45.4 45.4 45.4 45.4 45.4
5 41.1 41.1 41.1 41.1 41.1
6 24.1 24.1 24.1 24.1 24.1
7 41.1 41.1 41.1 41.1 41.1
8 34.0 34.0 34.0 34.0 34.0
9 26.3 26.3 26.3 26.3 26.3
10 45.6 45.6 45.6 45.6 45.6
11 44.3 44.3 44.3 44.3 44.3
12 5.4 5.4 5.4 5.4 5.4
13 22.4 22.4 22.4 22.4 22.4
14 19.9 19.9 19.9 19.9 19.9
15 27.2 27.2 27.2 27.2 27.2
16 15.8 15.8 15.8 15.8 15.8
TABLE 5
Catchment 2010 2011 2016 2021 2026
Zone (£000) (£000) (£000) (£000) (£000)
1 17,003 17,196 19,908 25,147 31,861
2 18,546 18,756 21,046 26,849 34,591
3 41,776 41,913 46,655 58,465 74,514
4 34,039 35,557 46,395 59,831 69,932
5 34,269 34,278 37,775 48,382 56,124
6 29,333 29,370 32,202 40,394 48,738
7 28,264 28,214 30,935 38,493 44,168
8 39,265 39,433 44,423 56,841 77,736
9 37,569 39,243 49,194 62,636 84,716
10 54,171 54,021 58,690 78,567 95,389
11 57,756 60,971 90,629 117,788 151,308
12 4,984 5,064 5,874 7,698 10,038
13 19,141 19,351 22,187 28,493 36,331
14 22,614 22,924 26,159 33,564 42,726
15 62,126 63,763 76,331 100,299 129,233
16 43,245 44,301 52,558 69,015 89,368
Sub Total 544,100 554,354 660,962 852,463 1,076,773
Inflow 136,025 138,588 165,241 213,116 269,193
TOTAL 680,125 692,942 826,203 1,065,579 1,345,967
Source: Tables 3 & 4
COMPARISON GOODS MARKET SHARE (%)
COMPARISON GOODS SPEND (£)
Brent Cross Regional Shopping Centre
Brent Cross Regional Shopping Centre
BRENT CROSS REGIONAL SHOPPING CENTRE
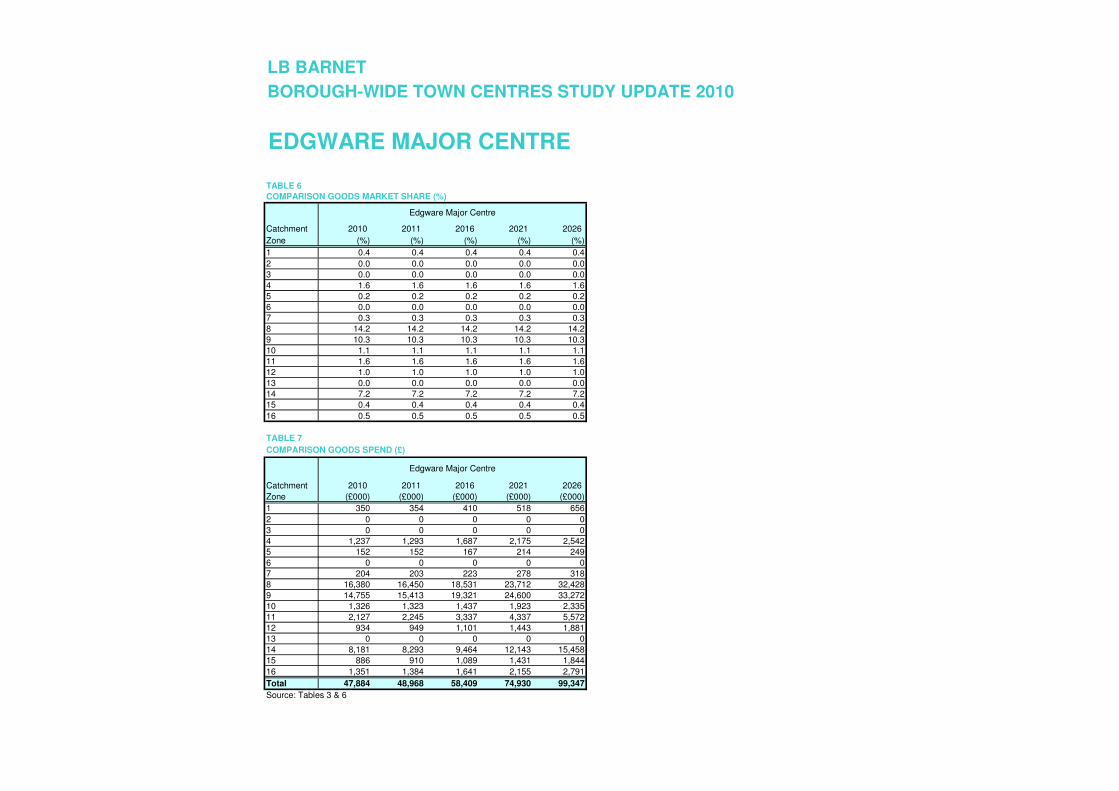
LB BARNET
BOROUGH-WIDE TOWN CENTRES STUDY UPDATE 2010
TABLE 6
Catchment 2010 2011 2016 2021 2026
Zone (%) (%) (%) (%) (%)
1 0.4 0.4 0.4 0.4 0.4
2 0.0 0.0 0.0 0.0 0.0
3 0.0 0.0 0.0 0.0 0.0
4 1.6 1.6 1.6 1.6 1.6
5 0.2 0.2 0.2 0.2 0.2
6 0.0 0.0 0.0 0.0 0.0
7 0.3 0.3 0.3 0.3 0.3
8 14.2 14.2 14.2 14.2 14.2
9 10.3 10.3 10.3 10.3 10.3
10 1.1 1.1 1.1 1.1 1.1
11 1.6 1.6 1.6 1.6 1.6
12 1.0 1.0 1.0 1.0 1.0
13 0.0 0.0 0.0 0.0 0.0
14 7.2 7.2 7.2 7.2 7.2
15 0.4 0.4 0.4 0.4 0.4
16 0.5 0.5 0.5 0.5 0.5
TABLE 7
Catchment 2010 2011 2016 2021 2026
Zone (£000) (£000) (£000) (£000) (£000)
1 350 354 410 518 656
2 0 0 0 0 0
3 0 0 0 0 0
4 1,237 1,293 1,687 2,175 2,542
5 152 152 167 214 249
6 0 0 0 0 0
7 204 203 223 278 318
8 16,380 16,450 18,531 23,712 32,428
9 14,755 15,413 19,321 24,600 33,272
10 1,326 1,323 1,437 1,923 2,335
11 2,127 2,245 3,337 4,337 5,572
12 934 949 1,101 1,443 1,881
13 0 0 0 0 0
14 8,181 8,293 9,464 12,143 15,458
15 886 910 1,089 1,431 1,844
16 1,351 1,384 1,641 2,155 2,791
Total 47,884 48,968 58,409 74,930 99,347
Source: Tables 3 & 6
COMPARISON GOODS MARKET SHARE (%)
Edgware Major Centre
Edgware Major Centre
EDGWARE MAJOR CENTRE
COMPARISON GOODS SPEND (£)
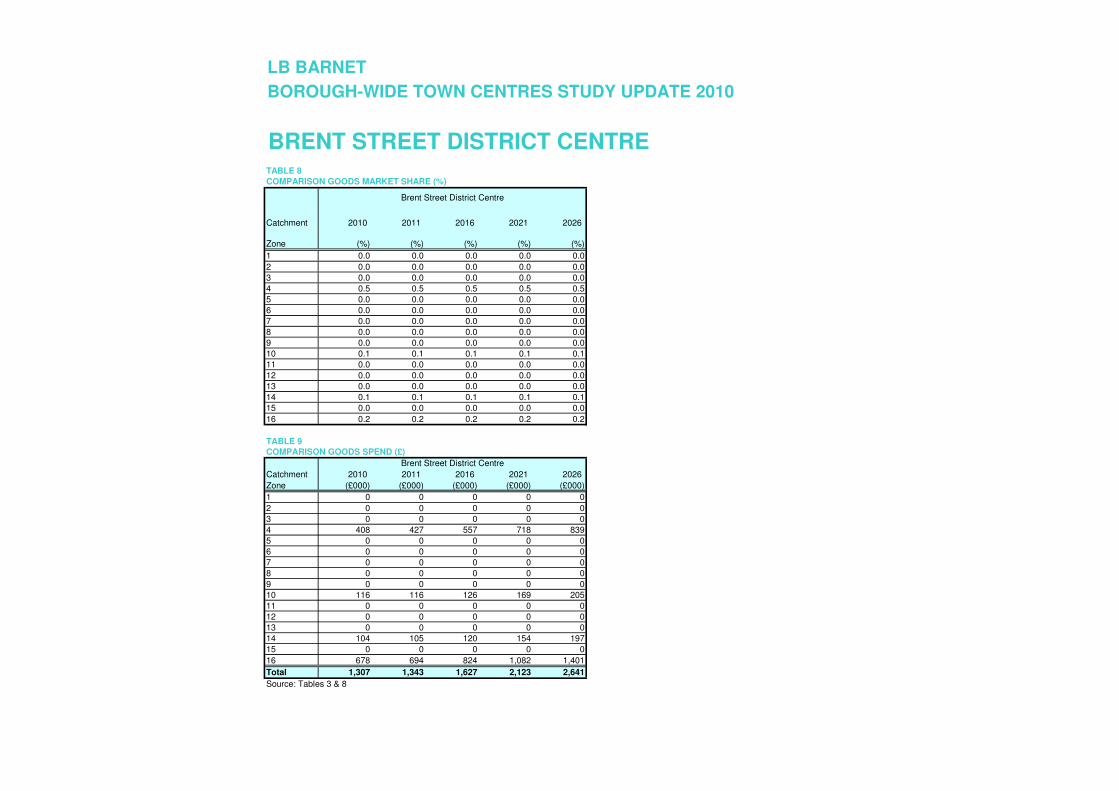
LB BARNET
BOROUGH-WIDE TOWN CENTRES STUDY UPDATE 2010
TABLE 8
Catchment 2010 2011 2016 2021 2026
Zone (%) (%) (%) (%) (%)
1 0.0 0.0 0.0 0.0 0.0
2 0.0 0.0 0.0 0.0 0.0
3 0.0 0.0 0.0 0.0 0.0
4 0.5 0.5 0.5 0.5 0.5
5 0.0 0.0 0.0 0.0 0.0
6 0.0 0.0 0.0 0.0 0.0
7 0.0 0.0 0.0 0.0 0.0
8 0.0 0.0 0.0 0.0 0.0
9 0.0 0.0 0.0 0.0 0.0
10 0.1 0.1 0.1 0.1 0.1
11 0.0 0.0 0.0 0.0 0.0
12 0.0 0.0 0.0 0.0 0.0
13 0.0 0.0 0.0 0.0 0.0
14 0.1 0.1 0.1 0.1 0.1
15 0.0 0.0 0.0 0.0 0.0
16 0.2 0.2 0.2 0.2 0.2
TABLE 9
Catchment 2010 2011 2016 2021 2026
Zone (£000) (£000) (£000) (£000) (£000)
1 0 0 0 0 0
2 0 0 0 0 0
3 0 0 0 0 0
4 408 427 557 718 839
5 0 0 0 0 0
6 0 0 0 0 0
7 0 0 0 0 0
8 0 0 0 0 0
9 0 0 0 0 0
10 116 116 126 169 205
11 0 0 0 0 0
12 0 0 0 0 0
13 0 0 0 0 0
14 104 105 120 154 197
15 0 0 0 0 0
16 678 694 824 1,082 1,401
Total 1,307 1,343 1,627 2,123 2,641
Source: Tables 3 & 8
COMPARISON GOODS MARKET SHARE (%)
COMPARISON GOODS SPEND (£)
Brent Street District Centre
Brent Street District Centre
BRENT STREET DISTRICT CENTRE
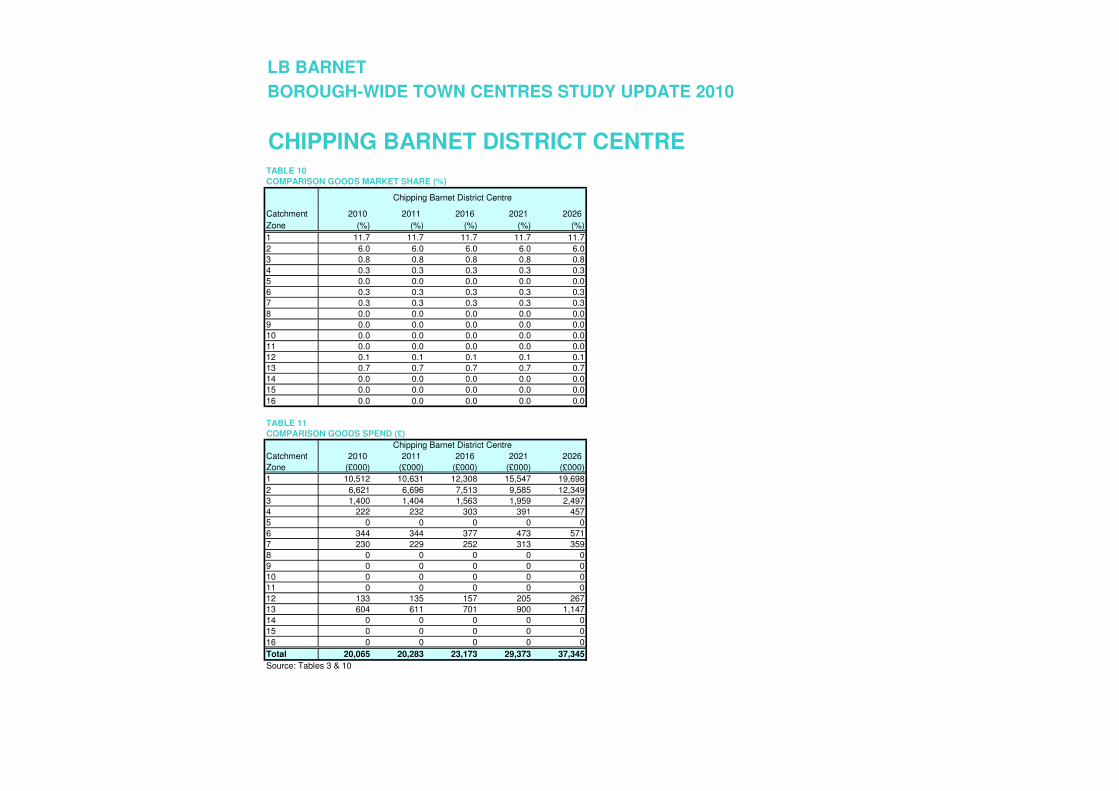
LB BARNET
BOROUGH-WIDE TOWN CENTRES STUDY UPDATE 2010
TABLE 10
Catchment 2010 2011 2016 2021 2026
Zone (%) (%) (%) (%) (%)
1 11.7 11.7 11.7 11.7 11.7
2 6.0 6.0 6.0 6.0 6.0
3 0.8 0.8 0.8 0.8 0.8
4 0.3 0.3 0.3 0.3 0.3
5 0.0 0.0 0.0 0.0 0.0
6 0.3 0.3 0.3 0.3 0.3
7 0.3 0.3 0.3 0.3 0.3
8 0.0 0.0 0.0 0.0 0.0
9 0.0 0.0 0.0 0.0 0.0
10 0.0 0.0 0.0 0.0 0.0
11 0.0 0.0 0.0 0.0 0.0
12 0.1 0.1 0.1 0.1 0.1
13 0.7 0.7 0.7 0.7 0.7
14 0.0 0.0 0.0 0.0 0.0
15 0.0 0.0 0.0 0.0 0.0
16 0.0 0.0 0.0 0.0 0.0
TABLE 11
Catchment 2010 2011 2016 2021 2026
Zone (£000) (£000) (£000) (£000) (£000)
1 10,512 10,631 12,308 15,547 19,698
2 6,621 6,696 7,513 9,585 12,349
3 1,400 1,404 1,563 1,959 2,497
4 222 232 303 391 457
5 0 0 0 0 0
6 344 344 377 473 571
7 230 229 252 313 359
8 0 0 0 0 0
9 0 0 0 0 0
10 0 0 0 0 0
11 0 0 0 0 0
12 133 135 157 205 267
13 604 611 701 900 1,147
14 0 0 0 0 0
15 0 0 0 0 0
16 0 0 0 0 0
Total 20,065 20,283 23,173 29,373 37,345
Source: Tables 3 & 10
CHIPPING BARNET DISTRICT CENTRE
COMPARISON GOODS SPEND (£)
COMPARISON GOODS MARKET SHARE (%)
Chipping Barnet District Centre
Chipping Barnet District Centre
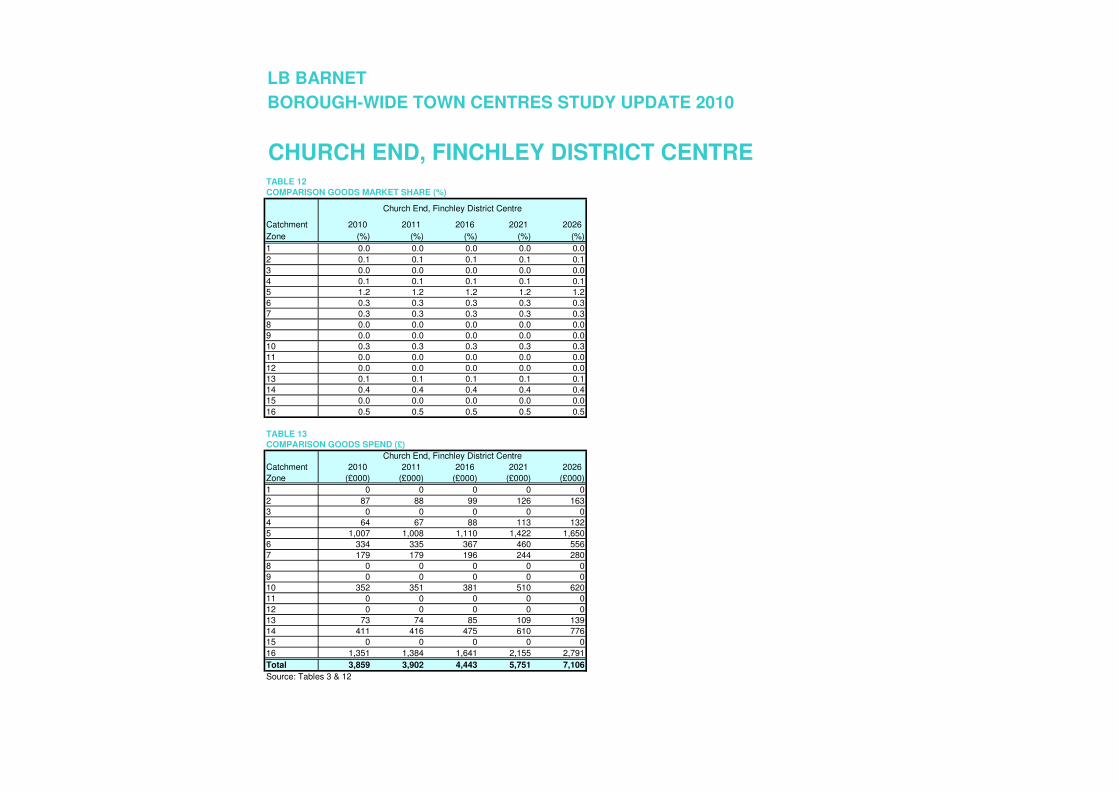
LB BARNET
BOROUGH-WIDE TOWN CENTRES STUDY UPDATE 2010
TABLE 12
Catchment 2010 2011 2016 2021 2026
Zone (%) (%) (%) (%) (%)
1 0.0 0.0 0.0 0.0 0.0
2 0.1 0.1 0.1 0.1 0.1
3 0.0 0.0 0.0 0.0 0.0
4 0.1 0.1 0.1 0.1 0.1
5 1.2 1.2 1.2 1.2 1.2
6 0.3 0.3 0.3 0.3 0.3
7 0.3 0.3 0.3 0.3 0.3
8 0.0 0.0 0.0 0.0 0.0
9 0.0 0.0 0.0 0.0 0.0
10 0.3 0.3 0.3 0.3 0.3
11 0.0 0.0 0.0 0.0 0.0
12 0.0 0.0 0.0 0.0 0.0
13 0.1 0.1 0.1 0.1 0.1
14 0.4 0.4 0.4 0.4 0.4
15 0.0 0.0 0.0 0.0 0.0
16 0.5 0.5 0.5 0.5 0.5
TABLE 13
Catchment 2010 2011 2016 2021 2026
Zone (£000) (£000) (£000) (£000) (£000)
1 0 0 0 0 0
2 87 88 99 126 163
3 0 0 0 0 0
4 64 67 88 113 132
5 1,007 1,008 1,110 1,422 1,650
6 334 335 367 460 556
7 179 179 196 244 280
8 0 0 0 0 0
9 0 0 0 0 0
10 352 351 381 510 620
11 0 0 0 0 0
12 0 0 0 0 0
13 73 74 85 109 139
14 411 416 475 610 776
15 0 0 0 0 0
16 1,351 1,384 1,641 2,155 2,791
Total 3,859 3,902 4,443 5,751 7,106
Source: Tables 3 & 12
Church End, Finchley District Centre
Church End, Finchley District Centre
COMPARISON GOODS MARKET SHARE (%)
COMPARISON GOODS SPEND (£)
CHURCH END, FINCHLEY DISTRICT CENTRE
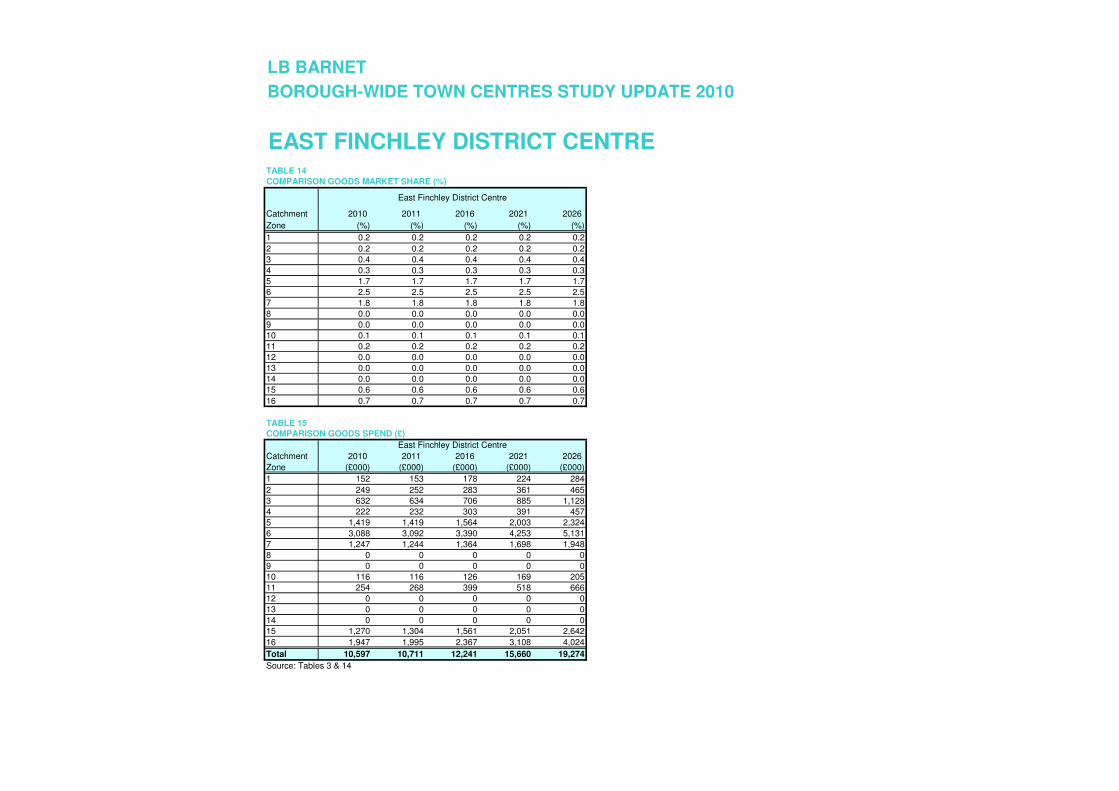
LB BARNET
BOROUGH-WIDE TOWN CENTRES STUDY UPDATE 2010
TABLE 14
Catchment 2010 2011 2016 2021 2026
Zone (%) (%) (%) (%) (%)
1 0.2 0.2 0.2 0.2 0.2
2 0.2 0.2 0.2 0.2 0.2
3 0.4 0.4 0.4 0.4 0.4
4 0.3 0.3 0.3 0.3 0.3
5 1.7 1.7 1.7 1.7 1.7
6 2.5 2.5 2.5 2.5 2.5
7 1.8 1.8 1.8 1.8 1.8
8 0.0 0.0 0.0 0.0 0.0
9 0.0 0.0 0.0 0.0 0.0
10 0.1 0.1 0.1 0.1 0.1
11 0.2 0.2 0.2 0.2 0.2
12 0.0 0.0 0.0 0.0 0.0
13 0.0 0.0 0.0 0.0 0.0
14 0.0 0.0 0.0 0.0 0.0
15 0.6 0.6 0.6 0.6 0.6
16 0.7 0.7 0.7 0.7 0.7
TABLE 15
Catchment 2010 2011 2016 2021 2026
Zone (£000) (£000) (£000) (£000) (£000)
1 152 153 178 224 284
2 249 252 283 361 465
3 632 634 706 885 1,128
4 222 232 303 391 457
5 1,419 1,419 1,564 2,003 2,324
6 3,088 3,092 3,390 4,253 5,131
7 1,247 1,244 1,364 1,698 1,948
8 0 0 0 0 0
9 0 0 0 0 0
10 116 116 126 169 205
11 254 268 399 518 666
12 0 0 0 0 0
13 0 0 0 0 0
14 0 0 0 0 0
15 1,270 1,304 1,561 2,051 2,642
16 1,947 1,995 2,367 3,108 4,024
Total 10,597 10,711 12,241 15,660 19,274
Source: Tables 3 & 14
East Finchley District Centre
COMPARISON GOODS MARKET SHARE (%)
COMPARISON GOODS SPEND (£)
East Finchley District Centre
EAST FINCHLEY DISTRICT CENTRE
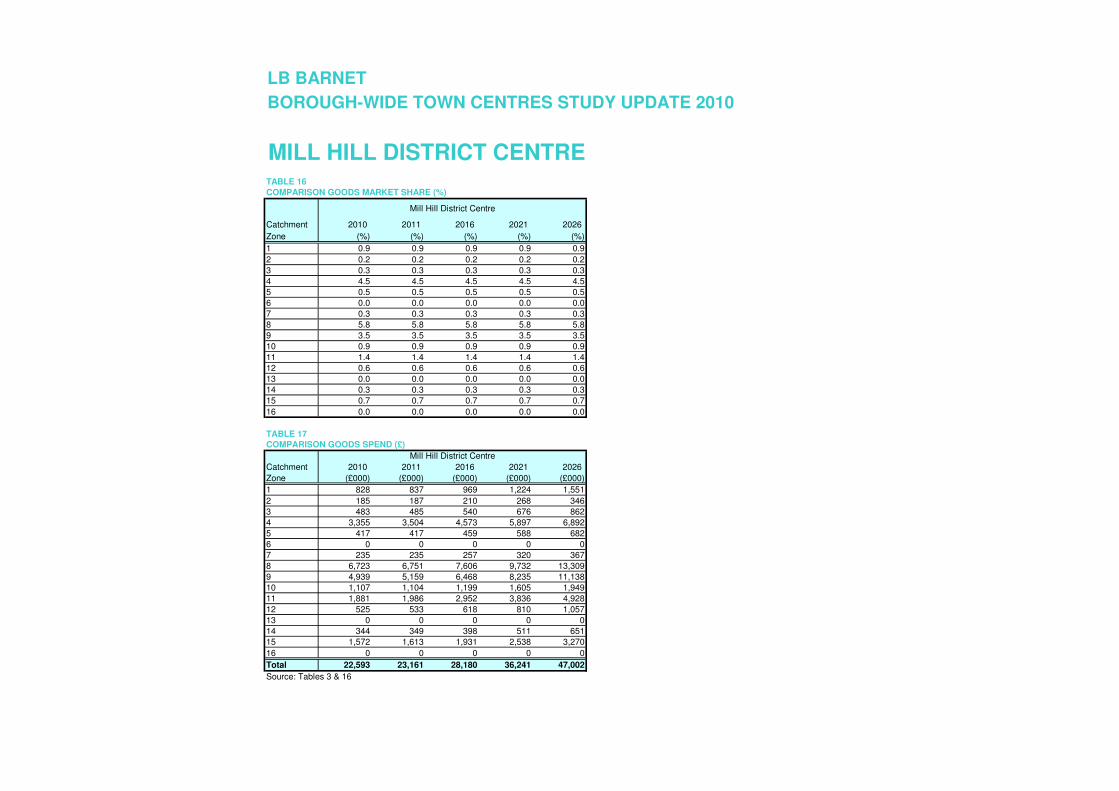
LB BARNET
BOROUGH-WIDE TOWN CENTRES STUDY UPDATE 2010
TABLE 16
Catchment 2010 2011 2016 2021 2026
Zone (%) (%) (%) (%) (%)
1 0.9 0.9 0.9 0.9 0.9
2 0.2 0.2 0.2 0.2 0.2
3 0.3 0.3 0.3 0.3 0.3
4 4.5 4.5 4.5 4.5 4.5
5 0.5 0.5 0.5 0.5 0.5
6 0.0 0.0 0.0 0.0 0.0
7 0.3 0.3 0.3 0.3 0.3
8 5.8 5.8 5.8 5.8 5.8
9 3.5 3.5 3.5 3.5 3.5
10 0.9 0.9 0.9 0.9 0.9
11 1.4 1.4 1.4 1.4 1.4
12 0.6 0.6 0.6 0.6 0.6
13 0.0 0.0 0.0 0.0 0.0
14 0.3 0.3 0.3 0.3 0.3
15 0.7 0.7 0.7 0.7 0.7
16 0.0 0.0 0.0 0.0 0.0
TABLE 17
Catchment 2010 2011 2016 2021 2026
Zone (£000) (£000) (£000) (£000) (£000)
1 828 837 969 1,224 1,551
2 185 187 210 268 346
3 483 485 540 676 862
4 3,355 3,504 4,573 5,897 6,892
5 417 417 459 588 682
6 0 0 0 0 0
7 235 235 257 320 367
8 6,723 6,751 7,606 9,732 13,309
9 4,939 5,159 6,468 8,235 11,138
10 1,107 1,104 1,199 1,605 1,949
11 1,881 1,986 2,952 3,836 4,928
12 525 533 618 810 1,057
13 0 0 0 0 0
14 344 349 398 511 651
15 1,572 1,613 1,931 2,538 3,270
16 0 0 0 0 0
Total 22,593 23,161 28,180 36,241 47,002
Source: Tables 3 & 16
Mill Hill District Centre
COMPARISON GOODS MARKET SHARE (%)
COMPARISON GOODS SPEND (£)
MILL HILL DISTRICT CENTRE
Mill Hill District Centre
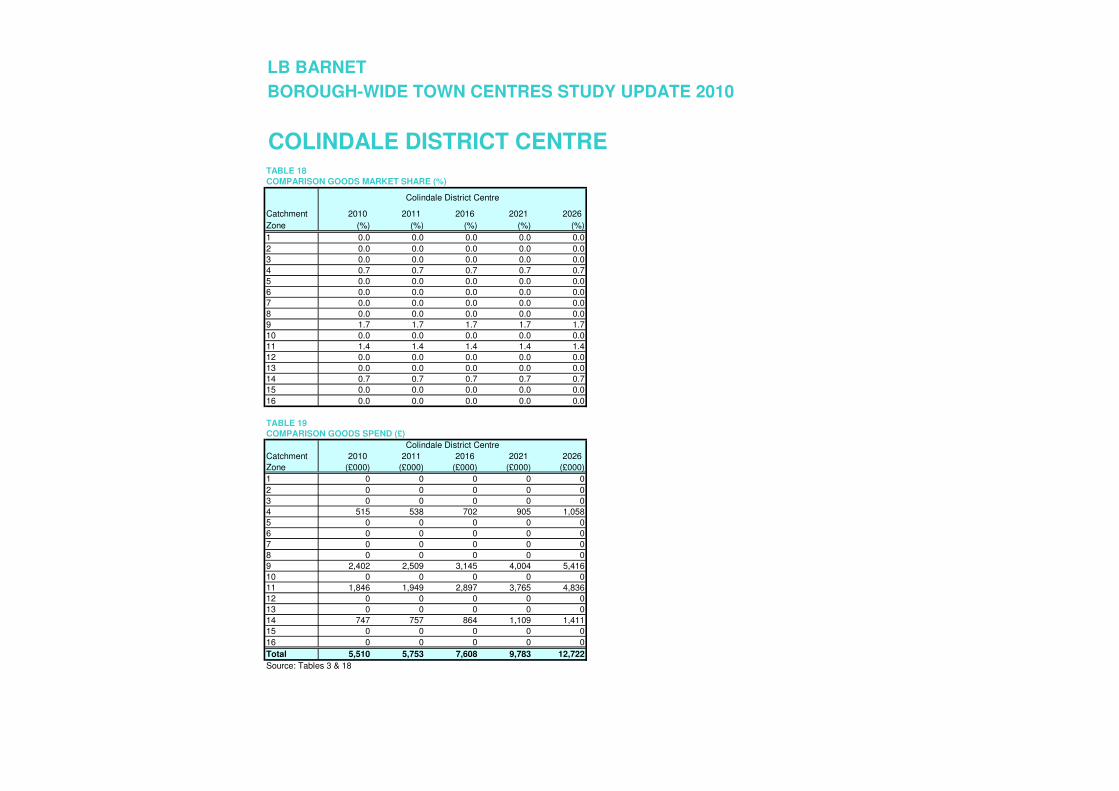
LB BARNET
BOROUGH-WIDE TOWN CENTRES STUDY UPDATE 2010
TABLE 18
Catchment 2010 2011 2016 2021 2026
Zone (%) (%) (%) (%) (%)
1 0.0 0.0 0.0 0.0 0.0
2 0.0 0.0 0.0 0.0 0.0
3 0.0 0.0 0.0 0.0 0.0
4 0.7 0.7 0.7 0.7 0.7
5 0.0 0.0 0.0 0.0 0.0
6 0.0 0.0 0.0 0.0 0.0
7 0.0 0.0 0.0 0.0 0.0
8 0.0 0.0 0.0 0.0 0.0
9 1.7 1.7 1.7 1.7 1.7
10 0.0 0.0 0.0 0.0 0.0
11 1.4 1.4 1.4 1.4 1.4
12 0.0 0.0 0.0 0.0 0.0
13 0.0 0.0 0.0 0.0 0.0
14 0.7 0.7 0.7 0.7 0.7
15 0.0 0.0 0.0 0.0 0.0
16 0.0 0.0 0.0 0.0 0.0
TABLE 19
Catchment 2010 2011 2016 2021 2026
Zone (£000) (£000) (£000) (£000) (£000)
1 0 0 0 0 0
2 0 0 0 0 0
3 0 0 0 0 0
4 515 538 702 905 1,058
5 0 0 0 0 0
6 0 0 0 0 0
7 0 0 0 0 0
8 0 0 0 0 0
9 2,402 2,509 3,145 4,004 5,416
10 0 0 0 0 0
11 1,846 1,949 2,897 3,765 4,836
12 0 0 0 0 0
13 0 0 0 0 0
14 747 757 864 1,109 1,411
15 0 0 0 0 0
16 0 0 0 0 0
Total 5,510 5,753 7,608 9,783 12,722
Source: Tables 3 & 18
COMPARISON GOODS MARKET SHARE (%)
COMPARISON GOODS SPEND (£)
Colindale District Centre
COLINDALE DISTRICT CENTRE
Colindale District Centre
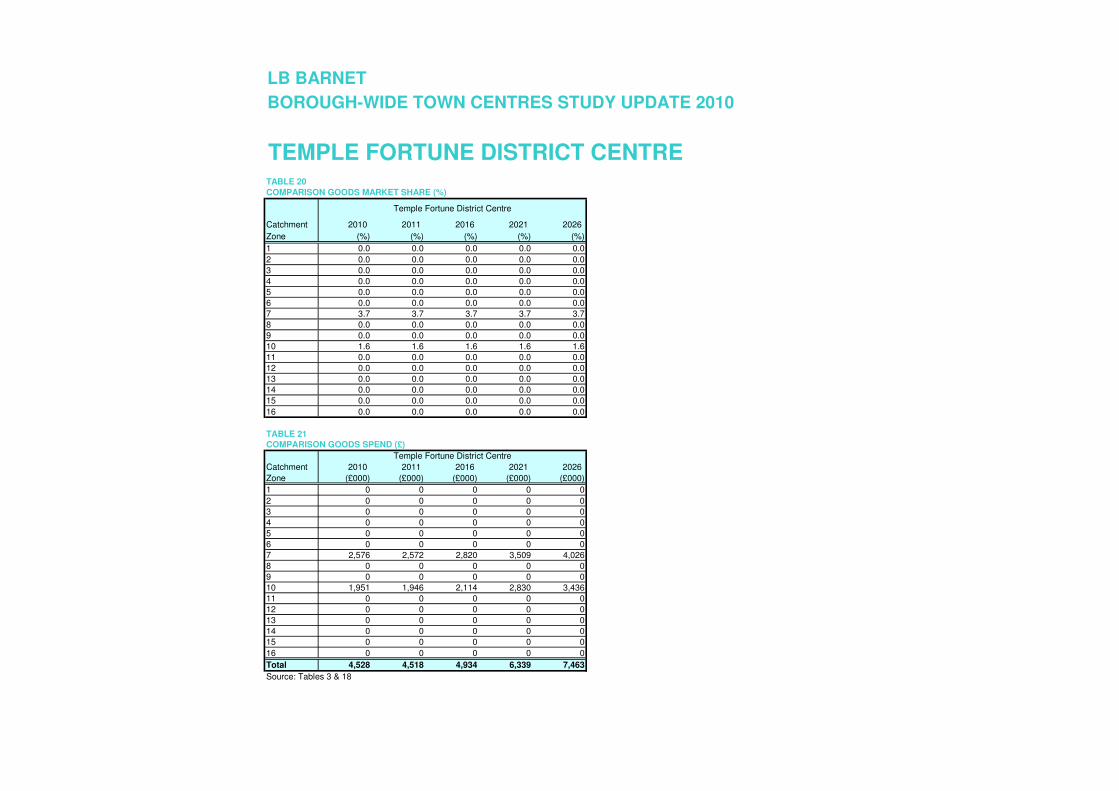
LB BARNET
BOROUGH-WIDE TOWN CENTRES STUDY UPDATE 2010
TABLE 20
Catchment 2010 2011 2016 2021 2026
Zone (%) (%) (%) (%) (%)
1 0.0 0.0 0.0 0.0 0.0
2 0.0 0.0 0.0 0.0 0.0
3 0.0 0.0 0.0 0.0 0.0
4 0.0 0.0 0.0 0.0 0.0
5 0.0 0.0 0.0 0.0 0.0
6 0.0 0.0 0.0 0.0 0.0
7 3.7 3.7 3.7 3.7 3.7
8 0.0 0.0 0.0 0.0 0.0
9 0.0 0.0 0.0 0.0 0.0
10 1.6 1.6 1.6 1.6 1.6
11 0.0 0.0 0.0 0.0 0.0
12 0.0 0.0 0.0 0.0 0.0
13 0.0 0.0 0.0 0.0 0.0
14 0.0 0.0 0.0 0.0 0.0
15 0.0 0.0 0.0 0.0 0.0
16 0.0 0.0 0.0 0.0 0.0
TABLE 21
Catchment 2010 2011 2016 2021 2026
Zone (£000) (£000) (£000) (£000) (£000)
1 0 0 0 0 0
2 0 0 0 0 0
3 0 0 0 0 0
4 0 0 0 0 0
5 0 0 0 0 0
6 0 0 0 0 0
7 2,576 2,572 2,820 3,509 4,026
8 0 0 0 0 0
9 0 0 0 0 0
10 1,951 1,946 2,114 2,830 3,436
11 0 0 0 0 0
12 0 0 0 0 0
13 0 0 0 0 0
14 0 0 0 0 0
15 0 0 0 0 0
16 0 0 0 0 0
Total 4,528 4,518 4,934 6,339 7,463
Source: Tables 3 & 18
Temple Fortune District Centre
TEMPLE FORTUNE DISTRICT CENTRE
COMPARISON GOODS MARKET SHARE (%)
Temple Fortune District Centre
COMPARISON GOODS SPEND (£)
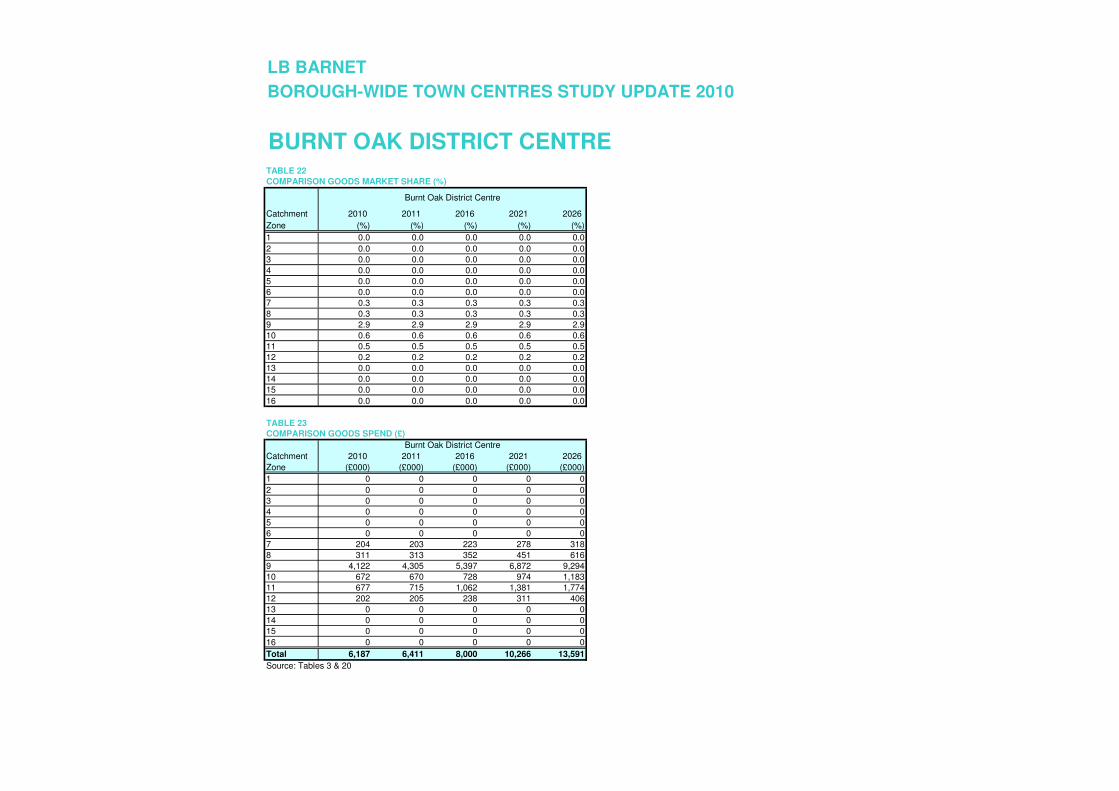
LB BARNET
BOROUGH-WIDE TOWN CENTRES STUDY UPDATE 2010
TABLE 22
Catchment 2010 2011 2016 2021 2026
Zone (%) (%) (%) (%) (%)
1 0.0 0.0 0.0 0.0 0.0
2 0.0 0.0 0.0 0.0 0.0
3 0.0 0.0 0.0 0.0 0.0
4 0.0 0.0 0.0 0.0 0.0
5 0.0 0.0 0.0 0.0 0.0
6 0.0 0.0 0.0 0.0 0.0
7 0.3 0.3 0.3 0.3 0.3
8 0.3 0.3 0.3 0.3 0.3
9 2.9 2.9 2.9 2.9 2.9
10 0.6 0.6 0.6 0.6 0.6
11 0.5 0.5 0.5 0.5 0.5
12 0.2 0.2 0.2 0.2 0.2
13 0.0 0.0 0.0 0.0 0.0
14 0.0 0.0 0.0 0.0 0.0
15 0.0 0.0 0.0 0.0 0.0
16 0.0 0.0 0.0 0.0 0.0
TABLE 23
Catchment 2010 2011 2016 2021 2026
Zone (£000) (£000) (£000) (£000) (£000)
1 0 0 0 0 0
2 0 0 0 0 0
3 0 0 0 0 0
4 0 0 0 0 0
5 0 0 0 0 0
6 0 0 0 0 0
7 204 203 223 278 318
8 311 313 352 451 616
9 4,122 4,305 5,397 6,872 9,294
10 672 670 728 974 1,183
11 677 715 1,062 1,381 1,774
12 202 205 238 311 406
13 0 0 0 0 0
14 0 0 0 0 0
15 0 0 0 0 0
16 0 0 0 0 0
Total 6,187 6,411 8,000 10,266 13,591
Source: Tables 3 & 20
Burnt Oak District Centre
Burnt Oak District Centre
COMPARISON GOODS MARKET SHARE (%)
COMPARISON GOODS SPEND (£)
BURNT OAK DISTRICT CENTRE
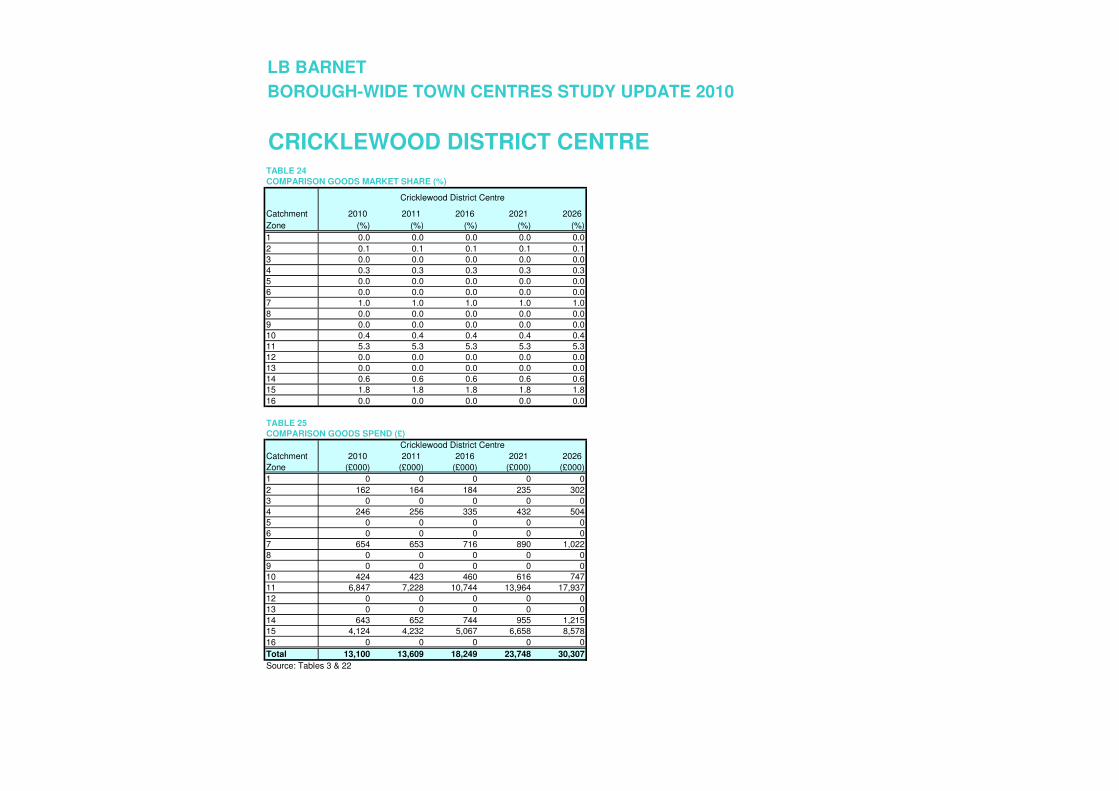
LB BARNET
BOROUGH-WIDE TOWN CENTRES STUDY UPDATE 2010
CRICKLEWOOD DISTRICT CENTRETABLE 24
Catchment 2010 2011 2016 2021 2026
Zone (%) (%) (%) (%) (%)
1 0.0 0.0 0.0 0.0 0.0
2 0.1 0.1 0.1 0.1 0.1
3 0.0 0.0 0.0 0.0 0.0
4 0.3 0.3 0.3 0.3 0.3
5 0.0 0.0 0.0 0.0 0.0
6 0.0 0.0 0.0 0.0 0.0
7 1.0 1.0 1.0 1.0 1.0
8 0.0 0.0 0.0 0.0 0.0
9 0.0 0.0 0.0 0.0 0.0
10 0.4 0.4 0.4 0.4 0.4
11 5.3 5.3 5.3 5.3 5.3
12 0.0 0.0 0.0 0.0 0.0
13 0.0 0.0 0.0 0.0 0.0
14 0.6 0.6 0.6 0.6 0.6
15 1.8 1.8 1.8 1.8 1.8
16 0.0 0.0 0.0 0.0 0.0
TABLE 25
Catchment 2010 2011 2016 2021 2026
Zone (£000) (£000) (£000) (£000) (£000)
1 0 0 0 0 0
2 162 164 184 235 302
3 0 0 0 0 0
4 246 256 335 432 504
5 0 0 0 0 0
6 0 0 0 0 0
7 654 653 716 890 1,022
8 0 0 0 0 0
9 0 0 0 0 0
10 424 423 460 616 747
11 6,847 7,228 10,744 13,964 17,937
12 0 0 0 0 0
13 0 0 0 0 0
14 643 652 744 955 1,215
15 4,124 4,232 5,067 6,658 8,578
16 0 0 0 0 0
Total 13,100 13,609 18,249 23,748 30,307
Source: Tables 3 & 22
Cricklewood District Centre
COMPARISON GOODS MARKET SHARE (%)
Cricklewood District Centre
COMPARISON GOODS SPEND (£)
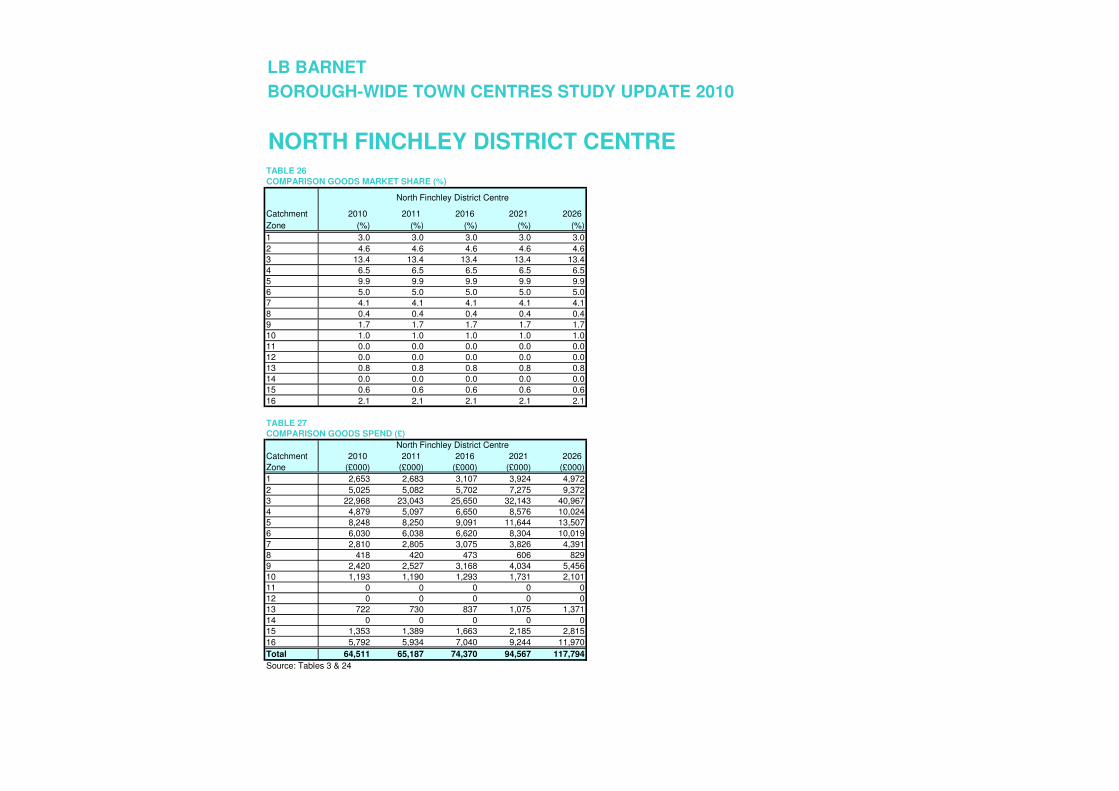
LB BARNET
BOROUGH-WIDE TOWN CENTRES STUDY UPDATE 2010
TABLE 26
Catchment 2010 2011 2016 2021 2026
Zone (%) (%) (%) (%) (%)
1 3.0 3.0 3.0 3.0 3.0
2 4.6 4.6 4.6 4.6 4.6
3 13.4 13.4 13.4 13.4 13.4
4 6.5 6.5 6.5 6.5 6.5
5 9.9 9.9 9.9 9.9 9.9
6 5.0 5.0 5.0 5.0 5.0
7 4.1 4.1 4.1 4.1 4.1
8 0.4 0.4 0.4 0.4 0.4
9 1.7 1.7 1.7 1.7 1.7
10 1.0 1.0 1.0 1.0 1.0
11 0.0 0.0 0.0 0.0 0.0
12 0.0 0.0 0.0 0.0 0.0
13 0.8 0.8 0.8 0.8 0.8
14 0.0 0.0 0.0 0.0 0.0
15 0.6 0.6 0.6 0.6 0.6
16 2.1 2.1 2.1 2.1 2.1
TABLE 27
Catchment 2010 2011 2016 2021 2026
Zone (£000) (£000) (£000) (£000) (£000)
1 2,653 2,683 3,107 3,924 4,972
2 5,025 5,082 5,702 7,275 9,372
3 22,968 23,043 25,650 32,143 40,967
4 4,879 5,097 6,650 8,576 10,024
5 8,248 8,250 9,091 11,644 13,507
6 6,030 6,038 6,620 8,304 10,019
7 2,810 2,805 3,075 3,826 4,391
8 418 420 473 606 829
9 2,420 2,527 3,168 4,034 5,456
10 1,193 1,190 1,293 1,731 2,101
11 0 0 0 0 0
12 0 0 0 0 0
13 722 730 837 1,075 1,371
14 0 0 0 0 0
15 1,353 1,389 1,663 2,185 2,815
16 5,792 5,934 7,040 9,244 11,970
Total 64,511 65,187 74,370 94,567 117,794
Source: Tables 3 & 24
North Finchley District Centre
COMPARISON GOODS MARKET SHARE (%)
NORTH FINCHLEY DISTRICT CENTRE
COMPARISON GOODS SPEND (£)
North Finchley District Centre
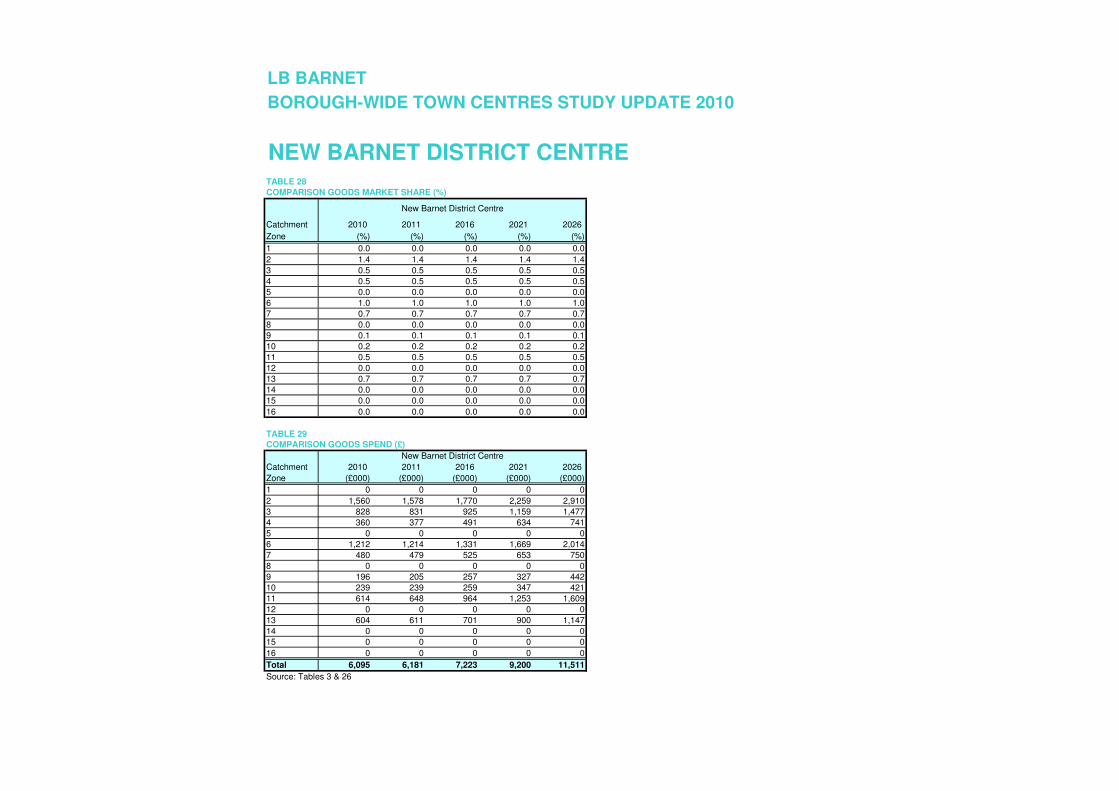
LB BARNET
BOROUGH-WIDE TOWN CENTRES STUDY UPDATE 2010
TABLE 28
Catchment 2010 2011 2016 2021 2026
Zone (%) (%) (%) (%) (%)
1 0.0 0.0 0.0 0.0 0.0
2 1.4 1.4 1.4 1.4 1.4
3 0.5 0.5 0.5 0.5 0.5
4 0.5 0.5 0.5 0.5 0.5
5 0.0 0.0 0.0 0.0 0.0
6 1.0 1.0 1.0 1.0 1.0
7 0.7 0.7 0.7 0.7 0.7
8 0.0 0.0 0.0 0.0 0.0
9 0.1 0.1 0.1 0.1 0.1
10 0.2 0.2 0.2 0.2 0.2
11 0.5 0.5 0.5 0.5 0.5
12 0.0 0.0 0.0 0.0 0.0
13 0.7 0.7 0.7 0.7 0.7
14 0.0 0.0 0.0 0.0 0.0
15 0.0 0.0 0.0 0.0 0.0
16 0.0 0.0 0.0 0.0 0.0
TABLE 29
Catchment 2010 2011 2016 2021 2026
Zone (£000) (£000) (£000) (£000) (£000)
1 0 0 0 0 0
2 1,560 1,578 1,770 2,259 2,910
3 828 831 925 1,159 1,477
4 360 377 491 634 741
5 0 0 0 0 0
6 1,212 1,214 1,331 1,669 2,014
7 480 479 525 653 750
8 0 0 0 0 0
9 196 205 257 327 442
10 239 239 259 347 421
11 614 648 964 1,253 1,609
12 0 0 0 0 0
13 604 611 701 900 1,147
14 0 0 0 0 0
15 0 0 0 0 0
16 0 0 0 0 0
Total 6,095 6,181 7,223 9,200 11,511
Source: Tables 3 & 26
New Barnet District Centre
COMPARISON GOODS MARKET SHARE (%)
COMPARISON GOODS SPEND (£)
New Barnet District Centre
NEW BARNET DISTRICT CENTRE
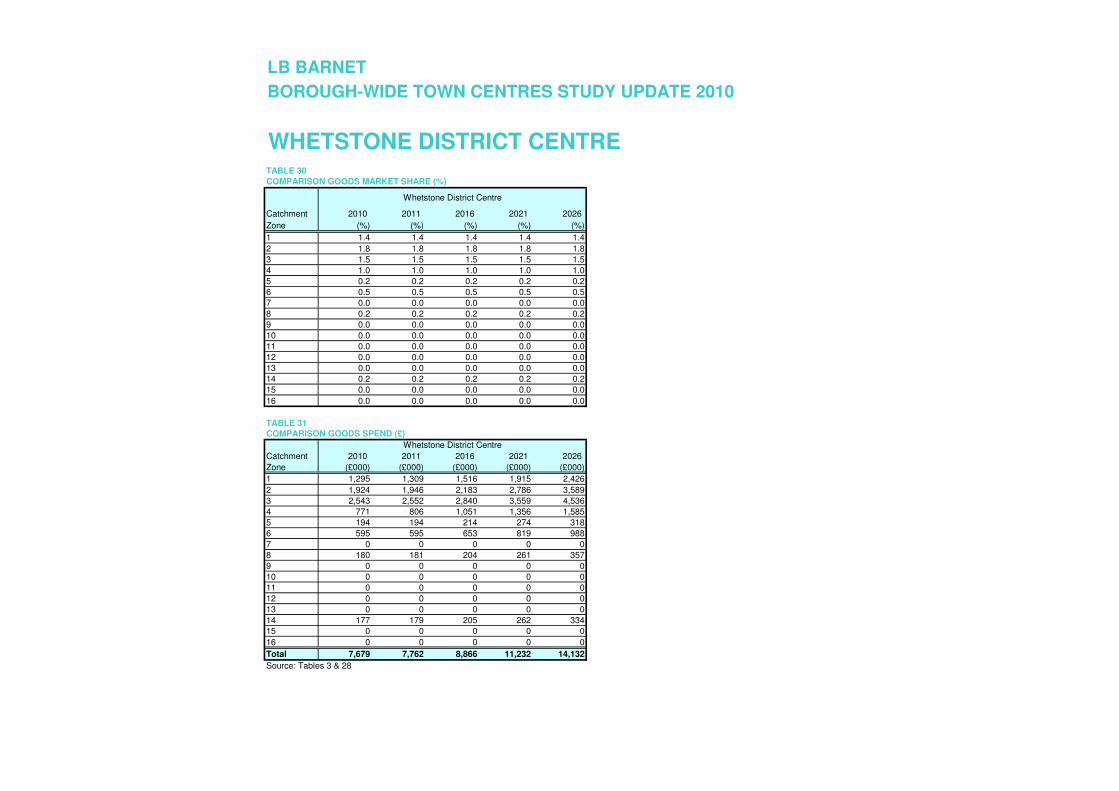
LB BARNET
BOROUGH-WIDE TOWN CENTRES STUDY UPDATE 2010
TABLE 30
Catchment 2010 2011 2016 2021 2026
Zone (%) (%) (%) (%) (%)
1 1.4 1.4 1.4 1.4 1.4
2 1.8 1.8 1.8 1.8 1.8
3 1.5 1.5 1.5 1.5 1.5
4 1.0 1.0 1.0 1.0 1.0
5 0.2 0.2 0.2 0.2 0.2
6 0.5 0.5 0.5 0.5 0.5
7 0.0 0.0 0.0 0.0 0.0
8 0.2 0.2 0.2 0.2 0.2
9 0.0 0.0 0.0 0.0 0.0
10 0.0 0.0 0.0 0.0 0.0
11 0.0 0.0 0.0 0.0 0.0
12 0.0 0.0 0.0 0.0 0.0
13 0.0 0.0 0.0 0.0 0.0
14 0.2 0.2 0.2 0.2 0.2
15 0.0 0.0 0.0 0.0 0.0
16 0.0 0.0 0.0 0.0 0.0
TABLE 31
Catchment 2010 2011 2016 2021 2026
Zone (£000) (£000) (£000) (£000) (£000)
1 1,295 1,309 1,516 1,915 2,426
2 1,924 1,946 2,183 2,786 3,589
3 2,543 2,552 2,840 3,559 4,536
4 771 806 1,051 1,356 1,585
5 194 194 214 274 318
6 595 595 653 819 988
7 0 0 0 0 0
8 180 181 204 261 357
9 0 0 0 0 0
10 0 0 0 0 0
11 0 0 0 0 0
12 0 0 0 0 0
13 0 0 0 0 0
14 177 179 205 262 334
15 0 0 0 0 0
16 0 0 0 0 0
Total 7,679 7,762 8,866 11,232 14,132
Source: Tables 3 & 28
Whetstone District Centre
COMPARISON GOODS MARKET SHARE (%)
COMPARISON GOODS SPEND (£)
Whetstone District Centre
WHETSTONE DISTRICT CENTRE
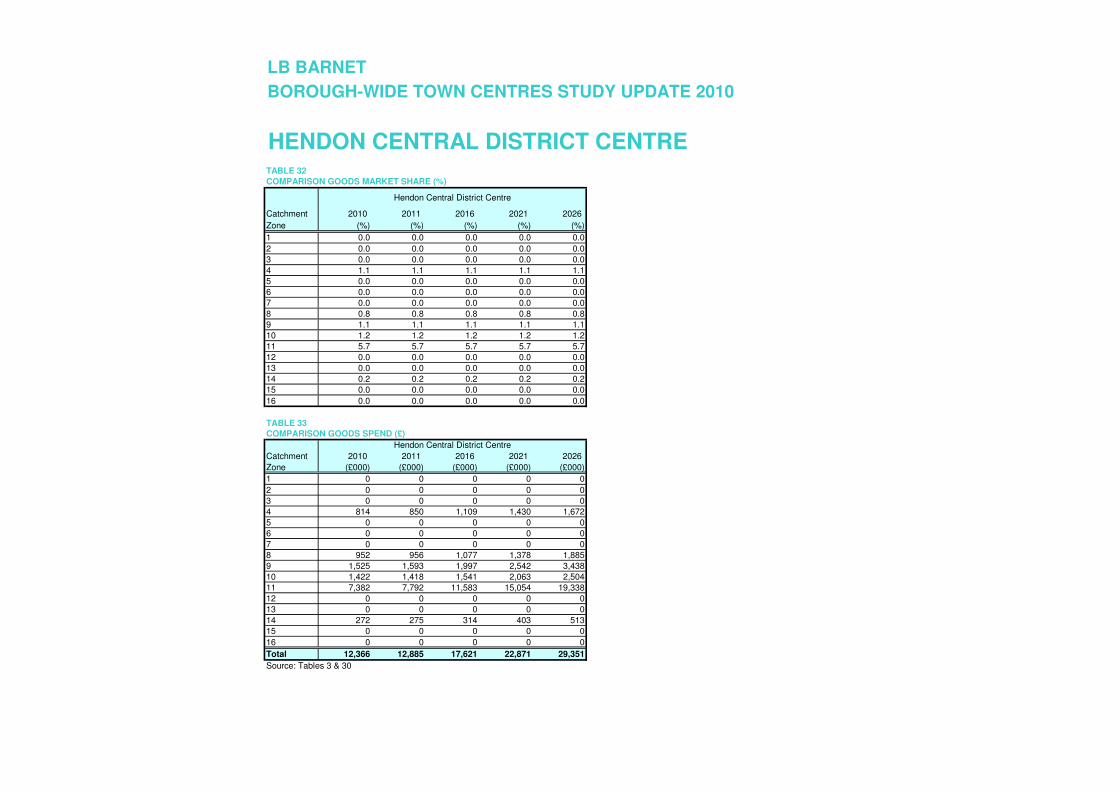
LB BARNET
BOROUGH-WIDE TOWN CENTRES STUDY UPDATE 2010
TABLE 32
Catchment 2010 2011 2016 2021 2026
Zone (%) (%) (%) (%) (%)
1 0.0 0.0 0.0 0.0 0.0
2 0.0 0.0 0.0 0.0 0.0
3 0.0 0.0 0.0 0.0 0.0
4 1.1 1.1 1.1 1.1 1.1
5 0.0 0.0 0.0 0.0 0.0
6 0.0 0.0 0.0 0.0 0.0
7 0.0 0.0 0.0 0.0 0.0
8 0.8 0.8 0.8 0.8 0.8
9 1.1 1.1 1.1 1.1 1.1
10 1.2 1.2 1.2 1.2 1.2
11 5.7 5.7 5.7 5.7 5.7
12 0.0 0.0 0.0 0.0 0.0
13 0.0 0.0 0.0 0.0 0.0
14 0.2 0.2 0.2 0.2 0.2
15 0.0 0.0 0.0 0.0 0.0
16 0.0 0.0 0.0 0.0 0.0
TABLE 33
Catchment 2010 2011 2016 2021 2026
Zone (£000) (£000) (£000) (£000) (£000)
1 0 0 0 0 0
2 0 0 0 0 0
3 0 0 0 0 0
4 814 850 1,109 1,430 1,672
5 0 0 0 0 0
6 0 0 0 0 0
7 0 0 0 0 0
8 952 956 1,077 1,378 1,885
9 1,525 1,593 1,997 2,542 3,438
10 1,422 1,418 1,541 2,063 2,504
11 7,382 7,792 11,583 15,054 19,338
12 0 0 0 0 0
13 0 0 0 0 0
14 272 275 314 403 513
15 0 0 0 0 0
16 0 0 0 0 0
Total 12,366 12,885 17,621 22,871 29,351
Source: Tables 3 & 30
COMPARISON GOODS SPEND (£)
Hendon Central District Centre
COMPARISON GOODS MARKET SHARE (%)
Hendon Central District Centre
HENDON CENTRAL DISTRICT CENTRE
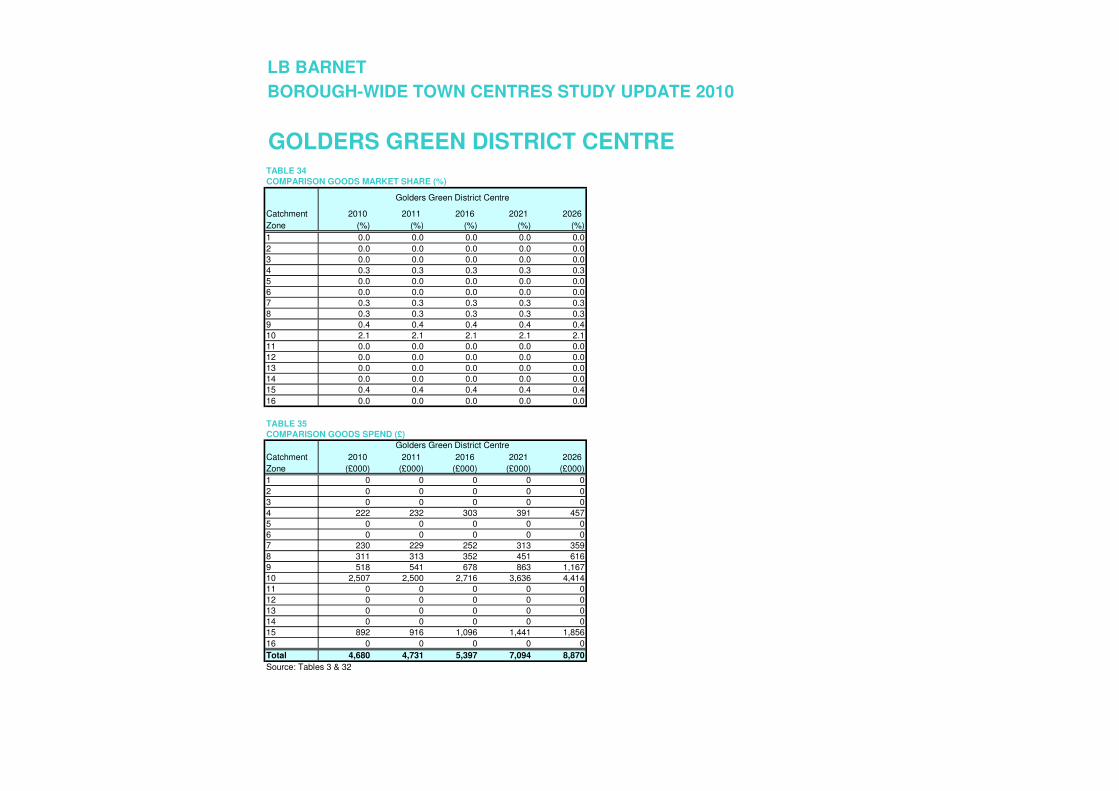
LB BARNET
BOROUGH-WIDE TOWN CENTRES STUDY UPDATE 2010
TABLE 34
Catchment 2010 2011 2016 2021 2026
Zone (%) (%) (%) (%) (%)
1 0.0 0.0 0.0 0.0 0.0
2 0.0 0.0 0.0 0.0 0.0
3 0.0 0.0 0.0 0.0 0.0
4 0.3 0.3 0.3 0.3 0.3
5 0.0 0.0 0.0 0.0 0.0
6 0.0 0.0 0.0 0.0 0.0
7 0.3 0.3 0.3 0.3 0.3
8 0.3 0.3 0.3 0.3 0.3
9 0.4 0.4 0.4 0.4 0.4
10 2.1 2.1 2.1 2.1 2.1
11 0.0 0.0 0.0 0.0 0.0
12 0.0 0.0 0.0 0.0 0.0
13 0.0 0.0 0.0 0.0 0.0
14 0.0 0.0 0.0 0.0 0.0
15 0.4 0.4 0.4 0.4 0.4
16 0.0 0.0 0.0 0.0 0.0
TABLE 35
Catchment 2010 2011 2016 2021 2026
Zone (£000) (£000) (£000) (£000) (£000)
1 0 0 0 0 0
2 0 0 0 0 0
3 0 0 0 0 0
4 222 232 303 391 457
5 0 0 0 0 0
6 0 0 0 0 0
7 230 229 252 313 359
8 311 313 352 451 616
9 518 541 678 863 1,167
10 2,507 2,500 2,716 3,636 4,414
11 0 0 0 0 0
12 0 0 0 0 0
13 0 0 0 0 0
14 0 0 0 0 0
15 892 916 1,096 1,441 1,856
16 0 0 0 0 0
Total 4,680 4,731 5,397 7,094 8,870
Source: Tables 3 & 32
COMPARISON GOODS SPEND (£)
COMPARISON GOODS MARKET SHARE (%)
GOLDERS GREEN DISTRICT CENTRE
Golders Green District Centre
Golders Green District Centre
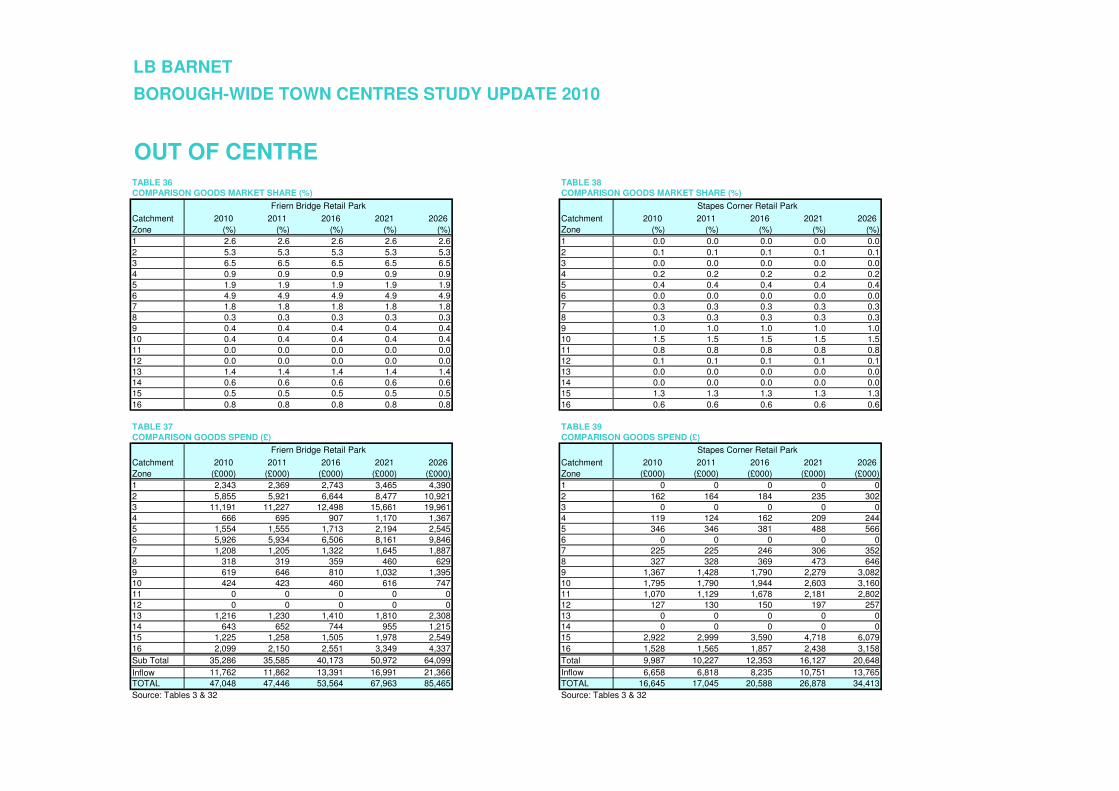
LB BARNET
BOROUGH-WIDE TOWN CENTRES STUDY UPDATE 2010
TABLE 36 TABLE 38
Catchment 2010 2011 2016 2021 2026 Catchment 2010 2011 2016 2021 2026
Zone (%) (%) (%) (%) (%) Zone (%) (%) (%) (%) (%)
1 2.6 2.6 2.6 2.6 2.6 1 0.0 0.0 0.0 0.0 0.0
2 5.3 5.3 5.3 5.3 5.3 2 0.1 0.1 0.1 0.1 0.1
3 6.5 6.5 6.5 6.5 6.5 3 0.0 0.0 0.0 0.0 0.0
4 0.9 0.9 0.9 0.9 0.9 4 0.2 0.2 0.2 0.2 0.2
5 1.9 1.9 1.9 1.9 1.9 5 0.4 0.4 0.4 0.4 0.4
6 4.9 4.9 4.9 4.9 4.9 6 0.0 0.0 0.0 0.0 0.0
7 1.8 1.8 1.8 1.8 1.8 7 0.3 0.3 0.3 0.3 0.3
8 0.3 0.3 0.3 0.3 0.3 8 0.3 0.3 0.3 0.3 0.3
9 0.4 0.4 0.4 0.4 0.4 9 1.0 1.0 1.0 1.0 1.0
10 0.4 0.4 0.4 0.4 0.4 10 1.5 1.5 1.5 1.5 1.5
11 0.0 0.0 0.0 0.0 0.0 11 0.8 0.8 0.8 0.8 0.8
12 0.0 0.0 0.0 0.0 0.0 12 0.1 0.1 0.1 0.1 0.1
13 1.4 1.4 1.4 1.4 1.4 13 0.0 0.0 0.0 0.0 0.0
14 0.6 0.6 0.6 0.6 0.6 14 0.0 0.0 0.0 0.0 0.0
15 0.5 0.5 0.5 0.5 0.5 15 1.3 1.3 1.3 1.3 1.3
16 0.8 0.8 0.8 0.8 0.8 16 0.6 0.6 0.6 0.6 0.6
TABLE 37 TABLE 39
Catchment 2010 2011 2016 2021 2026 Catchment 2010 2011 2016 2021 2026
Zone (£000) (£000) (£000) (£000) (£000) Zone (£000) (£000) (£000) (£000) (£000)
1 2,343 2,369 2,743 3,465 4,390 1 0 0 0 0 0
2 5,855 5,921 6,644 8,477 10,921 2 162 164 184 235 302
3 11,191 11,227 12,498 15,661 19,961 3 0 0 0 0 0
4 666 695 907 1,170 1,367 4 119 124 162 209 244
5 1,554 1,555 1,713 2,194 2,545 5 346 346 381 488 566
6 5,926 5,934 6,506 8,161 9,846 6 0 0 0 0 0
7 1,208 1,205 1,322 1,645 1,887 7 225 225 246 306 352
8 318 319 359 460 629 8 327 328 369 473 646
9 619 646 810 1,032 1,395 9 1,367 1,428 1,790 2,279 3,082
10 424 423 460 616 747 10 1,795 1,790 1,944 2,603 3,160
11 0 0 0 0 0 11 1,070 1,129 1,678 2,181 2,802
12 0 0 0 0 0 12 127 130 150 197 257
13 1,216 1,230 1,410 1,810 2,308 13 0 0 0 0 0
14 643 652 744 955 1,215 14 0 0 0 0 0
15 1,225 1,258 1,505 1,978 2,549 15 2,922 2,999 3,590 4,718 6,079
16 2,099 2,150 2,551 3,349 4,337 16 1,528 1,565 1,857 2,438 3,158
Sub Total 35,286 35,585 40,173 50,972 64,099 Total 9,987 10,227 12,353 16,127 20,648
Inflow 11,762 11,862 13,391 16,991 21,366 Inflow 6,658 6,818 8,235 10,751 13,765
TOTAL 47,048 47,446 53,564 67,963 85,465 TOTAL 16,645 17,045 20,588 26,878 34,413
Source: Tables 3 & 32 Source: Tables 3 & 32
OUT OF CENTRE
COMPARISON GOODS MARKET SHARE (%)
Friern Bridge Retail Park
COMPARISON GOODS SPEND (£)
Friern Bridge Retail Park
COMPARISON GOODS MARKET SHARE (%)
Stapes Corner Retail Park
COMPARISON GOODS SPEND (£)
Stapes Corner Retail Park
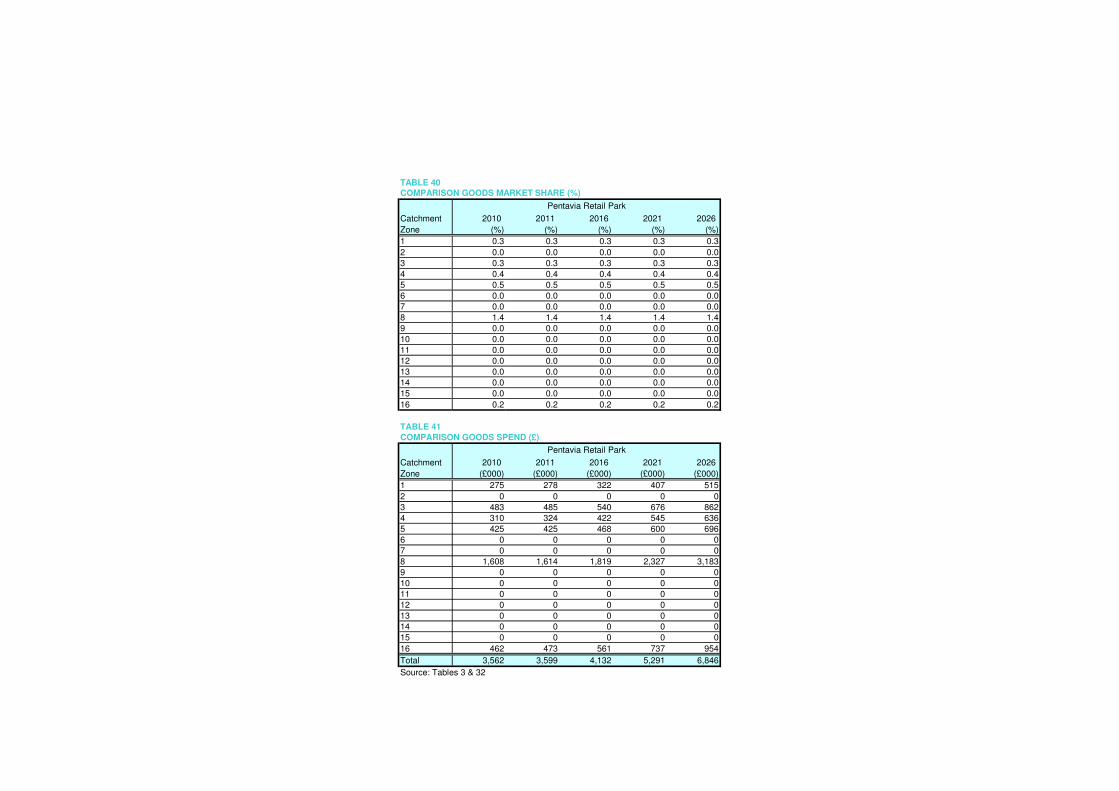
TABLE 40
Catchment 2010 2011 2016 2021 2026
Zone (%) (%) (%) (%) (%)
1 0.3 0.3 0.3 0.3 0.3
2 0.0 0.0 0.0 0.0 0.0
3 0.3 0.3 0.3 0.3 0.3
4 0.4 0.4 0.4 0.4 0.4
5 0.5 0.5 0.5 0.5 0.5
6 0.0 0.0 0.0 0.0 0.0
7 0.0 0.0 0.0 0.0 0.0
8 1.4 1.4 1.4 1.4 1.4
9 0.0 0.0 0.0 0.0 0.0
10 0.0 0.0 0.0 0.0 0.0
11 0.0 0.0 0.0 0.0 0.0
12 0.0 0.0 0.0 0.0 0.0
13 0.0 0.0 0.0 0.0 0.0
14 0.0 0.0 0.0 0.0 0.0
15 0.0 0.0 0.0 0.0 0.0
16 0.2 0.2 0.2 0.2 0.2
TABLE 41
Catchment 2010 2011 2016 2021 2026
Zone (£000) (£000) (£000) (£000) (£000)
1 275 278 322 407 515
2 0 0 0 0 0
3 483 485 540 676 862
4 310 324 422 545 636
5 425 425 468 600 696
6 0 0 0 0 0
7 0 0 0 0 0
8 1,608 1,614 1,819 2,327 3,183
9 0 0 0 0 0
10 0 0 0 0 0
11 0 0 0 0 0
12 0 0 0 0 0
13 0 0 0 0 0
14 0 0 0 0 0
15 0 0 0 0 0
16 462 473 561 737 954
Total 3,562 3,599 4,132 5,291 6,846
Source: Tables 3 & 32
COMPARISON GOODS MARKET SHARE (%)
Pentavia Retail Park
COMPARISON GOODS SPEND (£)
Pentavia Retail Park
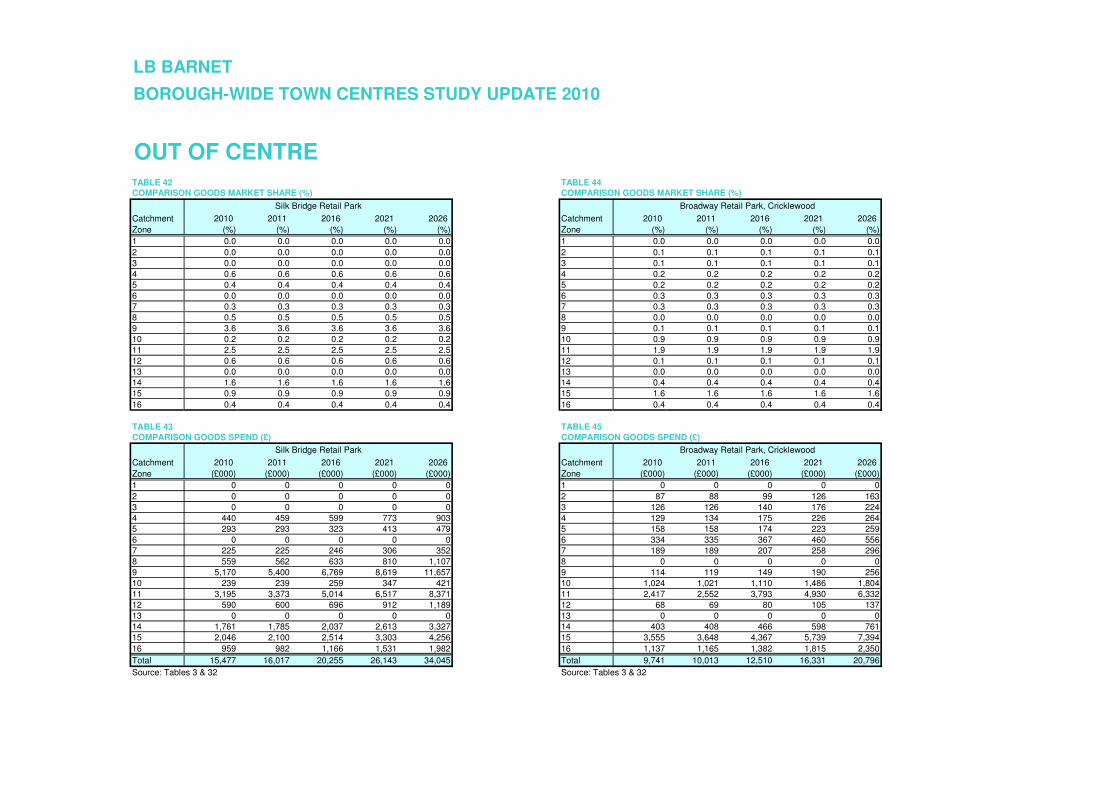
LB BARNET
BOROUGH-WIDE TOWN CENTRES STUDY UPDATE 2010
TABLE 42 TABLE 44
Catchment 2010 2011 2016 2021 2026 Catchment 2010 2011 2016 2021 2026
Zone (%) (%) (%) (%) (%) Zone (%) (%) (%) (%) (%)
1 0.0 0.0 0.0 0.0 0.0 1 0.0 0.0 0.0 0.0 0.0
2 0.0 0.0 0.0 0.0 0.0 2 0.1 0.1 0.1 0.1 0.1
3 0.0 0.0 0.0 0.0 0.0 3 0.1 0.1 0.1 0.1 0.1
4 0.6 0.6 0.6 0.6 0.6 4 0.2 0.2 0.2 0.2 0.2
5 0.4 0.4 0.4 0.4 0.4 5 0.2 0.2 0.2 0.2 0.2
6 0.0 0.0 0.0 0.0 0.0 6 0.3 0.3 0.3 0.3 0.3
7 0.3 0.3 0.3 0.3 0.3 7 0.3 0.3 0.3 0.3 0.3
8 0.5 0.5 0.5 0.5 0.5 8 0.0 0.0 0.0 0.0 0.0
9 3.6 3.6 3.6 3.6 3.6 9 0.1 0.1 0.1 0.1 0.1
10 0.2 0.2 0.2 0.2 0.2 10 0.9 0.9 0.9 0.9 0.9
11 2.5 2.5 2.5 2.5 2.5 11 1.9 1.9 1.9 1.9 1.9
12 0.6 0.6 0.6 0.6 0.6 12 0.1 0.1 0.1 0.1 0.1
13 0.0 0.0 0.0 0.0 0.0 13 0.0 0.0 0.0 0.0 0.0
14 1.6 1.6 1.6 1.6 1.6 14 0.4 0.4 0.4 0.4 0.4
15 0.9 0.9 0.9 0.9 0.9 15 1.6 1.6 1.6 1.6 1.6
16 0.4 0.4 0.4 0.4 0.4 16 0.4 0.4 0.4 0.4 0.4
TABLE 43 TABLE 45
Catchment 2010 2011 2016 2021 2026 Catchment 2010 2011 2016 2021 2026
Zone (£000) (£000) (£000) (£000) (£000) Zone (£000) (£000) (£000) (£000) (£000)
1 0 0 0 0 0 1 0 0 0 0 0
2 0 0 0 0 0 2 87 88 99 126 163
3 0 0 0 0 0 3 126 126 140 176 224
4 440 459 599 773 903 4 129 134 175 226 264
5 293 293 323 413 479 5 158 158 174 223 259
6 0 0 0 0 0 6 334 335 367 460 556
7 225 225 246 306 352 7 189 189 207 258 296
8 559 562 633 810 1,107 8 0 0 0 0 0
9 5,170 5,400 6,769 8,619 11,657 9 114 119 149 190 256
10 239 239 259 347 421 10 1,024 1,021 1,110 1,486 1,804
11 3,195 3,373 5,014 6,517 8,371 11 2,417 2,552 3,793 4,930 6,332
12 590 600 696 912 1,189 12 68 69 80 105 137
13 0 0 0 0 0 13 0 0 0 0 0
14 1,761 1,785 2,037 2,613 3,327 14 403 408 466 598 761
15 2,046 2,100 2,514 3,303 4,256 15 3,555 3,648 4,367 5,739 7,394
16 959 982 1,166 1,531 1,982 16 1,137 1,165 1,382 1,815 2,350
Total 15,477 16,017 20,255 26,143 34,045 Total 9,741 10,013 12,510 16,331 20,796
Source: Tables 3 & 32 Source: Tables 3 & 32
OUT OF CENTRE
Broadway Retail Park, Cricklewood
COMPARISON GOODS SPEND (£)
Broadway Retail Park, Cricklewood
COMPARISON GOODS MARKET SHARE (%)
Silk Bridge Retail Park
COMPARISON GOODS SPEND (£)
Silk Bridge Retail Park
COMPARISON GOODS MARKET SHARE (%)
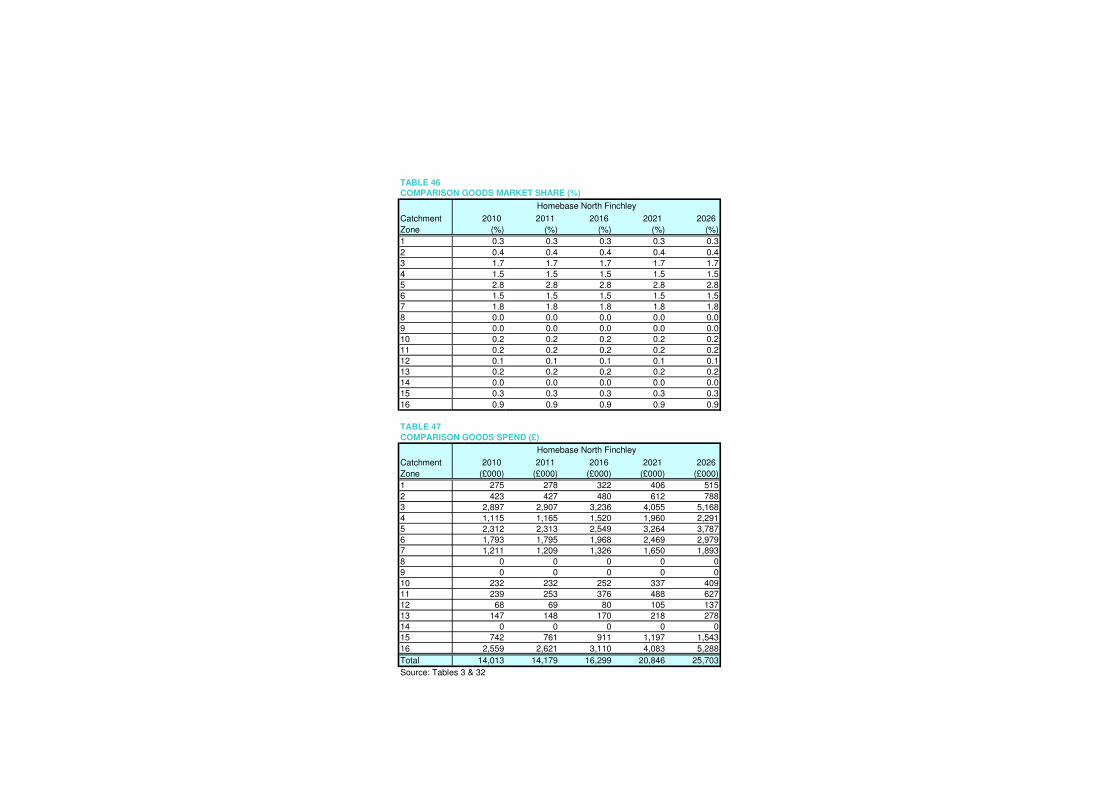
TABLE 46
Catchment 2010 2011 2016 2021 2026
Zone (%) (%) (%) (%) (%)
1 0.3 0.3 0.3 0.3 0.3
2 0.4 0.4 0.4 0.4 0.4
3 1.7 1.7 1.7 1.7 1.7
4 1.5 1.5 1.5 1.5 1.5
5 2.8 2.8 2.8 2.8 2.8
6 1.5 1.5 1.5 1.5 1.5
7 1.8 1.8 1.8 1.8 1.8
8 0.0 0.0 0.0 0.0 0.0
9 0.0 0.0 0.0 0.0 0.0
10 0.2 0.2 0.2 0.2 0.2
11 0.2 0.2 0.2 0.2 0.2
12 0.1 0.1 0.1 0.1 0.1
13 0.2 0.2 0.2 0.2 0.2
14 0.0 0.0 0.0 0.0 0.0
15 0.3 0.3 0.3 0.3 0.3
16 0.9 0.9 0.9 0.9 0.9
TABLE 47
Catchment 2010 2011 2016 2021 2026
Zone (£000) (£000) (£000) (£000) (£000)
1 275 278 322 406 515
2 423 427 480 612 788
3 2,897 2,907 3,236 4,055 5,168
4 1,115 1,165 1,520 1,960 2,291
5 2,312 2,313 2,549 3,264 3,787
6 1,793 1,795 1,968 2,469 2,979
7 1,211 1,209 1,326 1,650 1,893
8 0 0 0 0 0
9 0 0 0 0 0
10 232 232 252 337 409
11 239 253 376 488 627
12 68 69 80 105 137
13 147 148 170 218 278
14 0 0 0 0 0
15 742 761 911 1,197 1,543
16 2,559 2,621 3,110 4,083 5,288
Total 14,013 14,179 16,299 20,846 25,703
Source: Tables 3 & 32
COMPARISON GOODS MARKET SHARE (%)
Homebase North Finchley
COMPARISON GOODS SPEND (£)
Homebase North Finchley
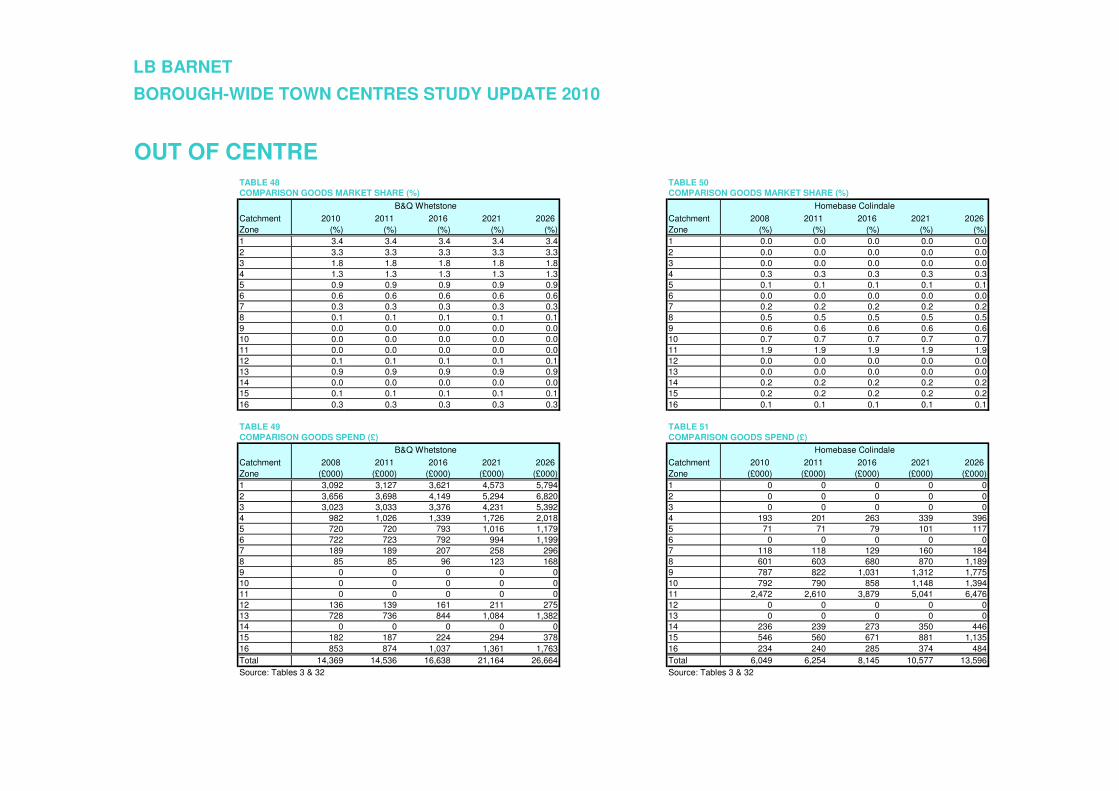
LB BARNET
BOROUGH-WIDE TOWN CENTRES STUDY UPDATE 2010
TABLE 48 TABLE 50
Catchment 2010 2011 2016 2021 2026 Catchment 2008 2011 2016 2021 2026
Zone (%) (%) (%) (%) (%) Zone (%) (%) (%) (%) (%)
1 3.4 3.4 3.4 3.4 3.4 1 0.0 0.0 0.0 0.0 0.0
2 3.3 3.3 3.3 3.3 3.3 2 0.0 0.0 0.0 0.0 0.0
3 1.8 1.8 1.8 1.8 1.8 3 0.0 0.0 0.0 0.0 0.0
4 1.3 1.3 1.3 1.3 1.3 4 0.3 0.3 0.3 0.3 0.3
5 0.9 0.9 0.9 0.9 0.9 5 0.1 0.1 0.1 0.1 0.1
6 0.6 0.6 0.6 0.6 0.6 6 0.0 0.0 0.0 0.0 0.0
7 0.3 0.3 0.3 0.3 0.3 7 0.2 0.2 0.2 0.2 0.2
8 0.1 0.1 0.1 0.1 0.1 8 0.5 0.5 0.5 0.5 0.5
9 0.0 0.0 0.0 0.0 0.0 9 0.6 0.6 0.6 0.6 0.6
10 0.0 0.0 0.0 0.0 0.0 10 0.7 0.7 0.7 0.7 0.7
11 0.0 0.0 0.0 0.0 0.0 11 1.9 1.9 1.9 1.9 1.9
12 0.1 0.1 0.1 0.1 0.1 12 0.0 0.0 0.0 0.0 0.0
13 0.9 0.9 0.9 0.9 0.9 13 0.0 0.0 0.0 0.0 0.0
14 0.0 0.0 0.0 0.0 0.0 14 0.2 0.2 0.2 0.2 0.2
15 0.1 0.1 0.1 0.1 0.1 15 0.2 0.2 0.2 0.2 0.2
16 0.3 0.3 0.3 0.3 0.3 16 0.1 0.1 0.1 0.1 0.1
TABLE 49 TABLE 51
Catchment 2008 2011 2016 2021 2026 Catchment 2010 2011 2016 2021 2026
Zone (£000) (£000) (£000) (£000) (£000) Zone (£000) (£000) (£000) (£000) (£000)
1 3,092 3,127 3,621 4,573 5,794 1 0 0 0 0 0
2 3,656 3,698 4,149 5,294 6,820 2 0 0 0 0 0
3 3,023 3,033 3,376 4,231 5,392 3 0 0 0 0 0
4 982 1,026 1,339 1,726 2,018 4 193 201 263 339 396
5 720 720 793 1,016 1,179 5 71 71 79 101 117
6 722 723 792 994 1,199 6 0 0 0 0 0
7 189 189 207 258 296 7 118 118 129 160 184
8 85 85 96 123 168 8 601 603 680 870 1,189
9 0 0 0 0 0 9 787 822 1,031 1,312 1,775
10 0 0 0 0 0 10 792 790 858 1,148 1,394
11 0 0 0 0 0 11 2,472 2,610 3,879 5,041 6,476
12 136 139 161 211 275 12 0 0 0 0 0
13 728 736 844 1,084 1,382 13 0 0 0 0 0
14 0 0 0 0 0 14 236 239 273 350 446
15 182 187 224 294 378 15 546 560 671 881 1,135
16 853 874 1,037 1,361 1,763 16 234 240 285 374 484
Total 14,369 14,536 16,638 21,164 26,664 Total 6,049 6,254 8,145 10,577 13,596
Source: Tables 3 & 32 Source: Tables 3 & 32
OUT OF CENTRE
COMPARISON GOODS MARKET SHARE (%)
B&Q Whetstone
COMPARISON GOODS SPEND (£)
B&Q Whetstone
COMPARISON GOODS MARKET SHARE (%)
Homebase Colindale
COMPARISON GOODS SPEND (£)
Homebase Colindale
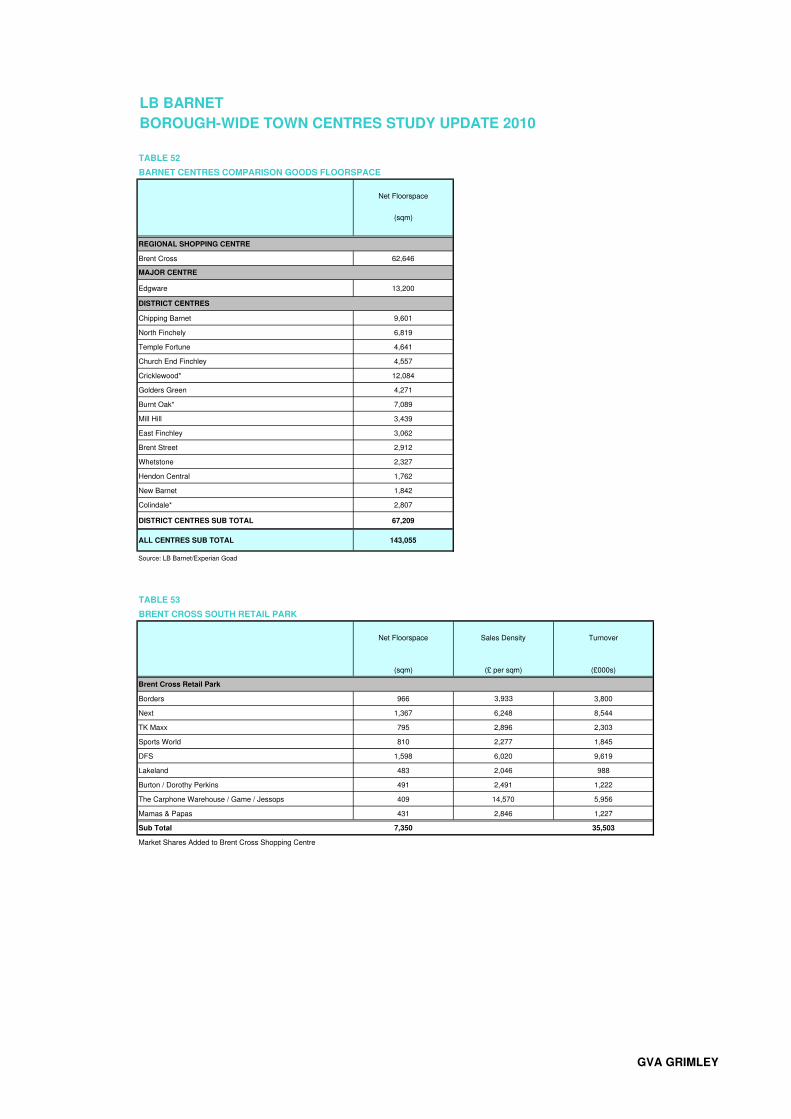
TABLE 52
BARNET CENTRES COMPARISON GOODS FLOORSPACE
Net Floorspace
(sqm)
Brent Cross 62,646
Edgware 13,200
Chipping Barnet 9,601
North Finchely 6,819
Temple Fortune 4,641
Church End Finchley 4,557
Cricklewood* 12,084
Golders Green 4,271
Burnt Oak* 7,089
Mill Hill 3,439
East Finchley 3,062
Brent Street 2,912
Whetstone 2,327
Hendon Central 1,762
New Barnet 1,842
Colindale* 2,807
DISTRICT CENTRES SUB TOTAL 67,209
ALL CENTRES SUB TOTAL 143,055
Source: LB Barnet/Experian Goad
TABLE 53
BRENT CROSS SOUTH RETAIL PARK
Net Floorspace Sales Density Turnover
(sqm) (£ per sqm) (£000s)
Borders 966 3,933 3,800
Next 1,367 6,248 8,544
TK Maxx 795 2,896 2,303
Sports World 810 2,277 1,845
DFS 1,598 6,020 9,619
Lakeland 483 2,046 988
Burton / Dorothy Perkins 491 2,491 1,222
The Carphone Warehouse / Game / Jessops 409 14,570 5,956
Mamas & Papas 431 2,846 1,227
Sub Total 7,350 35,503
Market Shares Added to Brent Cross Shopping Centre
DISTRICT CENTRES
MAJOR CENTRE
REGIONAL SHOPPING CENTRE
Brent Cross Retail Park
LB BARNET
BOROUGH-WIDE TOWN CENTRES STUDY UPDATE 2010
GVA GRIMLEY
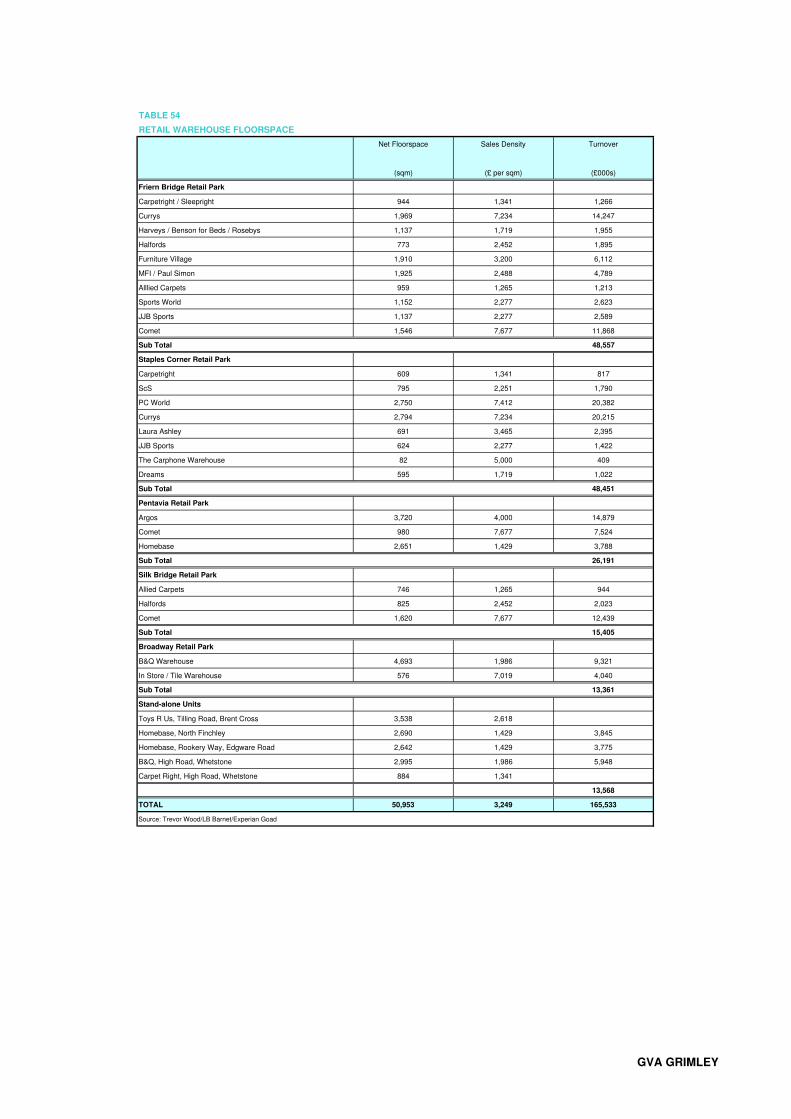
TABLE 54
RETAIL WAREHOUSE FLOORSPACE
Net Floorspace Sales Density Turnover
(sqm) (£ per sqm) (£000s)
Friern Bridge Retail Park
Carpetright / Sleepright 944 1,341 1,266
Currys 1,969 7,234 14,247
Harveys / Benson for Beds / Rosebys 1,137 1,719 1,955
Halfords 773 2,452 1,895
Furniture Village 1,910 3,200 6,112
MFI / Paul Simon 1,925 2,488 4,789
Alllied Carpets 959 1,265 1,213
Sports World 1,152 2,277 2,623
JJB Sports 1,137 2,277 2,589
Comet 1,546 7,677 11,868
Sub Total 48,557
Staples Corner Retail Park
Carpetright 609 1,341 817
ScS 795 2,251 1,790
PC World 2,750 7,412 20,382
Currys 2,794 7,234 20,215
Laura Ashley 691 3,465 2,395
JJB Sports 624 2,277 1,422
The Carphone Warehouse 82 5,000 409
Dreams 595 1,719 1,022
Sub Total 48,451
Pentavia Retail Park
Argos 3,720 4,000 14,879
Comet 980 7,677 7,524
Homebase 2,651 1,429 3,788
Sub Total 26,191
Silk Bridge Retail Park
Allied Carpets 746 1,265 944
Halfords 825 2,452 2,023
Comet 1,620 7,677 12,439
Sub Total 15,405
Broadway Retail Park
B&Q Warehouse 4,693 1,986 9,321
In Store / Tile Warehouse 576 7,019 4,040
Sub Total 13,361
Stand-alone Units
Toys R Us, Tilling Road, Brent Cross 3,538 2,618
Homebase, North Finchley 2,690 1,429 3,845
Homebase, Rookery Way, Edgware Road 2,642 1,429 3,775
B&Q, High Road, Whetstone 2,995 1,986 5,948
Carpet Right, High Road, Whetstone 884 1,341
13,568
TOTAL 50,953 3,249 165,533
Source: Trevor Wood/LB Barnet/Experian Goad
GVA GRIMLEY
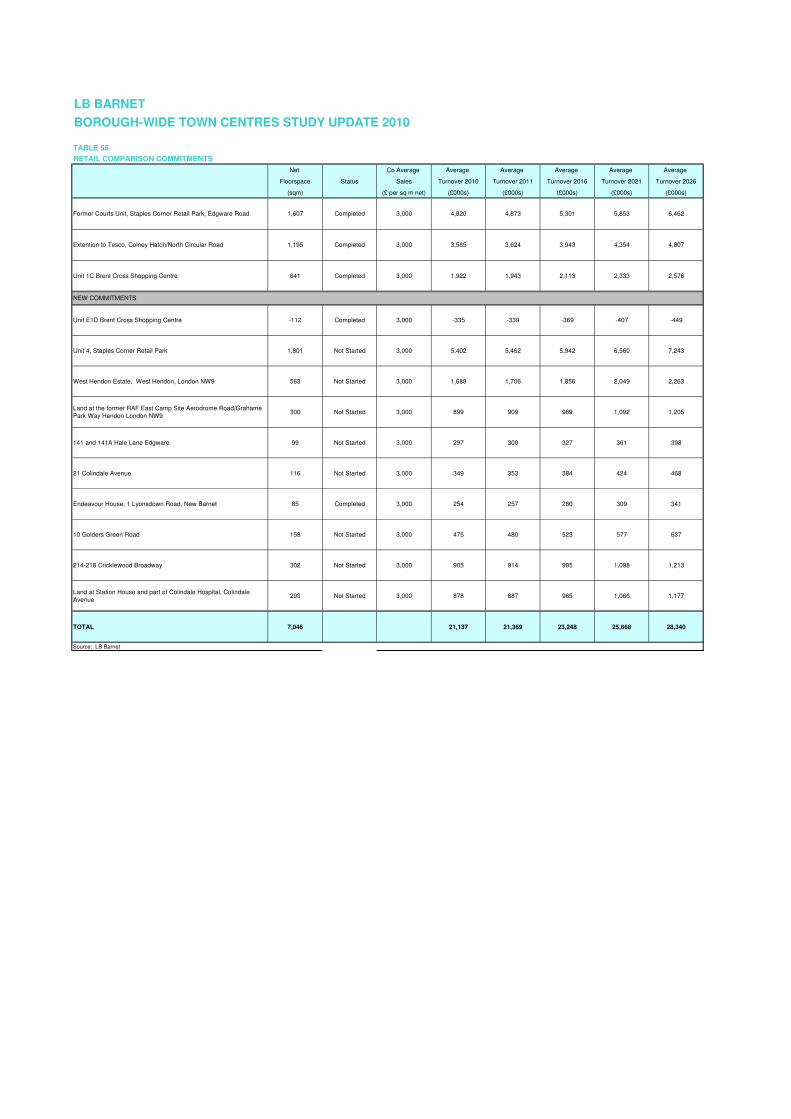
TABLE 55
RETAIL COMPARISON COMMITMENTS
Net Co Average Average Average Average Average Average
Floorspace Status Sales Turnover 2010 Turnover 2011 Turnover 2016 Turnover 2021 Turnover 2026
(sqm) (£ per sq m net) (£000s) (£000s) (£000s) (£000s) (£000s)
Former Courts Unit, Staples Corner Retail Park, Edgware Road 1,607 Completed 3,000 4,820 4,873 5,301 5,853 6,462
Extention to Tesco, Colney Hatch/North Circular Road 1,195 Completed 3,000 3,585 3,624 3,943 4,354 4,807
Unit 1C Brent Cross Shopping Centre 641 Completed 3,000 1,922 1,943 2,113 2,333 2,576
NEW COMMITMENTS
Unit E1D Brent Cross Shopping Centre -112 Completed 3,000 -335 -339 -369 -407 -449
Unit 4, Staples Corner Retail Park 1,801 Not Started 3,000 5,402 5,462 5,942 6,560 7,243
West Hendon Estate, West Hendon, London NW9 563 Not Started 3,000 1,688 1,706 1,856 2,049 2,263
Land at the former RAF East Camp Site Aerodrome Road/Grahame
Park Way Hendon London NW9300 Not Started 3,000 899 909 989 1,092 1,205
141 and 141A Hale Lane Edgware 99 Not Started 3,000 297 300 327 361 398
21 Colindale Avenue 116 Not Started 3,000 349 353 384 424 468
Endeavour House, 1 Lyonsdown Road, New Barnet 85 Completed 3,000 254 257 280 309 341
10 Golders Green Road 158 Not Started 3,000 475 480 523 577 637
214-218 Cricklewood Broadway 302 Not Started 3,000 905 914 995 1,098 1,213
Land at Station House and part of Colindale Hospital, Colindale
Avenue293 Not Started 3,000 878 887 965 1,066 1,177
TOTAL 7,046 21,137 21,369 23,248 25,668 28,340
Source: LB Barnet
LB BARNET
BOROUGH-WIDE TOWN CENTRES STUDY UPDATE 2010
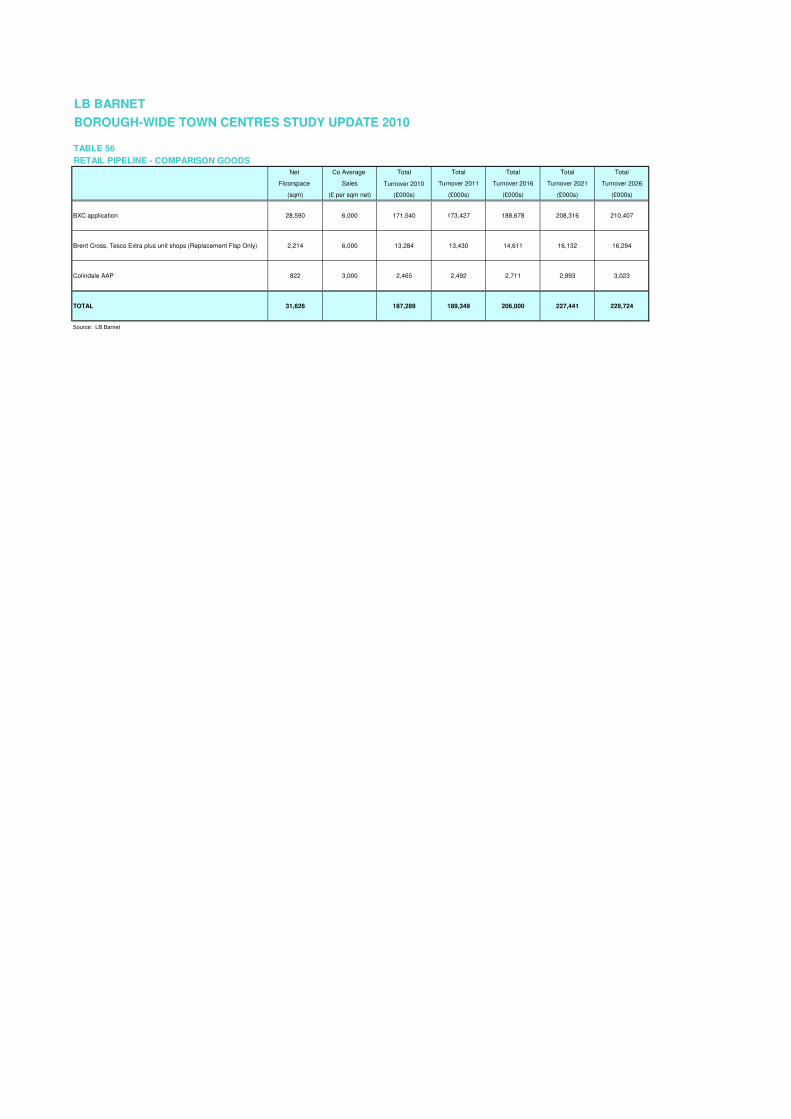
TABLE 56
RETAIL PIPELINE - COMPARISON GOODS
Net Co Average Total Total Total Total Total
Floorspace Sales Turnover 2010 Turnover 2011 Turnover 2016 Turnover 2021 Turnover 2026
(sqm) (£ per sqm net) (£000s) (£000s) (£000s) (£000s) (£000s)
BXC application 28,590 6,000 171,540 173,427 188,678 208,316 210,407
Brent Cross, Tesco Extra plus unit shops (Replacement Flsp Only) 2,214 6,000 13,284 13,430 14,611 16,132 16,294
Colindale AAP 822 3,000 2,465 2,492 2,711 2,993 3,023
TOTAL 31,626 187,289 189,349 206,000 227,441 229,724
Source: LB Barnet
BOROUGH-WIDE TOWN CENTRES STUDY UPDATE 2010
LB BARNET
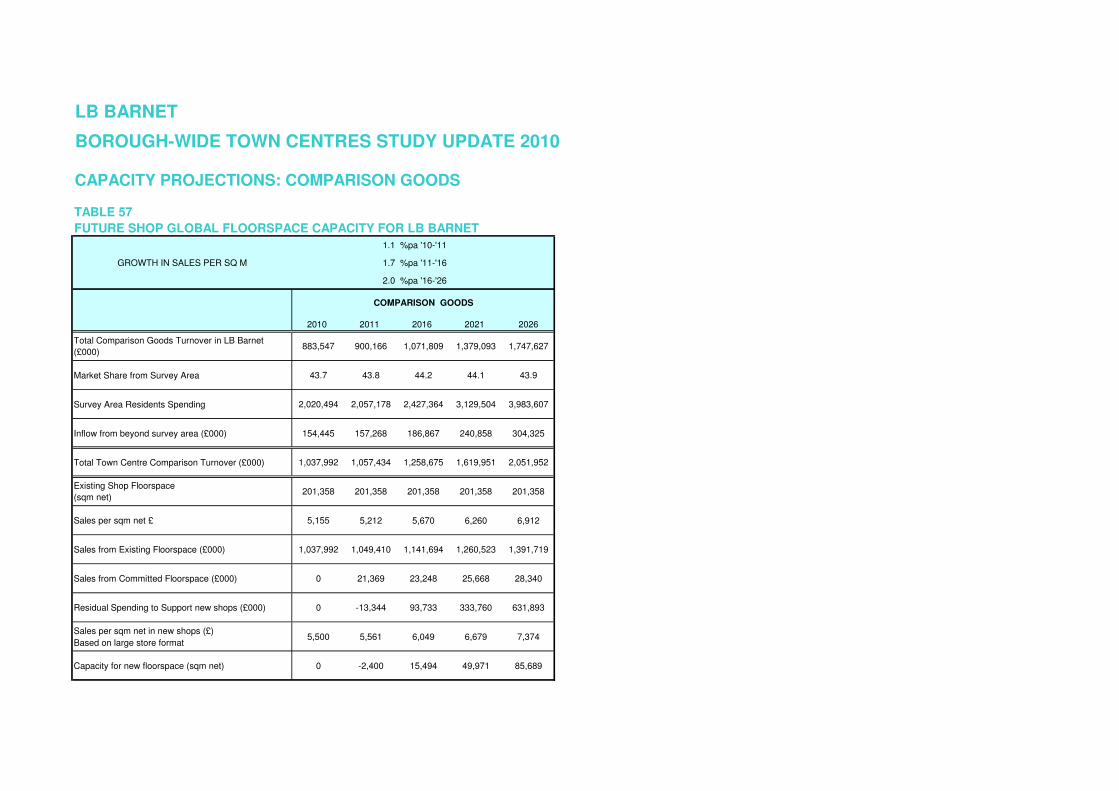
LB BARNET
BOROUGH-WIDE TOWN CENTRES STUDY UPDATE 2010
CAPACITY PROJECTIONS: COMPARISON GOODS
TABLE 57
FUTURE SHOP GLOBAL FLOORSPACE CAPACITY FOR LB BARNET
1.1 %pa '10-'11
GROWTH IN SALES PER SQ M 1.7 %pa '11-'16
2.0 %pa '16-'26
2010 2011 2016 2021 2026
Total Comparison Goods Turnover in LB Barnet
(£000)883,547 900,166 1,071,809 1,379,093 1,747,627
Market Share from Survey Area 43.7 43.8 44.2 44.1 43.9
Survey Area Residents Spending 2,020,494 2,057,178 2,427,364 3,129,504 3,983,607
Inflow from beyond survey area (£000) 154,445 157,268 186,867 240,858 304,325
Total Town Centre Comparison Turnover (£000) 1,037,992 1,057,434 1,258,675 1,619,951 2,051,952
Existing Shop Floorspace
(sqm net) 201,358 201,358 201,358 201,358 201,358
Sales per sqm net £ 5,155 5,212 5,670 6,260 6,912
Sales from Existing Floorspace (£000) 1,037,992 1,049,410 1,141,694 1,260,523 1,391,719
Sales from Committed Floorspace (£000) 0 21,369 23,248 25,668 28,340
Residual Spending to Support new shops (£000) 0 -13,344 93,733 333,760 631,893
Sales per sqm net in new shops (£)
Based on large store format5,500 5,561 6,049 6,679 7,374
Capacity for new floorspace (sqm net) 0 -2,400 15,494 49,971 85,689
COMPARISON GOODS

LB BARNET
BOROUGH-WIDE TOWN CENTRES STUDY UPDATE 2010
CAPACITY PROJECTIONS: COMPARISON GOODS
TABLE 60
FUTURE SHOP FLOORSPACE CAPACITY FOR EAST SUB AREA
1.1 %pa '10-'11
GROWTH IN SALES PER SQ M 1.7 %pa '11-'16
2.0 %pa '16-'26
2010 2011 2016 2021 2026
Total Comparison Goods Turnover in LB Barnet
(£000)150,315 151,861 173,030 220,192 274,773
Market Share from Survey Area 7.4 7.4 7.1 7.0 6.9
Survey Area Residents Spending 2,020,494 2,057,178 2,427,364 3,129,504 3,983,607
Inflow to Friern Bridge Retail Park (25%) from beyond
survey area (£000)11,762 11,862 13,391 16,991 21,366
Total Town Centre Comparison Turnover (£000) 162,077 163,723 186,421 237,183 296,139
Existing Shop Floorspace
(sqm net) 67,495 67,495 67,495 67,495 67,495
Sales per sqm net £ 2,401 2,428 2,641 2,916 3,220
Sales from Existing Floorspace (£000) 162,077 163,860 178,270 196,824 217,310
Sales from Committed Floorspace (£000) 0 3,624 3,943 4,354 4,807
Residual Spending to Support new shops (£000) 0 -3,762 4,208 36,005 74,022
Sales per sqm net in new shops (£)
Based on large store format5,500 5,561 6,049 6,679 7,374
Capacity for new floorspace (sqm net) 0 -676 696 5,391 10,038
COMPARISON GOODS

LB BARNET
BOROUGH-WIDE TOWN CENTRES STUDY UPDATE 2010
CAPACITY PROJECTIONS: COMPARISON GOODS
TABLE 61
FUTURE SHOP FLOORSPACE CAPACITY FOR SOUTH WEST
1.1 %pa '10-'11
GROWTH IN SALES PER SQ M 1.7 %pa '11-'16
2.0 %pa '16-'26
2010 2011 2016 2021 2026
Total Comparison Goods Turnover in LB Barnet
(£000)589,294 601,087 721,695 931,540 1,177,875
Market Share from Survey Area 29.2 29.2 29.7 29.8 29.6
Survey Area Residents Spending 2,020,494 2,057,178 2,427,364 3,129,504 3,983,607
Inflow Brent Cross and Staples Corner Retail Park
from beyond survey area (£000)142,683 145,406 173,476 223,867 282,959
Total Town Centre Comparison Turnover (£000) 731,977 746,494 895,171 1,155,407 1,460,834
Existing Shop Floorspace
(sqm net) 177,133 177,133 177,133 177,133 177,133
Sales per sqm net £ 4,132 4,178 4,545 5,018 5,541
Sales from Existing Floorspace (£000) 731,977 740,029 805,107 888,903 981,421
Sales from Committed Floorspace (£000) 0 14,558 15,839 17,487 19,307
Residual Spending to Support new shops (£000) 0 -8,094 74,225 249,017 460,106
Sales per sqm net in new shops (£)
Based on large store format5,500 5,561 6,049 6,679 7,374
Capacity for new floorspace (sqm net) 0 -1,456 12,270 37,283 62,393
COMPARISON GOODS

LB BARNET
BOROUGH-WIDE TOWN CENTRES STUDY UPDATE 2010
CAPACITY PROJECTIONS: COMPARISON GOODS
TABLE 62
FUTURE SHOP FLOORSPACE CAPACITY FOR SOUTH EAST
1.1 %pa '10-'11
GROWTH IN SALES PER SQ M 1.7 %pa '11-'16
2.0 %pa '16-'26
2010 2011 2016 2021 2026
Total Comparison Goods Turnover in LB Barnet
(£000)10,515 10,591 11,958 15,556 18,974
Market Share from Survey Area 0.5 0.5 0.5 0.5 0.5
Survey Area Residents Spending 2,020,494 2,057,178 2,427,364 3,129,504 3,983,607
Inflow from beyond survey area (£000) 0 0 0 0 0
Total Town Centre Comparison Turnover (£000) 10,515 10,591 11,958 15,556 18,974
Existing Shop Floorspace
(sqm net) 11,824 11,824 11,824 11,824 11,824
Sales per sqm net £ 889 899 978 1,080 1,192
Sales from Existing Floorspace (£000) 10,515 10,631 11,566 12,769 14,098
Sales from Committed Floorspace (£000) 0 480 523 577 637
Residual Spending to Support new shops (£000) 0 -520 -130 2,210 4,239
Sales per sqm net in new shops (£)
Based on large store format5,500 5,561 6,049 6,679 7,374
Capacity for new floorspace (sqm net) 0 -93 -21 331 575
COMPARISON GOODS

LB BARNET
BOROUGH-WIDE TOWN CENTRES STUDY UPDATE 2010
CAPACITY PROJECTIONS: COMPARISON GOODS
TABLE 58
FUTURE SHOP FLOORSPACE CAPACITY NORTH SUB AREA
1.1 %pa '10-'11
GROWTH IN SALES PER SQ M 1.7 %pa '11-'16
2.0 %pa '16-'26
2010 2011 2016 2021 2026
Total Comparison Goods Turnover in LB Barnet
(£000)26,160 26,464 30,396 38,573 48,856
Market Share from Survey Area 1.3 1.3 1.3 1.2 1.2
Survey Area Residents Spending 2,020,494 2,057,178 2,427,364 3,129,504 3,983,607
Inflow from beyond survey area (£000) 0 0 0 0 0
Total Town Centre Comparison Turnover (£000) 26,160 26,464 30,396 38,573 48,856
Existing Shop Floorspace
(sqm net) 11,443 11,443 11,443 11,443 11,443
Sales per sqm net £ 2,286 2,311 2,515 2,776 3,065
Sales from Existing Floorspace (£000) 26,160 26,448 28,774 31,768 35,075
Sales from Committed Floorspace (£000) 0 257 280 309 341
Residual Spending to Support new shops (£000) 0 -241 1,343 6,496 13,440
Sales per sqm net in new shops (£)
Based on large store format5,500 5,561 6,049 6,679 7,374
Capacity for new floorspace (sqm net) 0 -43 222 973 1,823
COMPARISON GOODS
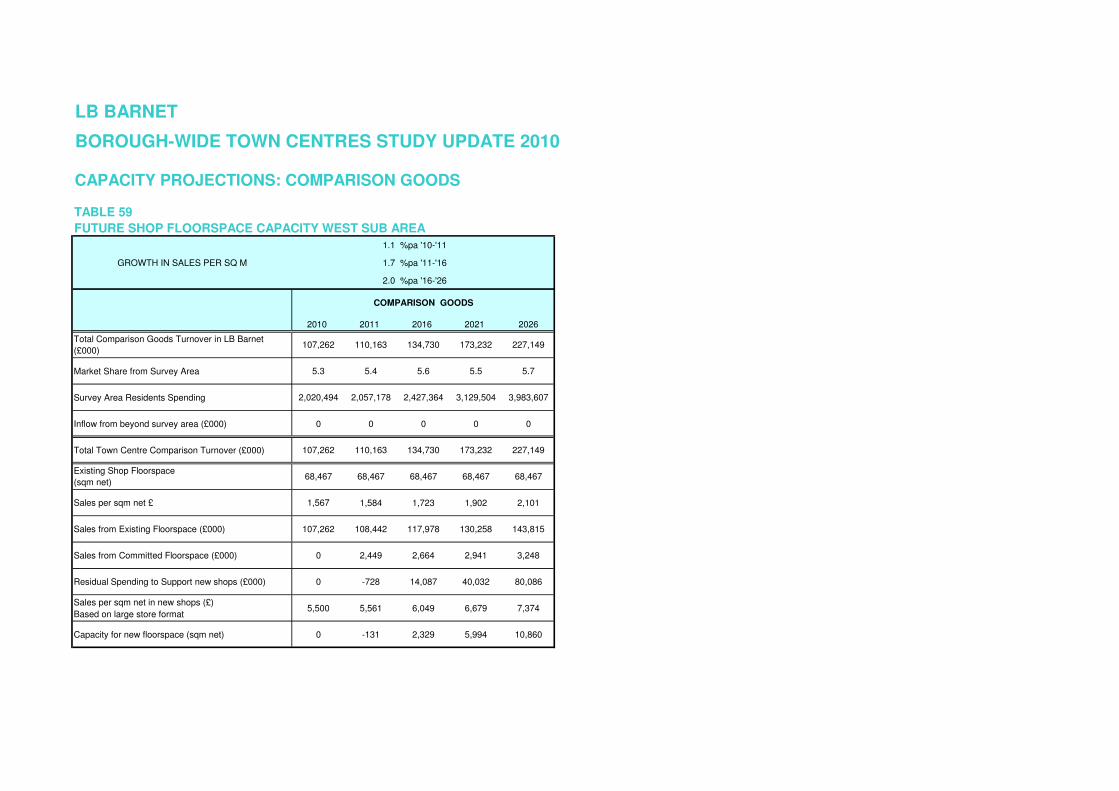
LB BARNET
BOROUGH-WIDE TOWN CENTRES STUDY UPDATE 2010
CAPACITY PROJECTIONS: COMPARISON GOODS
TABLE 59
FUTURE SHOP FLOORSPACE CAPACITY WEST SUB AREA
1.1 %pa '10-'11
GROWTH IN SALES PER SQ M 1.7 %pa '11-'16
2.0 %pa '16-'26
2010 2011 2016 2021 2026
Total Comparison Goods Turnover in LB Barnet
(£000)107,262 110,163 134,730 173,232 227,149
Market Share from Survey Area 5.3 5.4 5.6 5.5 5.7
Survey Area Residents Spending 2,020,494 2,057,178 2,427,364 3,129,504 3,983,607
Inflow from beyond survey area (£000) 0 0 0 0 0
Total Town Centre Comparison Turnover (£000) 107,262 110,163 134,730 173,232 227,149
Existing Shop Floorspace
(sqm net) 68,467 68,467 68,467 68,467 68,467
Sales per sqm net £ 1,567 1,584 1,723 1,902 2,101
Sales from Existing Floorspace (£000) 107,262 108,442 117,978 130,258 143,815
Sales from Committed Floorspace (£000) 0 2,449 2,664 2,941 3,248
Residual Spending to Support new shops (£000) 0 -728 14,087 40,032 80,086
Sales per sqm net in new shops (£)
Based on large store format5,500 5,561 6,049 6,679 7,374
Capacity for new floorspace (sqm net) 0 -131 2,329 5,994 10,860
COMPARISON GOODS
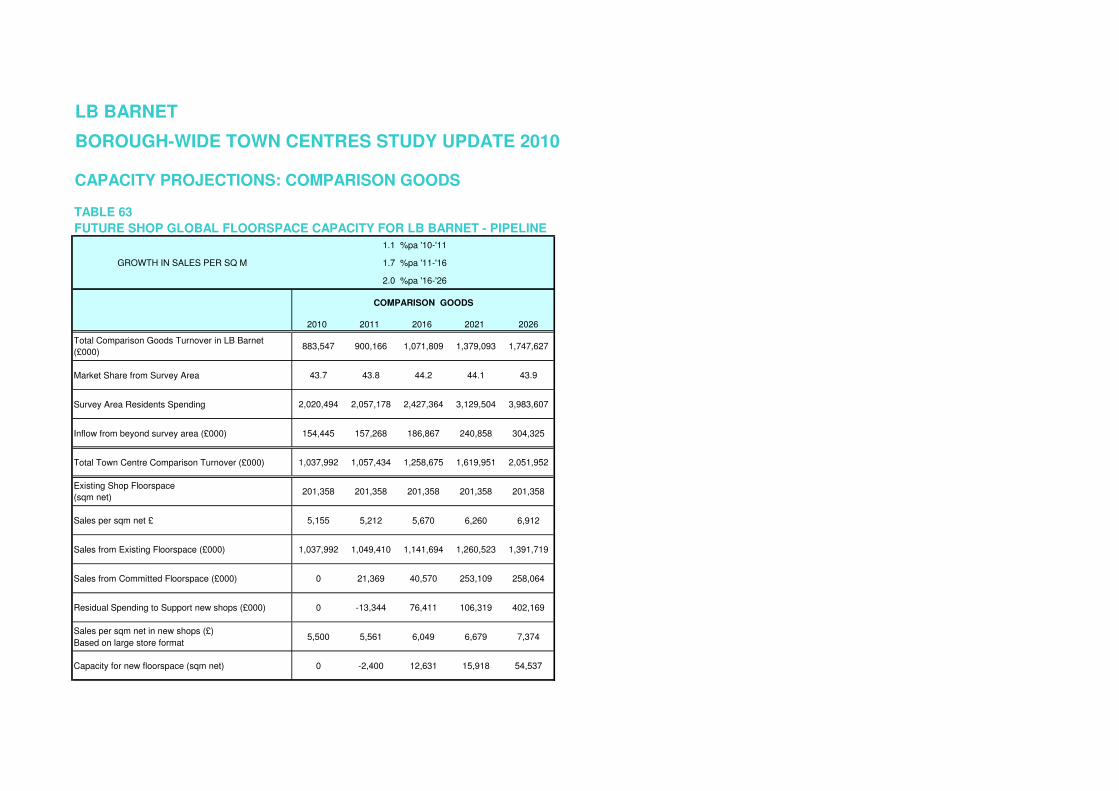
LB BARNET
BOROUGH-WIDE TOWN CENTRES STUDY UPDATE 2010
CAPACITY PROJECTIONS: COMPARISON GOODS
TABLE 63
FUTURE SHOP GLOBAL FLOORSPACE CAPACITY FOR LB BARNET - PIPELINE
1.1 %pa '10-'11
GROWTH IN SALES PER SQ M 1.7 %pa '11-'16
2.0 %pa '16-'26
2010 2011 2016 2021 2026
Total Comparison Goods Turnover in LB Barnet
(£000)883,547 900,166 1,071,809 1,379,093 1,747,627
Market Share from Survey Area 43.7 43.8 44.2 44.1 43.9
Survey Area Residents Spending 2,020,494 2,057,178 2,427,364 3,129,504 3,983,607
Inflow from beyond survey area (£000) 154,445 157,268 186,867 240,858 304,325
Total Town Centre Comparison Turnover (£000) 1,037,992 1,057,434 1,258,675 1,619,951 2,051,952
Existing Shop Floorspace
(sqm net) 201,358 201,358 201,358 201,358 201,358
Sales per sqm net £ 5,155 5,212 5,670 6,260 6,912
Sales from Existing Floorspace (£000) 1,037,992 1,049,410 1,141,694 1,260,523 1,391,719
Sales from Committed Floorspace (£000) 0 21,369 40,570 253,109 258,064
Residual Spending to Support new shops (£000) 0 -13,344 76,411 106,319 402,169
Sales per sqm net in new shops (£)
Based on large store format5,500 5,561 6,049 6,679 7,374
Capacity for new floorspace (sqm net) 0 -2,400 12,631 15,918 54,537
COMPARISON GOODS
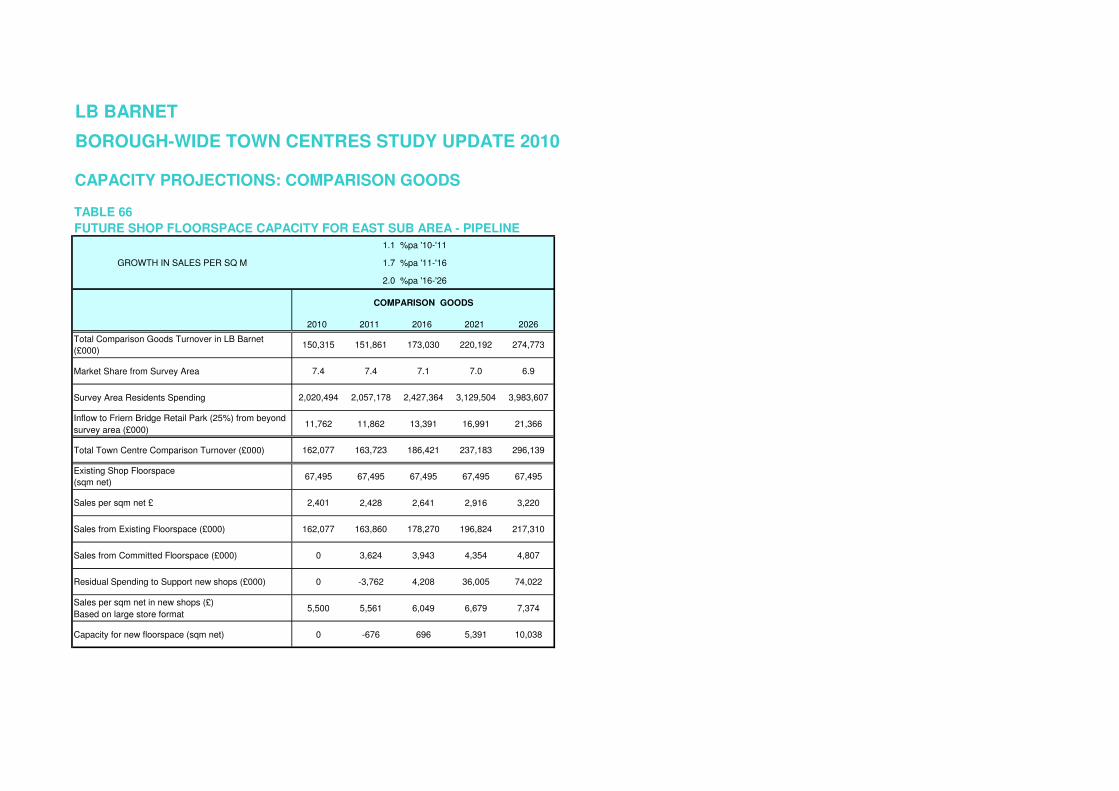
LB BARNET
BOROUGH-WIDE TOWN CENTRES STUDY UPDATE 2010
CAPACITY PROJECTIONS: COMPARISON GOODS
TABLE 66
FUTURE SHOP FLOORSPACE CAPACITY FOR EAST SUB AREA - PIPELINE
1.1 %pa '10-'11
GROWTH IN SALES PER SQ M 1.7 %pa '11-'16
2.0 %pa '16-'26
2010 2011 2016 2021 2026
Total Comparison Goods Turnover in LB Barnet
(£000)150,315 151,861 173,030 220,192 274,773
Market Share from Survey Area 7.4 7.4 7.1 7.0 6.9
Survey Area Residents Spending 2,020,494 2,057,178 2,427,364 3,129,504 3,983,607
Inflow to Friern Bridge Retail Park (25%) from beyond
survey area (£000)11,762 11,862 13,391 16,991 21,366
Total Town Centre Comparison Turnover (£000) 162,077 163,723 186,421 237,183 296,139
Existing Shop Floorspace
(sqm net) 67,495 67,495 67,495 67,495 67,495
Sales per sqm net £ 2,401 2,428 2,641 2,916 3,220
Sales from Existing Floorspace (£000) 162,077 163,860 178,270 196,824 217,310
Sales from Committed Floorspace (£000) 0 3,624 3,943 4,354 4,807
Residual Spending to Support new shops (£000) 0 -3,762 4,208 36,005 74,022
Sales per sqm net in new shops (£)
Based on large store format5,500 5,561 6,049 6,679 7,374
Capacity for new floorspace (sqm net) 0 -676 696 5,391 10,038
COMPARISON GOODS
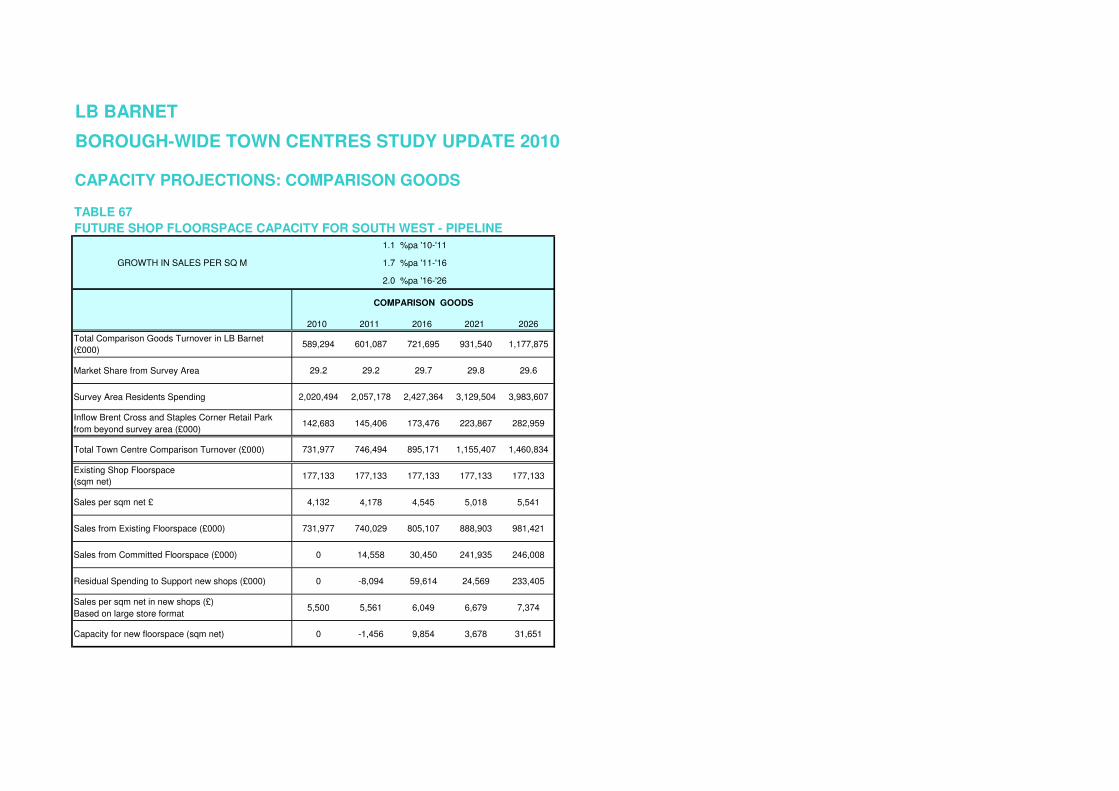
LB BARNET
BOROUGH-WIDE TOWN CENTRES STUDY UPDATE 2010
CAPACITY PROJECTIONS: COMPARISON GOODS
TABLE 67
FUTURE SHOP FLOORSPACE CAPACITY FOR SOUTH WEST - PIPELINE
1.1 %pa '10-'11
GROWTH IN SALES PER SQ M 1.7 %pa '11-'16
2.0 %pa '16-'26
2010 2011 2016 2021 2026
Total Comparison Goods Turnover in LB Barnet
(£000)589,294 601,087 721,695 931,540 1,177,875
Market Share from Survey Area 29.2 29.2 29.7 29.8 29.6
Survey Area Residents Spending 2,020,494 2,057,178 2,427,364 3,129,504 3,983,607
Inflow Brent Cross and Staples Corner Retail Park
from beyond survey area (£000)142,683 145,406 173,476 223,867 282,959
Total Town Centre Comparison Turnover (£000) 731,977 746,494 895,171 1,155,407 1,460,834
Existing Shop Floorspace
(sqm net) 177,133 177,133 177,133 177,133 177,133
Sales per sqm net £ 4,132 4,178 4,545 5,018 5,541
Sales from Existing Floorspace (£000) 731,977 740,029 805,107 888,903 981,421
Sales from Committed Floorspace (£000) 0 14,558 30,450 241,935 246,008
Residual Spending to Support new shops (£000) 0 -8,094 59,614 24,569 233,405
Sales per sqm net in new shops (£)
Based on large store format5,500 5,561 6,049 6,679 7,374
Capacity for new floorspace (sqm net) 0 -1,456 9,854 3,678 31,651
COMPARISON GOODS

LB BARNET
BOROUGH-WIDE TOWN CENTRES STUDY UPDATE 2010
CAPACITY PROJECTIONS: COMPARISON GOODS
TABLE 68
FUTURE SHOP FLOORSPACE CAPACITY FOR SOUTH EAST - PIPELINE
1.1 %pa '10-'11
GROWTH IN SALES PER SQ M 1.7 %pa '11-'16
2.0 %pa '16-'26
2010 2011 2016 2021 2026
Total Comparison Goods Turnover in LB Barnet
(£000)10,515 10,591 11,958 15,556 18,974
Market Share from Survey Area 0.5 0.5 0.5 0.5 0.5
Survey Area Residents Spending 2,020,494 2,057,178 2,427,364 3,129,504 3,983,607
Inflow from beyond survey area (£000) 0 0 0 0 0
Total Town Centre Comparison Turnover (£000) 10,515 10,591 11,958 15,556 18,974
Existing Shop Floorspace
(sqm net) 11,824 11,824 11,824 11,824 11,824
Sales per sqm net £ 889 899 978 1,080 1,192
Sales from Existing Floorspace (£000) 10,515 10,631 11,566 12,769 14,098
Sales from Committed Floorspace (£000) 0 480 523 577 637
Residual Spending to Support new shops (£000) 0 -520 -130 2,210 4,239
Sales per sqm net in new shops (£)
Based on large store format5,500 5,561 6,049 6,679 7,374
Capacity for new floorspace (sqm net) 0 -93 -21 331 575
COMPARISON GOODS
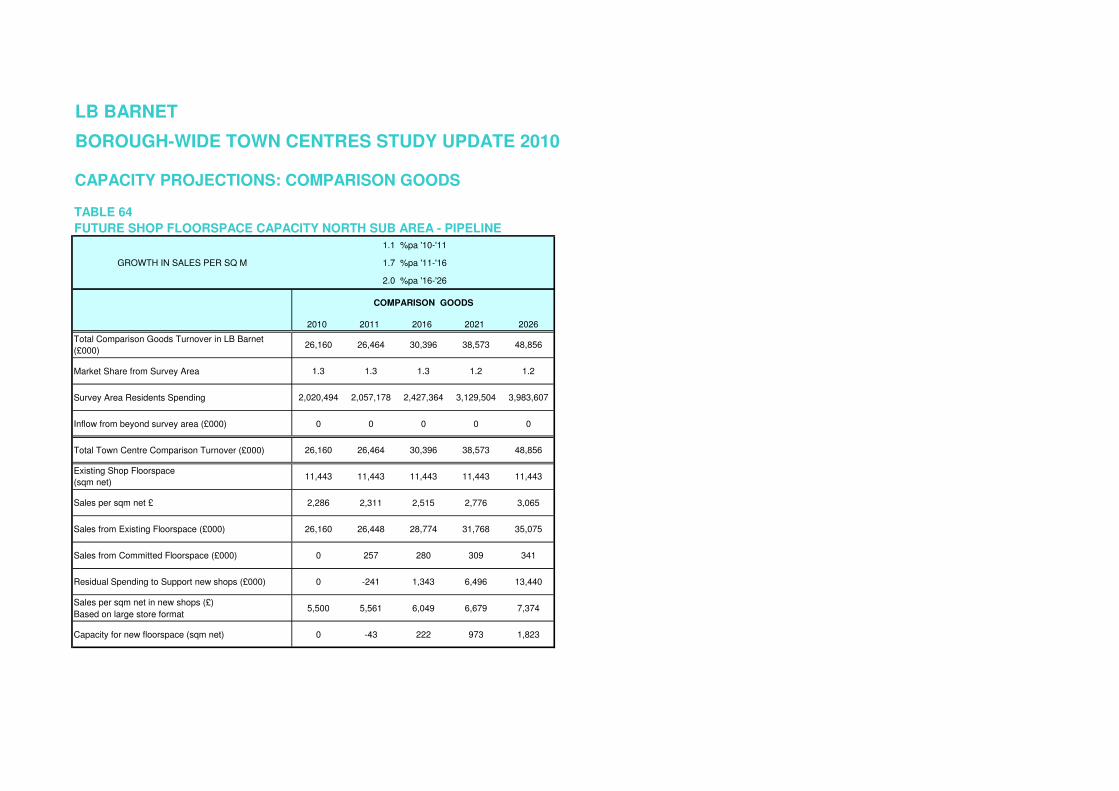
LB BARNET
BOROUGH-WIDE TOWN CENTRES STUDY UPDATE 2010
CAPACITY PROJECTIONS: COMPARISON GOODS
TABLE 64
FUTURE SHOP FLOORSPACE CAPACITY NORTH SUB AREA - PIPELINE
1.1 %pa '10-'11
GROWTH IN SALES PER SQ M 1.7 %pa '11-'16
2.0 %pa '16-'26
2010 2011 2016 2021 2026
Total Comparison Goods Turnover in LB Barnet
(£000)26,160 26,464 30,396 38,573 48,856
Market Share from Survey Area 1.3 1.3 1.3 1.2 1.2
Survey Area Residents Spending 2,020,494 2,057,178 2,427,364 3,129,504 3,983,607
Inflow from beyond survey area (£000) 0 0 0 0 0
Total Town Centre Comparison Turnover (£000) 26,160 26,464 30,396 38,573 48,856
Existing Shop Floorspace
(sqm net) 11,443 11,443 11,443 11,443 11,443
Sales per sqm net £ 2,286 2,311 2,515 2,776 3,065
Sales from Existing Floorspace (£000) 26,160 26,448 28,774 31,768 35,075
Sales from Committed Floorspace (£000) 0 257 280 309 341
Residual Spending to Support new shops (£000) 0 -241 1,343 6,496 13,440
Sales per sqm net in new shops (£)
Based on large store format5,500 5,561 6,049 6,679 7,374
Capacity for new floorspace (sqm net) 0 -43 222 973 1,823
COMPARISON GOODS

LB BARNET
BOROUGH-WIDE TOWN CENTRES STUDY UPDATE 2010
CAPACITY PROJECTIONS: COMPARISON GOODS
TABLE 65
FUTURE SHOP FLOORSPACE CAPACITY WEST SUB AREA - PIPELINE
1.1 %pa '10-'11
GROWTH IN SALES PER SQ M 1.7 %pa '11-'16
2.0 %pa '16-'26
2010 2011 2016 2021 2026
Total Comparison Goods Turnover in LB Barnet
(£000)107,262 110,163 134,730 173,232 227,149
Market Share from Survey Area 5.3 5.4 5.6 5.5 5.7
Survey Area Residents Spending 2,020,494 2,057,178 2,427,364 3,129,504 3,983,607
Inflow from beyond survey area (£000) 0 0 0 0 0
Total Town Centre Comparison Turnover (£000) 107,262 110,163 134,730 173,232 227,149
Existing Shop Floorspace
(sqm net) 68,467 68,467 68,467 68,467 68,467
Sales per sqm net £ 1,567 1,584 1,723 1,902 2,101
Sales from Existing Floorspace (£000) 107,262 108,442 117,978 130,258 143,815
Sales from Committed Floorspace (£000) 0 2,449 5,375 5,934 6,270
Residual Spending to Support new shops (£000) 0 -728 11,376 37,040 77,063
Sales per sqm net in new shops (£)
Based on large store format5,500 5,561 6,049 6,679 7,374
Capacity for new floorspace (sqm net) 0 -131 1,881 5,546 10,450
COMPARISON GOODS