towardsgreen electronics - greenpeace.org · tox i c suba n e, rplk - fh d ... 4.72 4.67 4.65 4.47...
TRANSCRIPT

GREENELECTRONICSSURVEY #3JANUARY 2011
Towards greenelectronicsGetting greener, but not there yet
©GREENPEACE/JURAJRIZMAN
Greenpeace International 3
Contents
Introduction 4
Survey criteria 7
Main findings 11
Summary of results 13
Observations 17
The way forward 21
Annex 1 25
Detailed scores 31
For further information, contact:
Published in January 2011 by
Greenpeace International
Ottho Heldringstraat 5
1066 AZ Amsterdam
The Netherlands
Tel: +31 20 7182000
Fax: +31 20 7182002
JN340
Greenpeace International 3
Introduction
Greenpeace congratulates the electronicsindustry onmaking progress themanytechnical hurdles it has been facing - but wealso show that the industry hasn’t finishedfinding green solutions just yet.In June 2010, we invited 21 leading electronics companiesto participate in our third Green Electronics Survey. Thecompanies were asked to submit their greenest productsfrom across six categories. Eighteen companies rose to thechallenge, sharing their most prized environmentally-friendly products with us as we assessed the greenestelectronics products that will be available on the market inearly 2011.
Green Electronics Campaign andthe Guide to Greener ElectronicsGreenpeace launched the Green Electronics campaign in 2005 toempower electronic consumers to demand greener products and theelectronics industry to take responsibly for the impacts of its ownproducts’ lifecycles. Through our ’Guide to Greener Electronics‘1, werank 18 leading electronicsmanufacturers on three criteria; removingtoxic substances, responsible take-back of their end-of-life productsand energy efficiency. Initially this quarterly publication focused onleading computer andmobile phone producers and their policies andpractices on just two of these criteria; toxic chemicals and take-back.Since then the Guide has expanded to include producers oftelevisions and games consoles. The fruits of this campaign are anincrease in e-waste recycling policies and programmes and stricterchemical management by both governments and companies, as wellas greener products in the hands of consumers.
As companies havemade increasingly stronger commitments tothese three criteria, Greenpeace has sought to assess the tangibleoutcomes; the actual products coming into the global marketplace.Using information submitted by companies in late 2007, we publishedthe first edition of our Green Products Survey2 in March 2008, duringthe international electronics fair CEBIT, held in Hanover, Germany. Thereport wasmet with enthusiasm from the industry and consumersalike, and sowe released a second edition in January 20093 duringthe annual CES electronics fair in Las Vegas, USA. Unlike the rankingof manufacturers in the ’Guide to Greener Electronics‘ describedabove, which focuses on overall corporate policies and practices,these surveys consisted of an in-depth evaluation of the products thatthemanufacturers themselves considered to be their greenest.
The first edition revealed that none of the surveyed products couldclaim the title of being truly green, with only a few products barelyscoring 5 out of 10 points. The second product survey reflected theprogress of the companies who chose to participate. Progress wasparticularly noticeable in the designing-out of toxic chemicals fromproducts; more scores were above the highest score of 5/10 from theprevious edition, and the gaps between company’s scores shrank.These changes revealed themore competitive environment betweenthe brands that had emerged. Yet, despite a notably improvedperformance in themonitors category, it was evident that progresswas still neededwithin the industry. As a result Greenpeaceadvocated for further efforts in all products categories before a ’trulygreen‘ consumer product could emerge on themarket. Since this lastsurvey, the industry has shown considerable progress in deliveringgreener products, and therefore we decided that a third edition of theproduct survey was necessary.
1 http://www.greenpeace.org/international/en/campaigns/toxics/electronics/Guide-to-Greener-Electronics/2 http://www.greenpeace.org/international/press/releases/cebit-talks-green-but-the-ind/3 http://www.greenpeace.org/usa/en/media-center/reports/green-electronics-the-search/
4 Greenpeace International
Greenpeace International 5
Further room for improvement:While Greenpeace applauds the progress that has beenmade,there are many hurdles the industry has yet to overcome.Throughout a product’s lifecycle - frommaterial extraction toproduction, and from consumer use to disposal - electronicproducts have the potential to impact human health and theenvironment - including through the release of dangeroussubstances - and energy consumption.
Over the course of our Green Electronics campaign, we haveshown howworkers at the disposal end of an electronic products’life are being exposed to a toxic cocktail of hazardous chemicals.Without the complete elimination of these substances fromelectronic products, and strong regulation that bans the export ofhazardous waste from developed to developing nations, theseworkers will suffer at the hands of the industry. Likewise, at themanufacturing stage, the cheapest labour available is often used.This includes the extraction of precious metals for use in theproducts, in areas where little-to-no protection is given for thehealth and well-being of the workers involved. Given theenvironmental and social risks associated with irresponsiblesourcing and disposal of electronics, Greenpeace asks eachcompany to adhere to a progressive precautionary principle andsupport policies that create incentives for the safest possiblerecycling of obsolete products in every country that its products aresold. As we face the greatest environmental crisis of our time -climate change - the electronics industry must be at the forefront offinding the solutions necessary to lower our individual taxation onthe planet as well as its own. It is in these areas that the electronicsindustry has shown the least amount of progress.
What this third edition of the Green Electronics Survey proves,however, is that this is an incredibly competitive, innovative, andsolutions-based industry, capable of creating the changesnecessary to guarantee a sustainable lifecycle for each productmanufactured. From our first Guide to Greener Electronics in 2006to this third Survey in 2011, Greenpeace has seen the industry’sability to consistently put greener products on the market. Webelieve the industry has the ability to overcome these existingchallenges.
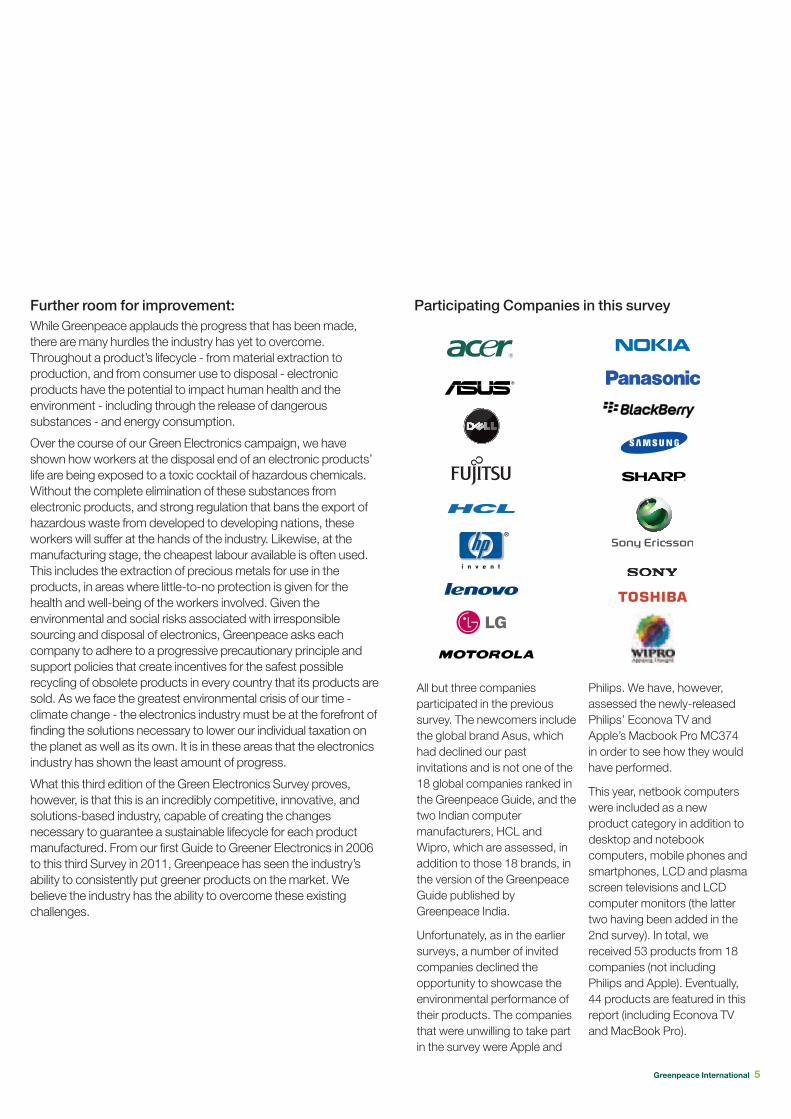
All but three companiesparticipated in the previoussurvey. The newcomers includethe global brand Asus, whichhad declined our pastinvitations and is not one of the18 global companies ranked inthe Greenpeace Guide, and thetwo Indian computermanufacturers, HCL andWipro, which are assessed, inaddition to those 18 brands, inthe version of the GreenpeaceGuide published byGreenpeace India.
Unfortunately, as in the earliersurveys, a number of invitedcompanies declined theopportunity to showcase theenvironmental performance oftheir products. The companiesthat were unwilling to take partin the survey were Apple and
Philips. We have, however,assessed the newly-releasedPhilips’ Econova TV andApple’s Macbook Pro MC374in order to see how they wouldhave performed.
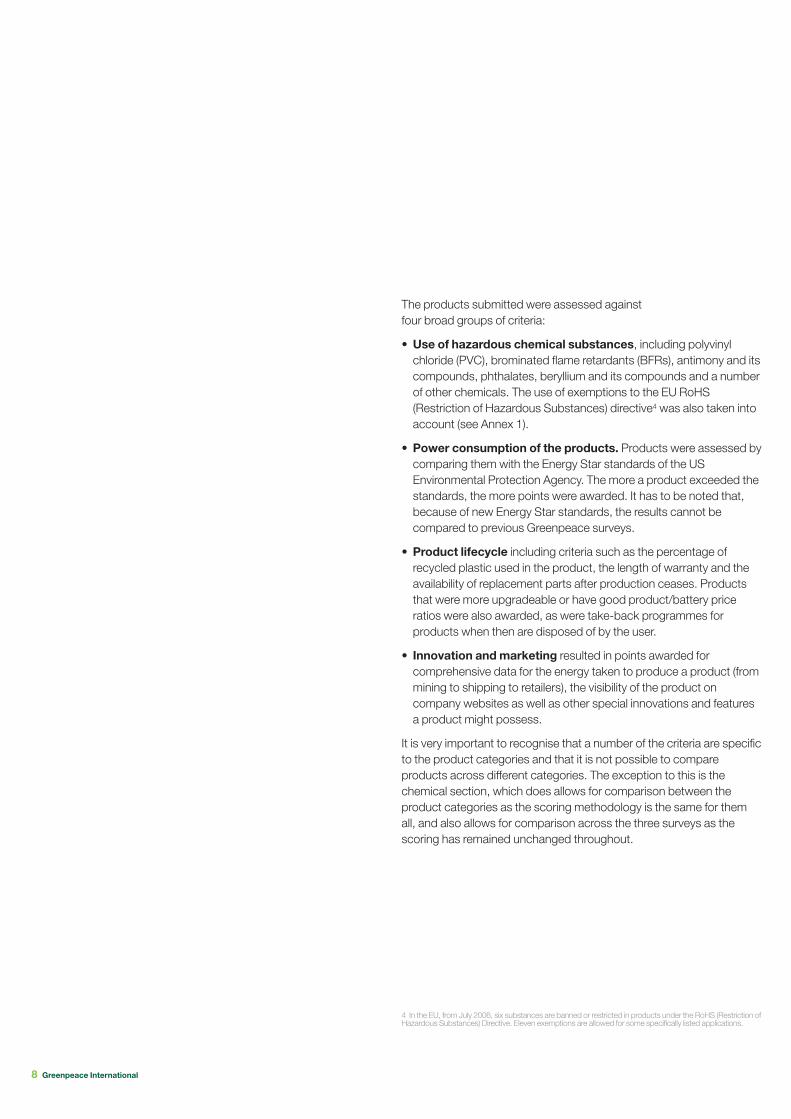
This year, netbook computerswere included as a newproduct category in addition todesktop and notebookcomputers, mobile phones andsmartphones, LCD and plasmascreen televisions and LCDcomputer monitors (the lattertwo having been added in the2nd survey). In total, wereceived 53 products from 18companies (not includingPhilips and Apple). Eventually,44 products are featured in thisreport (including Econova TVand MacBook Pro).
Participating Companies in this survey
©GREENPEACE/JURAJRIZMAN
Greenpeace International 7
Survey criteria
In June 2010, Greenpeace asked 21companies to submit the greenest productsthat would be on the market by November 1,2010. Eighteen companies submittedproducts.The leadingmanufacturers of desktop computers,notebooks, netbooks, computer monitors, mobile phones,smartphones as well as televisions were directly invited tosubmit their greenest products via an assessment form thatwas provided. In addition, the formwas published on theGreenpeace website and other forums to offer smallermanufacturers the opportunity to participate. For the firsttime twomajor Indian computer manufacturers have alsotaken part in the survey. In another first for this survey,companies were provided with a document detailing mostof the methodologies used for the scoring. This was donenot only to ensure that the companies could select theirhighest performing products, but also to increase thetransparency of the process.
The principles behind this year’s survey are very similar tothose in previous years, but slight adjustments have beenmade to our criteria. Each company was allowed to submitthree products per product category, which we thenassessed and scored against the criteria. If a companysubmitted more than one product in a category we chosethe highest-scoring device for inclusion in the report. Oncethe assessments were complete, companies were invitedto review them to ensure accurate product information.
8 Greenpeace International
The products submitted were assessed againstfour broad groups of criteria:
• Use of hazardous chemical substances, including polyvinylchloride (PVC), brominated flame retardants (BFRs), antimony and itscompounds, phthalates, beryllium and its compounds and a numberof other chemicals. The use of exemptions to the EU RoHS(Restriction of Hazardous Substances) directive4 was also taken intoaccount (see Annex 1).
• Power consumption of the products. Products were assessed bycomparing them with the Energy Star standards of the USEnvironmental Protection Agency. The more a product exceeded thestandards, the more points were awarded. It has to be noted that,because of new Energy Star standards, the results cannot becompared to previous Greenpeace surveys.
• Product lifecycle including criteria such as the percentage ofrecycled plastic used in the product, the length of warranty and theavailability of replacement parts after production ceases. Productsthat were more upgradeable or have good product/battery priceratios were also awarded, as were take-back programmes forproducts when then are disposed of by the user.
• Innovation andmarketing resulted in points awarded forcomprehensive data for the energy taken to produce a product (frommining to shipping to retailers), the visibility of the product oncompany websites as well as other special innovations and featuresa product might possess.
It is very important to recognise that a number of the criteria are specificto the product categories and that it is not possible to compareproducts across different categories. The exception to this is thechemical section, which does allows for comparison between theproduct categories as the scoring methodology is the same for themall, and also allows for comparison across the three surveys as thescoring has remained unchanged throughout.
4 In the EU, from July 2006, six substances are banned or restricted in products under the RoHS (Restriction ofHazardous Substances) Directive. Eleven exemptions are allowed for some specifically listed applications.
Greenpeace International 9
HProducts submitted by each company:
Acer
Asus
Dell
Fujitsu
HCL
HP (incl. Palm)
Lenovo
LG Electronics
Motorola
Nokia
Panasonic
RIM
Samsung
Sharp
Sony
Sony Ericsson
Toshiba
Wipro
Total
Notebooks
!
!
!
!
!
!
!
!
!
!
10
Desktops
!
!
!
!
!
5
Netbooks
!
!
!
!
!
5
Smartphones
!
!
!
!
!
!
6
Mobilephones
!
!
!
!
!
5
Monitors
!
!
!
!
!
!
!
7
TVs
!
!
!
!
4
Total
3
4
5
2
1
5
1
1
1
2
2
1
6
1
2
2
1
2
42
©GREENPEACE/JURAJRIZMAN
Greenpeace International 11
Main findings
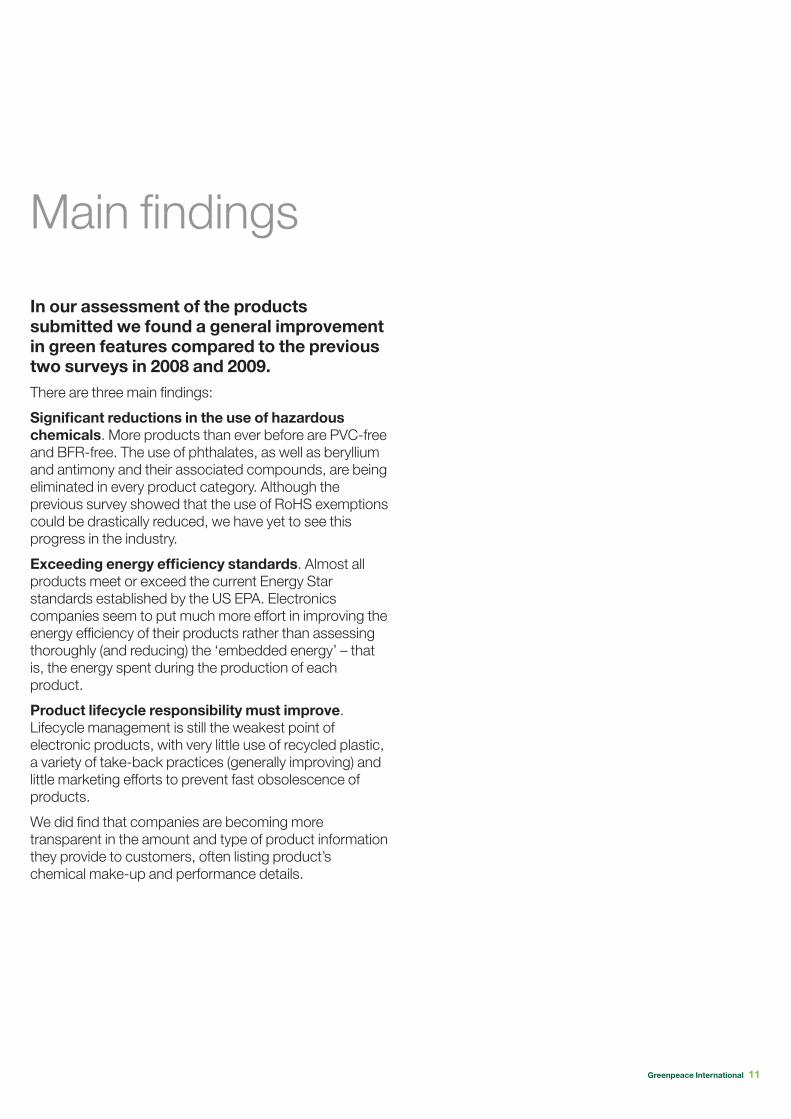
In our assessment of the productssubmitted we found a general improvementin green features compared to the previoustwo surveys in 2008 and 2009.There are three main findings:
Significant reductions in the use of hazardouschemicals. More products than ever before are PVC-freeand BFR-free. The use of phthalates, as well as berylliumand antimony and their associated compounds, are beingeliminated in every product category. Although theprevious survey showed that the use of RoHS exemptionscould be drastically reduced, we have yet to see thisprogress in the industry.
Exceeding energy efficiency standards. Almost allproducts meet or exceed the current Energy Starstandards established by the US EPA. Electronicscompanies seem to put much more effort in improving theenergy efficiency of their products rather than assessingthoroughly (and reducing) the ‘embedded energy’ – thatis, the energy spent during the production of eachproduct.
Product lifecycle responsibility must improve.Lifecycle management is still the weakest point ofelectronic products, with very little use of recycled plastic,a variety of take-back practices (generally improving) andlittle marketing efforts to prevent fast obsolescence ofproducts.
We did find that companies are becoming moretransparent in the amount and type of product informationthey provide to customers, often listing product’schemical make-up and performance details.

©GREENPEACE/W
ILLROSE
Greenpeace International 13
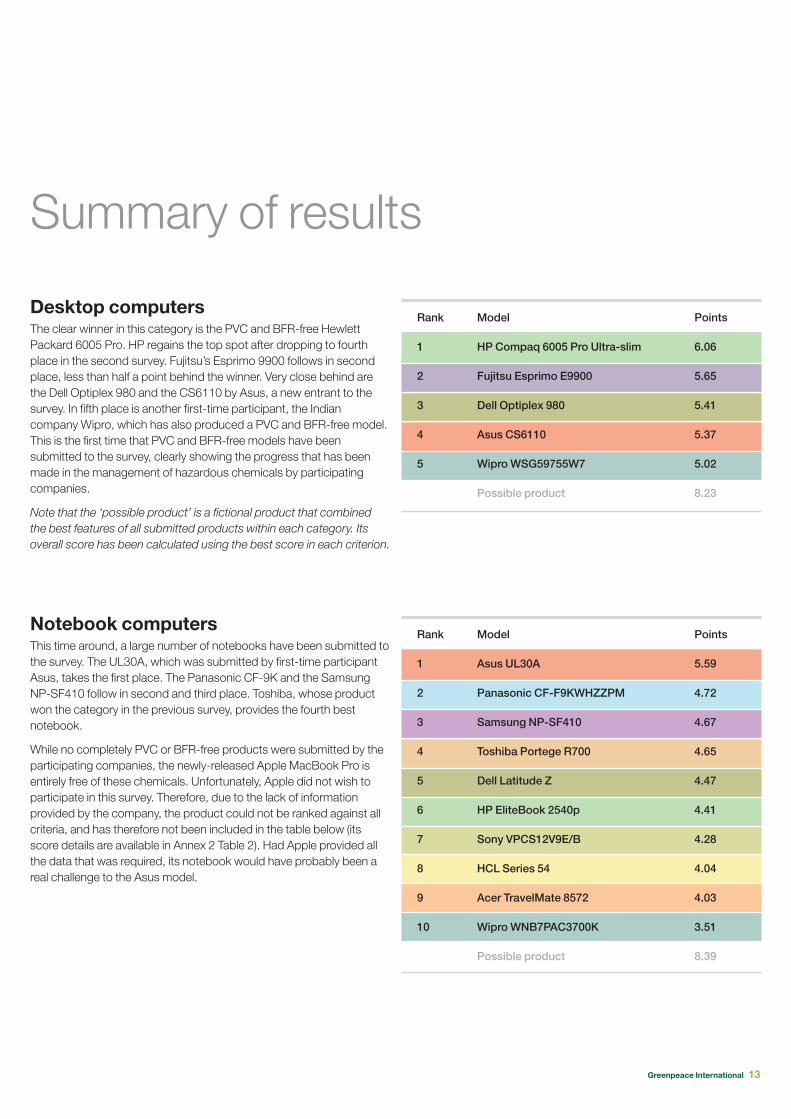
Summary of results
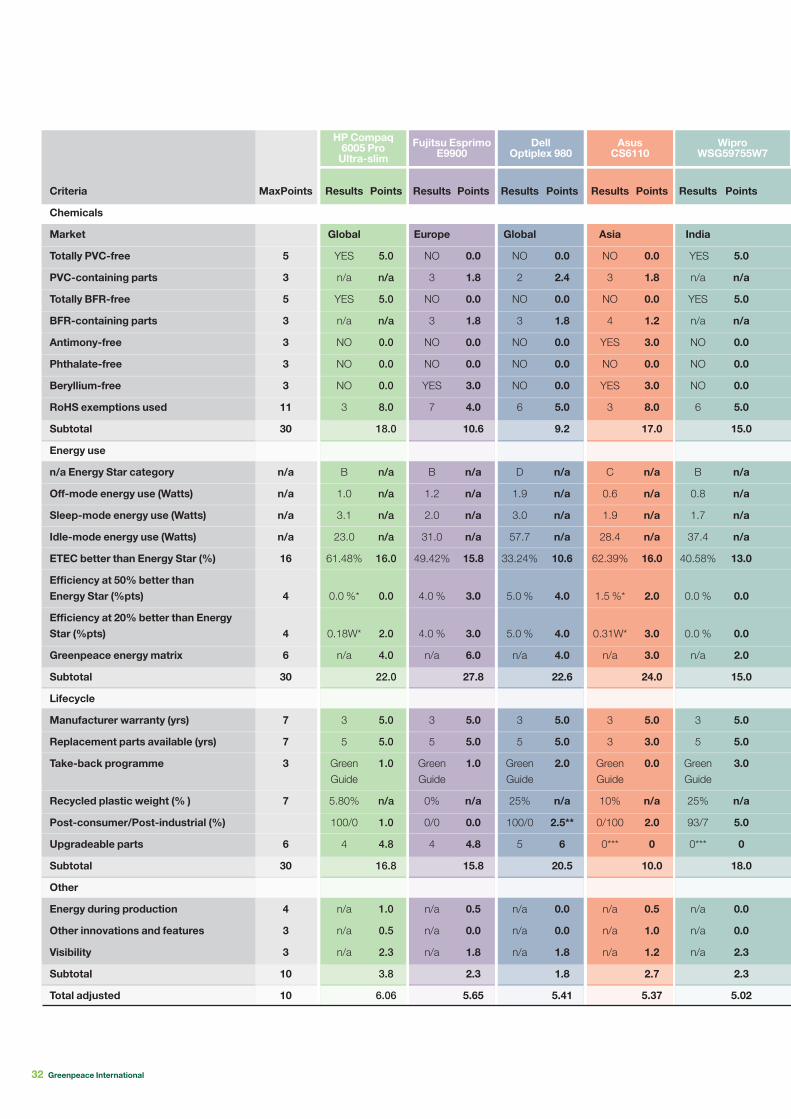
Desktop computersThe clear winner in this category is the PVC and BFR-free HewlettPackard 6005 Pro. HP regains the top spot after dropping to fourthplace in the second survey. Fujitsu’s Esprimo 9900 follows in secondplace, less than half a point behind the winner. Very close behind arethe Dell Optiplex 980 and the CS6110 by Asus, a new entrant to thesurvey. In fifth place is another first-time participant, the Indiancompany Wipro, which has also produced a PVC and BFR-free model.This is the first time that PVC and BFR-free models have beensubmitted to the survey, clearly showing the progress that has beenmade in the management of hazardous chemicals by participatingcompanies.
Note that the ‘possible product’ is a fictional product that combinedthe best features of all submitted products within each category. Itsoverall score has been calculated using the best score in each criterion.
Rank
1
2
3
4
5
Points
6.06
5.65
5.41
5.37
5.02
8.23
Model
HP Compaq 6005 Pro Ultra-slim
Fujitsu Esprimo E9900
Dell Optiplex 980
Asus CS6110
Wipro WSG59755W7
Possible product
Notebook computersThis time around, a large number of notebooks have been submitted tothe survey. The UL30A, which was submitted by first-time participantAsus, takes the first place. The Panasonic CF-9K and the SamsungNP-SF410 follow in second and third place. Toshiba, whose productwon the category in the previous survey, provides the fourth bestnotebook.
While no completely PVC or BFR-free products were submitted by theparticipating companies, the newly-released Apple MacBook Pro isentirely free of these chemicals. Unfortunately, Apple did not wish toparticipate in this survey. Therefore, due to the lack of informationprovided by the company, the product could not be ranked against allcriteria, and has therefore not been included in the table below (itsscore details are available in Annex 2 Table 2). Had Apple provided allthe data that was required, its notebook would have probably been areal challenge to the Asus model.
Rank
1
2
3
4
5
6
7
8
9
10
Points
5.59
4.72
4.67
4.65
4.47
4.41
4.28
4.04
4.03
3.51
8.39
Model
Asus UL30A
Panasonic CF-F9KWHZZPM
Samsung NP-SF410
Toshiba Portege R700
Dell Latitude Z
HP EliteBook 2540p
Sony VPCS12V9E/B
HCL Series 54
Acer TravelMate 8572
Wipro WNB7PAC3700K
Possible product
14 Greenpeace International
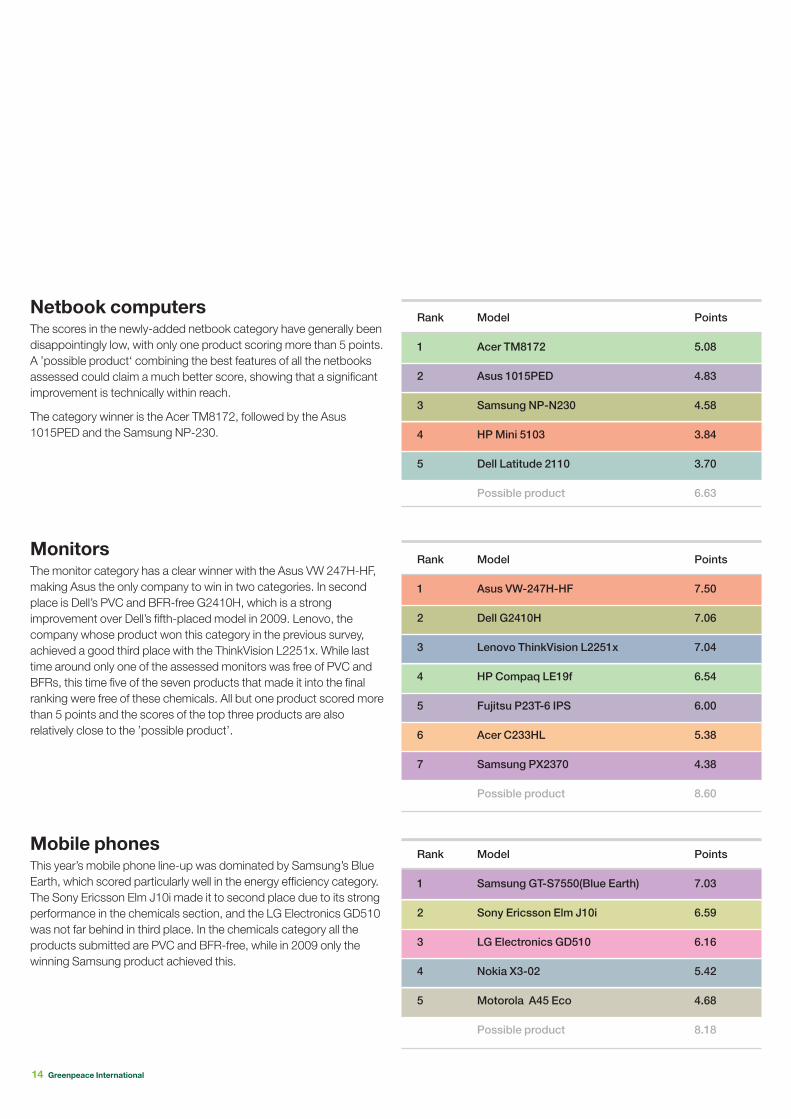
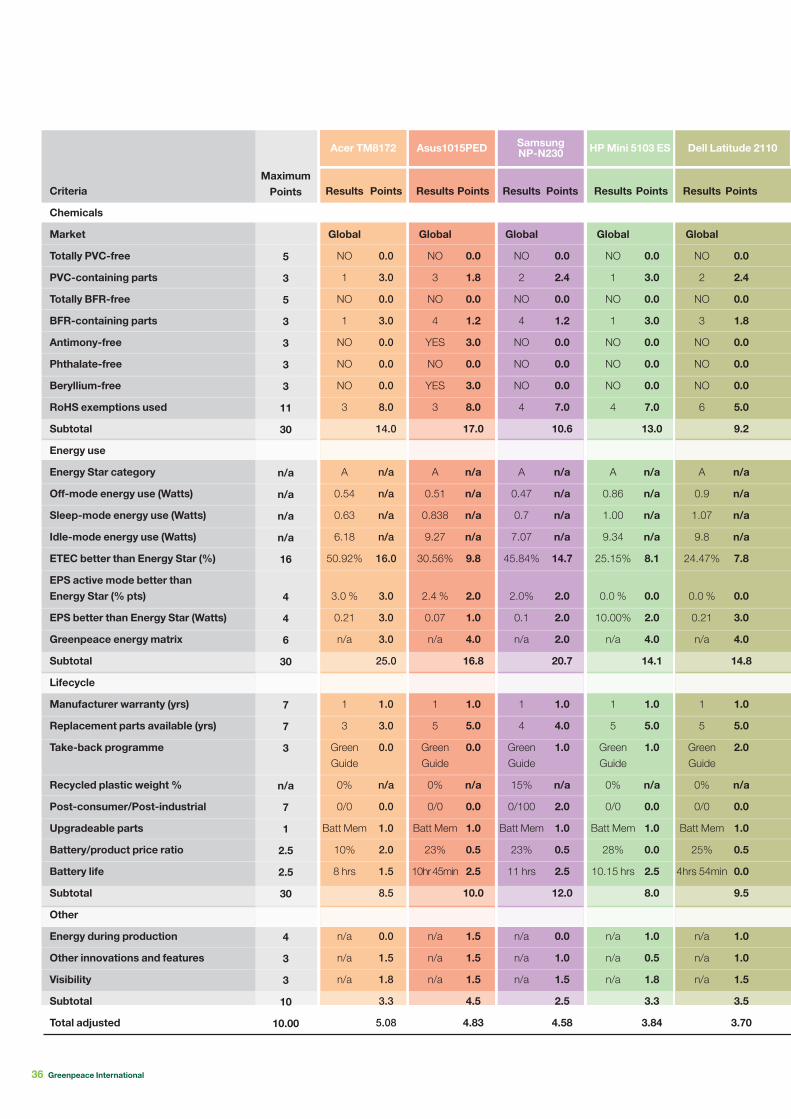
Netbook computersThe scores in the newly-added netbook category have generally beendisappointingly low, with only one product scoring more than 5 points.A ’possible product‘ combining the best features of all the netbooksassessed could claim a much better score, showing that a significantimprovement is technically within reach.
The category winner is the Acer TM8172, followed by the Asus1015PED and the Samsung NP-230.
Rank
1
2
3
4
5
Points
5.08
4.83
4.58
3.84
3.70
6.63
Model
Acer TM8172
Asus 1015PED
Samsung NP-N230
HPMini 5103
Dell Latitude 2110
Possible product
MonitorsThe monitor category has a clear winner with the Asus VW 247H-HF,making Asus the only company to win in two categories. In secondplace is Dell’s PVC and BFR-free G2410H, which is a strongimprovement over Dell’s fifth-placed model in 2009. Lenovo, thecompany whose product won this category in the previous survey,achieved a good third place with the ThinkVision L2251x. While lasttime around only one of the assessed monitors was free of PVC andBFRs, this time five of the seven products that made it into the finalranking were free of these chemicals. All but one product scored morethan 5 points and the scores of the top three products are alsorelatively close to the ’possible product’.
Rank
1
2
3
4
5
6
7
Points
7.50
7.06
7.04
6.54
6.00
5.38
4.38
8.60
Model
Asus VW-247H-HF
Dell G2410H
Lenovo ThinkVision L2251x
HP Compaq LE19f
Fujitsu P23T-6 IPS
Acer C233HL
Samsung PX2370
Possible product
Mobile phonesThis year’s mobile phone line-up was dominated by Samsung’s BlueEarth, which scored particularly well in the energy efficiency category.The Sony Ericsson Elm J10i made it to second place due to its strongperformance in the chemicals section, and the LG Electronics GD510was not far behind in third place. In the chemicals category all theproducts submitted are PVC and BFR-free, while in 2009 only thewinning Samsung product achieved this.
Rank
1
2
3
4
5
Points
7.03
6.59
6.16
5.42
4.68
8.18
Model
Samsung GT-S7550(Blue Earth)
Sony Ericsson Elm J10i
LG Electronics GD510
Nokia X3-02
Motorola A45 Eco
Possible product
Greenpeace International 15
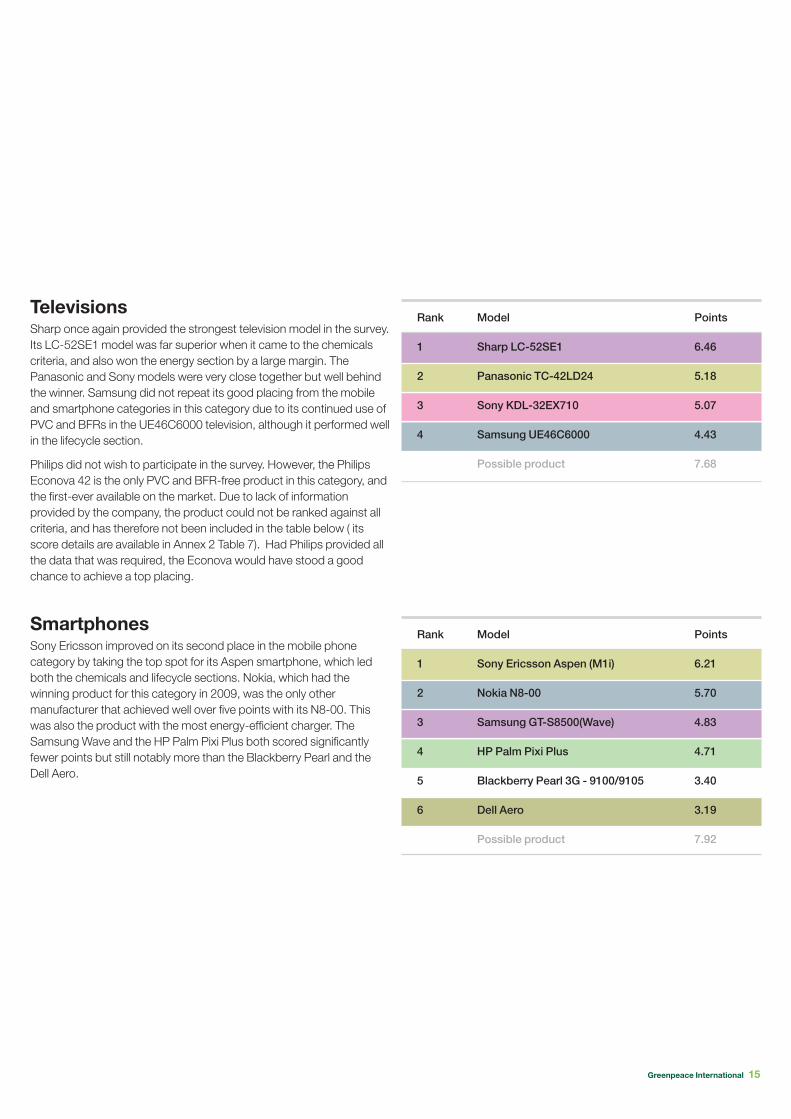
TelevisionsSharp once again provided the strongest television model in the survey.Its LC-52SE1 model was far superior when it came to the chemicalscriteria, and also won the energy section by a large margin. ThePanasonic and Sony models were very close together but well behindthe winner. Samsung did not repeat its good placing from the mobileand smartphone categories in this category due to its continued use ofPVC and BFRs in the UE46C6000 television, although it performed wellin the lifecycle section.
Philips did not wish to participate in the survey. However, the PhilipsEconova 42 is the only PVC and BFR-free product in this category, andthe first-ever available on the market. Due to lack of informationprovided by the company, the product could not be ranked against allcriteria, and has therefore not been included in the table below ( itsscore details are available in Annex 2 Table 7). Had Philips provided allthe data that was required, the Econova would have stood a goodchance to achieve a top placing.
SmartphonesSony Ericsson improved on its second place in the mobile phonecategory by taking the top spot for its Aspen smartphone, which ledboth the chemicals and lifecycle sections. Nokia, which had thewinning product for this category in 2009, was the only othermanufacturer that achieved well over five points with its N8-00. Thiswas also the product with the most energy-efficient charger. TheSamsung Wave and the HP Palm Pixi Plus both scored significantlyfewer points but still notably more than the Blackberry Pearl and theDell Aero.
Rank
1
2
3
4
Points
6.46
5.18
5.07
4.43
7.68
Model
Sharp LC-52SE1
Panasonic TC-42LD24
Sony KDL-32EX710
Samsung UE46C6000
Possible product
Rank
1
2
3
4
5
6
Points
6.21
5.70
4.83
4.71
3.40
3.19
7.92
Model
Sony Ericsson Aspen (M1i)
Nokia N8-00
Samsung GT-S8500(Wave)
HP Palm Pixi Plus
Blackberry Pearl 3G - 9100/9105
Dell Aero
Possible product
©GREENPEACE/J
URAJRIZMAN
Greenpeace International 17
Observations
Although it is not possible to make directcomparison between the scores awarded inthe two previous surveys with this one, as thescoring methodology changed significantly, itis obvious that enormous progress has beenachieved by the industry as a whole since ourlast report at CES 2009.For monitors already performing well last year, it is worthnoting that five out of seven scored at least 6 pointsincluding three above 7 points. Three out of five mobilephones scored over 6 points, with one above 7 points. Thethree remaining categories show room for improvement.Only one notebook out of ten, and one netbook out of five,score above 5 points, Smartphones/PDAs are notimproving as quickly as their mobile phone cousins, withonly three out of six scoring more than 5 points.
For all product categories except notebooks, a greaterdispersion of scores within categories is noticeablecompared to the previous survey. This means that, withinany one product category, manufacturers have a widerrange of achievements; competition leads to a collectiveimprovement but at various paces. For each category, wescored a ’possible product‘, - a fictional product combiningall the best features of the assessed products. In all cases,with the exception of netbooks, the ’possible product‘ hadhigh scores above 7 or even 8 points.
Depending of the product category, the best scoringproduct represents between 67% (notebooks) and 87%(monitors) of the points achievable by a ’possible product‘of the same category. This means that the best scoringnotebook includes fewer of all the available green featuresfor notebooks, while the best scoring monitor has less tolearn from its competitors. The latter situation is similar forthe best TV (84%) andmobile phone (86%). The bestscoring netbook, smartphone and desktop computer arearound 75% of their respective ’possible products‘ scores.When looking at the lowest scoring products from thecurrent survey, for most categories they embody around 50to 60% of their respective ’possible products‘ scores, withthe noticeable exceptions of the lowest scoring notebookand smartphone both around 40% only – a clear appeal forthe producers of those products to keep up with the greenrace or run the risk of getting left behind.
18 Greenpeace International
Eliminating hazardous substancesAlthough Greenpeace has previously served several penalty points inthe Guide for Greener Electronics for companies backtracking on theircommitments to eliminate PVC and BFRs, there is a clear shift on thisissue within the industry. The use of PVC and BFRs is on its way out, asis shown by the performances in this area of the survey.
All mobile phones in the survey are PVC-free - only 80% were in 2008.So, too, are four smartphones out of six (50% in 2008), five monitorsout of seven (one out of seven in 2008), two TVs out of five (none in2008) and two desktops out of five (none in 2008). Although none ofthe submitted notebooks and netbooks was totally PVC-free, sevennotebooks and two netbooks have only one part left to clean up; thepower supply components. As Apple’s MacBook managed to eliminatethese last uses of PVC and become the first 100% PVC-free notebookcomputer, there is no longer a technical hurdle for the rest of theindustry to overcome.
For BFRs, overall performance is a little behind that for PVC. Productsthat are 100% BFR-free include all of the submitted mobile phones, fivemonitors out of seven (one out of seven in 2008), two desktops out offive (none in 2008 - and, interestingly, these are the same productswhich are 100% PVC-free as well), three smartphones out of six (nonein 2008), one TV out of five (none in 2008), thanks to the addition ofPhilips’ Econova (also PVC-free) and two notebooks out of eleven(none in 2008). For notebooks, it is worth noticing that this wasachieved by Apple’s MacBook again but also by Wipro, an Indianbrand. The rest of the notebooks are lagging behind in this respect,with only Acer having just one part left to clean up (oddly, the housing,so not a difficult task). No netbook was 100% BFR-free, but two out offive also have only one remaining part containing BFRs.
Despite the progress made on eliminating PVC and BFRs, other toxicchemicals are still present in many electronic products. Beryllium andits compounds and phthalates have mostly been eliminated in mobilephones, smartphones and monitors, although for other productcategories, their elimination is still the exception. The elimination ofantimony and its compounds is not as pronounced, and its use can befound across all product categories.
The RoHS (Restriction of Hazardous Substances) Directive is a keyEuropean directive that is helping to eliminate toxic chemicals fromconsumer electronic products, including certain toxic metals andcertain BFRs..Some temporary exemptions allow the use of RoHSregulated substances for specific uses where substitution is notcurrently possible. There is no firm trend observable regarding the useof RoHS exemptions by the producers of the products assessed in thissurvey. Generally, brands seem to repeat their performance in the lastsurvey for the same product line although sometimes a slight increase
or decrease in the number of exemptions used can be found. Althoughour two previous surveys identified that the use of exemptions couldpotentially be reduced to only two or three for all product categories,there seems to have been no significant effort made by any one brandor by the industry as a whole in working towards overcoming the needto make use of RoHS exemptions. While RoHS exemptions should beviewed as temporary loopholes giving the industry sufficient time to findsolutions to comply with the regulation, it appears that they are insteadregarded as acceptable elements of product design.
Other positive steps taken in the field of chemicals include theelimination of arsenic in screen glass and a reduction in mercury due tothe increasing use of LED displays. These steps were already identifiedin the last survey but - disappointingly - haven’t yet become commonpractice in all the relevant product categories.
Energy Star standardsWith the strengthening of new Energy Star standards and significantchange in the scoring methodology in this latest survey, a directcomparison of scores between all three product surveys to date is notpossible.
In this survey, the vast majority of products match or exceed therespective Energy Star standards. For desktops, monitors, mobilephones and TVs, the ’possible product‘ could get the maximum scoreof 30 points in the energy section. The best-scoring product in eachcategory is also very close to the score of its respective ’possibleproduct‘, in particular for desktops, mobile phones, TVs and netbooks.On the contrary, the laggards in each category scored far worse,despite being technically capable of much better, particularly in thenotebooks (29% of the points obtainable by a ’possible‘ notebook),mobile phones (17%) and smartphones (13%)
There seems to be a shared recognition in the industry of the need toprovide consumers with information on energy features, power-savingand the links to climate change from the product’s use. Although notstrictly similar in its items, our methodology to score this across theseven product categories allows comparison between their respectiveperformances. The average level of information is clearly highest for themobile phone category (average of 5.5 points out of 6 allocated to thisissue); it is followed by TVs (4.3) and smartphones (4.25) while othercategories stand between 3.4 and 3.8 points. Yet for all categoriesexcept mobile phones and netbooks there was a great dispersion ofscores, showing again a wide range of achievement between 3 and 6points. Mobiles phones were all between 5 and 6 points whilenetbooks were packed between 2 and 4 points.
Greenpeace International 19
Lifecycle managementThe use of post-consumer recycled plastic is not yet standard practicefor notebook and netbook computers and smartphones. This holdstrue for even post-industrial recycled plastic. No firm trend can be setfor TVs, which looked promising last year. Three product categories areclearly leading the way on this matter: monitors, desktop computersand mobile phones. Efforts were already acknowledged for monitors inthe previous survey; they are new for the two other categories andseem to focus on post-consumer recycled plastic, which we applaud.In the mobile phone category, Sony Ericsson even reaches the topscore of 7 points, which rewards a product containing at least 50% ofpost-industrial recycled plastic per weight of plastic; its Elm phonebeats this bar by 10%.
The minimum warranties offered across the industry never go beyondthree years, a standard shared by all desktops submitted this year anda majority of computer monitors. It is of huge concern that the majorityof notebooks, netbooks and TVs do not offer more than a one-yearcontract, lining up with both phone categories in this respect. Amongthe latter, it is also disappointing to see Nokia step back from the two-year warranty offers acknowledged in the previous survey.
The availability of replacement parts allows all product categories, withthe exception of phones, to improve their scores in this lifecycle set ofcriteria. For phones, the reduced availability over time is certainly linkedto the short lifespan of these mobile devices and to their scheme oftechnical evolution.
Energy during productionCompanies must track and disclose the amount of energy used duringproduction of electronic devices. Although more companies areinvesting in this area, it is still largely insufficient. Improvements neededinclude expanding the data collected to include all steps of productionfrom supply chain to post-assembly shipping of products. Figures mustalso be product-specific and the disclosure of information must bemore complete. Only three companies have a more advancedcollection of data; Apple, and to a lesser extent, Motorola and Nokia.
VisibilityThe prominence of these greener products on the respective websitesof their manufacturers has improved for all categories except for TVs,which scored the best in the last edition. There is room forimprovement in showcasing these greener products and to ensure thatgreener products are not just useful talking points for green marketingcampaigns, but part of the company’s standard operating practice.
©GREENPEACE/J
URAJRIZMAN
Greenpeace International 21
The way forward
The present survey showcases some of thegreenest products available on the market in thesecond half of 2010.
Greenpeace’s product survey highlights importantinformation for consumers and electronic manufacturersalike. By reviewing all three product surveys, consumers areable to witness the progress made by the IT industry overthe past three years and therefore the type of progress theyshould expect and demand in the future. This is a highlycompetitive industry and Greenpeace’s Green Electronicscampaign has been able to harness this competitiontowards achieving greater sustainability. In addition, thesurvey allowsmanufacturers themselves to betterunderstand what is possible by seeing how their greenestproduct compares to others on the market. Lawmakersmust view this information as a call to level the playing fieldby enacting strong regulation that holds manufacturersaccountable for the impacts of the products they produce.
Here we set out a number of considerations for thesestakeholders as a way forward.
Design out toxic chemicalsHalogen-free products now! PVC and BFR-free could alreadybecome a standard for some product categories, especially phonesand monitors. RIM, Dell and HP should seriously consider this whendesigning their next smartphones, as should Fujitsu and Samsung fortheir future monitors. For desktop computers, halogen-free is alsowithin reach for all willing manufacturers, as demonstrated by theglobal giant HP and the small local Wipro. Philips and Apple haveovercome the last technical difficulties for televisions and notebooks.It is of great concern that current netbook design has not similarlyprogressed and manufacturers are not learning the lessons fromnotebooks to produce more environmentally-friendly products.
Beryllium and antimony compounds: go ask Asus! Phthalates,beryllium compounds and antimony compounds as groups are beingaddressed in all product categories. Asus is the only manufactureroffering elimination of both beryllium and antimony compounds overfour different product categories (all types of computers and monitors).Other manufacturers have something to learn from Asus. Morewidespread initiatives on mercury-free displays and arsenic-free glassshould also be adopted by all relevant players.
Go beyond RoHS exemptions. In order to level the playing field,lawmakers should close down the exemption path wherever theindustry has already overcome the technical barriers to eliminatehazardous substances. The industry would benefit from sharing bestpractices to make this necessary shift. Greenpeace has compiled along list of products offering alternatives for each of the RoHSexemptions
(see http://www.greenpeace.org/raw/content/international/assets/binaries/ngo-rohs-submission.pdf)
There must also be clear deadlines for finding solutions for anyremaining technical challenges. Best practice sharing forums such asINEMI5 should be proactive in addressing exemptions where technicalsolutions do not exist.
Strengthen the RoHS list. RoHS currently regulates only a limited listof six hazardous chemicals, while the list of products or componentsthat avoid the use of additional hazardous chemicals (PVC, BFRs,antimony, phthalates and beryllium), as seen in this survey, continues togrow. More and more often producers and their component andmaterial suppliers are designing new models in anticipation of thesechemicals being included in a revised RoHS Directive. It is imperative tostrengthen the list of hazardous chemicals regulated by RoHS, so thatit reflects the market’s readiness to comply and levels the playing fieldfor the industry leaders. It must avoid forcing innovative companies toroll back on their less-toxic products due to unfair competition fromless-innovative producer with ’cheap and dirty‘ products in the future.

22 Greenpeace International
Energy efficient products, producedefficiently!Beyond Energy Star. Preventing climate change is a global priorityand Energy Star (see Annex 1 for more details) provides a well-recognised benchmark for energy efficiency. Our survey shows that thetechnology exists to surpass the current standards for the devicessubmitted by participating companies. These standards shouldtherefore be considered as the minimum baseline below which acompany should not market a product. Yet, not all companies have putthe same efforts to provide their consumers with outstanding energyefficiency by exceeding Energy Star. Given the growing world energyconsumption related to the use of electronics, Greenpeace calls formore ambitious and verified standards that are revised regularly oncethe industry is able to exceed them. In addition, Energy Star has beenthe subject of controversy in the past for lax certification as found in aUS Government Accountability Office investigation in March 20106.We again urge legislators to set minimum efficiency standards, similarto the California TV standards7 that come into effect on 11 January2010 and efficiency standards for appliances in the EU and US, in orderto get the worst, least energy-efficient products off the market as soonas possible.
Energy embedded in products. There is an urgent need to worktowards an industry-wide standard of lifecycle analysis thatencompasses the use of energy (and natural resources) across theentire chain of production – from mining, manufacture and distributionto consumption and end-of-life treatment. In the meantime, companiesmust develop their own analysis that covers the entire product lifecycle.Without knowing and tracking what resources and how much energy ittakes to make a product, it is hard to determine how significant,systematic changes can be made. With respect to tackling climatechange, it is also essential to have a fair disclosure of total energy usedduring the manufacture of products – by fair, meaning that everycompany can be judged on the same stages of production and notaccording to where it sets its own boundaries for responsibility; oncethe carbon footprint of the manufacturing process has beenestablished, it is also important to consider the carbon footprintincurred by the mining of raw resources, for example.
Sustainable product lifecycleLess recyclability claims, more actual recycling! As found inprevious surveys, there appears to be no common industry practicewhen calculating recyclability rates. This year, we decided not to scoreon recyclability as we did in the previous surveys; we noticed that thehigh recyclability claims made by companies were not matchingcommon recycling practices. Focussing instead on the use of post-consumer recycled plastic, we found a less glorious picture of what theindustry is doing on this issue. However, a few companies havepioneered this level of action on recycling, a must in regards to savingresources and reducing embedded energy. The whole industry mustsee the use of recycled materials as a priority. Besides, in the context ofEuropean WEEE revision, making recyclability fit with recyclingpractices, manufacturers need to more clearly internalise their ownwaste treatment costs, ensure better communication with recyclers toboth improve feedback to product designers and also improveseparation and recycling technologies and build capacity among theorganisations and companies in charge of collection and recycling.Solutions to recycling these products also lie in the elimination ofhazardous substances such as BFRs that impair the ability to recyclematerials.
Extend the lifecycle of products. To design truly ecologically-soundproducts, companies need to shift away from products designed with alimited lifespan (planned obsolescence) and towards longer operatingupgradeable goods, with warranty periods significantly aboveminimum legal standards and with long-term availability ofcomponents. Many other initiatives could contribute towards thisobjective, from the standardisation of peripherals and chargers toallowing or offering repair services, easing and organising safe re-use ofsecond-hand products. For instance, in February 2009, 17manufacturers8 announced they would work collectively to produce aglobal universal charger and in June 2009, the European Commission9
obtained a commitment from ten mobile phone major manufacturers towork collectively at designing an EU specific universal charger to bereleased in 2010. Refurbishment initiatives should also be promoted indeveloped countries, where recycling is too focused on metal recoveryafter shredding the whole device and condemning most of it tocombustion. This need for the industry to move away from ‘design forthe dump’ to ‘design to last’ is cleverly explained in The Story of StuffProject’s latest short film, The Story of Electronics10.
6 http://www.gao.gov/products/GAO-10-4707 http://www.energy.ca.gov/appliances/tv_faqs.html8 http://www.gsmworld.com/newsroom/press-releases/2009/2548.htm9 http://ec.europa.eu/unitedkingdom/press/press_releases/2009/pr0970_en.htm10 http://www.storyofstuff.org/electronics.php
Greenpeace International 23
Reconsider business models.Move from products to services. Theproducts evaluated in this survey are physically sold to customers in atraditional manner. However, as already seen long ago in thephotocopier business, the leasing of products (big-size peripherals orothers) instead of selling them is another valid way to amend businessmodels in the direction of dematerialisation. Moving to new, service-based business models might enable manufacturers to design ultra-slim devices backed up by shared and efficiently used centralinfrastructure, reducing today’s huge redundancies in computing andstorage capacity in private ICT devices.
InnovationsIt should be noted that the desktops included in this survey arestandard desktop computers and that there are new technologiesavailable that in some cases allow the use of products with significantlyfewer environmental impacts. For example, offices with powerfulservers and even homes with one standard desktop can run thin clientson their networks. Thin clients draw processing power from the serveror another desktop and thereby reduce the need for many standalonedesktops. Often, thin clients do not need to have their ownmotherboard or memory and use less power and materials thanordinary desktops. Lessening the environmental impact of electronicproducts isn’t just about substitution; it’s about rethinking the productitself.
In 2009, Greenpeace launched the Cool It Challenge, which calls onleading IT companies to be champions of the fight to stop climatechange. The Climate Group's SMART 2020 report illustrates thepotential of the IT sector to direct its notoriously rapid technologicalinnovation toward solutions that cut emissions and improve efficiencyacross the economy. IT technologies empower consumers to measureenergy use and emissions in real time, which will ultimately helpconsumers reduce their energy usage. In addition, consumerelectronics products have the ability to lessen our impact on theenvironment through dematerialisation, where our gadgets replacenatural resource rich products like books and newspapers by usingdigital media. Without the release of practical case studies and energycalculations that clearly show our energy savings by companies, theincrease of these products will likely only increase our environmentalfootprint.
11 http://www.smart2020.org/
©GREENPEACE/W
ILLROSE
Greenpeace International 25
Annex 1Scoring methodology
Products were assessed against four sets ofcriteria that include some of the mostimportant issues when it comes tomanufacturing green consumer electronicsproducts. A maximum of 100 points wasavailable, which was then adjusted to a scoreon a 10-point scale for comparison purposes.In addition to a number of criteria which areapplicable across all product categories,each product category included criteriaspecific to consumer use and environmentalissues of that product category,A ’possible product‘ score, per product category, was alsocreated using the top-scoring answers from each criteriaquestion. These best practice scores demonstrate that it istechnically possible to make products that are significantlygreener than those currently on the market. While verysimilar, the scoring for this survey cannot be comparedexactly to the previous scoring that took place in thesurveys published in March 2008 and January 2009. This isdue to using updated international standards in areas suchas energy efficiency, and also due to other changes in thescoring to allow for innovations and product development.
26 Greenpeace International
Use of hazardous chemical substances(30 out of a total of 100 that each product can achieve)
RoHS exemptionsThe EU Directive on the Restriction of the Use of Certain HazardousSubstances in Electrical and Electronic Equipment (RoHS) regulatesthe use in electronic products of certain critical chemicals namely lead,mercury, cadmium, hexavalent chromium and the brominated flameretardants PBBs and PBDEs (though not other BFRs). Since allproducts are expected to follow current legislation, they were notawarded points for merely being RoHS compliant. However, RoHSallows products to still be in compliance if they use the restrictedchemicals in specific listed applications, though only where substitutionis deemed not currently possible, or the substitute would be moreharmful. Companies were asked to provide the exemptions being usedin each product. The fewer exemptions reported for a product, themore points were awarded.
PVC and BFRsPoints were awarded for products free of all PVC plastics and/or free ofall BFRs. Significant progress has been made by companies to phaseout the use of PVC. In the case of some external cables, approval is stillneeded for the use of non-PVC alternatives. Five points were given fora PVC-free product. If the product still uses PVC, the total availablepoints dropped from 5 to 3. Points were then deducted according tothe number of major components still containing PVC. A similar rulewas applied for BFRs: 5 points for a BFR-free product, 3 points for apartially BFR-free product plus additional deductions per componentstill containing BFRs. The components included:
For PVC:
• External cabling and wires• Internal cabling and wires (including ribbon cables)• Housing• Packaging• Plastic coated/encased electrical connectors
For BFRs:
• Laminates of printed wiring boards, including flexible circuit boards.• Battery, including casing and components• Housing (including for periphery equipment, e.g. transformer)• Fan and fan housing (if applicable)• Ribbon cables• Electrical insulation sheets• Plastic coated/encased electrical connectors
Phthalates, beryllium and antimony and theircompoundsThese hazardous chemicals are not currently restricted under theRoHS Directive but should still be avoided in products due to theirtoxicity. Three points were awarded for each of these chemical groupsnot used in the product.
For details of the environmental and human health impacts of thechemicals mentioned here, see the Greenpeace report Toxic Tech –The dangerous chemicals in electronic products, available at:http://www.greenpeace.org/international/PageFiles/24478/toxic-tech-chemicals-in-elec.pdf
Some product categories such as mobile phones score generallyhigher than others. This is partly explained by the higher complexityand greater number of parts in products such as notebooks ordesktops.
Greenpeace International 27
Energy use and power-saving(30 out of a total of 100 a product can achieve)
Consumer electronics play a significant and growing part in anindividual’s carbon footprint. Using energy efficient products reducesCO2emissions and thereby the impact on the climate. Lower energyproducts also lead to lower household energy bills.
Energy Star assessmentEnergy Star is the energy efficiency rating of the US EnvironmentalProtection Agency and the US Department of Energy. This certificationhas become a globally-accepted standard and sets benchmarks for anumber of products. If these benchmarks are met or exceeded,products can be labelled as Energy Star compliant. For theGreenpeace survey, points were awarded according to the percentageby which devices exceeded Energy Star minimum requirements. It isimportant to note that Energy Star regularly adjusts its criteria as theoverall performance of products improves. Most of the Energy Starstandards for this survey have changed compared to the previous one,and because of this, the performance of products in this categorycannot be compared with that of the previous survey. The detailedrequirement for Energy Star qualifying products can be found on theEnergy Star website at www.energystar.gov
In desktops, notebooks and netbooks Energy Star now uses a typicalenergy consumption (TEC), which is calculated through a formula forsleep, idle and off-mode consumption. The Greenpeace survey givesmaximum points for products that exceed the Energy Star TECrequirements by 50%. In addition, the efficiency of the external orinternal power supplies of computers is also scored. In cases wheredesktops use external power supplies, the scoring methods forexternal supplies for laptops has been used.
For mobile phones and smartphones points were awarded accordingto the extent to which the external power supplies exceed Energy Starin both active mode (charging) and off-mode.
New Energy Star criteria also exist for TVs and computer displays. TVsare compared to the maximum on-mode and also the off-mode powerconsumption. For monitors, on the other hand, the off-mode, averageon-mode and sleep-mode energy consumption are taken into account.
In addition to the 24 points available through the various Energy Starstandards, each product could score up to six further points via the socalled ’energy matrix‘. This consists of a number of criteria (some arespecific to the product category) that help reduce energy consumptionor help consumers make informed choices about how much energy aproduct uses. The matrix includes criteria such as the existence ofonline environmental datasheets that show power consumption, thepresence of calculators that compare different models by the samecompany, additional power saving hardware or software and clearcommunication by the companies that products with lowerconsumption help reduce the impact on the climate.
Product lifecycle(30 out of the total of 100 points a product can achieve)
Consumer electronics are known for their short and continuouslydiminishing lifecycles that are increasing the burden on theenvironment. A longer warranty period, designing products that can beupgraded rather than replaced and making spare parts available longafter the production of the device has been discontinued all help toencourage consumers to keep using the products longer. Most of thecriteria included in this part of the survey have remained unchangedfrom the previous survey.
Upgradeability
Products were given points for the extent to which they areupgradeable by the user, with clear directions on how to upgrade partsbeing given in the user manual. For computers and notebooks,upgradeable parts included the system memory, the hard drive, thegraphics card (GPU), the processor (CPU) and the optical drive(CD/DVD). Parts that are usually replaced rather than upgraded (suchas fans in computers, for example) were not included. For netbooks,which are generally not using that many parts and are thus lessupgradeable, the price ratio of a replacement battery compared withthe price of product itself, as well as the battery life, have also beentaken into account.
For mobile phones and PDAs, upgradeable parts included the batteryand memory cards. In addition, points have been allocated accordingto the price of the battery compared with the price of the device itself.This was done because the battery usually needs earlier replacementand expensive batteries are an incentive for the consumer to discardthe product rather than to simply replace the battery. The smaller thepercentage the battery price is of the total price of the device, the morepoints awarded.
Monitors are not usually upgradeable. Instead, the manufacturer’sreplacement policy for monitors showing pixel defects have beenanalysed and points have been awarded by comparing the companypolicy with the ISO standard. Note that, under this standard, theamount of acceptable defect pixels per class are also dependent onthe overall number of pixels of the screen. Thus a screen with morepixels would be allowed more defects.
TVs are not upgradeable, so no points could be awarded. Instead, theoverall score for a TV’s product lifecycle criterion was adjusted by afactor of 1.25 to remain consistent with a total of 30 points for this setof criteria.
For netbooks, the battery life using Mobile Mark 07 was also taken intoaccount. While this test is not necessarily regarded as an indication ofthe battery life under normal working conditions, it does allow forrelative comparisons between the products.
Warranty
Points were awarded according to the number of years for whichproducts are under manufacturer warranty on the global market. Thelonger the warranty time given by the manufacturer, the less likely it isthat the consumer will have to replace a device before it is outdated. Ingeneral, with the possible exception of desktop computers andmonitors, companies have again missed out on a number of points byrestricting the warranty to one year only.
Availability of spare parts
Similarly to the scoring for warranty, products were awarded points forevery year that a consumer is able to obtain spare parts for a productafter production has ceased. The longer these spare parts are availablethe less likely it is that the consumer will dispose of a product ratherthan repair it.
Recycled plastic content
Using parts from recycled plastics in consumer products is on theincrease and can significantly reduce the amount of new plasticproduced. In this survey, points were awarded by comparing theweight of the recycled plastic with the overall weight of plastics used inthe product. In addition, preference was given to products that use alarge amount of post-consumer recycled plastic compared to postindustrial recycled plastic. The latter is usually derived from scraps inthe production of a product. The increased demand for post-consumerplastic on the other hand drives the waste collection of these plasticsvia take-back practices and encourages toxic elimination in design, inturn making plastics more easily recyclable. Additionally, recyclingsaves the energy embodied in materials, reducing the impacts ongreenhouse gas emissions and climate change.
Take-back
For this survey, the take-back policies of the companies were takeninto account by using the points they score under this criterion in the16th edition of the Greenpeace Guide to Greener Electronics (referredto as the Green Guide in the following tables), released on 26 October2010)12. The better the take-back programme, which must be cost-freeto the consumer or last owner, the more points awarded.
28 Greenpeace International
12http://www.greenpeace.org/international/Global/international/publications/toxics/2010/version16/Ranking%20tables%20Oct%202010-All%20companies.pdf
Greenpeace International 29
Innovation andmarketing(10 out of the total of 100 points a product can achieve)
Energy during production
The energy used to manufacture a product is as important toinvestigate as the energy it takes to power a device during consumeruse. Reducing energy during production plays an important role inreducing the impact on natural resources and the climate.Unfortunately, there is no existing global standard that allows forcomparing products under this category. Therefore, points wereawarded to products for which companies have an energy lifecycleanalysis that takes into account a significant part of the productionchain of that particular product model. Activities that should beincluded when calculating the energy taken to make a product includethe extraction and refining of natural resources, production of materials(e.g. plastics), the manufacturing of parts provided by suppliers, themanufacturing of parts by the brand owner, the shipping of parts to theassembly facility, the assembly itself and the distribution of theproducts to importers and wholesalers. Points were awarded for eachof the major stages included in the assessment. However, companiesthat only calculate the energy of the final assembly stage of productionwere not awarded any points.
An additional point could be earned for companies that publish thegreenhouse gas emissions of their entire supply chain either in theirown publication or through the Carbon Disclosure Project.
Other innovation and features
Green innovations going beyond common practices were awardedwith additional points. These included, for example, arsenic-free glass,waterborne paint, solar panels, avoiding volatile organic compounds orproducing products that are extremely durable.
In addition, a small number of companies provided us with confidentialinformation to back up their claims, which could also earn themadditional points point as we encourage companies to provide asmuch proof as possible of the claims they are making.
Moreover, companies that have an independent third party verify theabsence of hazardous substances were also awarded.
Visibility and promotion
Electronics companies spend huge amounts of money advertising andpromoting their products. The more visible green products are, themore likely they are going to be purchased by consumers. Todetermine this visibility, the number of website manipulations (such asthe number of clicks or dropdown menus) required to reach thespecifications of a product was assessed. The less website navigationneeded, the more points were awarded. The average from a number ofmajor websites visited was used and it is possible that the sitesaccessed for this assessment have since changed.
Due to the number of factors taken into account in this section thedetailed results have not been displayed in the detailed scoring sheetsbelow.
30 Greenpeace International
©GREENPEACE/J
URAJRIZMAN

Greenpeace International 31
Detailed scores
32 Greenpeace International
DellOptiplex 980
Fujitsu EsprimoE9900
Criteria
Chemicals
Market
Totally PVC-free
PVC-containing parts
Totally BFR-free
BFR-containing parts
Antimony-free
Phthalate-free
Beryllium-free
RoHS exemptions used
Subtotal
Energy use
n/a Energy Star category
Off-mode energy use (Watts)
Sleep-mode energy use (Watts)
Idle-mode energy use (Watts)
ETEC better than Energy Star (%)
Efficiency at 50% better thanEnergy Star (%pts)
Efficiency at 20% better than EnergyStar (%pts)
Greenpeace energy matrix
Subtotal
Lifecycle
Manufacturer warranty (yrs)
Replacement parts available (yrs)
Take-back programme
Recycled plastic weight (% )
Post-consumer/Post-industrial (%)
Upgradeable parts
Subtotal
Other
Energy during production
Other innovations and features
Visibility
Subtotal
Total adjusted
MaxPoints
5
3
5
3
3
3
3
11
30
n/a
n/a
n/a
n/a
16
4
4
6
30
7
7
3
7
6
30
4
3
3
10
10
Results
Global
YES
n/a
YES
n/a
NO
NO
NO
3
B
1.0
3.1
23.0
61.48%
0.0 %*
0.18W*
n/a
3
5
GreenGuide
5.80%
100/0
4
n/a
n/a
n/a
HP Compaq6005 ProUltra-slim
Points
5.0
n/a
5.0
n/a
0.0
0.0
0.0
8.0
18.0
n/a
n/a
n/a
n/a
16.0
0.0
2.0
4.0
22.0
5.0
5.0
1.0
n/a
1.0
4.8
16.8
1.0
0.5
2.3
3.8
6.06
Results
Europe
NO
3
NO
3
NO
NO
YES
7
B
1.2
2.0
31.0
49.42%
4.0 %
4.0 %
n/a
3
5
GreenGuide
0%
0/0
4
n/a
n/a
n/a
Points
0.0
1.8
0.0
1.8
0.0
0.0
3.0
4.0
10.6
n/a
n/a
n/a
n/a
15.8
3.0
3.0
6.0
27.8
5.0
5.0
1.0
n/a
0.0
4.8
15.8
0.5
0.0
1.8
2.3
5.65
Results
Global
NO
2
NO
3
NO
NO
NO
6
D
1.9
3.0
57.7
33.24%
5.0 %
5.0 %
n/a
3
5
GreenGuide
25%
100/0
5
n/a
n/a
n/a
Points
0.0
2.4
0.0
1.8
0.0
0.0
0.0
5.0
9.2
n/a
n/a
n/a
n/a
10.6
4.0
4.0
4.0
22.6
5.0
5.0
2.0
n/a
2.5**
6
20.5
0.0
0.0
1.8
1.8
5.41
AsusCS6110
Results
Asia
NO
3
NO
4
YES
NO
YES
3
C
0.6
1.9
28.4
62.39%
1.5 %*
0.31W*
n/a
3
3
GreenGuide
10%
0/100
0***
n/a
n/a
n/a
Points
0.0
1.8
0.0
1.2
3.0
0.0
3.0
8.0
17.0
n/a
n/a
n/a
n/a
16.0
2.0
3.0
3.0
24.0
5.0
3.0
0.0
n/a
2.0
0
10.0
0.5
1.0
1.2
2.7
5.37
WiproWSG59755W7
Results
India
YES
n/a
YES
n/a
NO
NO
NO
6
B
0.8
1.7
37.4
40.58%
0.0 %
0.0 %
n/a
3
5
GreenGuide
25%
93/7
0***
n/a
n/a
n/a
Points
5.0
n/a
5.0
n/a
0.0
0.0
0.0
5.0
15.0
n/a
n/a
n/a
n/a
13.0
0.0
0.0
2.0
15.0
5.0
5.0
3.0
n/a
5.0
0
18.0
0.0
0.0
2.3
2.3
5.02
Greenpeace International 33
Possible Desktop
Results
Global
YES
n/a
YES
n/a
YES
NO
YES
3
n/a
n/a
n/a
n/a
62.39%
5.0 %
5.0 %
n/a
3
5
GreenGuide
25%
100/0
5
n/a
n/a
n/a
Points
5.0
n/a
5.0
n/a
3.0
0.0
3.0
8.0
24.0
n/a
n/a
n/a
n/a
16.0
4.0
4.0
6.0
30.0
5.0
5.0
3.0
n/a
5.0
6
24.0
1.0
1.0
2.3
4.3
8.23
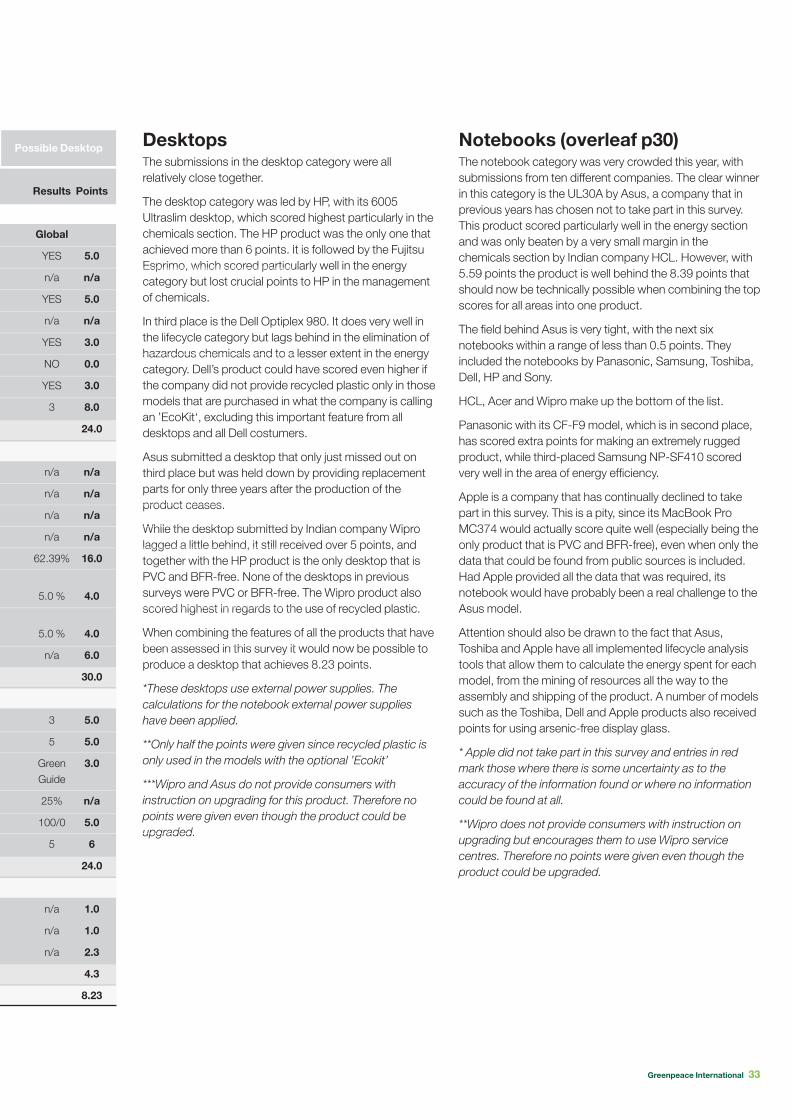
DesktopsThe submissions in the desktop category were allrelatively close together.
The desktop category was led by HP, with its 6005Ultraslim desktop, which scored highest particularly in thechemicals section. The HP product was the only one thatachieved more than 6 points. It is followed by the FujitsuEsprimo, which scored particularly well in the energycategory but lost crucial points to HP in the managementof chemicals.
In third place is the Dell Optiplex 980. It does very well inthe lifecycle category but lags behind in the elimination ofhazardous chemicals and to a lesser extent in the energycategory. Dell’s product could have scored even higher ifthe company did not provide recycled plastic only in thosemodels that are purchased in what the company is callingan ’EcoKit‘, excluding this important feature from alldesktops and all Dell costumers.
Asus submitted a desktop that only just missed out onthird place but was held down by providing replacementparts for only three years after the production of theproduct ceases.
While the desktop submitted by Indian company Wiprolagged a little behind, it still received over 5 points, andtogether with the HP product is the only desktop that isPVC and BFR-free. None of the desktops in previoussurveys were PVC or BFR-free. The Wipro product alsoscored highest in regards to the use of recycled plastic.
When combining the features of all the products that havebeen assessed in this survey it would now be possible toproduce a desktop that achieves 8.23 points.
*These desktops use external power supplies. Thecalculations for the notebook external power supplieshave been applied.
**Only half the points were given since recycled plastic isonly used in the models with the optional ’Ecokit’
***Wipro and Asus do not provide consumers withinstruction on upgrading for this product. Therefore nopoints were given even though the product could beupgraded.
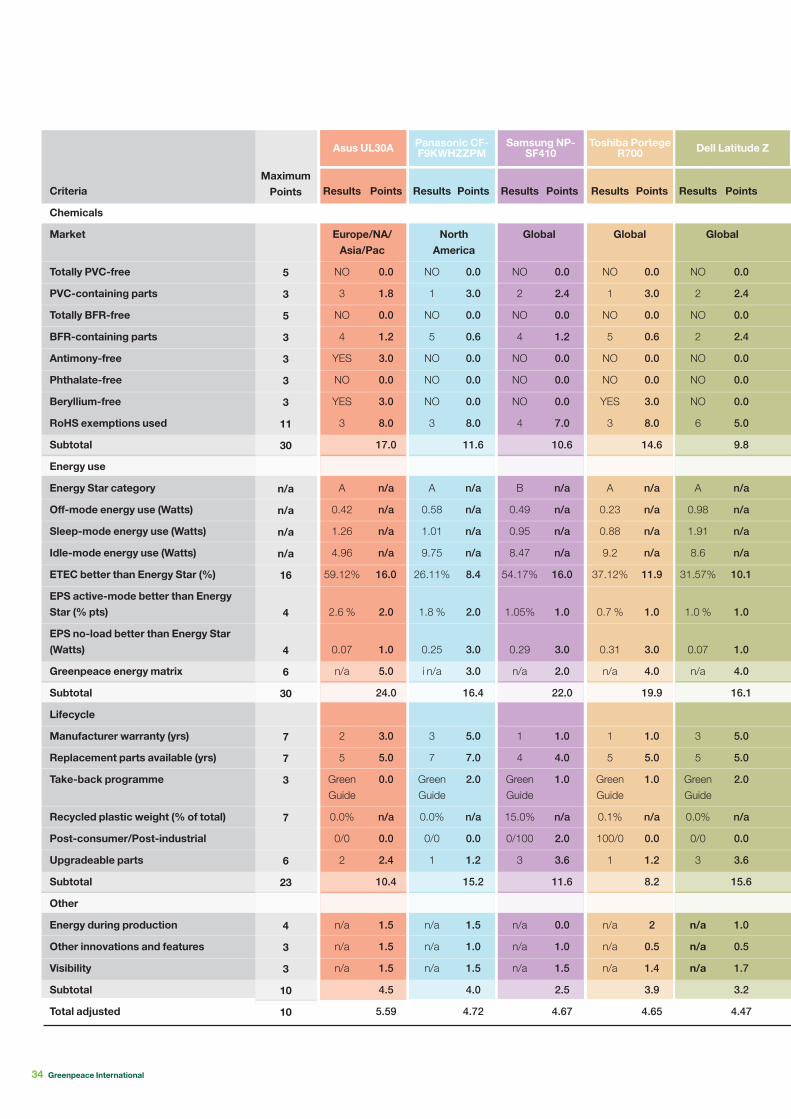
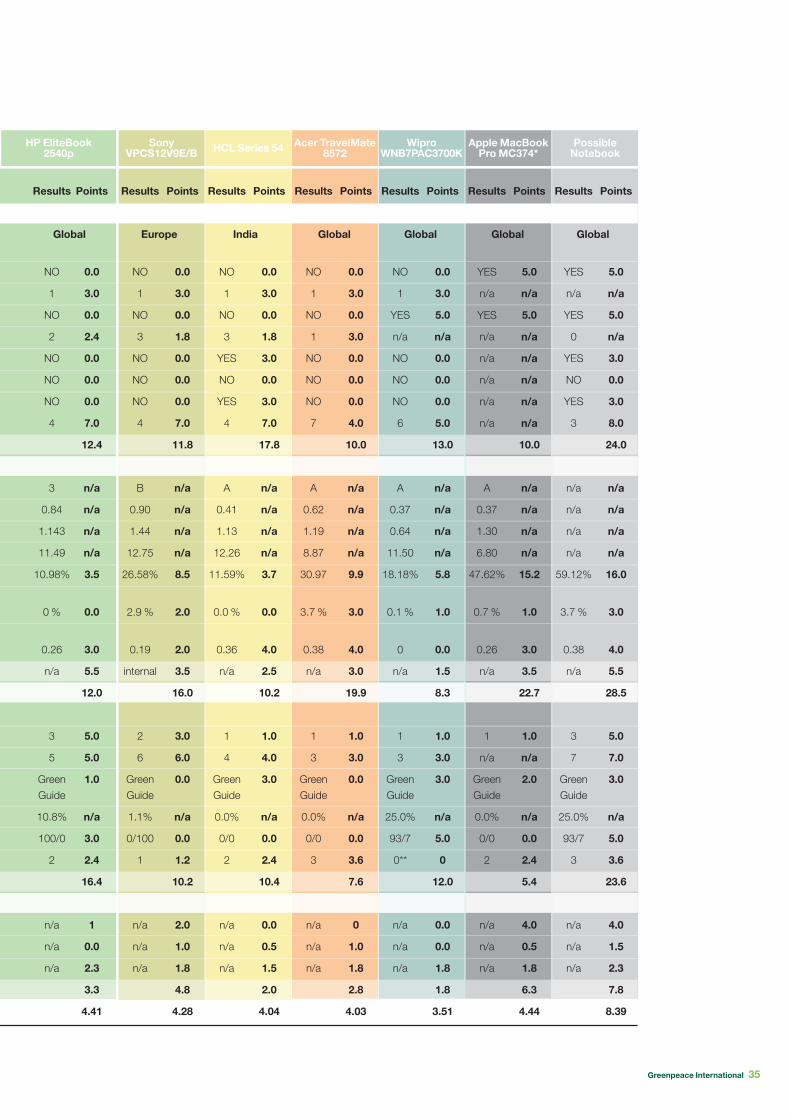
Notebooks (overleaf p30)The notebook category was very crowded this year, withsubmissions from ten different companies. The clear winnerin this category is the UL30A by Asus, a company that inprevious years has chosen not to take part in this survey.This product scored particularly well in the energy sectionand was only beaten by a very small margin in thechemicals section by Indian company HCL. However, with5.59 points the product is well behind the 8.39 points thatshould now be technically possible when combining the topscores for all areas into one product.
The field behind Asus is very tight, with the next sixnotebooks within a range of less than 0.5 points. Theyincluded the notebooks by Panasonic, Samsung, Toshiba,Dell, HP and Sony.
HCL, Acer and Wipro make up the bottom of the list.
Panasonic with its CF-F9 model, which is in second place,has scored extra points for making an extremely ruggedproduct, while third-placed Samsung NP-SF410 scoredvery well in the area of energy efficiency.
Apple is a company that has continually declined to takepart in this survey. This is a pity, since its MacBook ProMC374 would actually score quite well (especially being theonly product that is PVC and BFR-free), even when only thedata that could be found from public sources is included.Had Apple provided all the data that was required, itsnotebook would have probably been a real challenge to theAsus model.
Attention should also be drawn to the fact that Asus,Toshiba and Apple have all implemented lifecycle analysistools that allow them to calculate the energy spent for eachmodel, from the mining of resources all the way to theassembly and shipping of the product. A number of modelssuch as the Toshiba, Dell and Apple products also receivedpoints for using arsenic-free display glass.
* Apple did not take part in this survey and entries in redmark those where there is some uncertainty as to theaccuracy of the information found or where no informationcould be found at all.
**Wipro does not provide consumers with instruction onupgrading but encourages them to use Wipro servicecentres. Therefore no points were given even though theproduct could be upgraded.
34 Greenpeace International
Samsung NP-SF410
Panasonic CF-F9KWHZZPM
Criteria
Chemicals
Market
Totally PVC-free
PVC-containing parts
Totally BFR-free
BFR-containing parts
Antimony-free
Phthalate-free
Beryllium-free
RoHS exemptions used
Subtotal
Energy use
Energy Star category
Off-mode energy use (Watts)
Sleep-mode energy use (Watts)
Idle-mode energy use (Watts)
ETEC better than Energy Star (%)
EPS active-mode better than EnergyStar (% pts)
EPS no-load better than Energy Star(Watts)
Greenpeace energy matrix
Subtotal
Lifecycle
Manufacturer warranty (yrs)
Replacement parts available (yrs)
Take-back programme
Recycled plastic weight (% of total)
Post-consumer/Post-industrial
Upgradeable parts
Subtotal
Other
Energy during production
Other innovations and features
Visibility
Subtotal
Total adjusted
Asus VW247-HF
Asus UL30A Toshiba PortegeR700 Dell Latitude Z
Europe/NA/Asia/Pac
NorthAmerica
Global Global Global
MaximumPoints
5
3
5
3
3
3
3
11
30
n/a
n/a
n/a
n/a
16
4
4
6
30
7
7
3
7
6
23
4
3
3
10
10
Results
NO
3
NO
4
YES
NO
YES
3
A
0.42
1.26
4.96
59.12%
2.6 %
0.07
n/a
2
5
GreenGuide
0.0%
0/0
2
n/a
n/a
n/a
Points
0.0
1.8
0.0
1.2
3.0
0.0
3.0
8.0
17.0
n/a
n/a
n/a
n/a
16.0
2.0
1.0
5.0
24.0
3.0
5.0
0.0
n/a
0.0
2.4
10.4
1.5
1.5
1.5
4.5
5.59
Results
NO
1
NO
5
NO
NO
NO
3
A
0.58
1.01
9.75
26.11%
1.8 %
0.25
i n/a
3
7
GreenGuide
0.0%
0/0
1
n/a
n/a
n/a
Points
0.0
3.0
0.0
0.6
0.0
0.0
0.0
8.0
11.6
n/a
n/a
n/a
n/a
8.4
2.0
3.0
3.0
16.4
5.0
7.0
2.0
n/a
0.0
1.2
15.2
1.5
1.0
1.5
4.0
4.72
Results
NO
2
NO
4
NO
NO
NO
4
B
0.49
0.95
8.47
54.17%
1.05%
0.29
n/a
1
4
GreenGuide
15.0%
0/100
3
n/a
n/a
n/a
Points
0.0
2.4
0.0
1.2
0.0
0.0
0.0
7.0
10.6
n/a
n/a
n/a
n/a
16.0
1.0
3.0
2.0
22.0
1.0
4.0
1.0
n/a
2.0
3.6
11.6
0.0
1.0
1.5
2.5
4.67
Results
NO
1
NO
5
NO
NO
YES
3
A
0.23
0.88
9.2
37.12%
0.7 %
0.31
n/a
1
5
GreenGuide
0.1%
100/0
1
n/a
n/a
n/a
Points
0.0
3.0
0.0
0.6
0.0
0.0
3.0
8.0
14.6
n/a
n/a
n/a
n/a
11.9
1.0
3.0
4.0
19.9
1.0
5.0
1.0
n/a
0.0
1.2
8.2
2
0.5
1.4
3.9
4.65
Results
NO
2
NO
2
NO
NO
NO
6
A
0.98
1.91
8.6
31.57%
1.0 %
0.07
n/a
3
5
GreenGuide
0.0%
0/0
3
n/a
n/a
n/a
Points
0.0
2.4
0.0
2.4
0.0
0.0
0.0
5.0
9.8
n/a
n/a
n/a
n/a
10.1
1.0
1.0
4.0
16.1
5.0
5.0
2.0
n/a
0.0
3.6
15.6
1.0
0.5
1.7
3.2
4.47
HCL Series 54 Acer TravelMate8572
WiproWNB7PAC3700K
Apple MacBookPro MC374*
PossibleNotebook
Greenpeace International 35
HP EliteBook2540p
SonyVPCS12V9E/B
Global Europe India Global Global Global Global
Results
NO
1
NO
3
YES
NO
YES
4
A
0.41
1.13
12.26
11.59%
0.0 %
0.36
n/a
1
4
GreenGuide
0.0%
0/0
2
n/a
n/a
n/a
Points
0.0
3.0
0.0
1.8
3.0
0.0
3.0
7.0
17.8
n/a
n/a
n/a
n/a
3.7
0.0
4.0
2.5
10.2
1.0
4.0
3.0
n/a
0.0
2.4
10.4
0.0
0.5
1.5
2.0
4.04
Results
NO
1
NO
1
NO
NO
NO
7
A
0.62
1.19
8.87
30.97
3.7 %
0.38
n/a
1
3
GreenGuide
0.0%
0/0
3
n/a
n/a
n/a
Points
0.0
3.0
0.0
3.0
0.0
0.0
0.0
4.0
10.0
n/a
n/a
n/a
n/a
9.9
3.0
4.0
3.0
19.9
1.0
3.0
0.0
n/a
0.0
3.6
7.6
0
1.0
1.8
2.8
4.03
Results
NO
1
YES
n/a
NO
NO
NO
6
A
0.37
0.64
11.50
18.18%
0.1 %
0
n/a
1
3
GreenGuide
25.0%
93/7
0**
n/a
n/a
n/a
Results
NO
1
NO
2
NO
NO
NO
4
3
0.84
1.143
11.49
10.98%
0%
0.26
n/a
3
5
GreenGuide
10.8%
100/0
2
n/a
n/a
n/a
Points
0.0
3.0
0.0
2.4
0.0
0.0
0.0
7.0
12.4
n/a
n/a
n/a
n/a
3.5
0.0
3.0
5.5
12.0
5.0
5.0
1.0
n/a
3.0
2.4
16.4
1
0.0
2.3
3.3
4.41
Results
NO
1
NO
3
NO
NO
NO
4
B
0.90
1.44
12.75
26.58%
2.9 %
0.19
internal
2
6
GreenGuide
1.1%
0/100
1
n/a
n/a
n/a
Points
0.0
3.0
0.0
1.8
0.0
0.0
0.0
7.0
11.8
n/a
n/a
n/a
n/a
8.5
2.0
2.0
3.5
16.0
3.0
6.0
0.0
n/a
0.0
1.2
10.2
2.0
1.0
1.8
4.8
4.28
Results
YES
n/a
YES
0
YES
NO
YES
3
n/a
n/a
n/a
n/a
59.12%
3.7 %
0.38
n/a
3
7
GreenGuide
25.0%
93/7
3
n/a
n/a
n/a
Points
5.0
n/a
5.0
n/a
3.0
0.0
3.0
8.0
24.0
n/a
n/a
n/a
n/a
16.0
3.0
4.0
5.5
28.5
5.0
7.0
3.0
n/a
5.0
3.6
23.6
4.0
1.5
2.3
7.8
8.39
Points
0.0
3.0
5.0
n/a
0.0
0.0
0.0
5.0
13.0
n/a
n/a
n/a
n/a
5.8
1.0
0.0
1.5
8.3
1.0
3.0
3.0
n/a
5.0
0
12.0
0.0
0.0
1.8
1.8
3.51
Results
YES
n/a
YES
n/a
n/a
n/a
n/a
n/a
A
0.37
1.30
6.80
47.62%
0.7 %
0.26
n/a
1
n/a
GreenGuide
0.0%
0/0
2
n/a
n/a
n/a
Points
5.0
n/a
5.0
n/a
n/a
n/a
n/a
n/a
10.0
n/a
n/a
n/a
n/a
15.2
1.0
3.0
3.5
22.7
1.0
n/a
2.0
n/a
0.0
2.4
5.4
4.0
0.5
1.8
6.3
4.44
36 Greenpeace International
SamsungNP-N230Asus1015PED
Criteria
Chemicals
Market
Totally PVC-free
PVC-containing parts
Totally BFR-free
BFR-containing parts
Antimony-free
Phthalate-free
Beryllium-free
RoHS exemptions used
Subtotal
Energy use
Energy Star category
Off-mode energy use (Watts)
Sleep-mode energy use (Watts)
Idle-mode energy use (Watts)
ETEC better than Energy Star (%)
EPS active mode better thanEnergy Star (% pts)
EPS better than Energy Star (Watts)
Greenpeace energy matrix
Subtotal
Lifecycle
Manufacturer warranty (yrs)
Replacement parts available (yrs)
Take-back programme
Recycled plastic weight %
Post-consumer/Post-industrial
Upgradeable parts
Battery/product price ratio
Battery life
Subtotal
Other
Energy during production
Other innovations and features
Visibility
Subtotal
Total adjusted
MaximumPoints
5
3
5
3
3
3
3
11
30
n/a
n/a
n/a
n/a
16
4
4
6
30
7
7
3
n/a
7
1
2.5
2.5
30
4
3
3
10
10.00
Results
Global
NO
1
NO
1
NO
NO
NO
3
A
0.54
0.63
6.18
50.92%
3.0 %
0.21
n/a
1
3
GreenGuide
0%
0/0
Batt Mem
10%
8 hrs
n/a
n/a
n/a
Asus VW247-HF
Acer TM8172
Points
0.0
3.0
0.0
3.0
0.0
0.0
0.0
8.0
14.0
n/a
n/a
n/a
n/a
16.0
3.0
3.0
3.0
25.0
1.0
3.0
0.0
n/a
0.0
1.0
2.0
1.5
8.5
0.0
1.5
1.8
3.3
5.08
Results
Global
NO
3
NO
4
YES
NO
YES
3
A
0.51
0.838
9.27
30.56%
2.4 %
0.07
n/a
1
5
GreenGuide
0%
0/0
Batt Mem
23%
10hr45min
n/a
n/a
n/a
Points
0.0
1.8
0.0
1.2
3.0
0.0
3.0
8.0
17.0
n/a
n/a
n/a
n/a
9.8
2.0
1.0
4.0
16.8
1.0
5.0
0.0
n/a
0.0
1.0
0.5
2.5
10.0
1.5
1.5
1.5
4.5
4.83
Results
Global
NO
2
NO
4
NO
NO
NO
4
A
0.47
0.7
7.07
45.84%
2.0%
0.1
n/a
1
4
GreenGuide
15%
0/100
Batt Mem
23%
11 hrs
n/a
n/a
n/a
Points
0.0
2.4
0.0
1.2
0.0
0.0
0.0
7.0
10.6
n/a
n/a
n/a
n/a
14.7
2.0
2.0
2.0
20.7
1.0
4.0
1.0
n/a
2.0
1.0
0.5
2.5
12.0
0.0
1.0
1.5
2.5
4.58
HPMini 5103 ES
Results
Global
NO
1
NO
1
NO
NO
NO
4
A
0.86
1.00
9.34
25.15%
0.0 %
10.00%
n/a
1
5
GreenGuide
0%
0/0
Batt Mem
28%
10.15 hrs
n/a
n/a
n/a
Points
0.0
3.0
0.0
3.0
0.0
0.0
0.0
7.0
13.0
n/a
n/a
n/a
n/a
8.1
0.0
2.0
4.0
14.1
1.0
5.0
1.0
n/a
0.0
1.0
0.0
2.5
8.0
1.0
0.5
1.8
3.3
3.84
Dell Latitude 2110
Results
Global
NO
2
NO
3
NO
NO
NO
6
A
0.9
1.07
9.8
24.47%
0.0 %
0.21
n/a
1
5
GreenGuide
0%
0/0
Batt Mem
25%
4hrs 54min
n/a
n/a
n/a
Points
0.0
2.4
0.0
1.8
0.0
0.0
0.0
5.0
9.2
n/a
n/a
n/a
n/a
7.8
0.0
3.0
4.0
14.8
1.0
5.0
2.0
n/a
0.0
1.0
0.5
0.0
9.5
1.0
1.0
1.5
3.5
3.70
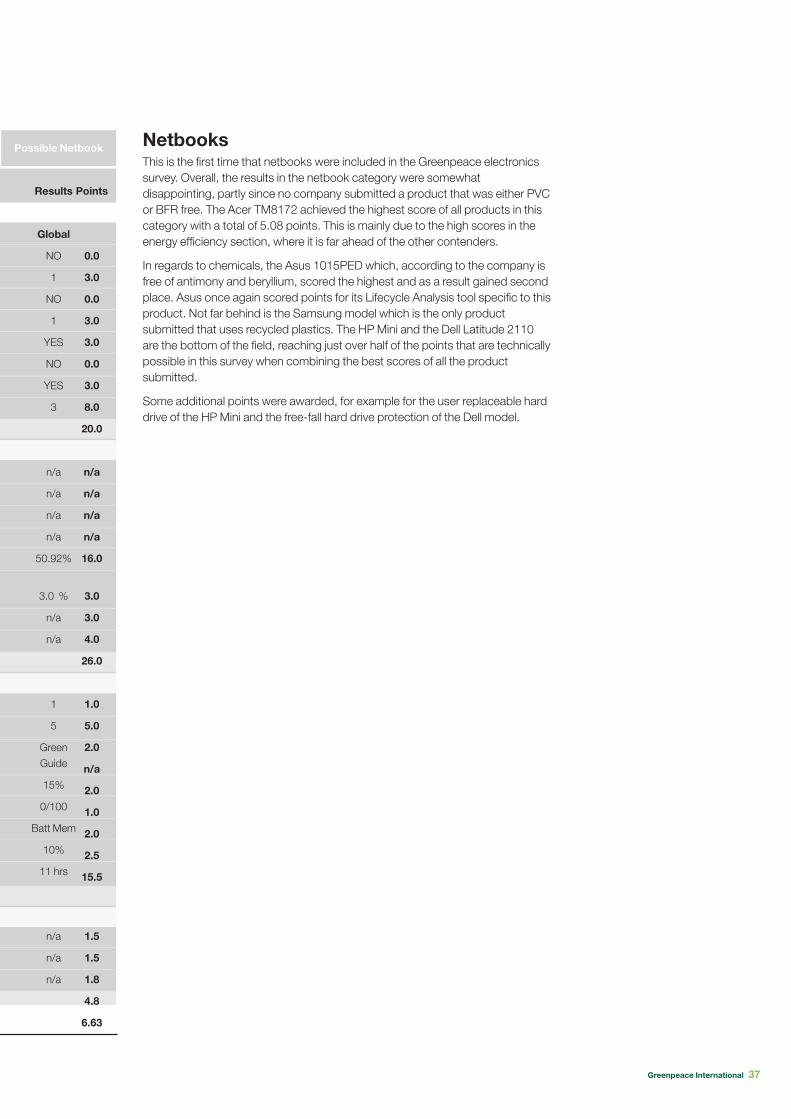
Greenpeace International 37
Possible Netbook
Results
Global
NO
1
NO
1
YES
NO
YES
3
n/a
n/a
n/a
n/a
50.92%
3.0 %
n/a
n/a
1
5
GreenGuide
15%
0/100
Batt Mem
10%
11 hrs
n/a
n/a
n/a
Points
0.0
3.0
0.0
3.0
3.0
0.0
3.0
8.0
20.0
n/a
n/a
n/a
n/a
16.0
3.0
3.0
4.0
26.0
1.0
5.0
2.0
n/a
2.0
1.0
2.0
2.5
15.5
1.5
1.5
1.8
4.8
6.63
NetbooksThis is the first time that netbooks were included in the Greenpeace electronicssurvey. Overall, the results in the netbook category were somewhatdisappointing, partly since no company submitted a product that was either PVCor BFR free. The Acer TM8172 achieved the highest score of all products in thiscategory with a total of 5.08 points. This is mainly due to the high scores in theenergy efficiency section, where it is far ahead of the other contenders.
In regards to chemicals, the Asus 1015PED which, according to the company isfree of antimony and beryllium, scored the highest and as a result gained secondplace. Asus once again scored points for its Lifecycle Analysis tool specific to thisproduct. Not far behind is the Samsung model which is the only productsubmitted that uses recycled plastics. The HP Mini and the Dell Latitude 2110are the bottom of the field, reaching just over half of the points that are technicallypossible in this survey when combining the best scores of all the productsubmitted.
Some additional points were awarded, for example for the user replaceable harddrive of the HP Mini and the free-fall hard drive protection of the Dell model.
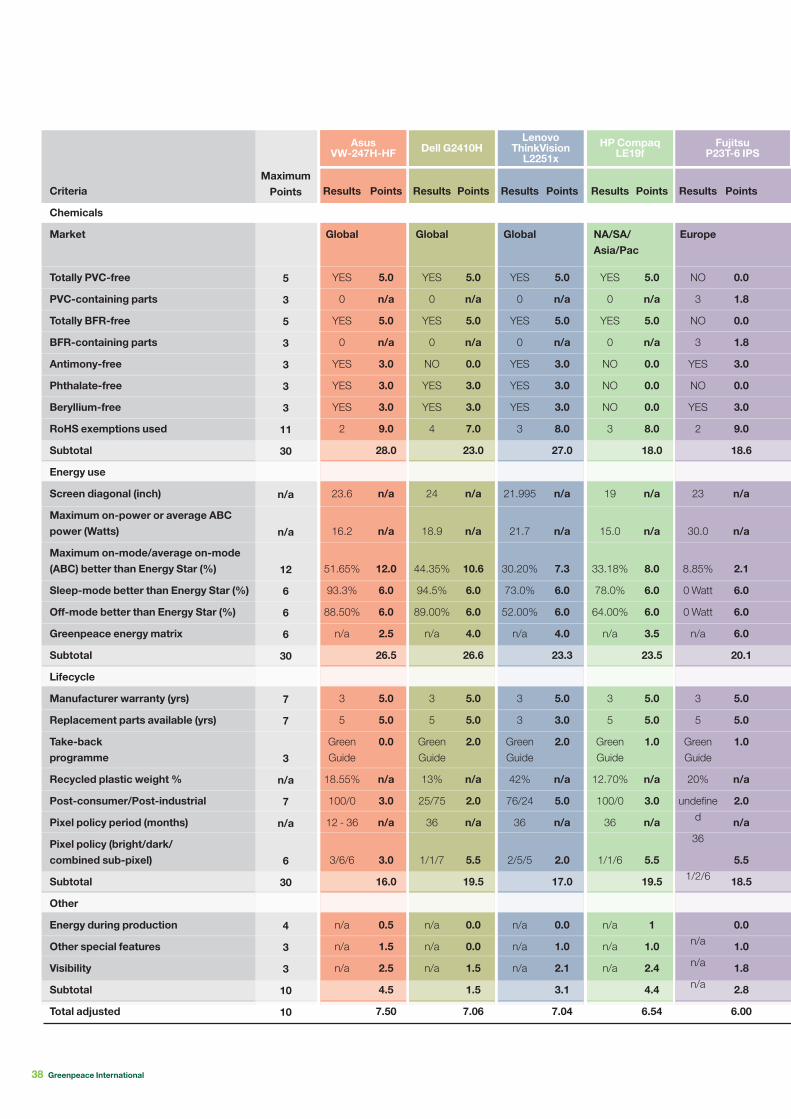
38 Greenpeace International
LenovoThinkVision
L2251xDell G2410H
Criteria
Chemicals
Market
Totally PVC-free
PVC-containing parts
Totally BFR-free
BFR-containing parts
Antimony-free
Phthalate-free
Beryllium-free
RoHS exemptions used
Subtotal
Energy use
Screen diagonal (inch)
Maximum on-power or average ABCpower (Watts)
Maximum on-mode/average on-mode(ABC) better than Energy Star (%)
Sleep-mode better than Energy Star (%)
Off-mode better than Energy Star (%)
Greenpeace energy matrix
Subtotal
Lifecycle
Manufacturer warranty (yrs)
Replacement parts available (yrs)
Take-backprogramme
Recycled plastic weight %
Post-consumer/Post-industrial
Pixel policy period (months)
Pixel policy (bright/dark/combined sub-pixel)
Subtotal
Other
Energy during production
Other special features
Visibility
Subtotal
Total adjusted
MaximumPoints
5
3
5
3
3
3
3
11
30
n/a
n/a
12
6
6
6
30
7
7
3
n/a
7
n/a
6
30
4
3
3
10
10
Results
Global
YES
0
YES
0
YES
YES
YES
2
23.6
16.2
51.65%
93.3%
88.50%
n/a
3
5
GreenGuide
18.55%
100/0
12 - 36
3/6/6
n/a
n/a
n/a
Asus VW247-HFAsus
VW-247H-HF
Points
5.0
n/a
5.0
n/a
3.0
3.0
3.0
9.0
28.0
n/a
n/a
12.0
6.0
6.0
2.5
26.5
5.0
5.0
0.0
n/a
3.0
n/a
3.0
16.0
0.5
1.5
2.5
4.5
7.50
Results
Global
YES
0
YES
0
NO
YES
YES
4
24
18.9
44.35%
94.5%
89.00%
n/a
3
5
GreenGuide
13%
25/75
36
1/1/7
n/a
n/a
n/a
Points
5.0
n/a
5.0
n/a
0.0
3.0
3.0
7.0
23.0
n/a
n/a
10.6
6.0
6.0
4.0
26.6
5.0
5.0
2.0
n/a
2.0
n/a
5.5
19.5
0.0
0.0
1.5
1.5
7.06
Results
Global
YES
0
YES
0
YES
YES
YES
3
21.995
21.7
30.20%
73.0%
52.00%
n/a
3
3
GreenGuide
42%
76/24
36
2/5/5
n/a
n/a
n/a
Points
5.0
n/a
5.0
n/a
3.0
3.0
3.0
8.0
27.0
n/a
n/a
7.3
6.0
6.0
4.0
23.3
5.0
3.0
2.0
n/a
5.0
n/a
2.0
17.0
0.0
1.0
2.1
3.1
7.04
HP CompaqLE19f
Results
YES
0
YES
0
NO
NO
NO
3
19
15.0
33.18%
78.0%
64.00%
n/a
3
5
GreenGuide
12.70%
100/0
36
1/1/6
n/a
n/a
n/a
NA/SA/Asia/Pac
Points
5.0
n/a
5.0
n/a
0.0
0.0
0.0
8.0
18.0
n/a
n/a
8.0
6.0
6.0
3.5
23.5
5.0
5.0
1.0
n/a
3.0
n/a
5.5
19.5
1
1.0
2.4
4.4
6.54
FujitsuP23T-6 IPS
Results
Europe
NO
3
NO
3
YES
NO
YES
2
23
30.0
8.85%
0Watt
0 Watt
n/a
3
5
GreenGuide
20%
undefined
36
1/2/6
n/a
n/a
n/a
Points
0.0
1.8
0.0
1.8
3.0
0.0
3.0
9.0
18.6
n/a
n/a
2.1
6.0
6.0
6.0
20.1
5.0
5.0
1.0
n/a
2.0
n/a
5.5
18.5
0.0
1.0
1.8
2.8
6.00
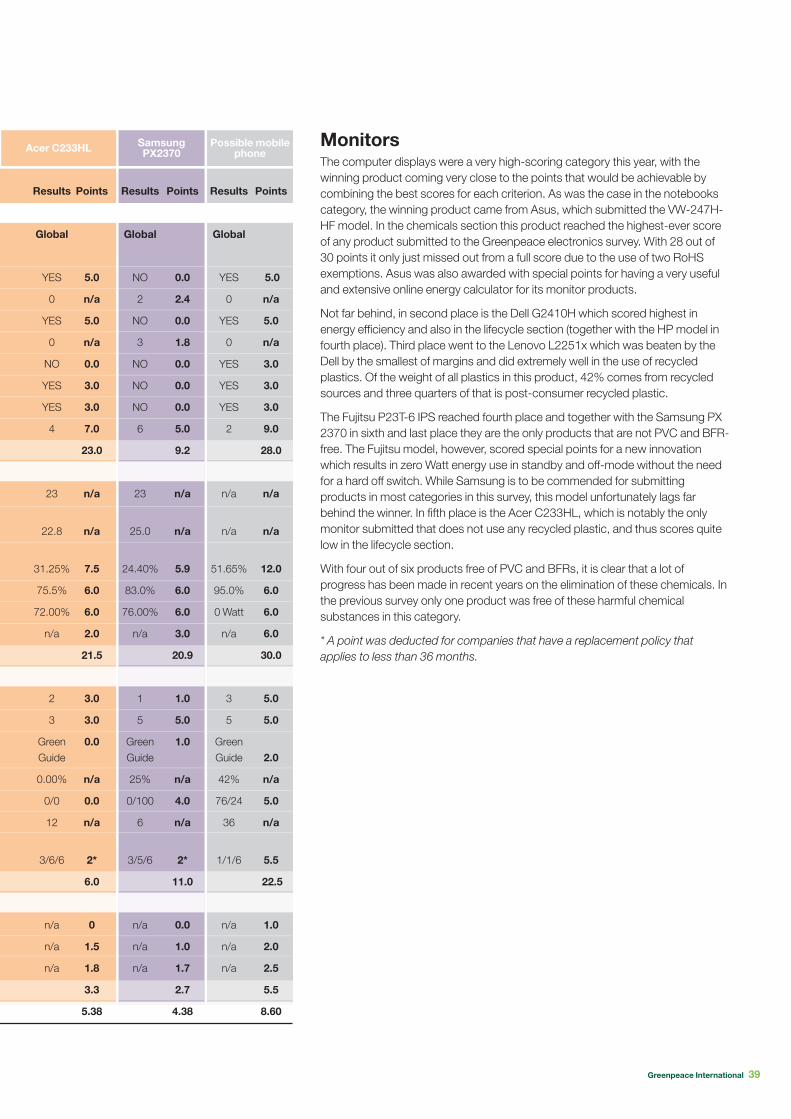
Greenpeace International 39
Acer C233HL
Results
Global
YES
0
YES
0
NO
YES
YES
4
23
22.8
31.25%
75.5%
72.00%
n/a
2
3
GreenGuide
0.00%
0/0
12
3/6/6
n/a
n/a
n/a
Points
5.0
n/a
5.0
n/a
0.0
3.0
3.0
7.0
23.0
n/a
n/a
7.5
6.0
6.0
2.0
21.5
3.0
3.0
0.0
n/a
0.0
n/a
2*
6.0
0
1.5
1.8
3.3
5.38
SamsungPX2370
Results
Global
NO
2
NO
3
NO
NO
NO
6
23
25.0
24.40%
83.0%
76.00%
n/a
1
5
GreenGuide
25%
0/100
6
3/5/6
n/a
n/a
n/a
Points
0.0
2.4
0.0
1.8
0.0
0.0
0.0
5.0
9.2
n/a
n/a
5.9
6.0
6.0
3.0
20.9
1.0
5.0
1.0
n/a
4.0
n/a
2*
11.0
0.0
1.0
1.7
2.7
4.38
Possible mobilephone
Results
Global
YES
0
YES
0
YES
YES
YES
2
n/a
n/a
51.65%
95.0%
0Watt
n/a
3
5
GreenGuide
42%
76/24
36
1/1/6
n/a
n/a
n/a
Points
5.0
n/a
5.0
n/a
3.0
3.0
3.0
9.0
28.0
n/a
n/a
12.0
6.0
6.0
6.0
30.0
5.0
5.0
2.0
n/a
5.0
n/a
5.5
22.5
1.0
2.0
2.5
5.5
8.60
MonitorsThe computer displays were a very high-scoring category this year, with thewinning product coming very close to the points that would be achievable bycombining the best scores for each criterion. As was the case in the notebookscategory, the winning product came from Asus, which submitted the VW-247H-HF model. In the chemicals section this product reached the highest-ever scoreof any product submitted to the Greenpeace electronics survey. With 28 out of30 points it only just missed out from a full score due to the use of two RoHSexemptions. Asus was also awarded with special points for having a very usefuland extensive online energy calculator for its monitor products.
Not far behind, in second place is the Dell G2410H which scored highest inenergy efficiency and also in the lifecycle section (together with the HP model infourth place). Third place went to the Lenovo L2251x which was beaten by theDell by the smallest of margins and did extremely well in the use of recycledplastics. Of the weight of all plastics in this product, 42% comes from recycledsources and three quarters of that is post-consumer recycled plastic.
The Fujitsu P23T-6 IPS reached fourth place and together with the Samsung PX2370 in sixth and last place they are the only products that are not PVC and BFR-free. The Fujitsu model, however, scored special points for a new innovationwhich results in zero Watt energy use in standby and off-mode without the needfor a hard off switch. While Samsung is to be commended for submittingproducts in most categories in this survey, this model unfortunately lags farbehind the winner. In fifth place is the Acer C233HL, which is notably the onlymonitor submitted that does not use any recycled plastic, and thus scores quitelow in the lifecycle section.
With four out of six products free of PVC and BFRs, it is clear that a lot ofprogress has been made in recent years on the elimination of these chemicals. Inthe previous survey only one product was free of these harmful chemicalsubstances in this category.
* A point was deducted for companies that have a replacement policy thatapplies to less than 36 months.

40 Greenpeace International
LG GD510Sony EricssonElm J10i
Criteria
Chemicals
Market
Totally PVC-free
PVC-containing parts
Totally BFR-free
BFR-containing parts
Antimony-free
Phthalate-free
Beryllium-free
RoHS exemptions used
Subtotal
Energy use
Active mode better than Energy Star (%points)
No-load EPS better than Energy Star(Watts)
Greenpeace energy matrix
Subtotal
Lifecycle
Manufacturer warranty (yrs)
Replacement parts available (yrs)
Take-back programme
Recycled plastic weight (% of total)
Post-consumer/Post-industrial
Upgradeable parts
Battery/handset price ratio
Subtotal
Other
Energy during production
Other innovations and features
Visibility
Subtotal
Total adjusted
MaximumPoints
5
3
5
3
3
3
3
11
30
16
8
6
30
7
7
3
n/a
7
2
4
30
4
3
3
10
10.00
Results
Global
YES
0
YES
0
NO
YES
NO
2
10.5 %
0.28
n/a
1
3
GreenGuide
37.20%
100/0
Batt Mem
13%
n/a
n/a
n/a
Samsung GT-S7550 (Blue
Earth)
Points
5.0
n/a
5.0
n/a
0.0
3.0
0.0
9.0
22.0
16.0
8.0
5.5
29.5
1.0
3.0
1.0
n/a
5.0
2.0
2.0
14.0
0
3
1.8
4.8
7.03
Results
Global
YES
0
YES
0
NO
YES
YES
3
3.31 %
0.27
n/a
1
3
GreenGuide
60.00%
100/0
Batt Mem
15%
n/a
n/a
n/a
Points
5.0
n/a
5.0
n/a
0.0
3.0
3.0
8.0
24.0
6.6
7.0
5.0
18.6
1.0
3.0
1.0
n/a
7.0
2.0
2.0
16.0
2.5
3
1.8
7.30
6.59
Results
Global
YES
0
YES
0
NO
NO
NO
2
8.36 %
0.27
n/a
1
3
GreenGuide
0.00%
0/0
Batt Mem
12%
n/a
n/a
n/a
Points
5.0
n/a
5.0
n/a
0.0
0.0
0.0
9.0
19.0
16.0
7.0
6.0
29.0
1.0
3.0
1.0
n/a
0.0
2.0
2.0
9.0
2
0.5
2.1
4.60
6.16
Nokia X3-02
Results
YES
0
YES
YES
NO
YES
YES
6
2.70 %
0.27
n/a
1
2
GreenGuide
0.00%
0/0
Batt Mem
19%
n/a
n/a
n/a
Eur./SA/AsiaPac/Afr.
Points
5.0
n/a
5.0
n/a
0.0
3.0
3.0
5.0
21.0
5.4
7.0
6.0
18.4
1.0
2.0
3.0
n/a
0.0
2.0
1.0
9.0
3
1
1.8
5.80
5.42
Motorola A45 Eco
Results
Americas
YES
0
YES
0
NO
YES
NO
3
0.00 %
0
n/a
1
1
GreenGuide
25.00%
100/0
Batt Mem
7%
n/a
n/a
n/a
Points
5.0
n/a
5.0
n/a
0.0
3.0
0.0
8.0
21.0
0.0
0.0
5.0
5.0
1.0
1.0
2.0
n/a
5.0
2.0
3.0
14.0
3
2
1.8
6.80
4.68
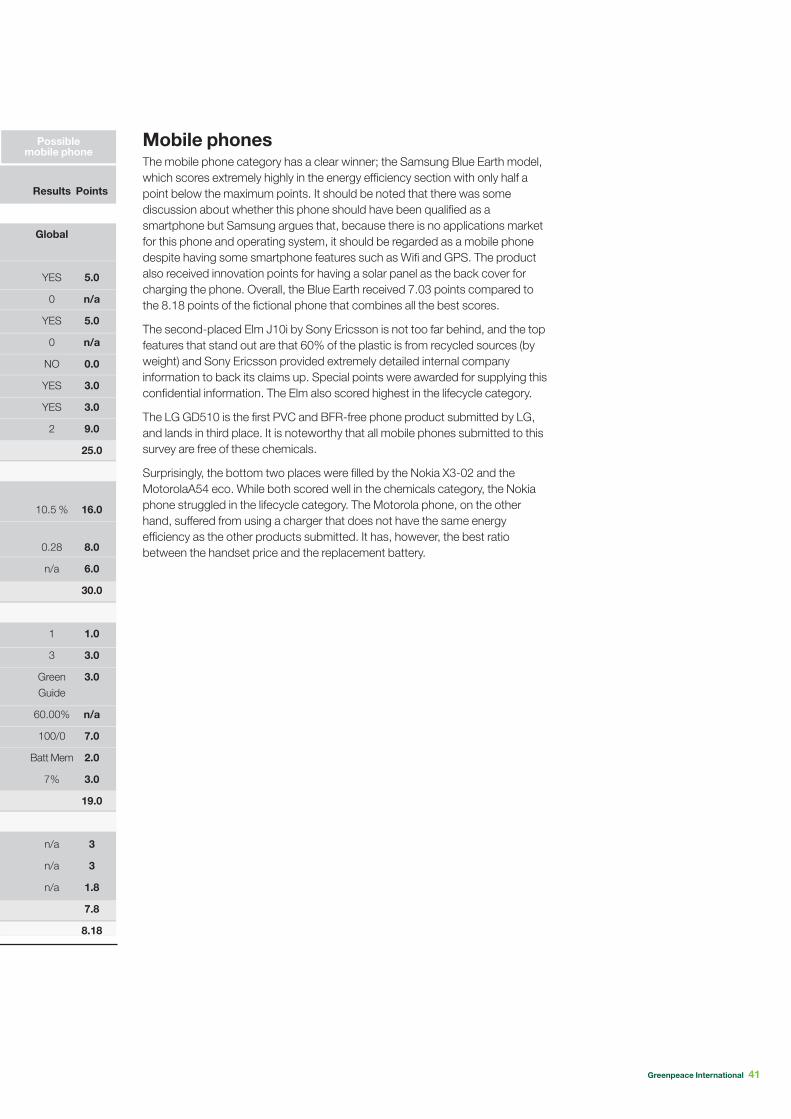
Greenpeace International 41
Possiblemobile phone
Results
Global
YES
0
YES
0
NO
YES
YES
2
10.5 %
0.28
n/a
1
3
GreenGuide
60.00%
100/0
Batt Mem
7%
n/a
n/a
n/a
Points
5.0
n/a
5.0
n/a
0.0
3.0
3.0
9.0
25.0
16.0
8.0
6.0
30.0
1.0
3.0
3.0
n/a
7.0
2.0
3.0
19.0
3
3
1.8
7.8
8.18
Mobile phonesThe mobile phone category has a clear winner; the Samsung Blue Earth model,which scores extremely highly in the energy efficiency section with only half apoint below the maximum points. It should be noted that there was somediscussion about whether this phone should have been qualified as asmartphone but Samsung argues that, because there is no applications marketfor this phone and operating system, it should be regarded as a mobile phonedespite having some smartphone features such as Wifi and GPS. The productalso received innovation points for having a solar panel as the back cover forcharging the phone. Overall, the Blue Earth received 7.03 points compared tothe 8.18 points of the fictional phone that combines all the best scores.
The second-placed Elm J10i by Sony Ericsson is not too far behind, and the topfeatures that stand out are that 60% of the plastic is from recycled sources (byweight) and Sony Ericsson provided extremely detailed internal companyinformation to back its claims up. Special points were awarded for supplying thisconfidential information. The Elm also scored highest in the lifecycle category.
The LG GD510 is the first PVC and BFR-free phone product submitted by LG,and lands in third place. It is noteworthy that all mobile phones submitted to thissurvey are free of these chemicals.
Surprisingly, the bottom two places were filled by the Nokia X3-02 and theMotorolaA54 eco. While both scored well in the chemicals category, the Nokiaphone struggled in the lifecycle category. The Motorola phone, on the otherhand, suffered from using a charger that does not have the same energyefficiency as the other products submitted. It has, however, the best ratiobetween the handset price and the replacement battery.

42 Greenpeace International
Samsung GT-S8500(Wave)
Nokia N8-00
Criteria
Chemicals
Market
Totally PVC-free
PVC-containing parts
Totally BFR-free
BFR-containing parts
Antimony-free
Phthalate-free
Beryllium-free
RoHS exemptions used
Subtotal
Energy use
EPS active mode better thanEnergy Star (% pts)
No-load EPS better than Energy Star(Watts)
Greenpeace energy matrix
Subtotal
Lifecycle
Manufacturer warranty (yrs)
Replacement parts available (yrs)
Take-back programme
Recycled plastic weight (% of total)
Post-consumer/Post-industrial
Upgradeable parts
Battery/handset price ratio
Subtotal
Other
Energy during production
Other innovations and features
Visibility
Subtotal
Total adjusted
MaximumPoints
5
3
5
3
3
3
3
11
30
16
8
6
30
7
7
3
n/a
7
2
4
30
4.0
3
3
10
10.00
Results
Global
YES
n/a
YES
0
NO
YES
YES
3
2.65 %
0.27
n/a
1
3
GreenGuide
30.00%
100/0
Batt Mem
18.00%
n/a
n/a
n/a
Asus VW247-HF
Sony EricssonAspen (M1i)
Points
5.0
n/a
5.0
n/a
0.0
3.0
3.0
8.0
24.0
5.3
7.0
5.5
17.8
1.0
3.0
1.0
n/a
5.0
2.0
1.0
13.0
2.5
3.0
1.8
7.3
6.21
Results
Global
YES
n/a
YES
0
NO
YES
YES
6
3.50 %
0.27
n/a
1
2
GreenGuide
0.00%
0/0
Memory
8.00%
n/a
n/a
n/a
Points
5.0
n/a
5.0
n/a
0.0
3.0
3.0
5.0
21.0
7.0
7.0
6.0
20.0
1.0
2.0
3.0
n/a
0.0
1.0
3.0
10.0
3.0
1.0
2.0
6.0
5.70
Results
Global
YES
n/a
YES
0
NO
YES
NO
3
2.50 %
0.15
n/a
1
3
GreenGuide
0.00%
0/0
Batt Mem
9.50%
n/a
n/a
n/a
Points
5.0
n/a
5.0
n/a
0.0
3.0
0.0
8.0
21.0
5.0
3.0
5.5
13.5
1.0
3.0
1.0
n/a
0.0
2.0
3.0
10.0
0.0
2.0
1.8
3.8
4.83
HP Palm PixiPlus
Results
YES
n/a
NO
2
NO
NO
NO
4
4.93 %
0.12
n/a
1
7
GreenGuide
0.00%
0/0
Batt Mem
14.60%
n/a
n/a
n/a
Europe, NA
Points
5.0
n/a
0.0
2.4
0.0
0.0
0.0
7.0
14.4
9.9
3.0
3.0
15.9
1.0
7.0
1.0
n/a
0.0
1.0
2.0
12.0
1.0
1.5
2.3
4.8
4.71
Blackberry Pearl3G - 9100/9105
Results
Global
NO
1
NO
3
NO
NO
NO
3
2.29 %
0.15
n/a
1
3
GreenGuide
0.00%
0/0
Batt Mem
9.20%
n/a
n/a
n/a
Points
0.0
3.0
0.0
1.8
0.0
0.0
0.0
8.0
12.8
4.6
3.0
2.5
10.1
1.0
3.0
0.0
n/a
0.0
2.0
3.0
9.0
0.0
0.0
2.1
2.1
3.40
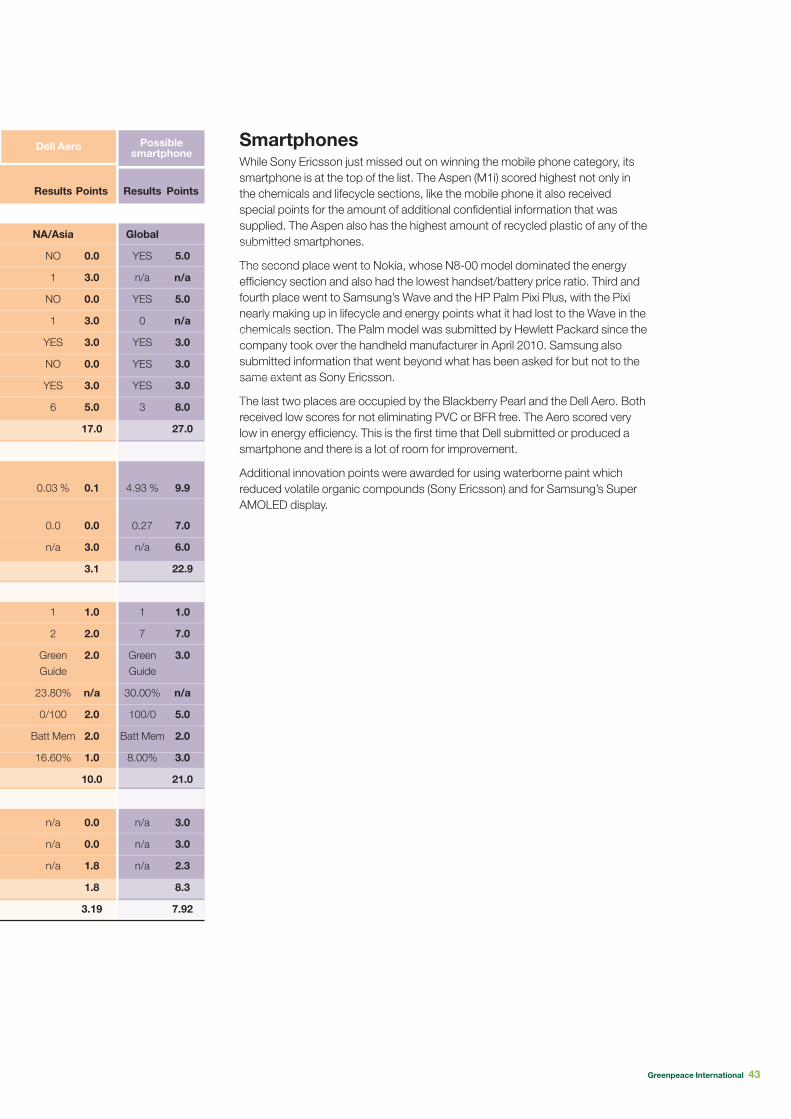
Greenpeace International 43
Dell Aero
Results
NA/Asia
NO
1
NO
1
YES
NO
YES
6
0.03 %
0.0
n/a
1
2
GreenGuide
23.80%
0/100
Batt Mem
16.60%
n/a
n/a
n/a
Points
0.0
3.0
0.0
3.0
3.0
0.0
3.0
5.0
17.0
0.1
0.0
3.0
3.1
1.0
2.0
2.0
n/a
2.0
2.0
1.0
10.0
0.0
0.0
1.8
1.8
3.19
Possiblesmartphone
Results
Global
YES
n/a
YES
0
YES
YES
YES
3
4.93 %
0.27
n/a
1
7
GreenGuide
30.00%
100/0
Batt Mem
8.00%
n/a
n/a
n/a
Points
5.0
n/a
5.0
n/a
3.0
3.0
3.0
8.0
27.0
9.9
7.0
6.0
22.9
1.0
7.0
3.0
n/a
5.0
2.0
3.0
21.0
3.0
3.0
2.3
8.3
7.92
SmartphonesWhile Sony Ericsson just missed out on winning the mobile phone category, itssmartphone is at the top of the list. The Aspen (M1i) scored highest not only inthe chemicals and lifecycle sections, like the mobile phone it also receivedspecial points for the amount of additional confidential information that wassupplied. The Aspen also has the highest amount of recycled plastic of any of thesubmitted smartphones.
The second place went to Nokia, whose N8-00 model dominated the energyefficiency section and also had the lowest handset/battery price ratio. Third andfourth place went to Samsung’s Wave and the HP Palm Pixi Plus, with the Pixinearly making up in lifecycle and energy points what it had lost to the Wave in thechemicals section. The Palm model was submitted by Hewlett Packard since thecompany took over the handheld manufacturer in April 2010. Samsung alsosubmitted information that went beyond what has been asked for but not to thesame extent as Sony Ericsson.
The last two places are occupied by the Blackberry Pearl and the Dell Aero. Bothreceived low scores for not eliminating PVC or BFR free. The Aero scored verylow in energy efficiency. This is the first time that Dell submitted or produced asmartphone and there is a lot of room for improvement.
Additional innovation points were awarded for using waterborne paint whichreduced volatile organic compounds (Sony Ericsson) and for Samsung’s SuperAMOLED display.
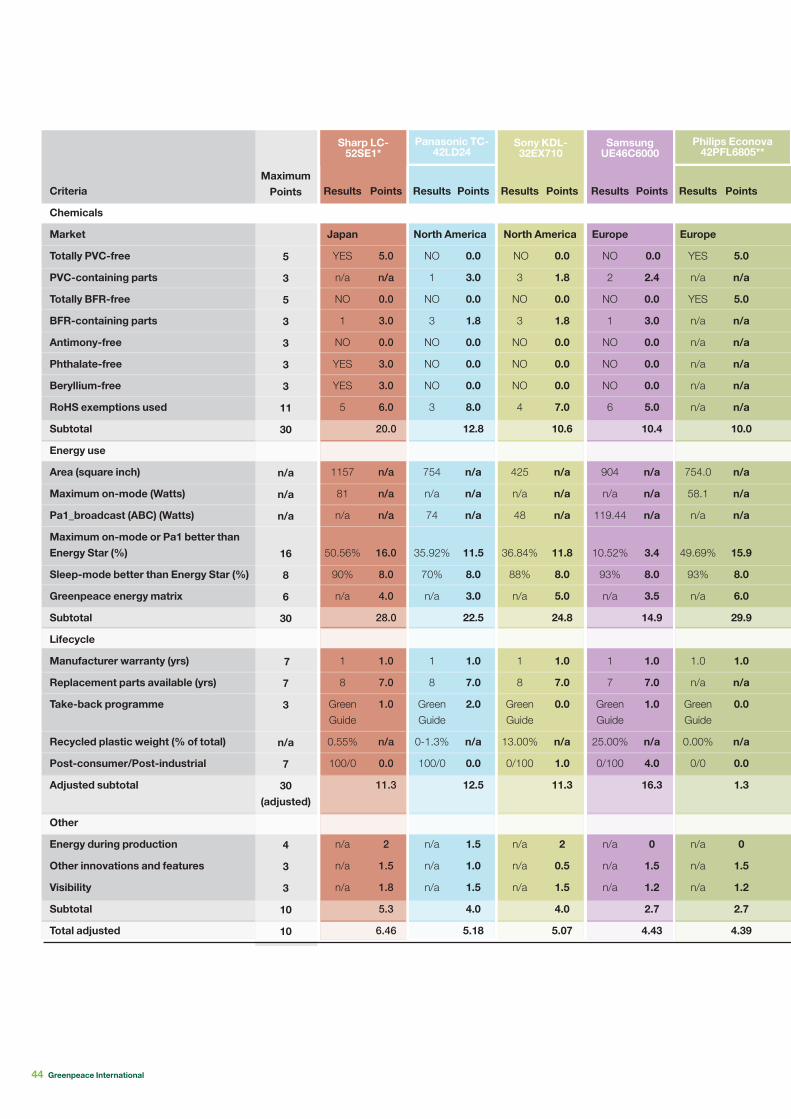
44 Greenpeace International
Sony KDL-32EX710
Panasonic TC-42LD24
Criteria
Chemicals
Market
Totally PVC-free
PVC-containing parts
Totally BFR-free
BFR-containing parts
Antimony-free
Phthalate-free
Beryllium-free
RoHS exemptions used
Subtotal
Energy use
Area (square inch)
Maximum on-mode (Watts)
Pa1_broadcast (ABC) (Watts)
Maximum on-mode or Pa1 better thanEnergy Star (%)
Sleep-mode better than Energy Star (%)
Greenpeace energy matrix
Subtotal
Lifecycle
Manufacturer warranty (yrs)
Replacement parts available (yrs)
Take-back programme
Recycled plastic weight (% of total)
Post-consumer/Post-industrial
Adjusted subtotal
Other
Energy during production
Other innovations and features
Visibility
Subtotal
Total adjusted
MaximumPoints
5
3
5
3
3
3
3
11
30
n/a
n/a
n/a
16
8
6
30
7
7
3
n/a
7
30(adjusted)
4
3
3
10
10
Results
Japan
YES
n/a
NO
1
NO
YES
YES
5
1157
81
n/a
50.56%
90%
n/a
1
8
GreenGuide
0.55%
100/0
n/a
n/a
n/a
Asus VW247-HFSharp LC-52SE1*
Points
5.0
n/a
0.0
3.0
0.0
3.0
3.0
6.0
20.0
n/a
n/a
n/a
16.0
8.0
4.0
28.0
1.0
7.0
1.0
n/a
0.0
11.3
2
1.5
1.8
5.3
6.46
Results
NO
1
NO
3
NO
NO
NO
3
754
n/a
74
35.92%
70%
n/a
1
8
GreenGuide
0-1.3%
100/0
n/a
n/a
n/a
North America North America
Points
0.0
3.0
0.0
1.8
0.0
0.0
0.0
8.0
12.8
n/a
n/a
n/a
11.5
8.0
3.0
22.5
1.0
7.0
2.0
n/a
0.0
12.5
1.5
1.0
1.5
4.0
5.18
Results
NO
3
NO
3
NO
NO
NO
4
425
n/a
48
36.84%
88%
n/a
1
8
GreenGuide
13.00%
0/100
n/a
n/a
n/a
Points
0.0
1.8
0.0
1.8
0.0
0.0
0.0
7.0
10.6
n/a
n/a
n/a
11.8
8.0
5.0
24.8
1.0
7.0
0.0
n/a
1.0
11.3
2
0.5
1.5
4.0
5.07
SamsungUE46C6000
Results
Europe
NO
2
NO
1
NO
NO
NO
6
904
n/a
119.44
10.52%
93%
n/a
1
7
GreenGuide
25.00%
0/100
n/a
n/a
n/a
Points
0.0
2.4
0.0
3.0
0.0
0.0
0.0
5.0
10.4
n/a
n/a
n/a
3.4
8.0
3.5
14.9
1.0
7.0
1.0
n/a
4.0
16.3
0
1.5
1.2
2.7
4.43
Philips Econova42PFL6805**
Results
Europe
YES
n/a
YES
n/a
n/a
n/a
n/a
n/a
754.0
58.1
n/a
49.69%
93%
n/a
1.0
n/a
GreenGuide
0.00%
0/0
n/a
n/a
n/a
Points
5.0
n/a
5.0
n/a
n/a
n/a
n/a
n/a
10.0
n/a
n/a
n/a
15.9
8.0
6.0
29.9
1.0
n/a
0.0
n/a
0.0
1.3
0
1.5
1.2
2.7
4.39
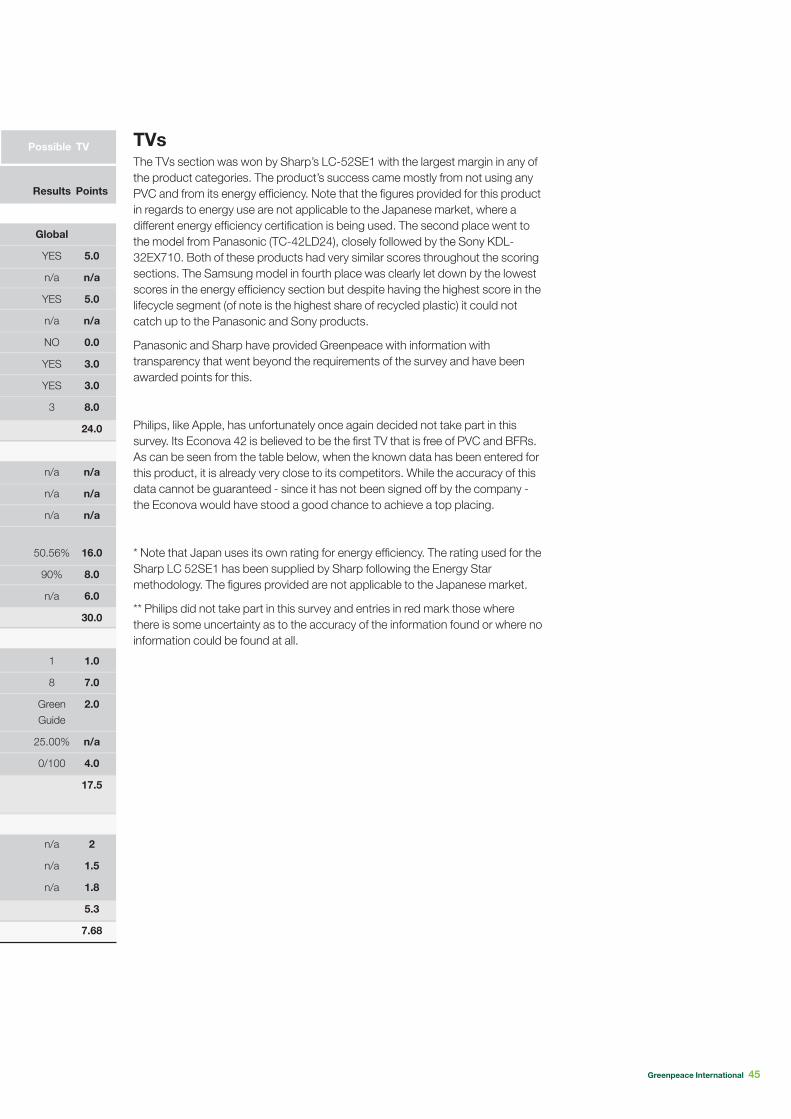
Greenpeace International 45
Possible TV
Results
Global
YES
n/a
YES
n/a
NO
YES
YES
3
n/a
n/a
n/a
50.56%
90%
n/a
1
8
GreenGuide
25.00%
0/100
n/a
n/a
n/a
Points
5.0
n/a
5.0
n/a
0.0
3.0
3.0
8.0
24.0
n/a
n/a
n/a
16.0
8.0
6.0
30.0
1.0
7.0
2.0
n/a
4.0
17.5
2
1.5
1.8
5.3
7.68
TVsThe TVs section was won by Sharp’s LC-52SE1 with the largest margin in any ofthe product categories. The product’s success came mostly from not using anyPVC and from its energy efficiency. Note that the figures provided for this productin regards to energy use are not applicable to the Japanese market, where adifferent energy efficiency certification is being used. The second place went tothe model from Panasonic (TC-42LD24), closely followed by the Sony KDL-32EX710. Both of these products had very similar scores throughout the scoringsections. The Samsung model in fourth place was clearly let down by the lowestscores in the energy efficiency section but despite having the highest score in thelifecycle segment (of note is the highest share of recycled plastic) it could notcatch up to the Panasonic and Sony products.
Panasonic and Sharp have provided Greenpeace with information withtransparency that went beyond the requirements of the survey and have beenawarded points for this.
Philips, like Apple, has unfortunately once again decided not take part in thissurvey. Its Econova 42 is believed to be the first TV that is free of PVC and BFRs.As can be seen from the table below, when the known data has been entered forthis product, it is already very close to its competitors. While the accuracy of thisdata cannot be guaranteed - since it has not been signed off by the company -the Econova would have stood a good chance to achieve a top placing.
* Note that Japan uses its own rating for energy efficiency. The rating used for theSharp LC 52SE1 has been supplied by Sharp following the Energy Starmethodology. The figures provided are not applicable to the Japanese market.
** Philips did not take part in this survey and entries in red mark those wherethere is some uncertainty as to the accuracy of the information found or where noinformation could be found at all.
46 Fishy Business: Stolen Pacific Tuna in the EuropeanMarket46
Greenpeace is an independent globalcampaigning organisation that acts tochange attitudes and behaviour, toprotect and conserve the environmentand to promote peace.
Greenpeace InternationalOttho Heldringstraat 51066 AZ AmsterdamThe NetherlandsTel: +31 20 7182000Fax: +31 20 7182002
greenpeace.org