towards a gis-based urban information system to … · towards a gis-based urban information system...
TRANSCRIPT
Nakh
ara
1
Towards a GIS-based Urban Information System to Plan a Smarter Chiang Mai
ABSTRACT
he concept of the Smart City has recently been introduced to help make urban planning in Chiang Mai more effective. In particular, the Smart City idea is being integrated with Geographical Information
Systems (GIS) and Information and Communications Technologies (ICTs) to support better decision- making. This paper employs GIS-based ICTs as a means for updating the land use database of the Public Work and Town & Country Planning within the Chiang Mai Comprehensive Plan Boundary between 2000 and 2015. Results show that built-up areas of all urban land use categories have increased. The biggest change was found in the low density residential class with 33% and 37.5 % increase in number of buildings and in total area, respectively. The smallest change was found in Government Institutions and Public Utilities zone with 1.4% increase in the number of buildings.
Keywords: Chiang Mai Comprehensive Plan Boundary, ICTs, GIS, land use zone; urban sprawl, Smart City
Towards a GIS-based Urban Information System to Plan a Smarter Chiang Mai Somporn SangawongseDepartment of Social and Development, Faculty of Social Sciences, Chiang Mai University, ThailandE-mail: [email protected]
Vittaya RuangritChiang Mai Provincial Office of Public Works and Town and Country Planning, ThailandE-mail: [email protected]
T
INTRODUCTION
Chiang Mai and its city-regions are expanding rapidly with little signs of comprehensive urban planning that will ensure a good and sustainable quality of life for its citizens. The planning processes in Chiang Mai are ubiquitous, but marred by regulatory and public participation issues, which have made the control of urban development ineffective (Yuwasilp, 2014). The present city plan was announced in 2012 and is in its 3rd revision. The 3rd revision plan covers
415 square kilometers, with 11 land use zones or classes (DPT, 2013). Each land use zone consists of blocks and plots of land which were classifi ed by different functions (Roachanakanan, 2014). The city has developed into a polycentric structure with two axes, two belts, and multiple urban centers (Ruangrit,2008). There are one city municipality, three town municipalities, 37 sub-district municipalities, and 3 sub-district administrative organization in the Chiang Mai comprehensive plan boundary (Figure 1).

Nakh
ara
2
Somporn Sangawongse / Vittaya Ruangrit
Urbanization in Chiang Mai is being accelerated by economic growth that is driving a generation to move out of rural areas and livelihoods to live and work in the city (Singhanetra-Renard,1999; Yap Kioe Sheng and Lebel, 2009). Economic growth has driven land use changes in the designated zones within the Chiang Mai Comprehensive Plan Boundary (CMCB), as evident by building booms and the extensive development of housing estates. Chiang Mai’s massive growth, especially during the past three decades, has created urban sprawl leading to many other problems such as misuse of land and loss of prime agricultural land (DPT, 2013). In response to these problems, the Department of Public Works and Town and Country Planning (DPT) Chiang Mai regional offi ce has established the project on GIS database development to support the assessment and improvement of Chiang Mai’s comprehensive planning. A GIS was applied as part of the DPT framework for developing an Urban
Figure 1:Map of Chiang Mai’s Comprehensive Plan Boundary and its Municipalities
Information System (UIS). This paper has two main objectives: (1) to introduce the concept of smart city, along with the ability of GIS to support smarter planning and development in Chiang Mai and (2) to illustrate the successful application of GIS and ICTs for updating the current land use database within the comprehensive plan boundary.
GIS ENABLED SMART CITY SOLUTION
Smart City Concept
Currently city planners around the world are trying to fi nd smarter ways to manage challenges ensuring livable conditions in a context of rapid urban population growth by adopting the smart city (SMC) concept. A smart city can be defi ned as a
Nakh
ara
3
Towards a GIS-based Urban Information System to Plan a Smarter Chiang Mai
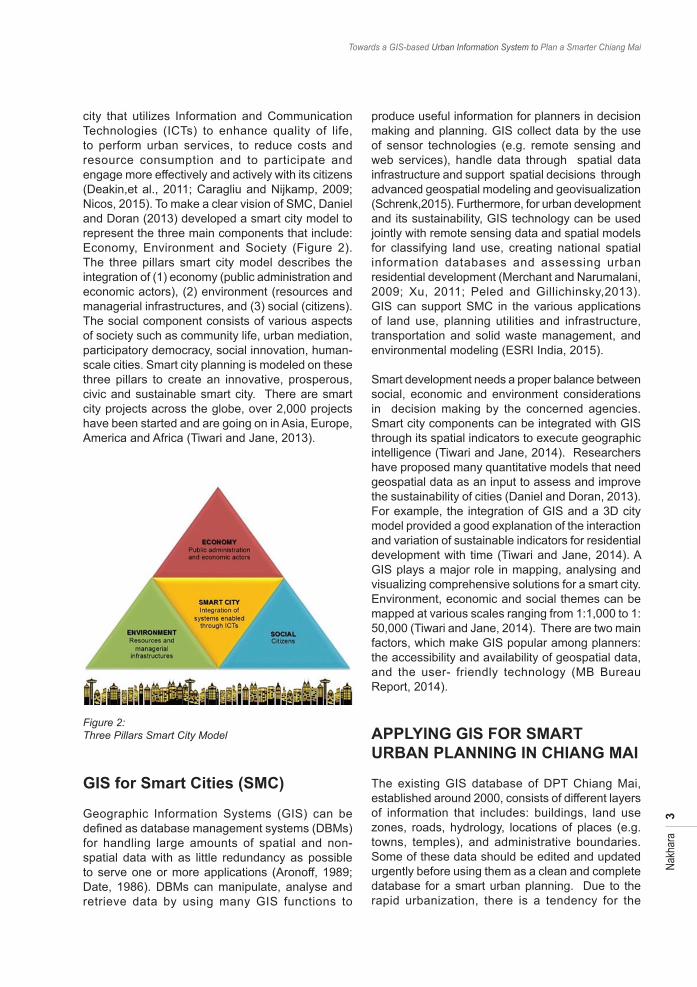
city that utilizes Information and Communication Technologies (ICTs) to enhance quality of life, to perform urban services, to reduce costs and resource consumption and to participate and engage more effectively and actively with its citizens (Deakin,et al., 2011; Caragliu and Nijkamp, 2009; Nicos, 2015). To make a clear vision of SMC, Daniel and Doran (2013) developed a smart city model to represent the three main components that include: Economy, Environment and Society (Figure 2). The three pillars smart city model describes the integration of (1) economy (public administration and economic actors), (2) environment (resources and managerial infrastructures, and (3) social (citizens). The social component consists of various aspects of society such as community life, urban mediation, participatory democracy, social innovation, human-scale cities. Smart city planning is modeled on these three pillars to create an innovative, prosperous, civic and sustainable smart city. There are smart city projects across the globe, over 2,000 projects have been started and are going on in Asia, Europe, America and Africa (Tiwari and Jane, 2013).
produce useful information for planners in decision making and planning. GIS collect data by the use of sensor technologies (e.g. remote sensing and web services), handle data through spatial data infrastructure and support spatial decisions through advanced geospatial modeling and geovisualization (Schrenk,2015). Furthermore, for urban development and its sustainability, GIS technology can be used jointly with remote sensing data and spatial models for classifying land use, creating national spatial information databases and assessing urban residential development (Merchant and Narumalani, 2009; Xu, 2011; Peled and Gillichinsky,2013). GIS can support SMC in the various applications of land use, planning utilities and infrastructure, transportation and solid waste management, and environmental modeling (ESRI India, 2015).
Smart development needs a proper balance between social, economic and environment considerations in decision making by the concerned agencies. Smart city components can be integrated with GIS through its spatial indicators to execute geographic intelligence (Tiwari and Jane, 2014). Researchers have proposed many quantitative models that need geospatial data as an input to assess and improve the sustainability of cities (Daniel and Doran, 2013). For example, the integration of GIS and a 3D city model provided a good explanation of the interaction and variation of sustainable indicators for residential development with time (Tiwari and Jane, 2014). A GIS plays a major role in mapping, analysing and visualizing comprehensive solutions for a smart city. Environment, economic and social themes can be mapped at various scales ranging from 1:1,000 to 1: 50,000 (Tiwari and Jane, 2014). There are two main factors, which make GIS popular among planners: the accessibility and availability of geospatial data, and the user- friendly technology (MB Bureau Report, 2014).
APPLYING GIS FOR SMART URBAN PLANNING IN CHIANG MAI The existing GIS database of DPT Chiang Mai, established around 2000, consists of different layers of information that includes: buildings, land use zones, roads, hydrology, locations of places (e.g. towns, temples), and administrative boundaries. Some of these data should be edited and updated urgently before using them as a clean and complete database for a smart urban planning. Due to the rapid urbanization, there is a tendency for the
Figure 2:Three Pillars Smart City Model
GIS for Smart Cities (SMC)
Geographic Information Systems (GIS) can be defi ned as database management systems (DBMs) for handling large amounts of spatial and non-spatial data with as little redundancy as possible to serve one or more applications (Aronoff, 1989; Date, 1986). DBMs can manipulate, analyse and retrieve data by using many GIS functions to
Nakh
ara
4
Somporn Sangawongse / Vittaya Ruangrit
urban land to increase and expand beyond the legal boundary. Effective urban planning needs up-to-date the land use database, which can be visualized by using maps for better communication and for sharing knowledge that leads to understanding of land use. Tools like GIS, ICTs, remote sensing satellites, are considered as key drivers among others (e.g. development of data infrastructure concept and growth of mega cities and urbanization) that are infl uencing spatial developments in the Asia and the Pacifi c region (Williamson, 2009).
Data Input and Preparation
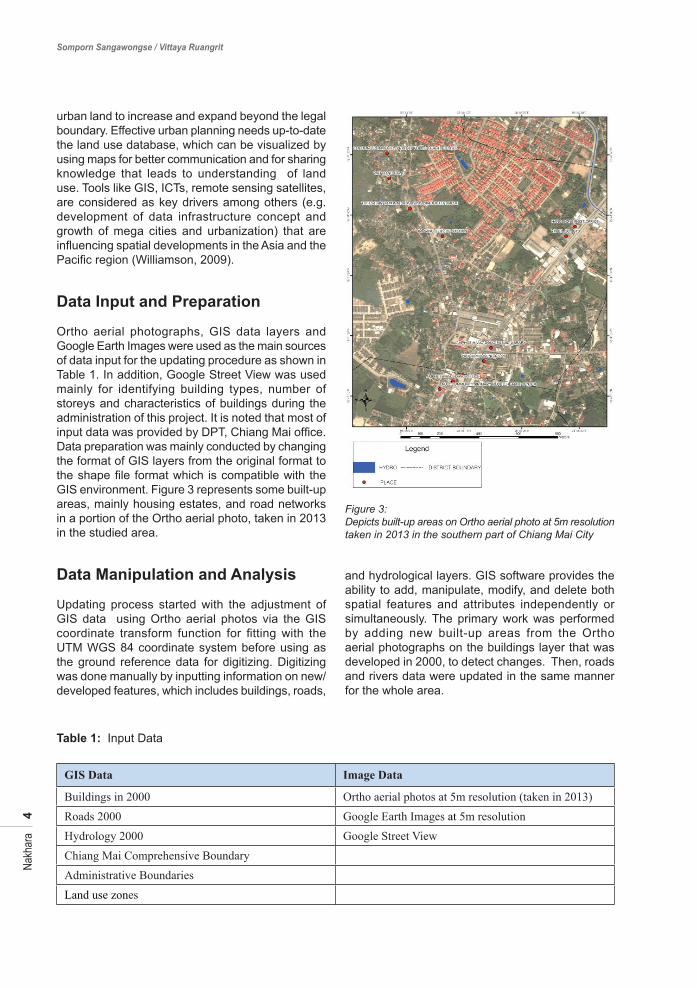
Ortho aerial photographs, GIS data layers and Google Earth Images were used as the main sources of data input for the updating procedure as shown in Table 1. In addition, Google Street View was used mainly for identifying building types, number of storeys and characteristics of buildings during the administration of this project. It is noted that most of input data was provided by DPT, Chiang Mai offi ce. Data preparation was mainly conducted by changing the format of GIS layers from the original format to the shape fi le format which is compatible with the GIS environment. Figure 3 represents some built-up areas, mainly housing estates, and road networks in a portion of the Ortho aerial photo, taken in 2013 in the studied area.
Data Manipulation and Analysis
Updating process started with the adjustment of GIS data using Ortho aerial photos via the GIS coordinate transform function for fi tting with the UTM WGS 84 coordinate system before using as the ground reference data for digitizing. Digitizing was done manually by inputting information on new/developed features, which includes buildings, roads,
and hydrological layers. GIS software provides the ability to add, manipulate, modify, and delete both spatial features and attributes independently or simultaneously. The primary work was performed by adding new built-up areas from the Ortho aerial photographs on the buildings layer that was developed in 2000, to detect changes. Then, roads and rivers data were updated in the same manner for the whole area.
Table 1: Input Data
GIS Data Image Data
Buildings in 2000 Ortho aerial photos at 5m resolution (taken in 2013)Roads 2000 Google Earth Images at 5m resolutionHydrology 2000 Google Street ViewChiang Mai Comprehensive BoundaryAdministrative BoundariesLand use zones
Figure 3: Depicts built-up areas on Ortho aerial photo at 5m resolution taken in 2013 in the southern part of Chiang Mai City
Nakh
ara
5
Towards a GIS-based Urban Information System to Plan a Smarter Chiang Mai
Data manipulation was conducted after the digitizing had been completed. This is not only to ensure the validity of the input data, but also to add characteristic data for the layers. The MapInfo data dictionary V.1.2A was used as the standard metadata for updating the attribute table. This data dictionary provides details concerning name, data type and data description of buildings’ identifi cation codes and building types, which are necessary for updating. Emphasis was placed on adding the missing information in the 2000 database, for instance the building types, building heights, building materials, and the number of storeys. Spatial data manipulation used for this project included spatial merging, dissolve and area calculation. Spatial merging was done by joining all updated buildings, roads and rivers from small maps (digitized from separate pieces of Ortho-aerial photographs) into one map that covered the entire CMCB. Calculation of geometry was done to measure the number of buildings and the aerial extent of buildings, as well as for measuring lengths of new roads and rivers.
Additionally, the completed database was analysed for determining the total number of buildings and their areal coverage’s by each block. This procedure was conducted by linking the buildings’ database with the land use zoning data using “block number”
as key identifi er. The result of this analysis was obtained by using database query. The hard copy of land use zoning map developed in 2013 at 1: 40,000 scale from DPT, Chiang Mai greatly assisted in this analysis because the boundary of different land use blocks can be detected clearly.
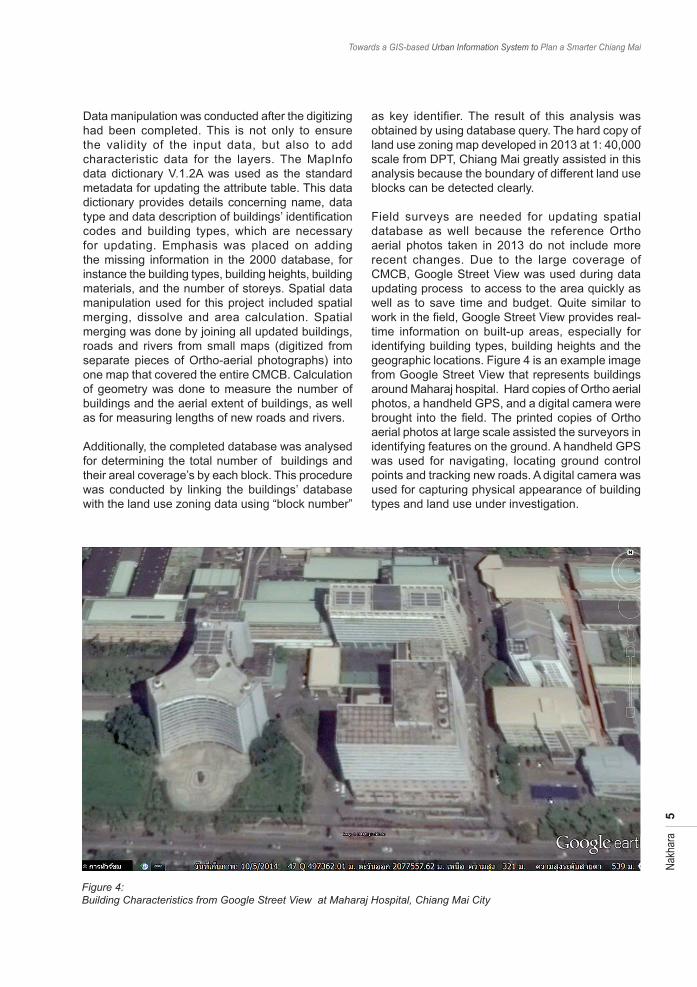
Field surveys are needed for updating spatial database as well because the reference Ortho aerial photos taken in 2013 do not include more recent changes. Due to the large coverage of CMCB, Google Street View was used during data updating process to access to the area quickly as well as to save time and budget. Quite similar to work in the fi eld, Google Street View provides real-time information on built-up areas, especially for identifying building types, building heights and the geographic locations. Figure 4 is an example image from Google Street View that represents buildings around Maharaj hospital. Hard copies of Ortho aerial photos, a handheld GPS, and a digital camera were brought into the fi eld. The printed copies of Ortho aerial photos at large scale assisted the surveyors in identifying features on the ground. A handheld GPS was used for navigating, locating ground control points and tracking new roads. A digital camera was used for capturing physical appearance of building types and land use under investigation.
Figure 4: Building Characteristics from Google Street View at Maharaj Hospital, Chiang Mai City
Nakh
ara
6
Somporn Sangawongse / Vittaya Ruangrit
RESULTS AND DISCUSSION
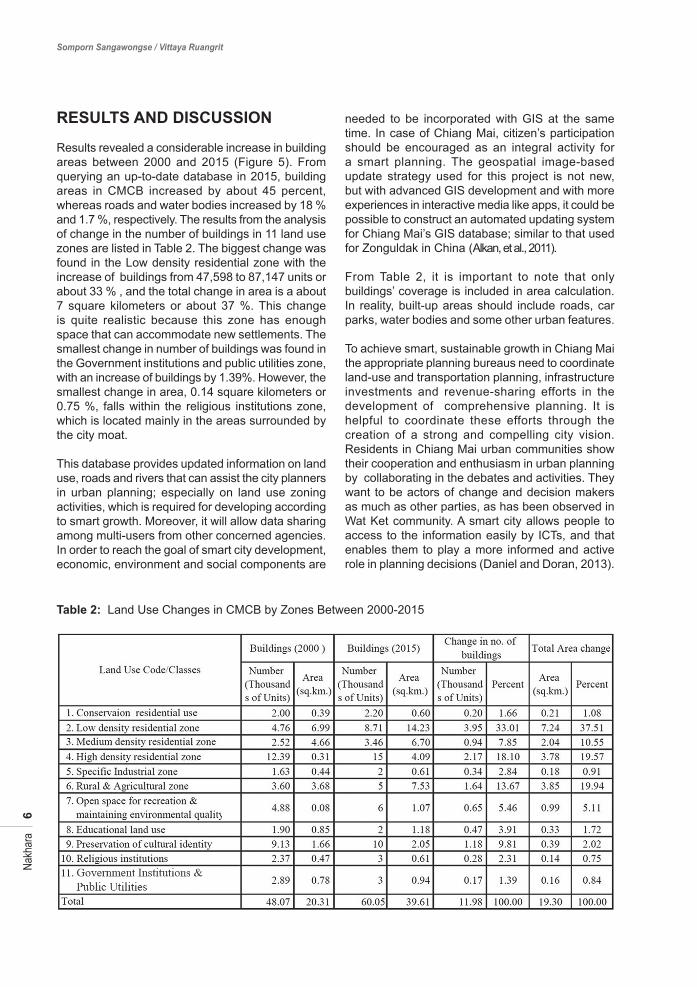
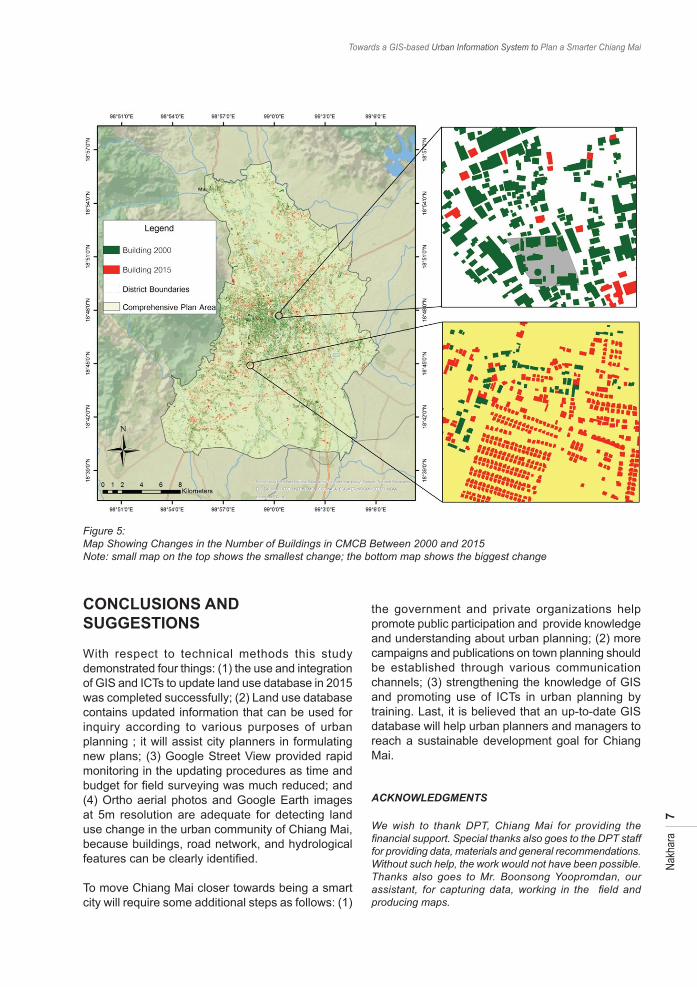
Results revealed a considerable increase in building areas between 2000 and 2015 (Figure 5). From querying an up-to-date database in 2015, building areas in CMCB increased by about 45 percent, whereas roads and water bodies increased by 18 % and 1.7 %, respectively. The results from the analysis of change in the number of buildings in 11 land use zones are listed in Table 2. The biggest change was found in the Low density residential zone with the increase of buildings from 47,598 to 87,147 units or about 33 % , and the total change in area is a about 7 square kilometers or about 37 %. This change is quite realistic because this zone has enough space that can accommodate new settlements. The smallest change in number of buildings was found in the Government institutions and public utilities zone, with an increase of buildings by 1.39%. However, the smallest change in area, 0.14 square kilometers or 0.75 %, falls within the religious institutions zone, which is located mainly in the areas surrounded by the city moat.
This database provides updated information on land use, roads and rivers that can assist the city planners in urban planning; especially on land use zoning activities, which is required for developing according to smart growth. Moreover, it will allow data sharing among multi-users from other concerned agencies. In order to reach the goal of smart city development, economic, environment and social components are
needed to be incorporated with GIS at the same time. In case of Chiang Mai, citizen’s participation should be encouraged as an integral activity for a smart planning. The geospatial image-based update strategy used for this project is not new, but with advanced GIS development and with more experiences in interactive media like apps, it could be possible to construct an automated updating system for Chiang Mai’s GIS database; similar to that used for Zonguldak in China (Alkan, et al., 2011).
From Table 2, it is important to note that only buildings’ coverage is included in area calculation. In reality, built-up areas should include roads, car parks, water bodies and some other urban features.
To achieve smart, sustainable growth in Chiang Mai the appropriate planning bureaus need to coordinate land-use and transportation planning, infrastructure investments and revenue-sharing efforts in the development of comprehensive planning. It is helpful to coordinate these efforts through the creation of a strong and compelling city vision. Residents in Chiang Mai urban communities show their cooperation and enthusiasm in urban planning by collaborating in the debates and activities. They want to be actors of change and decision makers as much as other parties, as has been observed in Wat Ket community. A smart city allows people to access to the information easily by ICTs, and that enables them to play a more informed and active role in planning decisions (Daniel and Doran, 2013).
Table 2: Land Use Changes in CMCB by Zones Between 2000-2015
Nakh
ara
7
Towards a GIS-based Urban Information System to Plan a Smarter Chiang Mai
Figure 5:Map Showing Changes in the Number of Buildings in CMCB Between 2000 and 2015Note: small map on the top shows the smallest change; the bottom map shows the biggest change
CONCLUSIONS AND SUGGESTIONS With respect to technical methods this study demonstrated four things: (1) the use and integration of GIS and ICTs to update land use database in 2015 was completed successfully; (2) Land use database contains updated information that can be used for inquiry according to various purposes of urban planning ; it will assist city planners in formulating new plans; (3) Google Street View provided rapid monitoring in the updating procedures as time and budget for fi eld surveying was much reduced; and (4) Ortho aerial photos and Google Earth images at 5m resolution are adequate for detecting land use change in the urban community of Chiang Mai, because buildings, road network, and hydrological features can be clearly identifi ed.
To move Chiang Mai closer towards being a smart city will require some additional steps as follows: (1)
the government and private organizations help promote public participation and provide knowledge and understanding about urban planning; (2) more campaigns and publications on town planning should be established through various communication channels; (3) strengthening the knowledge of GIS and promoting use of ICTs in urban planning by training. Last, it is believed that an up-to-date GIS database will help urban planners and managers to reach a sustainable development goal for Chiang Mai.
ACKNOWLEDGMENTS
We wish to thank DPT, Chiang Mai for providing the fi nancial support. Special thanks also goes to the DPT staff for providing data, materials and general recommendations. Without such help, the work would not have been possible. Thanks also goes to Mr. Boonsong Yoopromdan, our assistant, for capturing data, working in the fi eld and producing maps.
Nakh
ara
8
Somporn Sangawongse / Vittaya Ruangrit
REFERENCES
Alkan, M. D. , Arca, Ç. , Bayik A. and M. Marangoz. (2011). Updating Object for GIS database Information using High Resolution Satellite Images: A Case Study Zonguldak. International Archives of the Photogrammetry, Remote Sensing and Spatial Information Sciences, Volume XXXVIII-4/W19, 2011ISPRS Hannover 2011 Workshop, 14-17 June 2011, Hannover, Germany.
Aronoff, S. (1989). Geographic Information Systems: A Management perception, Ottawa: WDL Publications.
Caragliu, A; Del Bo, C. and Nijkamp, P. (2009). “Smart cities in Europe”. Serie Research Memoranda 0048 (VU University Amsterdam, Faculty of Economics, Business Administration and Econometrics).
Date, C. J. (1986). An introduction to database systems (4th ed). The systems programming series, Addison-Wiley.
Deakin, M.; Al Waer, Husam. (2011). “From Intelligent to Smart Cities”. Journal of Intelligent Buildings International: From Intelligent Cities to Smart Cities 3 (3).doi:10.1080/17508975.2011.586671.
Department of Public Works and Town, Country Planning-DPT. (2013), The third Chiang Mai Comprehensive Plan [Online]. http://www.dpt.go.th/urbanplanning/fi leload/map/p500100102.jpg (retrieved 30 March 2015)
Daniel, S. and Doran, M. A. (2013). geoSmartCity: geomatics contribution to the Smart City, Journee de I’ Informatique du Quebec (Quebec City, QC, Canada, June 17-20,2013/09). [Online] available: https://of.tis.org/wp-content/uploads/2013/09/Daniel_Doran_geoSmartCities_dgo2013-fi nal.pdf.
ESRI India. (2014). White Paper - GIS for Smart Cities [on line] available: [email protected] (retrieved 30 June 2015).
Merchant, J. W. and Narumalani, S. (2010). Integrating Remote Sensing and GIS –Chapter 18, SAGE Publications.
MB Bureau Report. (2014). Urban Planning for Smart Cities using GIS. The Masterbuilder: November 2014, p.69.
Nicos, K. (2015). The Age of Intelligent Cities (Smart Environment and Innovation for all strategies) . New York: Routledge.
Ruangrit, V. (2008). Polycentric urban region [online] available: http://spatialpolicymakers.blogspot.com/2008/07/polycentric-urban-regions.html
Peled, A. and Gillichinsky, M. (2013). Applied Geomat. 5: 109-117.
Roachanakanan, T. (2014). “Contradictory Integration of Policy Formulation: Increasing Infl uence on Land Use Planning System in Thailand”.Articles in Planning Review of Town and Country Planning in Thailand. Department of Town and Country Planning, Bangkok,Thailand.
Schrenk, M. (2015). GIS and Smart Cities. Central European Institute of Technology. [on line] available: http://www.corp.at. Retrieved 30 July 2015.
Singhanetra-Renard, A. (1999). Population mobility and the transformation of a village community in Northern Thailand. Asia Pacifi c Viewpoint 40: 69-87.
Tiwari A. and Jain, K. (2014), “GIS Steering Smart Future for Smart Indian Cities”, International Journal of Scientifi c and Research Publications, Vol. 4/ 8: 3.
Wang Mi., Hu Fen., Liano Anping,,Lu Wei Hua., Zhang Liyong. (2008). “The Integrated Workfl ow and Software System for GIS Database Update Based on Geospatial Images.” The International Archives of the Photogrammetry, Remote Sensing and Spatial Information Sciences. Vol. XXXVII. Part B4, Beijing.
Wil l iamson, I. (2009). “National Mapping, Land Administration and Spatially Enabled Government – Looking Back, Looking Forward” Eighteenth United Nations Regional Cartographic Conference for Asia and the Pacifi c Bangkok, 26-29 October 2009 Item 7(b) of the provisional agenda Invited Papers.
Yap Kioe Sheng and Lebel, L. (2009). “Incomplete Urbanization”, Pages 35-50 in L. Lebel, A. Snidvongs, C. – T.A. Chen, and R. Daniel, editors. Critical States: Environment Challenges to Development in Monsoon Southeast Asia.Strategic Information and Development Centre, Selangor. Malaysia: Vinlin Press.
Yuwasilp, J. (2014). “Formulation of the Fourth Chiang Mai Comprehensive Plan (Third Revision) and People’s Participation”, Master of Arts (Political Science) Thesis, Chiang Mai University.
Zhao Xu. (2011), “Application of System Dynamics model and GIS in sustainability assessment of urban residential development.” International Journal of Applied Earth Observation and Geoinformation, Vol.5: 26–43.