toward improved numerical forecasting of wintertime stable boundary layers
DESCRIPTION
Toward Improved Numerical Forecasting of Wintertime Stable Boundary Layers. Erik Crosman 1 , John Horel 1 , Chris Foster 1 , Erik Neemann 1 , Brian Blaylock 1 , Lance Avey 2 1 University of Utah Department of Atmospheric Sciences 2 Utah Division of Air Quality. Motivation. - PowerPoint PPT PresentationTRANSCRIPT

Toward Improved Numerical Forecasting of Wintertime Stable Boundary Layers
Erik Crosman1, John Horel1, Chris Foster1, Erik Neemann1, Brian Blaylock1, Lance Avey2
1University of UtahDepartment of Atmospheric Sciences
2Utah Division of Air Quality

Motivation• Persistent cold air pools forced by small-scale processes (e.g. ,
turbulence) and by large-scale processes (e.g., subsidence and fronts
• Cold air pools and attendant air quality are particularly difficult to forecast—large ‘bust’ potential for high temperatures and clouds
• Need to improve NWP in stable wintertime conditions
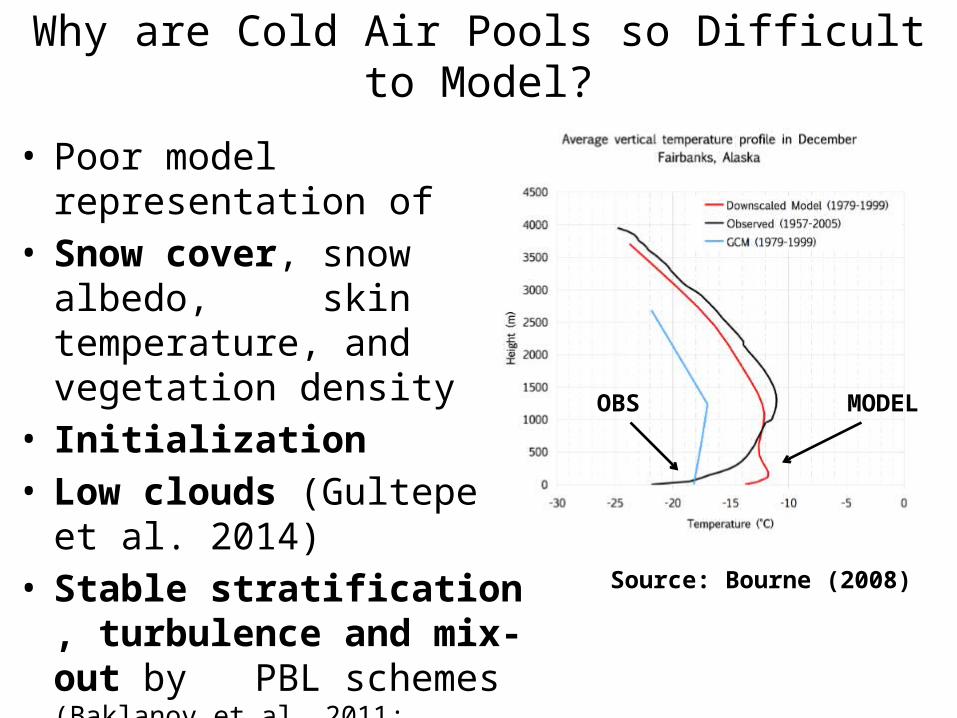
Why are Cold Air Pools so Difficult to Model?
Craig Clements photo Jim Steenburgh photo
Erik Crosman photo
Source: Bourne (2008)
MODELOBS
• Poor model representation of• Snow cover, snow albedo,
skin temperature, and vegetation density
• Initialization• Low clouds (Gultepe et al.
2014)• Stable stratification ,
turbulence and mix-out by PBL schemes (Baklanov et al. 2011; Holtslag et al. 2013)

Example CAP Forecast ChallengeAREA FORECAST DISCUSSION NATIONAL WEATHER SERVICE GRAND JUNCTION CO 944 PM MST SAT NOV 30 2013 .UPDATE... ISSUED AT 940 PM MST SAT NOV 30 2013
HAVE ADJUSTED AREAS OF FOG FOR TONIGHT THROUGH SUNDAY WITH FOG MAINLY IN THE VALLEY BOTTOMS AND ALONG THE SLOPES OF THE WESTERN MOUNTAINS. SOUNDINGS OVER THE LAST 36HRS AT GJT SHOW THE STRATUS LAYER NEAR 7500FT SO HAVE ADDED FOG TO THE SLOPES DEFINED BY 7-8KFT. THE NEW NAM IS NOT RECOGNIZING THE BOUNDARY LAYER FOG SO ITS FORECAST TEMPS ARE TOO HIGH FOR THE WESTERN VALLEY SITES.
NAM OBS

Types of Persistent Cold Air Pools
Craig Clements photo
Cloudy Dry
Jim Steenburgh photo
Erik Crosman photo
Heterogeneous
No two CAPs are alike!
Numerical model may struggle with one type more than others!
Different physical processes important for different CAPs
pre-mix out cloudy
Multi-levelElevated inversion nocturnal
cloudy
Lareau et al. 2013 BAMS
• PCAPS observational data available at
www.pcaps.utah.edu

Recent Utah Wintertime Cold Pool Field Campaigns
The Persistent Cold Air Pool Study (PCAPS)
1 December 2010- 7 February 2011The Bingham Canyon Mine
Experiment
Overview and Air Quality: Silcox et al. 2012; Young 2013; Lareau et al. 2013Whiteman et al. 2014; Whiteman and Hoch 2015Large-Scale Dynamics: Lareau et al. 2013; Lareau and Horel, 2014, Lareau and Horel, 2015Numerical Modeling and Local Forcing: Wei et al. 2013; Lu and Zhong 2014; Neemann et al. 2014. Lareau and Horel, 2015; Crosman and Horel 2015
Uintah Basin (High O3):Uintah Basin Wintertime Ozone
Study (UBWOS) December 2011- February 2012December 2012- February 2013December 2013- February 2014
Salt Lake Valley (High PM2.5):

Ongoing Work to Improve Wintertime Cold Air Pool Simulations
• Surface state characterization (e.g., snow, albedo, land use, vegetation)
• Initialization• Cloud microphysics • Boundary-layer turbulence

USGS higher albedoUSGS colder temps
WRF CAP Sensitivity to Land Use9 Day Average 2-m Temperature Difference
USGS minus MODIS
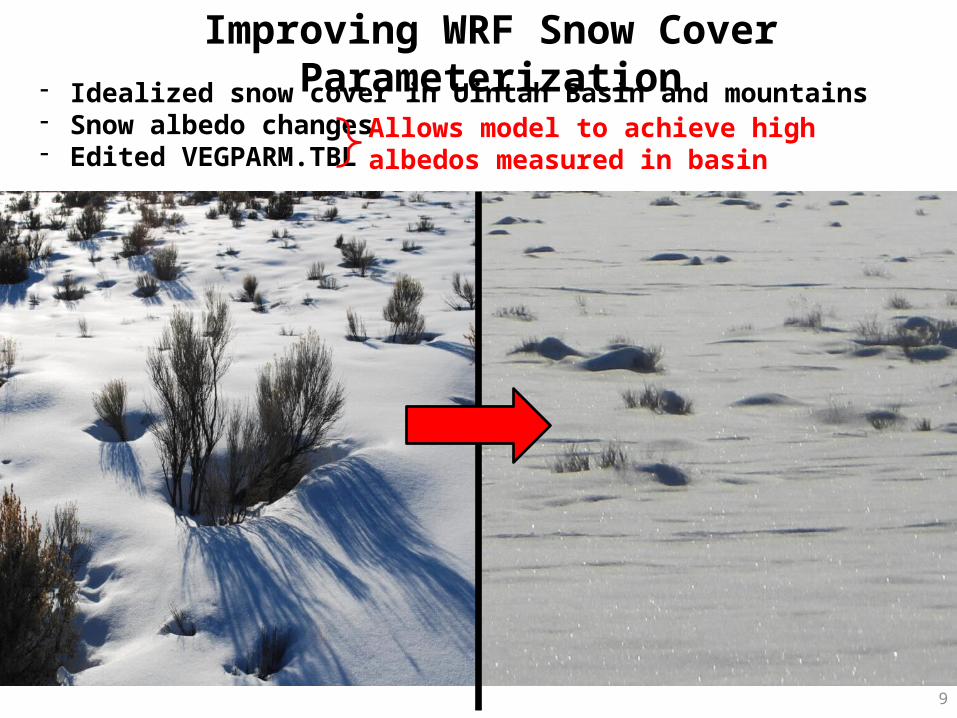
Improving WRF Snow Cover Parameterization- Idealized snow cover in Uintah Basin and mountains- Snow albedo changes- Edited VEGPARM.TBL
Allows model to achieve high albedos measured in basin
9
Snow Depth

Albedo Changes
10
Original Modified
0.62- 0.65 0.81 - 0.82
- 0.82 is average albedo measured at Horsepool during 2013 Uintah Basin Winter Ozone Study

Initialization 2Initialization 1
31 December 2010 1 January 2011 2 January 2011
WRF CAP Sensitivity to Initialization TimeIdentical simulations started 1 day apart
Obs
31 Dec1 Jan
WRF CAP Sensitivity to Initialization TimeIdentical simulations started 1 day apart
1 Jan

Uinta Mountains
Was
atch
Ran
ge
Tavaputs
Desolation Canyon
Plateau
WY
COUT
1250
1500
1750
2250
2750
3250
3750
4000
3500
3000
2500
2000
Roosevelt
MytonOuray
Horsepool
Red Wash
Vernal
WRF CAP Sensitivity to Initialization TimeIdentical simulations started 1 day apart

WRF Cloud and Fog Modifications- Microphysics modifications (Thompson)
in lowest 15 model layers (~500m):- Turned off cloud ice sedimentation- Turned off cloud ice autoconversion
to snow Results in ice-phase
dominated low clouds/fog vs. liquid-phase
Simulated Clouds
Reality
http://wwc.instacam.com/instacamimg/UBATC/UBATC_l.jpg
Photo: Erik CrosmanCloud Ice Cloud IceCloud Water Cloud Water
Before After
13
Ice Fog

LES ΔX 250 m
PCAPSOBSERVATIONS
ΔX 1335 m
Large-Eddy Simulations of CAPsDepth
Duration
Clouds
Physics
CAP too shallow
Ɵ PBL: YSU
Ɵ PBL: none
PCAPS Ɵ observations
Important To verify verticalprofiles

PBL: YSU ΔX = 1.33 kmLES: ΔX = 0.250 km
0
12
6WindSpeed(m s-1)
2-mTemp(ᵒC)
GreatSalt Lake Salt
Lake Valley
Salt Lake Valley
GreatSalt Lake
3
9
10
0
5
-5
sltrib.com
Toxic soup continues… Time to exercise!

• CAP simulations sensitive to --Land use and snow cover treatment --Initialization time --Cloud microphysics parameterizations --Turbulence parameterization (LES vs PBL)
• Future Work --Implementing ice fog and aerosol-aware Thompson schemes (Kim et al. 2014;
Thompson & Eidhammer 2014) --Testing several new PBL schemes and additional LES simulations --Additional research regarding albedo/snow treatment, land use, initialization
Summary and Future Work