total solar irradiance trend during solar cycles 21 and 22
TRANSCRIPT
Total Solar lrradiance Trend During Solar Cycles 21 and 22
Richard C. Willson
Results from Active Cavity Radiometer lrradiance Monitor (ACRIM) experiments show an upward trend in total solar irradiance of 0.036 percent per decade between the minima of solar cycles 21 and 22. The trend follows the increasing solar activity of recent decades and, if sustained, could raise global temperatures. Trends of total solar irradiance near this rate have been implicated as causal factors in climate change on century to millennia1 time scales.
T o t a l solar irradiance (TSI), a measure of the climate-driving radiative energy re- ceived by Earth from the sun, has been tnonitored by satellite experiments with ad- equate precision to detect intrinsic solar variability since 1978 (1) . A direct associ- ation between solar magnetic activity and climate has been inferred from historical records of climate, solar activity indicators, and time series analyses of cosnlogenic iso- topes (2 . 3). Data from the first ACRIM experiment (ACRIM I) o n the Solar Max- imum Mission (SMM) showed that solar activity during a solar cycle a-as directly related to TSI. This was confirmed by the Nimbus 7 Earth Radiation Budget (ERB) and Earth Radiation Budget Satellite (ERBS) experiments during solar cycles 21 and 22 (4-6):On the basis of this result, it has been suggested that the a TSI decrease during the Maunder Minimum of solar ac- tivity (1650-1715) may have been a con- tributing factor to the Little Ice Age cli- mate anomaly ( 2 , 7).
T h e ERB, ACRIM I, ERBS, and Upper
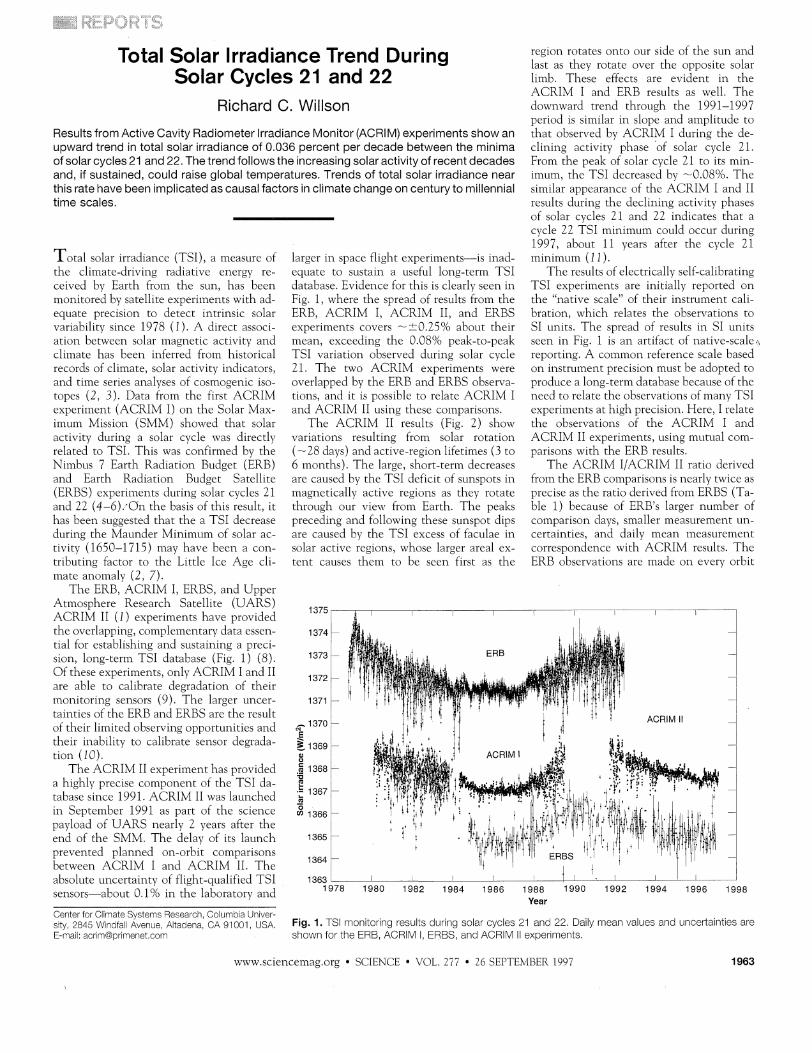
larger in space flight experiments-is inad- equate to sustain a useful long-term TSI database. Evidence for this is clearly seen in Fig. 1, where the spread of results from the ERB, ACRIM I, ACRIM 11, and ERBS experiments covers -i0.25?6 about their mean, esceeding the 0.08% peak-to-peak TSI variation observed during solar cycle 21. T h e two ACRIM experiments were overlapped by the ERB and ERBS observa- tions, and it is possible to relate ACRIM I and ACRIM 11 using these comparisons.
T h e ACRIM I1 results (Fig. 2) show variations resulting from solar rotation (-23 days) and active-region lifetimes (3 to 6 months). T h e large, short-term decreases are caused by the TSI deficit of sunspots in magnetically active regions as they rotate through our view from Earth. T h e peaks preceding and following these sunspot dips are caused by the TSI excess of faculae in solar active regions, whose larger areal ex- tent causes them to be seen first as the
region rotates onto our side of the sun and last as they rotate over the opposite solar limb. These effects are evident in the ACRIM I and ERB results as well. T h e downward trend through the 1991-1997 period is similar in slope and amplitude to that observed by ACRIM I during the de- clining activity phase 'of solar cycle 21. From the peak of solar cycle 21 to its min- imum, the TSI decreased by -0.08%. T h e similar appearance of the ACRIM I and I1 results during the declining activity phases of solar cycles 21 and 22 indicates that a cycle 22 TSI minimum could occur during 1997, about 11 years after the cycle 21 minimum (1 1 ).
T h e results of electrically self-calibrating TSI esperiments are initially reported o n the "native scale" of their instrument cali- bration, which relates the observations to SI ~ n i t s . T h e spread of results in SI units seen in Fig. 1 is a n artifact of native-scale.,, reporting. A common reference scale based o n instrument precision must be adopted to produce a long-term database because of the need to relate the observations of Inany TSI experiments a t high precision. Here, I relate the observations of the ACRIM I and ACRIM 11 experiments, using mutual com- parisons with the ERB results.
T h e ACRIM I/ACRIM 11 ratio derived from the ERB comparisons is nearly twice as precise as the ratio derived from ERBS (Ta- ble 1 ) because of ERB's larger number of comparison days, smaller measurement un- certainties, and daily mean measurement correspondence with ACRIM results. T h e ERB observations are made 011 every orbit
Atmosphere Research Sate l l~te ( u i i d s ) ,375 : ACRIM I1 (1) experiments have prov~ded --
the overlapping, complementary data essen- tial for establishing and sustaining a preci- sion, long-term TSI database (Fig. 1 ) (8). Of these experiments, only I ICRIkl I and I1 are able to calibrate degradation of their monitoring sensors (9) . T h e larger uncer- tainties of the ERB and ERBS are the result of their limited observing opportunities and their inability to calibrate sensor degrada- tion (113).
T h e ACRIM I1 esperiment has provided a highly precise component of the TSI da- tabase since 1991. ACRIM I1 was launched in Septetnber 1991 as part of the science payload of U A R S nearly 2 years after the end of the SMM. T h e delay of its launch prevented planned on-orbit conlparisons between ACRIM I and ACRIM 11. T h e
-
--
-
-
ACRlM II -
absolute uncertainty of flight-qualified TSI 1363 I L- I 1 1 . I sensors-about 0.1% in the laboratory and 1978 1980 1982 1984 1986 1988 1990 1992 1994 1996 1998
Year . ...
Certer for Climate Systems ?esearc?. Coumba Urver- s t y 2545 V\/lrdfa A~~~~~ Altadera CA 91001, USA, Fig. 1. T S monitoring results during solar cycles 21 and 22. Daily mean values and uncertainties are E -ma : ac r11~~8c r11~ene t . com shown for the ERB, ACRM I , ERBS, and ACRlM I experments.
wn.w.sciencemag.org SCIENCE \.OL. 277 26 SEPTELIBER 1997 1963
of its operational days, \vhereas the ERBS operates for only one orbit every 14 days. ACRIM and ERB results are integrated over each coinparison day, ~vhereas the ERBS results could produce a inore variable result on a given day, depending on the rate of TSI variation. There is a systematic dif- ference of 33 1 parts per million betxeen the ACRIM I/ACRIM I1 ratio derived from ERB and that derived from ERBS. The ERB/ERBS ratios for the ACRIM I and ACRIM I1 periods confirnl this difference, which indicates a systematic shift in sensi- tivity for one or both of the ERBS and ERB sensors betvveen the ACRIM I (1984- 1989) and ACRIM I1 (1991-1993) coinpar- ison periods.
There were several trends in the ERB/ ERBS ratio during the years these experi- inents overlapped. These trends are be- lieved to be caused by differing rates of degradation of their sensors, ~vl-hich in turn are dependent on the flight history of each experiment and the extent of solar activity (5, 6 . 12-14). The ERB, ACRIM I, ERBS, and ACRIM I1 experiments all experienced rapid initial degradation (1, 5 , 6 , 8, 15). The effects on ACRIM results were re- moved by their degradation self-calibrations (1, 4 , 9) . The effects on the ERB and ERBS remain convoluted with their data and can be seen in Fig. I as rapid decreases in their early results.
Increasingly intense solar activity hegin- niilg in 1988, approaching the tnaximuin of solar cycle 22, produced large increases in high-energy, short-wavelength solar radia- tion. The rate of degradation of ACRIM 1's sensors increased during this time (4). The degradation rates of the ERB and ERBS sensors undoubtedly increased as well (1 6).
Table 1. Relation between ACRIM I and ACRM I 1 results der~ved from comparlsons w~th ERB and ERBS. Uncerianties n least s~gn~flcant dig~ts are shown In parentheses.
Comparison Samples Rato
ACRlM data vs. ERB ACRM I ACRlM I ACRlM IVACRIM I
ACRM data vs. ERBS ACRlM I ACRlM I 1 ACRlM IVACRIM I 1
Weghted mean ACRM IVACRM I 1 ratio
ERB/ERBS ratio During ACRM I
(1 985-1 989) Durng ACRlM I 1
(1 991-1 993) Rato change
The increase in the ERB/ERBS ratio during the 1989-1991 gap between ACRIM I and ACRIM I1 could result from increased ERBS degradation relative to ERB, a rela- tive increase in the sensitivity of the ERB sensor, or both. The ERB data were re- viewed in 1993 and corrected for a 1987 sensor response increase of 0.03%. It is un- likely that other sinlilar increases were overlooked (1 2) .
Increases in the ERB results, relative to regression firs to ERBS data in 1989 and 1990 against solar activity indices, have been attributed to uncorrected increases in ERB sensitivity (6. 10). Although regres- sion analyses can provide qualitative views of measurement trends, the multiple regres- sion of Lee e t al. (6 ) is based on solar indices that are less well calibrated than are the TSI data. Moreover, the relations betvieen these illdices and TSI are not well under- stood. These regressions cannot determine whether the ERB or ERBS experiment is principally responsible for the shift in their ratio between the ACRIM I and ACRIM I1 periods. The weight of evidence indicates that the increase in the ERBIERBS ratio
between the ACRIM I and ACRIM I1 oe- riods was not caused by an increase in ERB sensitivity, but rather by the accelerated degradation of ERBS as it responded to its first exposure to heightened solar ultravio- let (UV) flux during the rising activity phase of solar cycle 22 (5, 12. 14).
For the above reasons, I have selected the ACRIM IIACRIM I1 ratio derived from ERB data (1.001689) to relate the results of the ACRIM I and ACRIM I1 experiments. Similar TSI trends hetrveen successive solar nlininla are found in the results of both the ACRIM and ERBS databases if the ERB ratio is used. If the ERBS ratio is used instead, this is not the case-another indi- cation of uncorrected degradation in the ERBS data (1 7).
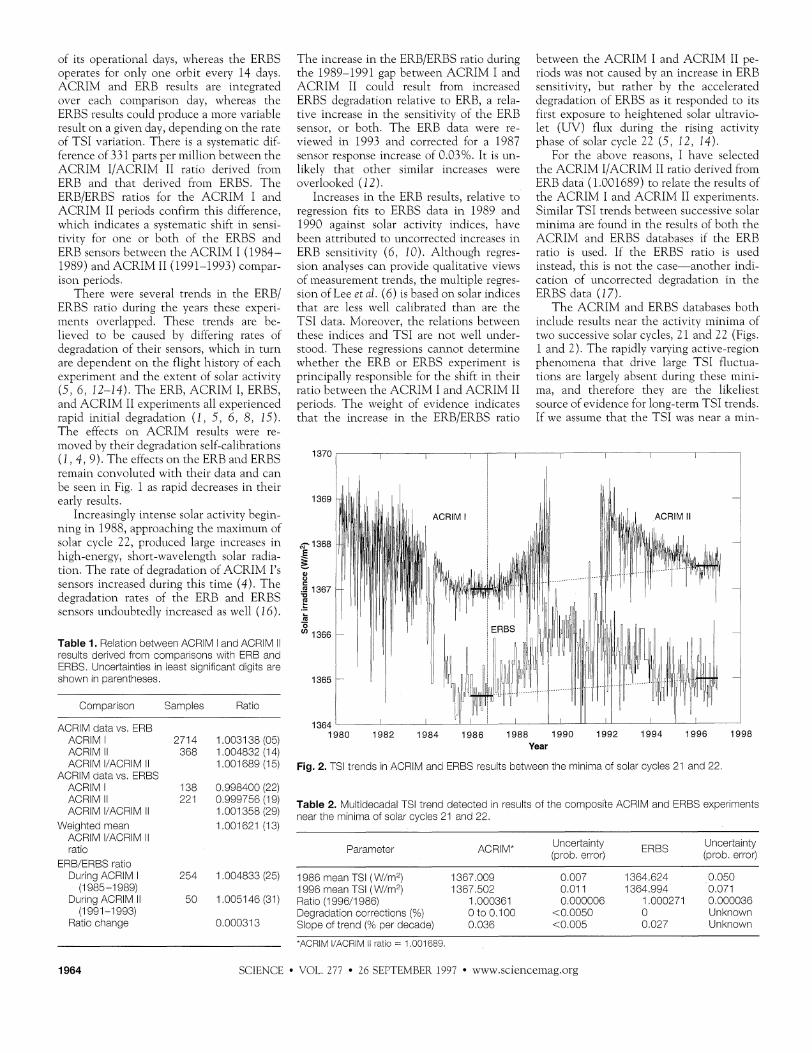
The ACRIM and ERBS databases both include results near the activity ininiina of two successive solar cycles, 21 and 22 (Figs. I and 2) . The rapidly varying active-region phenonlena that drive large TSI fluctua- tions are largely absent during these inini- ma, and therefore they are the likeliest source of evidence for long-term TSI trends. If we assume that the TSI was near a mln-
1364 I
1980 1982 1984 1986 1988 1990 1992 1994 1996 1996 Year
Fig. 2. TSI trends In ACRM and ERBS results between the mnma of solar cycles 21 and 22
Table 2. Mutdecadal TS trend detected n resc~lts of the composte ACRlM and ERBS experments near the mnlma of solar cycles 21 and 22
Parameter ACRM" Uncertainty ERBS Uncefla~nty (prob. error) (prob error)
1986 mean TS (W//m2) 1367.009 0.007 1364.624 0.050 1996 mean TS (W//m2) 1367.502 0.01 1 1364.994 0.071 Rato (1 996/1986) 1.000361 0.000006 1.000271 0.000036 Degradation corrections (96) 0 t00.100 <0.0050 0 Unknown Slope of trend (96 per decade) 0.036 <0.005 0.027 Unknown
'ACRM IVACRIM I 1 ratlo = 1 001689
1964 SCIENCE 0 VOL 277 26 SEPTEMBER 1997 ~vn.w.sciencemag.org
imum for solar cycle 22 during 1996, then the ACRIlcl nlean TSI was 0.0361 2 O.C006% higher for the current mininluln than for cycle 21 (Table 2 and Fig. 2) . Degradation corrections for the ACRIM experiments are uncertain by less than 2C.CO5O'o per decade (4 ) . T h e total root- mean-square uncertainty of the trend is also less than 10.005%, x h i c h indicates that the difference in ACRIM TSI bet\veen the solar minima in 1986 and 1996 is well resolved.
Similarly, the corresponding mean ERBS results changed by 0.0271 i 0.0036% be- tween 1986 and 1996 (Fig. 2). T h e ERBS uncertainty does not include sensor degra- dation, and significant changes of ERBS results can be observed in the record \\,hen no comparable signals are present in other TSI data (Figs. 1 and 2). Accelerated deg- radation during the rising activity phase of solar cycle 22 is likely, with an amplitude ranging up to the shift in the ERBIERBS ratio (-0.03%). T h e ERBS trend is corrob- orative, but its degradation uncertainty lim- its it to qualitative interpretations.
The TSI trend is significant for direct solar climate forcing. T h e response of cli- mate to TSI variation is complex, but a sensitivity is predicted by global circulation lnodels a t - 1 K per 1 ?'o change in TSI ( 18) . If sustained, the ACRIM TSI trend is near that required to produce, o n 2CC-year time scales, a cliluate change comparable to (but in the opposite sense of) the estimated 0.4 to 1.5 K average temperature decrease dur- ing the Little Ice Age climate anonlaly (3 , 19). T h e climatic effect of greenhouse warming over the next 50 to 10C years is estimated to be 1.5 to 4.5 K (19). By com- parison, the TSI trend could produce addi- tional warming of 4 . 4 K in 100 years, a potentially significant contribution.
REFERENCES AND NOTES
1 R C. Wlscn, In Tne Sun as a Variable Star, lnierna:ional Asironornical Unron Collog~::in? 743 Proceedings, J Pap, C Frohch, Y, d~ldson, K Sclank~, Ecls (Cam- brdge Un~\v Press, Ned4 "ork, 1994). po. 54-62
2. J. A Eddy. Science 192, 11 89 (1 9761 3. P. E. Damon and C P. Sonett, In The SLK in T h e ,
C P. Sonett, M. S. G~ampapa, M S Mathev'js, Eds. (Unv. of Arizona Press, T ~ c s o n , AZ, 1991). pp. 360- 588 i Q , C Wlllson and H. S. H ~ d s o n , I\!ature 351, L2
(1991). 5. D. Ho!.* and L Kyle, ~n Proc. Cirnaie lmoaci oiSo1ar
l/ariab:!ity (NASA Conf. Rep. 3086, NASA, Green- belt, MD, 1990), pp. 293-300.
6. R. B Lee I M. A. Gibson. R. S. W~lson, S. Thomas, J. Geoph!/s. Pes. 100, 1667 (1 995).
7. R. C W s o n and H S. Hudson, rhai~re 332, 810 (1 988).
8. ACRM 1 results are reported on the ACRM I scale usng the ACRM IiACRlM I 1 rato (1.001 689) der~\ved In the text.
9. R. C. W~llson. S. G ~ l k s , M. Ja-ssen, H. S. Hudso,i, G. A. Chapman. Sc;ence 21 1 . 700 (1981).
10. The ERB a ~ d ERBS experments vev,! the sun as t passes thro~lgh ther f~elds of vlev,! for only a few
mnutes per orbit, whereas the ACRIM experments are solar-ponted for at least 10 shutter cycles per orbt, every orbt, event day Durng most of the ERB mssion, obsenlatons were made event orbt on 5 of event 4 days. The ERBS experments obser~e the sun for a few minutes d ~ r n g one orbit ever] 2 vmeks
11. UV rradiances. ther s~rrogates (He 1083 and F10.7 cm fluxes), and the Zurch sunspot n ~ m b e r v!ere at a m in im~m n mid-1996 ACRM I 1 results shovled a local m n m u m near the same tme The broad TSI mlnlmJm of solar cycle 21 v/as centered ab0Jt 6 months before solar mnmum. as defned by reversal of act~ve-reg~on magnet~c polar~ty In September 1986. Definiton of the a c t ~ a l ocaton of the cycle 22 T S m n m J m must awat anayss of the 1997 ACRM I res~lts.
12. H. L, Kyle. D. V. Hoyt. J. R. Hickey, B. J. Valette, bJimbus-7 Each Padtatton B ~ d g t i Calibraiion Htsto- rr.-Pam I: The Solar Channels (NASA Ref. P L ~ . i316, NASA. Greenbelt, MD, 1995'1, p. 27.
13. A. T Mecherk~nnel. Sol. Phys. 155. 21 1 (19941 1 L. H. L. Kyle ei a/. , Ntmbus-7 Eamh Radia:ion Budge:
Compact Solar Gaia Sei Clser's G~ll%e (NASA Ref. P J ~ 1346. NASA. Greenbelt. MD, 199Lj
15. Degradaton of the cavty sensors of T S experiments is a phenomenon that ~ s ~ a l l y o c c ~ r s n two phases The frst IS rapd degradaton that o c c ~ r s v!hen the
rates of n t a l and mss~on degradaton vay between experiments, but t,ie degradat~on phenomena are common to most of them, It was further obser~~ed In the ACRIM I experment that the rate of degradaton was proportonal to both the a m o ~ n t of solar expo- sJre and the relat~ve abundance of h'gh energy, shon-v/avelengtli f ~ x During perods of Intense so- lar magnetc actvity, the enhanced a m o ~ n t s of hgh- energy, short-wavelength soar rad~at~on Increase the rate of degradaton
16. A lower s ~ s c e p t ~ b ~ l ~ t y for ERB :o accelerated degra- daton w o ~ d be expected becase of i s longer hs - tory of solar expos~re, n c l ~ d l n g the peak act~v~ty per~od of solar cycle 21, Its sensor %?aces may have been near ther degradation sat~ratlon pont durng solar cycle 22
17. R. C W~lIson, paper presented at American Geo- physcal Unon meetng. Baltmore. MD, May 1997
18. D. R~nd and J. Overpeck. Quai. Sc, Re!/. 12. 3 7 ,> ---, I I Y Y J I
19. Nat~onal Research C o ~ n c ~ l , Solar lniliiences on Global Change (Natonal Academy Press, Washng- ton. DC, 19941, pp. 36-40
20 I thank J Hansen, L Kyle. A. Mecherkunnel, R. Lee Ill, and R. W s o n for pVov~dng he lp f~ l d~scussIons, documentaton, data, and advice. The ACRM I ex- perment IS s~ppor ted by NASA at C o ~ m b a Unver- s~tv under NASA contract NAS5-9716L. The ACRIM
cavty's solar flux-absorbng suqace IS modfed by Il iesults are %allable from the NASA Goddard,. i s ~nltal exposure to space and the rad'aton e m - Space Flight Center and Langey Research Center ronment The sensors then settle n to a "msson" D s t r b ~ t e d Active Archve Centers degradaton modaty as f~ l t he r exposure to solar f ~ x slowly alters thecavty s absorbng s~rfaces The 18 June 1997, accepted 15 A ~ g ~ s t 1997
increased Cornpressibili ty of Pseudobrooki te-Type MgTi,O, Caused by
Cation Disorder Robert M. Hazen* and Hexiong Yang
Compressibilities were determined for four pseudobrookite-type magnesium titanate (MgTi,O,) samples with different degrees of Mg-Ti disorder. Compressibilities of a and c axes in disordered MgTi,O, were 10% and 7% greater, respectively, than those of a relatively ordered sample. The estimated bulk moduli for fully ordered and disordered MgTi,O, are 167 2 1 and 158 r 1 gigapascals, respectively. This difference is an order of magnitude greater than that predicted by bulk modulus-volume systematics. Cation order, in addition to compos~tion and structure information, is thus important when documenting the elasticity of crystalline phases. Elastic constants of mantle silicates that are subject to pressure-induced cation ordering must be reevaluated.
Pressure-volume equations of state (EOS) of crystalline solids impose important con- straints o n models of interatomic bonding, and they provide a n essential foundation for interpreting seismic data from Earth's deep interior. Conventional n~isdom suggests that EOS are principally dependent o n only two variables: structure and composition. Summaries of mineral EOS parameters (1 ) , for example, are tabulated according to these two variables. Details o n the state of order-disorder-which may be inlportant in characterizing the therlnocheinistry and
Geophys~cal Laboratory and Center for H~gh Press~~re 9esearch. Carnegie I n s t ~ i ~ t ~ o n of Washin;tom, 5251 Broad Branch Road NW. Washngton. DC 20015. USA.
'To v>!hom correspondence s h o ~ l d be addressed. E-mall: hazen?2g.c1w.edu
t r a n s ~ o r t oror?ertles of minerals as well as L L
those of alloys, ceramics, and other crys- talline phases-are usually omitted in dis- cussions of EOS. Recent studies demon- strate tha t order-disorder phenonlena may be affected bu oressure in vhases tha t dis- , L
play a nonzero volunle of disordering l V d , > - - Vd 150,L I e,eL I - \:olci eleL ( 2 ) . Silicate nliner- als co~nlnonly display A\/;,, LIP t o C.5% (3 , 4 ) , and values exceeding 1% have been observed in oxides and sulfides (5). How- , ,
ever, t he extent to which differing states of order affect the physical properties of phases a t high pressure is no t known.
T h e comparative compressibilit~ tech- niaue, in which several crystals are mount- ed in the same diamond-anvil cell experi- ment, can be used to discern subtle differ-
nmrw.sclencemag.or,o * SCIENCE * \.OL 277 * 26 SEPTEMBER 19'37 1965