total solar irradiance measurements by erb/nimbus-7. a review of nine years
TRANSCRIPT

TOTAL SOLAR I R R A D I A N C E M E A S U R E M E N T S BY
E R B / N I M B U S - 7 .
A REVIEW OF N I N E YEARS
J O H N R. H I C K E Y and B R A D L E Y M. A L T O N
The Eppley Laboratory Inc., Box 419, Newport, RI 02840, U.S.A.
H. LEE KYLE
NASA Goddard Space Flight Center, Greenbelt, MD 20771, U.S.A.
and
D O U G L A S H O Y T
Research and Data Systems, Lanham, MD 20706, U.S.A.
(Received 1 July, 1988)
Abstract. The advent of reliable extraterrestrial solar irradiance measurements from satellites has supplied the impetus for new research in solar physics and solar-terrestrial relationships. The records for the principal experiments now extend beyond nine years. The Nimbus-7 measurements began in November 1978 and the Solar Maximum Mission (SMM) results started in February 1980. Both the ERB experiment of Nimbus-7 and the ACRIM experiment of SMM are still operational as of this writing (June 1988). We describe the nine-year Nimbus-7 total solar irradiance data set and compare it with similar data sets from the SMM and other satellite solar monitoring programs. Long-term downward trends of less than 0.02 % per year had been noted during the decaying portion of solar cycle 21 with indications that a leveling off and possible reversal of the trend was being experienced as we enter the new cycle. It had been demonstrated that fluctuations in the data over shorter periods corresponded to solar activity, from a primary discovery of irradiance depletions in times of building large sunspot groups to more subtle effects on the scale of solar rotation. Studies of the frequency spectra of the measurements have advanced the interest in helioseismology or mode analysis. Studies of photospheric activity have advanced by modelling of the sunspot blocking and photospheric brightening versus the measured irradiance. The theories are being extended to longer time-scales which indicate that solar irradiance is higher near solar cycle maximum, as defined by activity, and somewhat lower during the period between cycles. While measurements of total solar irradiance, the solar constant, alone cannot be employed to answer all of the questions of solar physics or helioclimatology, these long-term, high-precision data sets are valuable to both disciplines. The continuation of such measure- ments to more meaningful, longer time-scales should have a high priority in the international space community.
1. Introduction
Solar irradiance measurements have been performed by the sensors of the Earth Radiation Budget Experiment (ERB) of the Nimbus-7 satellite since November 16, 1978 (Hickey et al., 1980a). These measurements extended beyond nine years on Novem- ber 16, 1987 and continue to be made as of this date (June 1988). In this report we discuss the first nine years of operation. Previous papers and reports (Hickey et al.,
1980b, 1981, 1982; Hickey and Alton, 1984; Wolff and Hickey, 1987a) have included information for shorter time spans, the latest (Hickey et aL, 1987) covering 100 months (8 years and 4 months through February 1987). While the Nimbus-7 ERB has ten solar
Space Science Reviews 48 (1988) 321-342. �9 1988 by Kluwer Academic Publishers.

322 JOHN R. HICKEY ET AL.
measurement channels, as did its predecessor aboard Nimbus-6 (Hickey, 1973; Hickey et al., 1973), the major results were obtained by the cavity pyrheliometer sensor, called channel 10C, of the Nimbus-7 mission. Therefore, we will discuss the measurements obtained by the other sensors only insofar as they relate to or qualify the results of the primary sensor. Further information on the instrumentation can be found in the respective users' manuals (Sissala, 1975; Madrid, 1978) and other documents (see Soule, 1982). The channel 10C cavity sensor is one of a family of thermopile-based radiometers, commonly referred to as H - F type (Hickey et al., 1977). The specifics of this unit (channel 10C) were given in Hickey et aL (1980a) and are reviewed here. A side view cross-section is shown in Figure 1. The basic sensing element of the radiometer is a toroidal plated thermopile to which a cavity receiver is a l~ed. The cavity is composed of an inverted cone within a cylinder, the interior of which is coated with a specularly reflecting black paint. A calibration heater is wound mostly on the cone (about 94~o) and partially on the lower cylinder (about 6~o). This distribution is to achieve the best match to where radiation heating will occur for direct beam measure- ments. A precision aperture of 0.5 cm 2 is mounted in front of the cavity. The cavity has a larger diameter than the aperture so that all of the direct beam energy falls on the cone. The radiometer has a 10 ~ field of view which allows the Sun to fully irradiate the cavity for about three minutes of each 104-min orbit. The angular response is a cosine function.
THERMOPILE (D) CONE (C)
TEMPERATURE
SIDE VIEW SHIELD
Fig. 1. Side view, cross-section of the Nimbus-7 ERB solar channel 10C construction (extracted from an Eppley Laboratory blueprint).

TOTAL SOLAR IRRADIANCE MEASUREMENTS BY ERB/NIMBUS-7 323
This has been proved during flight by monitoring the off-axis response relative to the on-axis solar signal. The off-axis angle is sensed by the Digital Solar Aspect Sensor, which is part of the satellite's attitude control system. Channel 10C does not experience the off-axis effects that occurred on Nimbus-6 because of an improved baffle design. Although the adherence to cosine response holds over the entire 10 ~ field, the measure- ments are generally selected for off-axis angles of less than 0.5 ~
While the ERB experiment was intended for purposes of climate monitoring, and the design was predicated on use on Nimbus-6 as envisioned in 1968, there was considerable interest in the possibility of studying solar variability using the results. Even though the value of the solar constant as measured by Nimbus-6 (channel 3) was higher than anticipated (Hickey etal., 1975; Hickey and Hilleary, 1976), the variability at the < 0.2% level for the early months was close to the resolution limit of the instrument. As the mission proceeded, a downward trend was noted in the total irradiance output during the solar minimum period. While planning for the Nimbus-7 mission was in progress, it had been anticipated that the ERB experiment would be replaced by one of modified design. However, it was decided to use the remaining flight quality instrument of the Nimbus-6 program. Therefore, the request to replace one of the existing sensors with a cavity sensor was submitted and approved. This sensor took the physical space formerly occupied by channel 10, a UV range sensor, and became known as channel 10C, where 'C' indicates cavity.
In the following sections we will describe the operation, the data, the processing methods, and the results for the nine year period. We will also make comparisons with some other recent solar constant measurement programs and then refer to some of the studies which have employed the irradiance results.
2. Basic Information
Nimbus-7 is a polar orbiting satellite. The ERB experiment is on the leading surface of the satellite. Thus, solar measurements are possible only as the satellite traverses the terminator near the southern extension of the orbit, about every 104 min. The Sun is in the field of view for about 3 min. The remainder of the time the sensor views deep space allowing for an accurate assessment of the offset, or radiation reference. Each solar sensor is sampled once per second, with an integration period of 0.8 s. The data system allows for digital output of + 2047 counts. The gain of Channel 10C was set to measure approximately 1800 counts. When viewing space it measures negative as would be expected for a thermopile instrument. The device is electrically calibrated. The heater is energized periodically while the sensor views space. Because of the operating schedule of the satellite (not ERB), these calibrations are performed once every 12 days. Because channel 10C was an 'add-on' to the Nimbus-7 ERB, there was no place in the data stream to conveniently handle the calibration data. To accommodate the measurement of the three required parameters, thermopile signal, heater current and heater voltage, a sub-multiplexing scheme was devised which inserts the calibration data in the channel 10C data stream when the 'go/no-go' heater command is exercised. That

324 JOHN R. HICKEY ET AL.
command is one which is used to energize the heater and which was originally intended as a pre-launch check capability for the solar channels when not illuminated (Hickey and Karoli, 1974). It was anticipated that there might be a need for correction to the responsiveness of the cavity thermopile with time, but through the first 6 years no such correction was required (Hickey, 1985). This has now been confirmed through the ninth year. This confirms the stability of the voltage reference and the data system, at least for nearly constant temperature, to the resolution for each parameter which amounts to 1 count in 1776 for the thermopile, which is equivalent to on-Sun values.
During the early mission years, the solar measurements were performed on a 3-day-on/I-day-off schedule. The first day after each turn-off was a warm-up day. The data taken in the thermal transient period were considered less precise than the data near temperature equilibrium (Smith et al., 1983) and were filtered out of most of the early results. This was due, in part, to the necessity to continue the use of the preflight algorithm in the routine processing. The preflight algorithm allowed for linear tempera- ture correction only based on preflight test results. The mission results showed deviations from the linear correction below about 18 ~ A model which employs all orbital results will be discussed below. On a normal operating day, and if no data are lost for other reasons such as transmission loss or processing problems, 14 orbital values will be available. After the first few years there were periods when ERB operated with
the instrument on continuously (no off days). During the period April 10 to June 23, 1986 overall Nimbus-7 priorities required that the ERB instrument be turned on for only 20 min each orbit for the purpose of making the solar measurements. This meant that the channel 10C sensor temperature was normally about 14 ~ C when the measurements were made and that the deep space radiation reference was harder to determine. Study of the data during that period gave insight into the previous low-temperature results. Also this allowed for low temperature, in-flight calibrations which had previously been unavailable because of the requirement that calibrations be performed in the most temperature stable period of the 3-day-on cycle. Recently, from late April through late August 1987, another special operations period was required because of the Nimbus-7 mission constraints.
The routine processing has been described for the first 5 years (Hickey et al., 1984; Kyle et al., 1985) and for the first 89 months of operation (Major et al., 1988). These data have been made avilable as the ERB Solar Analysis Tape (ESAT). In these publications, the details of the solar pointing capability and other instrument features are described.
3. Data Sets
There have been different versions of the output data although the source for all has been the same. In the early mission days some data were obtained directly from the ground station. These data consisted generally of the on-Sun counts, without supporting offset and temperature data. These were called the 'engineering data' and were used to derived some of the early results. Generally, engineering data only were available for most of

TOTAL SOLAR IRRAD1ANCE MEASUREMENTS BY ERB/NIMBUS-7 325
the early calibrations. This was due to the delay in fully processing the ERB data, which included the Earth sensing and scanning channels as well as other project related matters. The engineering data generally preceded the processed data during the early years so that 'scientific data' would be presented with engineering data added on to cover a particular time frame for a meeting or report. This may have led to a feeling that inferior data were being presented, but the scientific community was anxious to know the trend in the data. This became even more pressing when results from the ACRIM experiment aboard the SMM spacecraft (starting in February 1980) began to appear. The next level of results is recorded on the ERB Master Archive Tapes (MATs). The ERB MATs contain all the available Earth flux and solar sensor measurements both in voltages (counts) and transformed to scientific units by preliminary calibration algorithms. In addition, sensor calibration, temperature, and geometric information are on this tape. The solar results recorded here were derived using a preflight calibration algorithm. The next level of data are on the Solar and Earth Flux Data Tapes (SEFDT's). These tapes contain recalibrated solar measurements plus wide-field-of- view Earth flux measurements. The post-launch solar calibration algorithm uses a different temperature coefficient (derived from the initial flight data) and an added baffle reflection function not present in the preflight test results. The latter was characterized by examination of the times of entry and egress of the Sun from the field of view of channel 10C. The measurements (both in raw counts and scientific units), Earth-Sun distance, and some sensor temperatures are present on the SEFDT. A refinement of the solar measurements on the SEFDT's is contained on the ERB Solar Analysis Tape (ESAT) which contains calibrated orbital and daily averages. The present ESAT contains 89 months (November 1978 through March 1986) of data. These data were filtered at 17.9 ~ (i.e., all orbits having temperatures less than 18 ~ were removed from the set). It was also filtered for off-axis angles greater than 3 ~ The off-axis angle is defined as the difference between the solar beta angle and the instrument gamma angle. The beta angle is that of the Sun off the orbit and the gamma angle is the setting angle of the solar array within the ERB. The off-axis angle is defined for the minimum solar elevation within the orbital pass. Sometimes the angle will exceed the specified update criteria of �89 deg. The gamma angle is set by ground command. There have been very few problems with this setting after the first 2 years of operation. Since the gamma angle is restricted to 1-deg steps, very accurate solar pointing cannot be achieved. The actual relative solar elevation and azimuth angles are supplied by another sensor, the Digital Solar Aspect Sensor (DSAS) on the front surface of Nimbus-7. The solar irradiance record on the ESAT is the product which has been presented in most of the literature. The daily means have been most widely used. Recently, a study data set consisting of orbital on-Sun and deep-space-look raw counts, sensor temperatures, a n d Earth-Sun distances has been set up. It has been used to review the entire nine years of solar measurements and to verify the proper calibration of the sensor measurements during the special operations periods in the spring of 1986 and the summer of 1987. Measurements rejected from the present ESAT data set, because of the temperature criteria, are included here. Examination of these raw measurements corroborates the

326 JOHN R. HICKEY ET AL.
long-term trends observed in the ESAT data set and in the independent SMM ACRIM measurements (Hickey et al., 1987).
The SEFDT's are produced at the Goddard Space Flight Center and then sent to the Eppley Laboratory for checking and quality control. It is at this time that the filtered ESAT product is assembled. The recently presented 100-month data set (Hickey, 1987) is a recalculated ESAT level product. The addition of the word 'recalculated' refers to reprocessing from the raw count study data set to assure that all the data, including that from the low-temperature observation periods mentioned above, is processed to be equivalent to ESAT results. Despite the apparent diversity of data sets, there is not a corresponding diversity of results. Most of the modifications mentioned above result only in the deletion or insertion of small numbers of orbits. For example, when periods of many days have been missed in the processing scheme for any reason they can be reinserted. This can be done when the initial rejection cause was not a defect in the on-Sun counts for channel 10C. Conversely, some orbital records contain channel 10C counts which are improper, usually because of a wrong on-Sun time selection, and must be discarded. Others may have missing temperature values. In summary of this section we restate that the reprocessing of the orbital and daily mean total irradiance record for channel 10C has had no effect on the major results previously reported for the first 100 months of operation. The set has now been extended through October 1987 (9 years), with the exception of May and June 1987, which have been delayed by processing difficulties. The same level of processing has not been achieved for the other solar channels, although their orbital values continue to be included on the tape products.
4. Results
Here we present the daily mean solar irradiance for 9 years of operation from November 16, 1978 through October31, 1987. This period spans the last solar maximum, the decaying portion of cycle 21, the inter-cycle period and the onset of cycle 22. The data set is missing the months of May and June 1987 at this time. Figure 2 is a plot of the daily mean irradiance versus time. The upper curve on the plot is the sunspot number included for the reader to orient the data in the solar cycle. The higher values of the normalized solar irradiance near the beginning of the measurement period are evident. The downward trend is also evident in the data for the decaying portion of the cycle. An apparent increase in irradiance appears for the onset of cycle 22. It was noted early on that certain dips in the ERB irradiance record corresponded to periods of sunspot activity. This observation was confirmed by Willson eta l . (1981) who extended the explanation to quantitatively describe the depletions in solar irradiance. As the SMM record was extended, and as the delayed Nimbus record became available, it was apparent that both experiments were measuring a down trend in irradiance record (Willson et al., 1986). There was speculation by some that the matching downward trends were the result of instrument degradation which was not being identified by the calibration mechanisms as reported by Kerr (1986) for example. It was anticipated that

350 t r uJ m 3 0 0
: :325O Z
I - " 2 0 0 o 13_ 03 150 Z
03 100 U_ _J 0 5O
o
TOTAL SOLAR IRRADIANCE MEASUREMENTS BY ERB/NIMBUS-7
DALLY WOLF SUNSPOT NUMBER
365 730 1096 1461 1826 2191 2557 2922 3287
DAYS 3652
327
~-" 1373 I
E 1372
LU O 1371 Z <
1370 < e,c" r 1369
r
1368 J o 03 1367
SOLAR CONSTANT -- NIMBUS 7 DALLY MEANS
0 365 730 1096 1461 1826 2160 2557 2922 3287 3652
DAYS I 1978 1979 1980 1981 I 1984 1985 I 1982~ 1983 1986 1987
YEARS
Fig. 2. Nine years of daily mean total solar irradiance as measured by channel 10C on the Nimbus-7 ERB
experiment. The measurements are normalized to the mean Ea r th -Sun distance. For comparison, the top
curve shows the sunspot number.
if the decrease belonged to the 11-year cycle, then a corresponding increase would be experienced at the beginning of the new cycle. Indications of such an increase were reported by Willson (1987) and Willson and Huson (1988). In Figure 2 there is also some evidence of an upturn in 1987 for the Nimbus results. An apparent upturn has also recently been observed (Lee et al., 1988) in the data from the solar monitor on the Earth Radiation Budget Satellite (ERBS). It is noted that Schatten and Sofia (1987) have forecast an 'exceptionally large even-numbered solar cycle'.

328 JOHN R. HICKEY ET AL.
TABLE I
Summary of total irradiance results: 9 years. Daily mean values from channel 10C of ERB/Nimbus-7.
Mission No. Annual Std. dev. Annual range year data mean Nov.-Oct. days W m - 2 W m - 2 % W m - 2 %
Annual change %
1 265 1371.30 0.84 0.06 5.23 0.38 n/a 2 274 1371.11 0.63 0.04 3.82 0.28 - 0.014 3 285 1370.80 0.73 0.05 4.57 0.33 - 0.022 4 275 1370.62 0.69 0.05 3.33 0.24 - 0.013 5 292 1370.60 0.50 0.03 2.88 0.21 - 0.002 6 318 1370.18 0.64 0.04 4.03 0.29 -0.031 7 365 1370.16 0.29 0.02 1.75 O. 13 - 0.002 8 365 1370.17 0.30 0.02 1.81 0.13 0.001 9 286 1370.49 0.38 0.02 1.92 0.14 0.023 1-9 2725 1370.56 0.69 0.05 5.95 0.43 - 0.059
November 16, 1978 through October 31, 1987 May and June 1987 are missing from year 9 data
YEARLY MEAN SOLAR IRRADIANCE ERB/NIMBUS 7 CHANNEL 10C
A
CN
E
v
z IJ_l
,,_1
Z Z
1373
1372
1371
1370
0 2 4 6 8 10
MISSION YEAR
L t L
Fig. 3. Mean annual solar irradiance as measured by the ERB channel 10C. The one-sigma error bars are shown.

TOTAL SOLAR IRRADIANCE MEASUREMENTS BY ERB/NIMBUS-7 329
Table I contains the total irradiance by mission year. Mission years run from
November 1 through October 31. A complete printout of daily mean values is included
as Appendix A. Updates of dally mean values are also supplied to NOAA for inclusion
in Solar-Geophysical Data. The number of days for which data were obtained is given for each mission year. Overall the coverage is 83 ~o of the possible days, with a 75 ~o (approximate) coverage for the first four years. When the missing months of May and June 1987 are included, the percentage will be slightly higher. The annual mean irradiance values are listed in column 3. The mean for the whole set is 1370.56 M m -2
with a standard deviation of 0.69 (0.05~o) and a range of 5.95 (0.43~). The standard deviation is slightly smaller than one count equivalent in the basic data. The last column contains the year-to-year changes ranging from - 0.031 ~o to 0.023 ~o for the last entry.
The stability from year 6 to year 7 and from year 7 to year 8 during solar minimum is apparent. Figure 3 shows the annual mean irradiance with one sigma error bars. The
decrease in activity with the decrease in the solar activity is evident as well as the levelling off and possible increase at the onset of the new cycle. While the change from year 1 to year 9 was - 0 . 0 5 9 ~ , the decrease in annual means between year 1 and year 7, the lowest value, is 0.083 ~o, 1.14 W m -2.
5. Comparison to Other Recent Satellite Measurements
As mentioned in the introduction, accurate measurement of the total solar irradiance
from earth satellites by cavity pyrheliometers dates from November 16, 1978 when the Nimbus-7 ERB channel 10C began its measurements. Since that time Active Cavity Radiometers (ACRIM) on four other satellites have also begun measurement programs. These are the ACRIM-1 on the Solar Maximum Mission (SMM) satellite (Willson, 1981) and the three Earth Radiation Budget Experiment (ERBE), solar sensors on the Earth Radiation Budget Satellite (ERBS), the NOAA-9 and the NOAA-10 satellites (Lee etal., 1987; Mecherikunnel etal., 1988). The SMM measurements started in February 1980, the ERBS in October 1984, the NOAA-9's in January 1985, and the
NOAA-10's in October 1986. Calendar year averages are shown in Table II for all of these experiments including the Nimbus-7 ERB. However, at present only 7 months of
NOAA-10 data are available to us, hence only one average value is shown for it. The absolute calibration of the Nimbus-7 ERB channel 10C is uncertain to about
+ 0.5 ~o, but its sensitivity and long-term stability is much better than this. Thus, all four of the other sensors obtain average solar constant values that agree with the ERB averages within the limits of uncertainty. With respect to short-term variations and long-term trends only the Nimbus-7 and SMM measurements can be easily compared. The three ERBE data sets contain only a few measurements which cover at present only quiet Sun periods. Each of the three ERBE solar sensors makes about two measure- ments twice a month. Note the small number of measurement days shown for these sensors in Table II.
Comparisons of these satellite data sets have been made by various investigators. Mecherikunnel et al. (1988) compared the measurements from all five sensors with

330 JOHN R. HICKEY ET AL.
TABLE II
Solar constant data from ERBE (ERBS, NOAA-9, and NOAA-10), SMM/ACRIM-I, and Nimbus-7/ERB
Observation period No. of Mean Sigma Min. Max. obs. days (Wm -2) (Wm -2) (Wm -2) (Wm -2)
Nimbus-7/CH10C
Nov. 1978-Dec. 1978 37 1371.150 0.546 1369.65 1371.90 Jan. 1979-Dec. 1979 272 1371.275 0.865 1367.84 1373.07 Jan. 1980-Dec. 1980 276 1371.054 0.659 1368.68 1372.50 Jan. 1981-Dec. 1981 284 1370.808 0.686 1367.78 1372.35 Jan. 1982-Dec. 1982 276 1370.592 0.718 1368.58 1371.91 Jan. 1983-Dec. 1983 307 1370.569 0.424 1368.90 1371.71 Jan. 1984-Dec. 1984 318 1370.108 0.625 1367.12 1371.15 Jan. 1984-Dec. 1985 365 1370.151 0.281 1369.14 1370.89 Jan. 1986-Dec. 1986 362 1370.204 0.316 1369.33 1371.14 Jan. 1987-Feb. 1987 52 1370.255 0.224 1369.67 1370.76 Nov. 1978-Feb. 1987 2549 1370.560 0.705 1367.12 1373.07
SMM/ACRIM-I
Feb. 1980-Dec. 1980 297 1368.27 0.666 1365.27 1369.49 Jan. 1981-Dec. 1981 338 1367.90 0.695 1364.93 1369.53 Jan. 1982-Dec. 1982 356 1367.66 0.730 1364.48 1369.32 Jan. 1983-Dec. 1983 290 1367.57 0.489 1366.03 1368.78 Jan. 1984-Dec. 1984 237 1367.28 0.305 1365.77 1367.84 Jan. 1984-Dec. 1985 348 1367.00 0.164 1366.29 1367.59 Jan. 1986-Mar. 1986 76 1366.98 0.148 1366.61 1367.43 Feb. 1980-Mar. 1986 1942 1367.62 0.694 1364.48 1369.53
ERBS
Oct. 1984-Dec. 1984 12 1365.27 0.323 1364.80 1366.00 Jan. 1985-Dec. 1985 25 1364.88 0.368 1364.00 1365.70 Jan. 1986-Dec. 1986 24 1364.65 0.272 1364.20 1365.30 Jan. 1987 2 1365.45 0.636 1366.00 1365.90 Oct. 1984-Jan. 1987 63 1364.88 0.417 1364.00 1366.00
NOAA-9
Jan. 1985-Dec. 1985 28 1365.11 0.554 1363.80 1366.10 Jan. 1986-Dec. 1986 20 1364.51 0.549 1363.60 1365.50 Jan. 1985-Feb. 1987 49 1364.85 0.620 1363.60 1366.10
NOAA-10
Oct. 1986-Apr. 1987 14 1363.29 0.311 1362.50 1363.60
e m p h a s i s o n t he r e c e n t qu ie t S u n p e r i o d w h e n all o f t he e x p e r i m e n t s we re act ive. T h e y
n o t e d t h a t t he N O A A - 9 s e n s o r a p p e a r e d s o m e w h a t no i s i e r t h a n t he o the r s . N o t e i ts
s t a n d a r d d e v i a t i o n s ( S i g m a ) for 1985 a n d 1986 in T a b l e II . T h e l o n g - t e r m c h a n g e s
( s lopes ) in t h e N i m b u s - 7 a n d S M M d a t a se ts agree fair ly well. T h i s h a s b e e n d i s c u s s e d
by W i l l s o n et al. (1986) , W i l l s o n (1987) , a n d F o u k a l a n d L e a n (1988). T h i s c a n also b e

TOTAL SOLAR IRRADIANCE MEASUREMENTS BY ERB/NIMBUS-7 331
seen by examining the year- to-year changes in the Nimbus-7 and S M M yearly averages
in Table II.
Another measure of agreement with other measurements is to look at the correlat ion,
Table I I I lists the correlat ion for each year and for all da t a for the Nimbus-7 daily mean
values with those of the S M M , ERBS, and N O A A - 9 . The correlat ion with the S M M
is quite good ranging from 0.45 to 0.79 each year. Active years, with greater sunspot
blocking with their dist inctive dips in i rradiance, correlate bet ter than quiet years. The
greater r.m.s, noise in the Nimbus-7 measurements contr ibutes to this decrease in
correlation. The low correlat ion in 1983 (0.45) may arise from point ing problems in the
S M M experiment. Fo r all available days, the correlat ion is 0.825 and this higher value
arises from both measurements having a c o m m o n downward trend. Using monthly
means, ins tead of daily means , gives a correlat ion of 0.935, indicat ing that not only are
the t rends similar, but that variat ions on a t imeseale of several months are similar.
TABLE III
Correlation of Nimbus-7 daily means with other experiments for each calendar year
SMM ERBS NOAA-9
N Corr. N Corr. N Corr.
1978 0 - 0 - 0 - 1979 0 - 0 - 0 - 1980 224 0.7827 0 - 0 - 1981 263 0.7718 0 - 0 - 1982 270 0.7900 0 - 0 - 1983 233 0.4568 0 - 0 - 1984 197 0.7159 11 0.2150 0 - 1985 348 0.5209 25 - 0.1407 28 0.1301 1986 76 0.5206 24 0.0581 20 - 0.4625 1987 0 - 2 1.000 1 - All 1611 0.8254 62 - 0.0134 49 - 0.2052
The ERBS and N O A A - 9 measurements do not correlate well with the Nimbus-7
values, and even are negatively corre la ted for substant ia l periods. The cause seems to
be in the ERBS and N O A A - 9 measurements which are both less numerous and more
noisy than the other measurements . Some o f the apparen t noise in the ERBS and
N O A A - 9 measurements may come from the fact that they are ins tantaneous values
rather than daily means. These sensors normal ly look at the Sun for only a few minutes
on one orbit during an observing day.
In summary, the Nimbus-7 and S M M measurements correlate well. F o r the per iod
February 1980 to March 1986, 6 8 ~ of the var iance of the daily values are in common.
Consider ing the lack o f good point ing by the S M M during much o f this period, and the
digitizing and sampling l imitat ions o f the Nimbus-7 , this agreement is remarkably good.

332 JOHN R. HICKEY ET AL.
6. Other Studies
A number of researchers have used these results recently. Pap (1985) has reported a strong correlation between dips in the irradiance records with projected sunspot area relating to quickly developing sunspot groups and that an increase in irradiance above that blocked by any newly forming groups seems more appropriate for older features. Foukal and Lean (1986) reported on the influence of faculae on the solar irradiance. They suggested that faculae, rather than errors in the sunspot blocking function, account for the residuals of the analysis of the irradiance records for the period 1980 to 1982. More recently, the same authors (Foukal and Lean, 1988) using the irradiance records from 1981 to 1984 have reported that bright photospheric elements (faculae) are responsible for most of the slow variations and the downtrend in that period. They employed the full disk He I 10830 index as the proxy for brightening effects noting that the downtrend was not produced when the daily CaK plage index was tried. They also used the 10.7-cm microwave flux as a facular index and estimated solar luminosity changes between 1954 and 1984 (Lean and Foukal, 1988). They reported that 1980 was excluded from their ERB and ACRIM training and validation data sets for their models. The sunspot blocking functions and He I index were not available beyond 1984. We have extended the analysis in a more simplified form back to the beginning of the Nimbus-7 measurements to demonstrate that their conclusions would be appropriate for the 1980 ERB record also but not back to November 1978 (Hickey, 1987).
Wolff and Hickey (1987a, b) studied the changes in the Sun's irradiance at the 0.1 ~o level. After removal of a linear trend, Fourier analysis revealed more than 20 strong periodicities in the range, 20 days to two years. Periods less than eight days were suppressed because of the common three-day-on/one-day-off sampling mode. They found a high correspondence between periods in irradiance and 28 periods predicted from the rotation and beating of global solar oscillations (r- and g-modes). The r-modes represent convective zone oscillations, some of which were found to decay as solar activity decreased. It will be important to see if they are re-stimulated during the solar activity maximum in 1990-1991.
7. Summary
The total solar irradiance measurements by the cavity sensor of the ERB on Nimbus-7 have provided results which have contributed to the resurgence of research in the field. The experiment detected the sunspot blocking effect, indicated the downward trend of the declining solar cycle, and is apparently confirming an upturn in irradiance as the new cycle begins. The nine years of results have been useful to other researchers in the study of solar photospheric effects and mode analysis. These effects have also been measured by the ACRIM experiment aboard SMM. It is unlikely that anyone would have trusted the results of either experiment without the other. The ERB results have assumed a less prominent exposure than the SMM results mainly as a result of the higher resolution and sampling rate of the ACRIM; however, the ERB more than achieved its mission

TOTAL SOLAR IRRADIANCE MEASUREMENTS BY ERB/NIMBUS-7 333
goals in climatology, specifically ear th radia t ion budget. This one year mission is now
well into its tenth year of opera t ion with no shift in calibrat ion, a tribute to the engineers
who designed and built it. Since there have been no miss ion failures of the ERB solar
measurements , only required miss ion scheduling and delays in process ing have affected
the rapid disseminat ion of results. I t is likely that the solar measurements will continue
for some time at the same level of accuracy and precision. Suppor t of the scientific
communi ty will be required to assure this end.
Acknowledgements
We would like to thank Eugene M a j o r for ass is tance with the da ta p repara t ion and
analysis and Brenda Vallette for her aid with the manuscr ipt . Both are from Research
and D a t a Systems Corporat ion.
References
Foukal, P. and Lean, J.: 1986, Astrophysical J. 302, 826. Foukal, P. and Lean, J.: 1988, Astrophysical J. 328, 347. Hickey, J. R.: 1973, in A. J. Drummond and M. P. Thekaekara (eds.), The Extraterrestrial Solar Spectrum,
Mt. Prospect Illinois, pp. 135-160. Hickey, J. R.: 1985, in P. Foukal (ed.), Advances in Absolute Radiometry, AER Inc., Cambridge, MA, p. 30. Hickey, J. R.: 1987, 'Discussion of the Analysis of Foukal and Lean Relative to ERB Channel 10C',
unpublished report to NASA available from the author. Hickey, J. R. and Alton, B. M.: 1984, in B. J. LaBonte, G. A. Chapman, H. S. Hudson, and R. Willson (eds.),
'Status of Solar Measurements and Data Reduction for the ERB Nimbus-7', in Solarlrradiance Variations on Active Region Time Scales, NASA CP-2310, pp. 43-58.
Hickey, J. R. and Hilleary, D. T.: 1976, COSPAR Nineteenth Plenary Meeting, p. 85. Hickey, J. R. and Karoli, A. R.: 1974, Applied Opt. 13, 523-533. Hickey, J. R., Hilleary, D. T. and Maschhoff, R. H.: 1973, W. H. Klein and J. R. Hickey (eds.), Proceedings
of a Symposium on Solar Radiation: Measurements and Instrumentation, The Smithsonian Institution, Washington, DC, pp. 127-150.
Hickey, J. R., Griffin, F. J., and Hilleary, D. T.: 1975, Eighth Conference on Space Simulation, NASA SP-379, NASA, Washington, DC.
Hickey, J. R., Frieden, R. G., Griffin, F. J., Cone, A. S., Maschhoff, R. H., and Gnaidy, J.: 1977, Proceedings of the Annual Meeting of the American Solar Energy Society, 1, 15-1, 15-4.
Hickey, J. R., Griffin, F. J., Jacobowitz, H., Stowe, L. L., Pellegrino, P., and Maschhoff, R. H.: 1980b, EOS 61,355.
Hickey, J. R+, Stowe, L. L., Jacobowitz, H., Pellegrino, P., Maschhoff, R. H., House, F., and Von der Haar, T. H.: 1980a, Science 208, 281.
Hickey, J+ R., Alton, B. M., Griffin, F. J., Jacobowitz, H., Pellegrino, P., Smith, E. A., and Von der Haar, T.H.: 1981, in S. Sofia (ed.), 'Solar Variability Indications from Nimbus-7 Satellite Data', NASA Conference Proceedings 2191, Variations of the Solar Constant, NASA Goddard Space Flight Center, Greenbelt, MD, p. 59.
Hickey, J. R., Alton, B. M., Griffin, F. J., Jacobowitz, H., Pellegrino, P., Smith, E. A., Von der Haar, T. H., and Maschhoff, R. M.: 1982, J. Solar Energy 29, 125.
Hickey, J. R., Major, E. R., and Kyle, H. L.: 1984, User's Guide for Nimbus-7 ERB Solar Analysis Tape (ESA T), NASA TM-86143, NASA Goddard Space Flight Center, Greenbelt, MD 20771, 81 pp.
Hickey, J. R., Alton, B. M., Kyle, H. L., and Major, E. R.: 1987, in P. Foukal (ed.), 'Solar Irradianee Measurements by the Nimbus-7 ERB Experiment: An Update of 100 Months', in Solar Radiative Output Variation, Cambridge Research and Instrumentation Inc., Proceedings of Workshop of November 9-11, 1987 at NCAR, Boulder, CO, pp. 189-194.

334 JOHN R. HICKEY ET AL.
Kerr, R. A.: 1986, Science 231,339. Kyle, H. L., Ardanuy, P. E., and Hurley, E. J.: 1985, Bull. Am. Meteorol. Soc. 66, 1378. Lean, J. and Foukal, P.: 1988, Science 240, 906. Lee, R. B., Barkstrom, B., and Cess, R. D.: 1987, Applied Opt. 26, 3090. Lee, R. B., Mecherikunnel, A., Kyle, H. L., Gibson, M. A., and Natarajan, S. M.: 1988, EOS 69, 314. Madrid, C. R. (ed.): 1978, The Nimbus- 7 User's Guide, NASA Goddard Space Flight Center, Greenbelt, MD,
Section 3, pp. 39-69. Major, E. R., Kyle, H. L., Hickey, J. R., and Alton, B. M.: 1988, User's Guide for the ERB Solar Analysis
Tape (ESAT), NASA RP-NASA Goddard Space Flight Center, 90 pp. Mecherikunnel, A. T., Lee, III, R. B., Kyle, H. L., and Major, E. R.: 1988, 3. Geophys. Res. 93, 9503. Pap, J.: 1985, Solar Phys. 97, 21. Schatten, K. H. and Sofia, S.: 1987, Geophys. Res. Letters 14, 6, 632. Sissala, J. E. (ed.): 1975, The Nimbus 6 User's Guide, NASA Goddard Space Flight Center, Greenbelt MD,
Section 6, pp. 109-139. Smith, E. A., Vonder Haar, T. H., and Hickey, J. R.: 1983, Climate Change 5, 211. Soule, H. V.: 1983, Nimbus 6 and 7 Earth Radiation Budget (ERB) Sensor Details and Component Tests, NASA
TM 83906, NASA Goddard Space Flight Center, Greenbelt, MD. Willson, R. C., Gulkis, S., Janssen, M., Hudson, H. S., and Chapman, G. A.: 1981, Science 211, 700. Willson, R. C., Hudson, H. S., Frohlich, C., and Brusa, R. W.: 1986, Science 234, 1114. Willson, R. C., 1987, in P. Foukal (ed.), 'Results of Space-Based Total Solar Irradiance Experiments', in
Solar Radiative Output Variation, Cambridge Research and Instrumentation Inc., Proceedings of Workshop of November 9-11, 1987 at NCAR, pp. 143-155.
Willson, R. C. and Hudson, H. S.: 1988, Nature 332, 810. Wolff, C. L. and Hickey, J. R.: 1987a, Solar Phys. 109, 1. Wolff, C. L. and Hickey, J. R.: 1987b, Science 235, 1631.

TOTAL SOLAR IRRADIANCE MEASUREMENTS BY ERB/NIMBUS-7 335
Appendix A
Daily mean total irradiance: ERB/Nimbus-7-9 years
ERB year 1 2 3 5 4 6 7 8 9
Cal. year 78-79 79-80 80-81 81-82 82-83 83-84 84-85 85-86 86-87
01 Nov. 1371.24 1370 .69 1370 .59 1371 .78 1369 .99 1370 .20 1369 .75 1369.63 02Nov. 1370.22 1370.33 1370.19 1370.07 1369.86 1370.30 03Nov. 1370.90 1369.97 1371.71 1370 .00 1370 .08 1369.94 1370.26 04Nov. 1370.62 1370.18 1371 .18 1370 .38 1369 .93 1369.90 1370.44 05 Nov. 1371.07 1369.48 1370 .33 1371.37 1370.10 1370.07 1369 .95 1370.35 06Nov. 1369.07 1370.90 1370.14 1370.06 1370 .03 1370.52 07Nov. 1369.83 1369.22 1371.08 1370 .38 1369.99 1370.02 1370.49 08Nov. 1368.81 1371.14 1370.81 1370 .75 1369.90 1370.19 1370.48 09Nov. 1369.28 1369.15 1370 .85 1371.18 1370 .49 1369.95 1369.92 1370.32 10 Nov. 1369.09 1370.80 1370.62 1369.79 1370 .05 1370.15 11 Nov. 1369.58 1369.18 1370 .48 1370.61 1370.59 1370.04 1369.87 1370.20 12Nov. 1369.42 1370.32 1370.15 1370 .75 1369 .86 1370.06 1370.23 13Nov. 1369.91 1369.80 1370.80 1369.79 1370.61 1369.91 1370.02 1370.10 14Nov. 1370.05 1370.34 1370 .06 1370.22 1370.35 15 Nov. 1370.86 1370.62 1369.63 1370.31 1370 .03 1369 .85 1370.34 16Nov. 1 3 7 0 . 7 5 1371.04 1371.35 1369.61 1370.01 1369.94 1369.84 1370.28 17Nov. 1371.14 1371.32 1371.20 1370.92 1370.11 1370.19 1369.94 1369.91 1370.42 18Nov. 1371.39 1370.71 1371.09 1370.19 1369 .89 1370.04 1370.34 19Nov. 1371.30 1370.72 1370.28 1370.38 1369.80 1370.10 1370.47 20Nov. 1 3 7 1 . 2 9 1370.77 1370.88 1369.85 1370 .48 1369 .77 1370.23 1370.61 21 Nov. 1 3 7 0 . 8 5 1371.09 1370.93 1370.61 1369.47 1370.38 1369 .77 1370 .35 1370.47 22Nov. 1371.16 1370.91 1370.91 1370.27 1369 .85 1370.09 1370.44 23Nov. 1 3 7 0 . 8 9 1371 .09 1371.22 1370.23 1370.42 1369.74 1370 .08 1370.58 24Nov. 1371.17 1370.50 1371.22 1370.37 1370.71 1369.72 1370 .19 1370.57 25Nov. 1 3 7 1 . 2 8 1371 .03 1371.44 1371.12 1370.87 1370.72 1369.66 1369.97 1370.49 26Nov. 1371.65 1371.23 1371.29 1370.81 1369.36 1370.11 1370.42 27Nov. 1371.60 1371.51 1371.34 1370.59 1369.60 1370.12 1370.47 28Nov. 1 3 7 1 . 3 9 1371.45 1370.47 1371 .03 1370.79 1369.77 1370 .08 1370.41 29Nov. 1 3 7 1 . 1 7 1371.49 1371.11 1370.20 1371.01 1370.82 1369.93 1370.07 1369.87 30Nov. 1371.61 1370.49 1370.38 1370.96 1370 .43 1370 .09 1369.90 01 Dec. 1371.43 1370.74 1370.84 1370 .46 1370.30 1369 .88 1369.85 02 Dec. 1 3 7 1 . 3 8 1371 .17 1371.33 1371.34 1370.59 1370.49 1370.42 1369 .78 1369.84 03 Dec. 1371.16 1371.19 1370 .99 1371.42 1370.28 1370.41 1370.40 1369.81 1369.90 04Dec. 1371.43 1371.31 1371.76 1370.57 1370 .47 1369 .80 1369.94 05Dec. 1371.35 1369.85 1370.44 1370.42 1369 .77 1370.01 06Dec. 1371.83 1371.29 1369.85 1370.62 1370 .56 1370.08 1369.93 07Dec. 1 3 7 1 . 3 8 1372.16 1371.95 1370.24 1370 .26 1370 .35 1370 .33 1369 .83 1370.17 08Dec. 1371.73 1371.87 1369.63 1370.55 1370.62 1369.86 1370.00 09 Dec. 1372.11 1371.99 1370.35 1370.52 1370 .37 1369 .83 1370.29 10Dec. 1370.00 1371.98 1369.68 1369.70 1370.64 1370 .09 1370.08 1370.44 11 Dec. 1 3 6 9 . 6 5 1371.57 1371.65 1369.91 1369.82 1370.57 1369 .99 1370.11 1370.34 12Dec. 1369.87 1370.66 1370.17 1370.68 1370 .25 1370 .28 1370.43 13 Dec. 1372.09 1370.72 1369.45 1370.30 1370 .05 1370.21 1370.47 14Dec. 1370.22 1371.53 1370.89 1369.37 1370 .58 1370.27 1370 .33 1370.57 15Dec. 1371.12 1371.62 1370.40 1370.73 1369.91 1370.48 1370.22 1370 .25 1370.66 16 Dec. 1371.62 1370.05 1370.78 1370.54 1370.41 1370.18

336 JOHN R. HICKEY ET AL.
Appendix A r
ERB year 1 2 3 4 5 6 7 8 9
CN. year 78-79 79-80 80-81 81-82 82-83 83-84 84-85 85-86 86-87
17 Dec. 1 3 7 1 . 2 5 1371 .78 1370.47 1370.96 1370.26 1370.29 1370.30 18 Dec. 1371.14 1370.96 1371.04 1370.62 1370.03 1370.39 19 Dec. 1370.97 1371 .26 1370 .93 1370.67 1371.46 1370 .45 1369 .97 1370.44 1370.81 20 Dec. 1371.30 1371.02 1370.82 1370.65 1370.24 1370.40 1370.95 21 Dec. 1371.00 1371.68 1371.46 1370.56 1369.98 1370 .38 1370.95 22 Dec. 1 3 7 1 . 0 8 1370.45 1371.24 1371.04 1370.37 1370.21 1370 .26 1370.70 23Dec. 1 3 7 1 . 5 7 1370.82 1371.48 1370 .95 1371.44 1370 .09 1370.11 1370 .29 1370.65 24Dec. 1371.81 1370.95 1371.43 1370.35 1370 .33 1370.02 1370.70 25 Dec. 1371.50 1371.30 1371.40 1370.22 1370.39 1370.22 1370.41 26Dec. 1371.90 1371.51 1371.09 1370.66 1370.53 1370.04 1369.93 1369.91 27 Dec. 1 3 7 1 . 5 0 1371 .33 1371.31 1370.54 1371.11 1370.42 1370.02 1370.15 1369.54 28Dec. 1371.82 1370.68 1370.84 1370.54 1370.10 1370 .04 1369.74 29 Dec. 1371.32 1370.80 1371.58 1370 .38 1370 .27 1369.84 1369.67 30Dec. 1 3 7 0 . 8 5 1371.07 1371.73 1370.57 1370 .55 1370 .15 1369 .87 1369.95 31 Dec. 1370.34 1371 .59 1371.66 1370.92 1369 .98 1370.40 1369.85 1369.95 01 Jan. 1370.39 1371.82 1371.83 1370.19 1370.55 1369 .79 1369.85 02 Jan. 1372.09 1372.20 1371.13 1370.16 1370.45 1369 .98 1369.97 03 Jan. 1370.57 1371.77 1371.66 1370.62 1370.53 1370.32 1369.85 1370.12 04 Jan. 1 3 7 1 . 6 8 1371.94 1370 .90 1371.21 1370 .93 1370.48 1369 .99 1369.96 1370.13 05 Jan. 1371.81 1370.53 1371.55 1370.72 1370.28 1369.94 1370.43 06 Jan. 1372.07 1371.19 1371.38 1370 .43 1370.13 1369 .78 1370.35 07 Jan. 1 3 7 1 . 6 1 1371.49 1371.67 1371.00 1370.69 1370.37 1369.82 1370.53 08 Jan. 1 3 7 1 . 6 3 1371.62 1371 .15 1371.11 1371.20 1370.57 1370.42 1369.97 1370.10 09 Jan. 1371.65 1371.11 1371.47 1370.37 1370.67 1369.96 1370.13 10 Jan. 1371.62 1371.19 1371.43 1370.24 1370.54 1370.12 1370.14 11 Jan. 1371.52 1371.45 1371 .95 1371 .25 1371.00 1370.42 1370.41 1370.08 1370.44 12 Jan. 1371.58 1371.79 1371.80 1370 .85 1370 .97 1370 .05 1370.48 1369.96 1370.40 13 Jan. 1371.77 1371.26 1370.66 1370.06 1370.53 1369.99 1370.63 14 Jan. 1372.50 1371.66 1371.31 1369.77 1370.48 1370.14 1370.50 15 Jan. 1 3 7 1 . 3 5 1371.42 1370.43 1370 .88 1370.20 1370.12 1370.28 1370.28 16 Jan. 1 3 7 1 . 5 9 1371.52 1371.72 1369 .89 1370.86 1370.12 1369.90 1370 .38 1370.26 17 Jan. 1372.10 1371.24 1370.45 1369.90 1370.24 1370.27 1370.39 18 Jan. 1371.47 1371.66 1370.38 1369.71 1370.31 1370.00 1370.29 19 Jan. 1371.54 1371.27 1370.90 1370.06 1370.27 1370 .05 1369 .95 1370.58 20 Jan. 1371.22 1371.42 1372.02 1370.71 1370.01 1370 .08 1369.42 1369.90 1370.20 21 Jan. 1371.00 1371.58 1370.83 1370.28 1369.67 1369.94 1370.55 22 Jan. 1371.46 1371.75 1370.60 1370.09 1369 .78 1369.91 1370.44 23 Jan. 1 3 7 0 . 5 1 1370.90 1371.00 1370 .53 1370.42 1370.33 1369 .88 1370.72 24 Jan. 1371.04 1371.70 1370.76 1371.19 1369.80 1369 .98 1369.82 1370.45 25 Jan. 1371.27 1371.43 1371.10 1369.54 1370.44 1370.00 1370.76 26 Jan. 1371.66 1371.48 1371.12 1370.98 1368.22 1370.38 1369 .93 1370.37 27 Jan. 1371.46 1371.70 1371.35 1370.36 1367 .63 1370.52 1369.91 1370.20 28 Jan. 1371.98 1371 .65 1370 .25 1370.71 1367.30 1370 .25 1369.98 1370.13 29 Jan. 1372.31 1371.49 1369.86 1367.26 1370.50 1370 .00 1370.29 30 Jan. 1371.75 1371.41 1370.46 1367.55 1369.92 1370.06 1370.11 31 Jan. 1372.89 1371.45 1369.06 1369.90 1368 .43 1370.22 1370.03 1370.32 01 Feb. 1371.00 ~ 1370.94 1368 .58 1370.37 1368 .85 1370.01 1370.16 02 Feb. 1371.98 1370.30 1369.33 1370.01 1370 .19 1369 .99 1370.48

TOTAL SOLAR IRRADIANCE MEASUREMENTS BY ERB/NIMBUS-7 337
Appendix A r
ERB year 1 2 3 4 5 6 7 8 9
Cal. year 78-79 79-80 80-81 81-82 82-83 83-84 84-85 85-86 86-87
03 Feb. 1370.42 1370.40 1370.92 1370.14 1370 .25 1369.51 1370.40 04 Feb. 1371.54 1370.36 1370.71 1370.20 1370.63 1370 .53 1369.33 1370.34 05 Feb. 1370.67 1371.06 1370.66 1370.50 1370 .29 1370.34 1369.40 1369.76 06 Feb. 1371.89 1370.96 1370.71 1370.21 1370 .54 1369 .53 1370.04 07 Feb. 1370.80 1370.90 1370.69 1369 .58 1370.10 1369.83 1369.99 08 Feb. 1 3 7 2 . 0 8 1370.44 1369.59 1370.39 1369.74 1370.64 1370 .00 1370.32 09 Feb. 1 3 7 2 . 3 5 1370.82 1370.89 1368.87 1370 .93 1369.09 1370.26 1370.02 1370.01 10 Feb. 1372.11 1370.44 1368.84 1369.22 1370.76 1369 .79 1370.29 11 Feb. 1370.95 1370.66 1371.27 1369 .18 1370.47 1369.77 12 Feb. 1 3 7 1 . 7 8 1370.96 1369.69 1370 .85 1369.70 1370.15 1369.62 13 Feb, 1 3 7 2 . 3 3 1371.24 1371.34 1369.26 1370 .99 1369 .68 1369.94 1370.14 14 Feb. 1372.18 1370.62 1370.05 1370.41 1370.00 1369.88 15 Feb. 1371.26 1370.59 1370.72 1370.50 1369.70 1370.10 16 Feb. 1 3 7 1 . 6 1 1370.86 1370,33 1370.18 1370.64 1370.01 1369.91 17 Feb. 1 3 7 0 . 9 9 1371,11 1370.49 1369.77 1370.62 1370.32 1369.98 1369.94 1370.00 18 Feb. 1370,42 1370.10 1369.82 1370.76 1370.20 1369.71 1370.23 19 Feb. 1371.67 1370.64 1370,60 1370 .17 1369 .78 1369 .78 1370.01 20 Feb. 1370.44 1371.49 1370.22 1370.25 1370.40 1370 .15 1369 .76 1370.32 21 Feb. 1 3 7 1 . 0 1 1371.52 1370.93 1370.34 1370.75 1369.74 1369.97 1370 .00 1370.23 22 Feb. 1371.39 1370.18 1370.89 1369.65 1370.14 1370.02 1370.27 23 Feb. 1370.99 1370.33 1370.99 1369.26 1369 .89 1370 .05 1369.67 24 Feb. 1 3 7 2 . 0 0 1370.86 1371.56 1370.62 1369.59 1370 .15 1369.91 1370.16 25 Feb. 1371.08 1370 .28 1370.97 1370.86 1369.45 1369.87 1370.02 1370.09 26 Feb. 1371.97 1370.19 1371.34 1369.93 1370,21 1370.04 1370.18 27 Feb. 1371.69 1370.03 1371.21 1369 .98 1370.11 1370 .23 1370.13 28 Feb. 1 3 7 2 . 0 3 1371.71 1370.54 1370,74 1370.28 1370.17 1370.07 1370.27
29 Feb. 1371.73 1370.07 01 Mar. 1372.32 1369.94 1369.82 1370.92 1370 .33 1370 .24 1370.16 1370.03 02Mar. 1372.59 1371.76 1370,08 1369.79 1370.08 1370 .47 1370.14 1370.23 03Mar. 1371.66 1370,44 1371.05 1370.24 1370 .23 1370.17 1369.89 04Mar. 1 3 7 2 . 2 9 1371.65 1370.34 1370.22 1370.01 1370.51 1370.01 1370.32 05 Mar. 1372.56 1371.21 1370.37 1370 .49 1370.39 1370.14 1370.17 1370.05 06Mar. 1372.67 1371.72 1370.49 1370.70 1369.94 1370.34 1369.94 1370.31 07Mar. 1371.69 1370.91 1370.81 1370.31 1370 ,29 1369.96 1369.84 08 Mar. 1 3 7 1 . 9 9 1371.38 1371.48 1370 .65 1369.82 1370.30 1369.85 1370.29 09Mar. 1372.01 1370.57 1370.96 1371.00 1370.06 1370 .30 1370 .17 1370.35 IOMar. 1 3 7 2 . 3 5 1371 .93 1370.50 1371.15 1369.78 1370.32 1370.12 1370.29 11 Mar. 1371.54 1371.07 1370.79 1370.21 1370.29 1370 .36 1370.22 12Mar. 1372.59 1371.68 1371.54 1370 .49 1369,91 1370.29 1370.25 1370.50 13Mar. 1 3 7 3 , 0 7 1371.99 1371 .35 1371.00 1370.86 1370 ,09 1370.11 1370.00 1370.38 14Mar. 1 3 7 2 . 8 9 1371 .63 1371.17 1370.61 1369.68 1370 ,36 1369.87 1370.55 15 Mar. 1371.42 1371.45 1370.84 1370.33 1370 .25 1370 .15 1370.45 16Mar. 1372.44 1371.48 1369.48 1370.04 1370.30 1370.42 1369 .98 1370.63 17Mar. 1372.30 1371.68 1368.81 1370.48 1370.51 1370.19 1370 .05 1370.38 18Mar. 1372.42 1371.79 1371 .28 1369.00 1370.81 1370~39 1370 .38 1369.92 1370.51 19Mar. 1371,48 1371.35 1370.49 1370.67 1370 .09 1370.20 1370.34 20Mar. 1 3 7 1 . 8 7 1371.53 1369.88 1370.04 1370.33 1370 .30 1370.07 1370.54 21 Mar. 1371.93 1370.65 1370.10 1370.51 1370 .63 1370.20 1370 .28 1370.45

338 JOHN R. HICKEY ET AL.
Appendix A ~ontmued)
ERB year 1 2 3 4 5 6 7 8 9
Cal. year 78-79 79-80 80-81 81-82 82-83 83-84 84-85 85-86 86-87
22Mar. 1372.08 1371.65 1370.46 1370.67 1370.09 1370.38 1370.15 1370,41 23Mar. 1371.37 1370.79 1371.42 1370.35 1370.15 1370.28 1370.39 24Mar. 1371.79 1371.81 1370.11 1370.98 1369.99 1370.39 1369.97 1370.34 25Mar. 1371.96 1371.17 1369.77 1371.30 1370.49 1370.32 1370,12 1370.41 26Mar. 1371.90 1371.92 1370.85 1369.88 1370.13 1370.31 1370.15 1370.42 27Mar. 1371.70 1371.13 1371.55 1370.34 1370.27 1370.25 1370.34 28Mar. 1372.17 1371.49 1370.13 1371.00 1369.94 1370.19 1370.28 1370.19 29Mar. 1372.24 1371.25 1370.14 1371.28 1369.60 1370.04 1370,06 1370.12 30Mar. 1372.26 1371.33 1371.16 1370.23 1369.30 1370.10 1370.29 1370.05 31 Mar. 1371.06 1371.67 1371.45 1369.05 1370.31 1370,26 1370.01 01 Apr. 1371.74 1371.29 1371.19 1371.00 1368.88 1370.31 1370.33 1370.16 02 Apr. 1371.78 1371.30 1371.08 1370.41 1370.45 1370.08 03 Apr. 1371,49 1371.52 1371.37 1371.57 1369.30 1370.38 1370.28 1370.24 04Apr. 1371.40 1371.01 1369.80 1370.56 1370.13 1370.51 05Apr. 1371.57 1370.53 1371.59 1371.18 1370.80 1369.67 1370.18 1370.36 1370.25 06 Apr. 1371.02 1371.00 1371.00 1369.87 1370.23 1370.09 1370.20 07Apr. 1372 .40 1369.36 1370.47 1371.31 1369.89 1370.18 1370.20 1369.95 08Apr. 1368.68 1370.63 1371.27 1370,63 1370.11 1370.02 1369.89 1370.07 09Apr. 1371.95 1369.21 1371,49 1370.61 1369.80 1370.25 1370.23 1369.93 10 Apr. 1371.61 1370.50 1370.85 1370.60 1370.09 1370.07 1369.74 1369.91 11 Apr. 1371 .82 1369.54 1370.12 1370.44 1369.82 1370.06 1369.84 1369.92 12Apr. 1369.67 1370.60 1371.22 1370.15 1369.93 1369.88 13Apr. 1371 .54 1370,15 1370.52 1370.69 1369.82 1370.13 1369.83 14Apr. 1371.29 1370.16 1369.98 1371.08 1370,06 1370.16 1369.85 15 Apr. 1371.51 1370.86 1370.09 1370.48 1371.45 1369.86 1370.08 1369.94 1370.29 16Apr. 1371.25 1370.89 1370.17 1371.05 1369.74 1370.11 1369.72 1370.36 17Apr. 1371.41 1371.52 1370.52 1370.75 1370.01 1369.71 1370.41 18Apr. 1371.62 1370.31 1370.14 1370,72 1369.87 1369.99 1369.65 1370.61 19Apr, 1371.85 1371.80 1370.37 1370,50 1369.77 1370.01 1369.81 1370.54 20Apr. 1371.38 1370.77 1371.09 1370.27 1369.95 1369.61 1370.33 21 Apr. 1371 .76 1371.27 1370.87 1370.53 1370.63 1370.01 1369.94 1370.14 22Apr. 1371.81 1370.80 1370.16 1370.95 1370.39 1369.85 1369,97 23 Apr. 1371 .56 1370.98 1370.39 1370.00 1369.69 1369.58 1369.78 1370.15 24Apr. 1370.52 1371.15 1370.96 1369.00 1369.22 1369.48 25Apr. 1371.46 1370.84 1369.90 1370.68 1369.28 1369.68 1370.06 26Apr. 1371.12 1371.18 1369.96 1370,77 1367.81 1369.44 1369.51 27Apr. 1371.26 1371.15 1371.13 1370.77 1367.12 1369.44 1369.90 1370.51 28Apr. 1370 .96 1371.16 1371.01 1370.67 1367.35 1369.69 1369.68 1370.94 29Apr, 1371.15 1371.39 1371.42 1370.35 1369.93 1369.98 1369.94 30Apr. 1371.22 1371.19 1370.71 1368.10 1370.32 1369.89 01 May 1370,89 1370.96 1371.23 1371.17 1368.35 1370.14 1370.21 02May 1370.32 1371.29 1371.10 1369.35 1370.20 1369.96 03May 1371.68 1370.59 1371.22 1370.73 1370.11 1369.79 04May 1371.75 1371.03 1370.96 1370.99 1370.35 1370.35 1369.71 05May 1371.98 1371.01 1370.90 1371.11 1369.91 1370,22 1369.97 06May 1371.07 1370.77 1370.94 1370.90 1370.04 1370.41 1369.75 07May 1372.07 1371.31 1370.78 1370.62 1370.15 1369.97 08May 1371.89 1370.92 1370.84 1370.93 1369.65 1370.19 1369.70

TOTAL SOLAR IRRADIANCE MEASUREMENTS BY ERB/NIMBUS-7 339
Appendix A r
ERB year 1 2 3 4 5 6 7 8 9
C~. year 78-79 79-80 80-81 81-82 82-83 83-84 84-85 85-86 86-87
09 May 1371.92 1371.75 1371.11 1370.95 1369.07 1370.21 1369.95 10May 1371.47 1370.89 1370.28 1368.92 1369.97 1369.75 11 May 1371.34 1371.36 1371.02 1369.58 1369.90 1370.04 12May 1370,81 1371.14 1369.50 1369.16 1369.87 1369.92 13May 1371.42 1371.13 1370.41 1371,25 1369.65 1369.00 1369.91 1370.06 14May 1371.40 1370.88 1370.58 1370.44 1369.49 1369,86 1369.75 15 May 1371.66 1371.47 1371.03 1370,40 1370.14 1370.10 16May 1370.22 1370.49 1370.90 1370.64 1369.56 1370.06 17May 1371.95 1371.39 1370.30 1370.57 1370.55 1369.88 1370.36 18May 1371.35 1370.38 1371.00 1370.76 1369.89 1370.25 19May 1372.27 1371.43 1370.89 1371.20 1370.12 1370.57 20May 1372.12 1371.07 1370.32 1370.94 1370.84 1369.98 1370.40 21 May 1372.19 1371.16 1371.62 1370.27 1370.43 1369.84 1370.92 22May 1370.58 1371.70 1370.89 1370.51 1369.79 1370.33 23May 1372.16 1370.23 1370.45 1371.03 1370.02 1370,32 24May 1372.06 1371.26 1370.52 1371.25 1370.20 1370.07 1370.36 25 May 1372.28 1369.82 1371.08 1371.08 1370.00 1370.24 1370.41 26May 1371.73 1369.51 1371A0 1371.71 1370.50 1370.12 1370,57 27May 1371.66 1370.02 1370.79 1371.58 1370,49 1370.41 28May 1369.82 1370.94 1370.50 1371.70 1371.10 1370.09 1370.46 29May 1372.12 1370.53 1370.83 1370.95 1370.59 1370.32 1370.29 30May 1371.79 1370.55 1371.27 1371.38 1370.56 1370.35 1370.56 31 May 1371.89 1371.10 1371.36 1370.82 1370.46 1370.51 01 June 1371.41 1370.95 1371.26 1371.03 1370.19 1370.32 1370.21 02 June 1371.16 1371.07 1370.98 1371.34 1370.11 1370.71 137057 03 June 1370.80 1371.09 1371.43 1370.42 1370.30 1370.47 1370.10 04 June 1370.64 1370.96 1371.52 1371.03 1370.21 1370.73 1370.16 05 June 1370.37 1371.49 1370.57 1369.82 1370.53 1370.39 1369.87 06 June 1370.64 1371,11 1371.10 1370.17 1368.90 1370.32 1370.21 1369.97 07 June 1370.98 1371.35 1368.97 1370.63 1370.04 1370.03 08 June 1370.83 1371.52 1370.04 1369,32 1369.94 1370.16 09 June 1370.88 1372.10 1371.48 1369.54 1369.64 1370.88 1369.88 1370.00 10 June 1370.58 1371.33 1371.43 1369.60 1370.74 1369.85 1370.42 11 June 1371.18 1371.41 1370.04 1371.14 1369.73 1370.01 12 June 1370.58 1371.73 1369.79 1370.18 1370.07 1370,35 13 June 1370,61 1370.75 1369.47 1370.50 1371.15 1370.37 1370.22 14 June 1370.64 1371.63 1370.74 1369.42 1370.76 1370.52 1370.53 15 June 1371.33 1370,62 1371,05 1370.73 1370,37 1370.53 16 June 1371.10 1370.95 1370.50 1368.77 1370.96 1370.43 1370.31 17 June 1370.78 1370.83 1368.65 1371.05 1370.72 1370.52 1370.57 18 June 1371.36 1371.74 1370.91 1368.67 1370.35 1370.49 1370.66 19 June 1371.70 1371.25 1371.03 1370.63 1370.30 1370.03 20 June 1371.33 1371,84 1368.80 1370.91 1370.51 1370.48 21 June 1371.37 1371.20 1369.40 1371,15 1370.55 1370.45 1370.31 22 June 1371.57 1371.31 1371.03 1369.66 1371.03 1370.11 1370.49 1370.32 23 June 1371,10 1370.21 1370.47 1370.59 1370.14 24 June 1371.72 1370.69 1370.22 1370.89 1370,28 25 June 1371.46 1370.53 1371.02 1370,40 1370.24 1370.43 1370.81

340 JOHN R. HICKEY ET AL.
Appendix A (continued)
ERB year 1 2 3 4 5 6 7 8 9
Cal. year 78-79 79-80 80-81 81-82 82-83 83-84 84-85 85-86 86-87
26 June 1371.85 1371.50 1370.64 1371.48 1370.12 1370.28 1370.44 27 June 1372.17 1371.50 1370.21 1370.69 1370.16 1369.90 1370.74 28 June 1371.78 1371.69 1371.40 1370.62 1370.09 1370.45 29 June 1371.79 1370.45 1371.18 1370.50 1370.55 1370.01 1370.78 30 June 1371.88 1371.21 1370.28 1371.19 1370.28 1370.53 1370.25 01 July 1371.45 1370.23 1371.19 1370.24 1370.53 1370.28 1370.33 1370.39 02 July 1371.25 1371.59 1370.31 1370.85 1370.27 1370.26 1370.11 1370.29 03 July 1371.04 1370.67 1370.75 1370.54 1370.79 1370.14 1370.31 1370.55 04 July 1371 .19 1370.67 1370.71 1371.03 1370.51 1370.46 1370.14 1370.55 05 July 1370.72 1370.64 1370.60 1370.74 1370.17 1370.54 1370.52 06 July 1371 .53 1370.76 1371.00 1370.43 1370.10 1370,32 1370.42 07 July 1371 .20 1370.74 1370.62 1370.84 1370.26 1370.86 1369.93 1370.53 1370.48 08 July 1371 .48 1370.88 1370.74 1371.12 1371.00 1369,86 1370.33 1370.73 09 July 1372 ,02 1370.68 1370.85 1370.15 1371.09 1369,86 1370.75 10 July 1371 .80 1370.64 1370.52 1370.24 1370.30 1370.37 1370.78 11 July 1371.53 1370.52 1369.77 1370.31 1371.15 1370.44 1370,51 1370.71 12 July 1371 .85 1370.61 1370.44 1369.52 1370.38 1370.48 1370.47 1371.08 13 July 1370.21 1370.38 1370.49 1370.70 1370.53 1370.74 1370.73 14 July 1372.01 1370.38 1368.80 1370.26 1370.31 1370.61 1370.81 15 July 1371.48 1370.36 1368,82 1370.50 1370.16 1370.12 1370.92 1370.71 16 July 1371 .63 1370.69 1370.33 1368.97 1370.22 1370.60 1370.79 1370.87 17 July 1370.42 1370.48 1370.72 1370.26 1370.36 1371.14 1371.17 18 July 1371 .35 1370.52 1369.95 1370.80 1370.39 1370.84 1370,76 19 July 1371.30 1370.50 1370.73 1370.87 1370.32 1370.23 1371.03 1371.06 20 July 1371 .33 1370.53 1369.93 1371.33 1371.48 1370.10 1370.31 1370.80 1371.10 21 July 1370.64 1369.33 1370.85 1370.36 1370.43 1370.99 1371.04 22 July 1371 .37 1370.67 1371.49 1370.54 1370.35 1370.58 1370.61 23 July 1371.07 1368.40 1371.17 1370.71 1370.02 1370.23 1370.97 1371.07 24 July 1371 .38 1371.29 1367.88 1371.04 1369.78 1370.41 1370.52 1370.56 25 July 1371 .67 1371.40 1367.78 1370.65 1369.87 1370.44 1370.69 1370.69 26 July 1371 .33 1371.45 1371.02 1370.46 1370.30 1370.50 1370.24 27 July 1371.50 1368.09 1370.67 1370.11 1370.42 1370.66 1370.87 28 July 1371 .67 1371.01 1368.43 1370.72 1369.84 1370.59 1370.52 1370.83 29 July 1370.82 1368.99 1370.39 1370.10 1370.67 1370.43 1370.71 30 July 1371 .32 1370.67 1369.78 1370.61 1369.89 1370.35 1370.33 1370.30 31 July 1371.30 1369.83 1370.29 1370.10 1371.11 1370.55 1370.45 1370.49 01 Aug. 1371.36 1371.32 1370.74 1370.37 1370.77 1370.41 1370.13 1370.57 02 Aug. 1371.41 1371.00 1369.84 1371.12 1370.32 1370.37 1370.87 03 Aug. 1372,31 1371.57 1370.34 1369.76 1370.84 1370.40 1370.04 1370,58 04 Aug. 1371.56 1370.83 1370.89 1369.77 1370.96 1370.43 1370.27 1370.54 05 Aug. 1372.08 1371.20 1370.57 1370.88 1370.75 1370.51 1370.45 1370.42 06 Aug. 1371.09 1370.53 1370.20 1370.93 1370.34 1370.66 1370.26 07 Aug. 1371.82 1370.89 1370.79 1370.39 1370.83 1370.61 1370.12 08 Aug. 1371.50 1369.70 1371.01 1370.20 1370.57 1370.82 1370.45 1370.72 09 Aug. 1371.61 1371.04 1369.62 1370.98 1370.57 1370.46 1370.54 1371.08 10 Aug. 1371.19 1370.92 1369.88 1369.71 1370.78 1370.45 1370.42 1370.94 11 Aug. 1371.00 1371.02 1370.34 1371,13 1369.37 1370.31 1370.56 1370.86 12 Aug. 1370.79 1370.73 1370.35 1370.76 1370.36 1370.84 1370.99
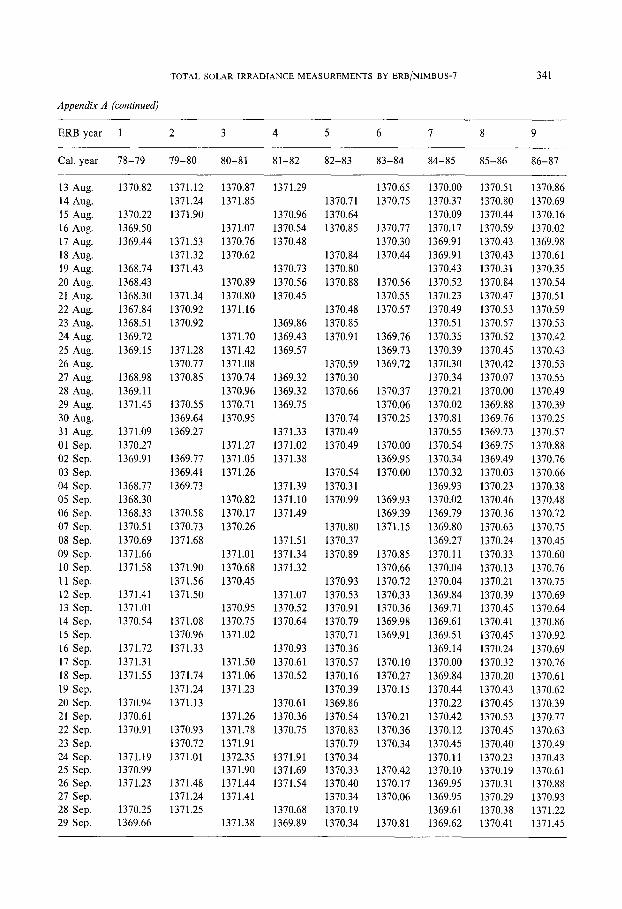
TOTAL SOLAR IRRADIANCE MEASUREMENTS BY ERB/NIMBUS-7 341
Appendix A r
ERB year 1 2 3 4 5 6 7 8 9
C~. year 78-79 79-80 80-81 81-82 82-83 83-84 84-85 85-86 86-87
13 Aug. 1370.82 1371.12 1370.87 1371.29 1370.65 1370.00 1370.51 1370.86 14 Aug. 1371.24 1371.85 1370.71 1370.75 1370.37 1370.80 1370.69 15 Aug. 1370.22 1371.90 1370.96 1370.64 1370.09 1370.44 1370.16 16Aug. 1369.50 1371.07 1370.54 1370.85 1370.77 1370.17 1370.59 1370.02 17Aug. 1369.44 1371.53 1370.76 1370.48 1370.30 1369.91 1370.43 1369.98 18Aug. 1371.32 1370.62 1370.84 1370.44 1369.91 1370.43 1370.61 19Aug. 1368.74 1371.43 1370.73 1370.80 1370.43 1370.31 1370.35 20 Aug. 1368.43 1370.89 1370.56 1370.88 1370.56 1370.52 1370.84 1370.54 21 Aug. 1368.30 1371.34 1370.80 1370.45 1370.55 1370.23 1370.47 1370.51 22Aug. 1367.84 1370.92 1371.16 1370.48 1370.57 1370.49 1370.53 1370.59 23Aug. 1368.51 1370.92 1369.86 1370.85 1370.51 1370.57 1370.53 24Aug. 1369.72 1371.70 1369.43 1370.91 1369.76 1370.35 1370.52 1370.42 25 Aug. 1369.15 1371.28 1371.42 1369.57 1369.73 1370.39 1370.45 1370.43 26Aug. 1370.77 1371.08 1370.59 1369.72 1370.30 1370.42 1370.53 27Aug, 1368.98 1370.85 1370.74 1369.32 1370.30 1370.34 1370.07 1370.55 28Aug. 1369.11 1370.96 1369.32 1370.66 1370.37 1370.21 1370.00 1370.49 29Aug. 1371.45 1370.55 1370.71 1369.75 1370.06 1370.02 1369.88 1370.39 30Aug. 1369.64 1370.95 1370.74 1370.25 1370.81 1369.76 1370.25 31 Aug. 1371.09 1369.27 1371.33 1370.49 1370.55 1369.73 1370.57 01 $ep. 1370.27 1371.27 1371.02 1370.49 1370.00 1370.54 1369.75 1370.88 02 Sep. 1369.91 1369.77 1371.05 1371.38 1369.95 1370.34 1369.49 1370.76 03 Sep. 1369.41 1371.26 1370.54 1370.00 1370.32 1370.03 1370.66 04 Sep. 1368 .77 1369.73 1371.39 1370.31 1369.93 1370.23 1370.38 05 Sep. 1368.30 1370.82 1371.10 1370.99 1369.93 1370.02 1370.46 1370.48 06 Sep. 1368.33 1370.58 1370.17 1371.49 1369.39 1369.79 1370.36 1370.72 07 Sep. 1370.51 1370.73 1370.26 1370.80 1371.15 1369.80 1370.63 1370.75 08 Sep. 1370 .69 1371.68 1371.51 1370.37 1369.27 1370.24 1370.45 09 Sep. 1371.66 1371.01 1371.34 1370.89 1370.85 1370.11 1370.33 1370.60 10 Sep. 1371.58 1371.90 1370.68 1371.32 1370.66 1370.04 1370.13 1370.76 11Sep. 1371.56 1370.45 1370.93 1370.72 1370.04 1370.21 1370.75 12 Sep. 1371.41 1371.50 1371.07 1370.53 1370.33 1369.84 1370.39 1370.69 13 Sep. 1371.01 1370.95 1370.52 1370.91 1370.36 1369.71 1370.45 1370.64 14 Sep. 1370.54 1371.08 1370.75 1370.64 1370.79 1369.98 1369.61 1370.41 1370.86 15 Sep. 1370.96 1371.02 1370.71 1369.91 1369.51 1370.45 1370.92 16 $ep. 1371.72 1371.33 1370.93 1370.36 1369.14 1370.24 1370.69 17 Sep. 1371.31 1371.50 1370.61 1370.57 1370.10 1370.00 1370.32 1370.76 18 Sep. 1371.55 1371.74 1371.06 1370.52 1370.16 1370.27 1369.84 1370.20 1370.61 19 Sep. 1371.24 1371.23 1370.39 1370.15 1370.44 1370.43 1370.62 20 Sep. 1370 .94 1371.13 1370.61 1369.86 1370.22 1370.45 1370.39 21Sep. 1370.61 1371.26 1370.36 1370.54 1370.21 1370.42 1370.53 1370.77 22 Sep. 1370.91 1370.93 1371.78 1370.75 1370.83 1370.36 1370.12 1370.45 1370.63 23 Sep. 1370.72 1371.91 1370.79 1370.34 1370.45 1370.40 1370.49 24 Sep. 1371 .19 1371.01 1372.35 1371.91 1370.34 1370.11 1370.23 1370.43 25 Sep. 1370.99 1371.90 1371.69 1370.33 1370.42 1370.10 1370.19 1370.61 26 Sep. 1371.23 1371.48 1371.44 1371.54 1370.40 1370.17 1369.95 1370.31 1370.88 27 Sep. 1371.24 1371.41 1370.34 1370.06 1369.95 1370.29 1370.93 28 Sep. 1370.25 1371.25 1370.68 1370.19 1369.61 1370.38 1371.22 29 Sep. 1369.66 1371.38 1369.89 1370.34 1370.81 1369.62 1370.41 1371.45

342 JOHN R. HICKEY ET AL.
Appendix A (continued)
ERB year 1 2 3 4 5 6 7 8 9
Cal. year 78-79 79-80 80-81 81-82 82-83 83-84 84-85 85-86 86-87
30 Sep. 1370.50 1371.71 1371 .33 1370.61 1370.09 1370.67 1369.73 1370 .19 1371.35 01 Oct. 1371.36 1371.57 1370.18 1370.46 1370.22 1370.01 1371.17 02 Oct. 1371.32 1371.56 1370.90 1370.20 1369.76 1370.07 1371.12 03 Oct. 1371.27 1372.20 1371.74 1371.15 1370.31 1370.37 1370.33 1370 .47 1371.01 04 Oct. 1 3 7 1 . 4 9 1371.50 1371.21 1371 .78 1370 .49 1370.37 1370.27 1370 .19 1370.89 05 Oct. 1371.26 1370.96 1370.29 1370 .73 1370.32 1370.41 1371.29 06 Oct. 1 3 7 0 . 7 6 1371.57 1371.74 1370.07 1370.06 1370.33 1371.39 07 Oct. 1370.09 1371.09 1371 .13 1369.99 1370.79 1370.00 1370.26 1371.41 08 Oct. 1370.30 1371 .53 1371.09 1371 .25 1369 .93 1370.59 1369 .89 1370.12 1371.46 09 Oct. 1370.75 1371.32 1370.00 1370.41 1369 .89 1370.24 1371.44 10 Oct. 1370.80 1370.46 1371.23 1369.67 1369.62 1370.24 1371.14 11 Oct. 1370.36 1370.48 1370.80 1370.01 1370 .33 1369.58 1370.35 1371.06 12 Oct. 1370.62 1370.01 1369 .73 1370.93 1370.47 1370.22 1370.08 1370.41 1370.84 13 Oct. 1369.79 1369.20 1370.71 1370.68 1370.09 1370.21 1371.24 14 Oct. 1371.76 1370.84 1370.79 1370.40 1369.94 1370.21 1371.02 15 Oct. 1371.50 1369.27 1370 .53 1370.10 1370 .53 1370.04 1370.29 1370.99 16 Oct. 1 3 7 1 . 3 5 1371 .85 1368.67 1370.80 1370 .15 1370.46 1369.85 1370.32 1370.96 17 Oct. 1371.64 1368.71 1370.26 1370 .28 1369.92 1370.18 1370.98 18 Oct. 1 3 7 0 . 7 5 1371.65 1370.90 1370.20 1369.72 1370.21 1371.08 19 Oct. 1370.69 1369.67 1370.68 1370.40 1370.11 1369.74 1370.09 1371.15 20 Oct. 1371.09 1370.86 1369.60 1370.84 1370.47 1370.16 1369 .99 1369.76 1371.18 21 Oct. 1370.23 1370.29 1371.17 1370.16 1370.01 1370 .09 1371.01 22 Oct. 1 3 7 1 . 6 9 1370.26 1370.55 1370 .78 1370.93 1369.61 1370 .33 1371.28 23 Oct. 1371.21 1371.33 1370 .59 1371.00 1370.78 1369.89 1370.22 1371.28 24 Oct. 1 3 7 1 . 9 9 1370.77 1371.31 1370.70 1370.61 1370.56 1370.02 1370.14 1371.19 25 Oct. 1371.17 1371.15 1370.51 1370 .55 1370 .18 1370.22 1371.24 26 Oct. 1371.56 1371.51 1370.04 1370.48 1370.37 1370.21 1371.20 27 Oct. 1370.95 1371.33 1369.90 1370.54 1370.61 1370.44 1370.25 1371.16 28 Oct. 1371.17 1371 .55 1371 .55 1370.92 1370.44 1370.26 1370.24 1370.30 1370.96 29 Oct. 1371.38 1371.84 1370.44 1370 .33 1370 .85 1370.29 1370.91 30 Oct. 1 3 7 1 . 2 9 1371.23 1371.49 1370.34 1370.24 1370.86 1370.02 1370.92 31 Oct. 1370.67 1371.17 1370.49 1370 .18 1370.74 1369.60 1371.00