torrefaction processing for human solid waste · pdf filetorrefaction processing for human...
TRANSCRIPT

46th International Conference on Environmental Systems ICES-2016-341 10-14 July 2016, Vienna, Austria
1
Torrefaction Processing for Human Solid Waste Management
Michael A. Serio,1 Joseph E. Cosgrove,2 and Marek A. Wójtowicz3 Advanced Fuel Research, Inc., 87 Church Street, East Hartford, CT 06108-3720 USA
Thomas J. Stapleton,4 Tim A. Nalette,5 United Technologies Aerospace Systems, Windsor Locks, CT 06096 USA
Michael K. Ewert,6 NASA Johnson Space Center, Houston, TX 77058
Jeffrey Lee,7 and John Fisher8 NASA Ames Research Center, Moffett Field, CA 94035-1000 USA
This study involved a torrefaction (mild pyrolysis) processing approach that could be used to sterilize feces and produce a stable, solid product that can be stored or recycled, and also to simultaneously recover moisture. It was demonstrated that mild heating (200-250 °C) in nitrogen or air was adequate for torrefaction of a fecal simulant and an analog of human solid waste (canine feces). The net result was a nearly undetectable odor (for the canine feces), complete recovery of moisture, some additional water production, a modest reduction of the dry solid mass, and the production of small amounts of gas and liquid. The liquid product is mainly water, with a low Total Organic Carbon content. The amount of solid versus gas plus liquid products can be controlled by adjusting the torrefaction conditions (final temperature, holding time), and the current work has shown that the benefits of torrefaction could be achieved in a low temperature range (< 250 °C). These temperatures are compatible with the PTFE bag materials historically used by NASA for fecal waste containment and will reduce the energy consumption of the process. The solid product was a dry material that did not support bacterial growth and was hydrophobic relative to the starting material. In the case of canine feces, the solid product was a mechanically friable material that could be easily compacted to a significantly smaller volume (~50%). The proposed Torrefaction Processing Unit (TPU) would be designed to be compatible with the Universal Waste Management System (UWMS), now under development by NASA. A stand-alone TPU could be used to treat the canister from the UWMS, along with other types of wet solid wastes, with either conventional or microwave heating. Over time, a more complete integration of the TPU and the UWMS could be achieved, but will require design changes in both units.
Nomenclature
ALS = Advanced Life Support AFR = Advanced Fuel Research, Inc. 1 President, Advanced Fuel Research, Inc. (AFR), 87 Church Street, East Hartford, CT 06108. 2 Laboratory Manager, AFR, 87 Church Street, East Hartford, CT 06108. 3 Vice President, Clean Energy & Carbon Materials, AFR, 87 Church Street, East Hartford, CT 06108. 4 Preliminary Design Engineer, Advanced Technology Space Systems, UTC Aerospace System, Windsor Locks, CT 06096 5 Chief of Advanced Systems & Technology, UTC Aerospace Systems, Windsor Locks, CT 06096. 6 Life Support and Thermal Systems Analyst, NASA Johnson Space Center, Houston, TX 77058 7 System Analyst, Bioengineering Branch, MS N239-15, NASA Ames Research Center, Moffett Field, CA 94035. 8 Lead Engineer, Exploration Life Support, NASA-Ames Research Center, Moffett Field, CA 94035.
https://ntrs.nasa.gov/search.jsp?R=20160003882 2018-05-16T17:32:31+00:00Z
International Conference on Environmental Systems
2
AR = As-ReceivedCDRA = Carbon Dioxide Removal Assembly daf = Dry, Ash Free DOC = Dissolved Organic Carbon EMC = Equilibrium Moisture Content FC = Fixed Carbon FTIR = Fourier Transform Infrared HMC = Heat Melt Compactor ISRU = In-Situ Resource Utilization ISS = International Space Station LPM = Liters per Minute LB = Lysogeny Broth MFC = Mass Flow Controller MFM = Mass Flow Meter OMPCV = Orion Multi-Purpose Crew Vehicle PID = Proportional, Integral, Differential PMWC = Plastic Melt Waste Compactor PTFE = Teflon™ RH = Relative Humidity SBIR = Small Business Innovation Research TC = Thermocouple TG = Thermogravimetic Analyzer TOC = Total Organic Carbon TPU = Torrefaction Processing Unit UPA = Urine Processor Assembly UTAS = United Technologies Aerospace Systems UWMS = Universal Waste Management System VM = Volatile Matter WC/T = Waste Collection/Torrefaction WMS = Waste Management System WPA = Water Processor Assembly
I. Introduction
A. The Problem and Technical Approach ew technology is needed to collect, stabilize, recover useful materials, and store human fecal waste and other spacecraft solid wastes for long duration missions. The motivations include crew safety, comfort and resource
requirements, along with planetary protection. 1 - 5 The current paper addresses a torrefaction (mild pyrolysis) processing system that can be used to sterilize feces and related cellulosic biomass wastes (food, paper, wipes, and cotton clothing) and produce a stable char residue that can be easily stored or recycled, while simultaneously recovering all of the moisture and producing small amounts of other gases. As in the case of pyrolysis, torrefaction is usually defined as thermal treatment done in the absence of air. However, since the temperature is lower (usually <300 °C), some air can be present without having much effect. Previous NASA sponsored work 6 - 8 demonstrated that torrefaction processing was effective for a fecal simulant using bench scale experiments with both microwave and conventional heating. The objective of the current study was to scale up the process to about 1/3 scale, operate at less severe torrefaction conditions (<250 °C) and utilize more realistic samples (canine feces).
B. Potential Advantages versus Current Solid Waste Management Technology As discussed by Fisher et al.,9 the need for waste processing varies greatly, depending on the mission scenario.
The near term needs are for the Orion Multi-Purpose Crew Vehicle (OMPCV), which will provide crewed missions to low Earth orbit and beyond. The intermediate term needs are for waste management technologies that could support missions to the moon and, eventually, the establishment of a habitat on the moon. The longer term missions would be to establish a long term base on the moon and ultimately to go to Mars. There has been a lot of NASA supported work (both internal and external) on Waste Management Systems. These include testing of a Plastic Melt Waste Compactor (PMWC),10 use of microwaves to stabilize waste and recover water,11 and evaluating water recovery using a microwave freeze drying unit, a microwave powered ambient dryer, and a recirculating hot air
N
International Conference on Environmental Systems
3
dryer.12 This represents a shift in emphasis away from fully regenerative technologies, such as incineration and supercritical water oxidation, which received a lot of attention in the 1990s.9 All the above approaches have their advantages, but also disadvantages which have prevented adoption of any single method. For example, incineration utilizes a valuable resource, oxygen, and produces undesirable byproducts, such as oxides of sulfur and nitrogen. In addition, incineration will immediately convert all of the waste carbon to CO2, which will require venting excess CO2.
C. Potential Benefits for NASA The use of torrefaction processing would make it technically feasible to process human fecal waste and related
solid waste streams in space, which will benefit long term space travel such as an extended Lunar stay or a mission to Mars. As discussed in previous papers,6-8 the proposed torrefaction (mild pyrolysis) approach is beneficial to NASA in allowing for volume reduction, solid waste sterilization and stabilization, and water recovery for near term missions. In the case of longer term missions, more severe (pyrolysis) processing in the same or similar equipment would allow for enhanced water and CO2 production, production of fuel gases (CH4, CO, and H2) and multi-purpose carbon, along with In-Situ Resource Utilization (ISRU). The torrefaction processing system is also complementary to the Plastic Waste Melt Compactor10 and other types of Heat Melt Compactors (HMCs) and could also be designed to be compatible with the Universal Waste Management System (UWMS),13 both now under development by NASA. The potential integration of the TPU with other life support technologies is shown in Figure 1.
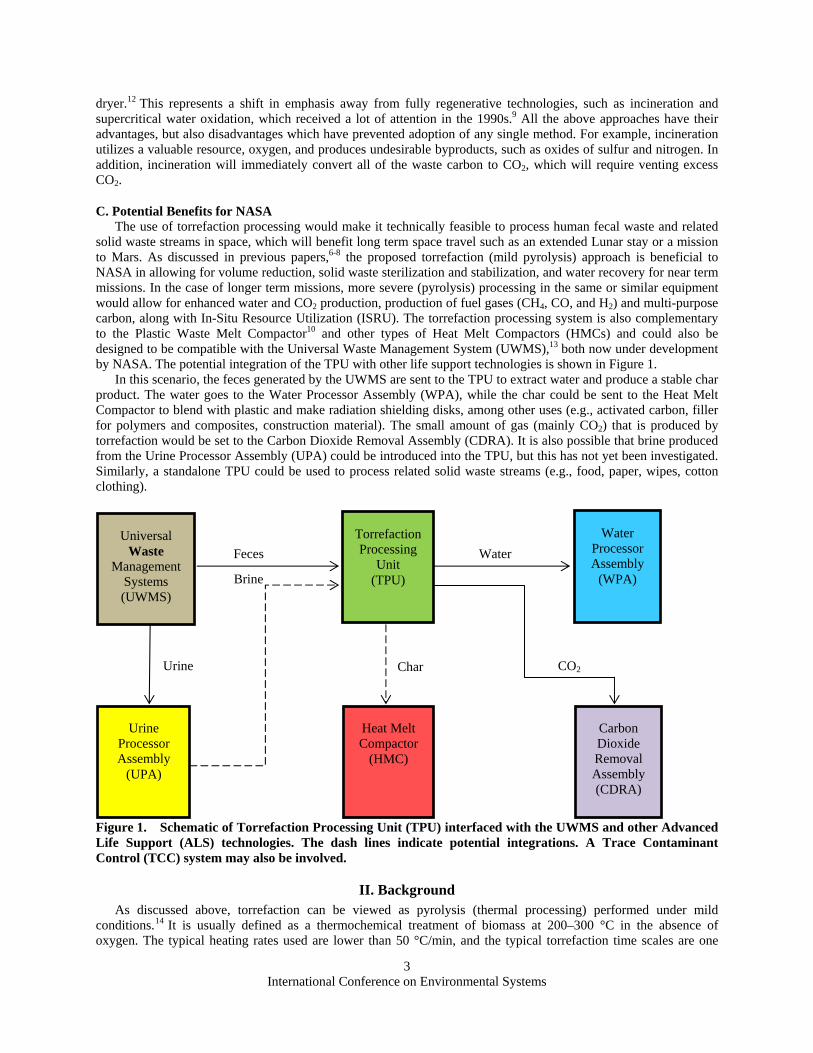
In this scenario, the feces generated by the UWMS are sent to the TPU to extract water and produce a stable char product. The water goes to the Water Processor Assembly (WPA), while the char could be sent to the Heat Melt Compactor to blend with plastic and make radiation shielding disks, among other uses (e.g., activated carbon, filler for polymers and composites, construction material). The small amount of gas (mainly CO2) that is produced by torrefaction would be set to the Carbon Dioxide Removal Assembly (CDRA). It is also possible that brine produced from the Urine Processor Assembly (UPA) could be introduced into the TPU, but this has not yet been investigated. Similarly, a standalone TPU could be used to process related solid waste streams (e.g., food, paper, wipes, cotton clothing).
Figure 1. Schematic of Torrefaction Processing Unit (TPU) interfaced with the UWMS and other Advanced Life Support (ALS) technologies. The dash lines indicate potential integrations. A Trace Contaminant Control (TCC) system may also be involved.
II. Background As discussed above, torrefaction can be viewed as pyrolysis (thermal processing) performed under mild
conditions.14 It is usually defined as a thermochemical treatment of biomass at 200–300 °C in the absence of oxygen. The typical heating rates used are lower than 50 °C/min, and the typical torrefaction time scales are one
Torrefaction Processing
Unit (TPU)
Water Processor Assembly
(WPA)
Carbon Dioxide Removal Assembly (CDRA)
Heat Melt Compactor
(HMC)
Urine Processor Assembly
(UPA)
Universal Waste
Management Systems (UWMS)
Urine
Feces
Brine
Water
CO2 Char

International Conference on Environmental Systems
4
hour or less. Torrefaction has attracted a lot of interest in recent years, primarily in Europe, and the main reason seems to be a trend towards more sustainable power generation, in particular co-firing of biomass pellets with coal. 15 – 20 The main advantages of torrefied biomass are: (1) higher energy density, (2) more homogeneous composition, (3) hydrophobic behavior, (4) improved grindability, and (5) elimination of biological activity.
An understanding of a key benefit of torrefaction (mild pyrolysis) processing for intermediate term missions in space can be gained by looking at the results from temperature programmed pyrolysis of a representative biomass material (feces simulant), shown in Figure 2. These are results for the evolution of major products from a standard pyrolysis experiment at 30 K/min (up to 900°C) using a thermogravimetric analyzer (TG) with FTIR analysis of evolved gases (TG-FTIR). The plots show the sample weight loss, as well as both the differential and integral evolution curves for several species (H2O, tars, CO2, CH4, CO, acetic acid, acetaldehyde). The 10 to 25% by weight of water that can be produced from pyrolysis of many common (dried) biomass materials (see upper right panel in Figure 2) is one of the advantages of pyrolysis processing of solid wastes, especially for intermediate term mission scenarios. However, the penalty for this additional water evolution is the production of significant amounts of non-condensable gases (e.g., CO2, CO), along with significant tar evolution, also shown in Figure 2. In the case of the fecal simulant, which is not a pure biomass material, the amounts of major pyrolysis products are somewhat lower, but the point is the same.
However, it can also be observed in Figure 2 that pyrolysis temperatures below 300 °C (~42 minutes), which is the usual upper limit for torrefaction, produce about 50% of the pyrolytic water evolution, and do not lead to significant evolutions for most other gases or tars. Exceptions include acetic acid and modest amounts of CO2 and CO. The key for torrefaction processing of feces and related biomass materials is to remove moisture, produce additional pyrolytic water (up to ~50% of the maximum amount) but to not transition to active pyrolysis, where tar formation becomes important. In this case, careful control of the sample temperature becomes important.
III. Experimental
A. Experimental Apparatus Advanced Fuel Research, Inc. (AFR) designed a near full (~1/3) scale integrated Waste Collection/Torrefaction
(WC/T) test unit for fecal waste that would be compatible with the UWMS, currently under development at United Technologies Aerospace Systems (UTAS).13 In that system, fecal waste is collected in a single bag, which in turn is then collected in a rigid canister (containing multiple bagged samples) and manually compacted. In the AFR design (shown schematically in Figure 3), a metal canister is heated with external heating elements in a stand-alone unit. At full scale, the plan is that the WC/T canister would be designed to be compatible with the canister design and materials that are utilized in the UWMS, which would eliminate the need to transfer the bagged waste samples for processing and odor control. However, this would depend on the mode of heating that is used for the TPU.
The AFR WC/T reactor had a capacity of 1000 g, compared to an estimated 3000 g for a full-scale canister in the UWMS. This WC/T reactor was used to study torrefaction of fecal simulants. A smaller reactor, developed under the previous torrefaction study,6-8 was employed for experiments involving actual fecal samples (canine feces), because of the more limited supply of these materials.
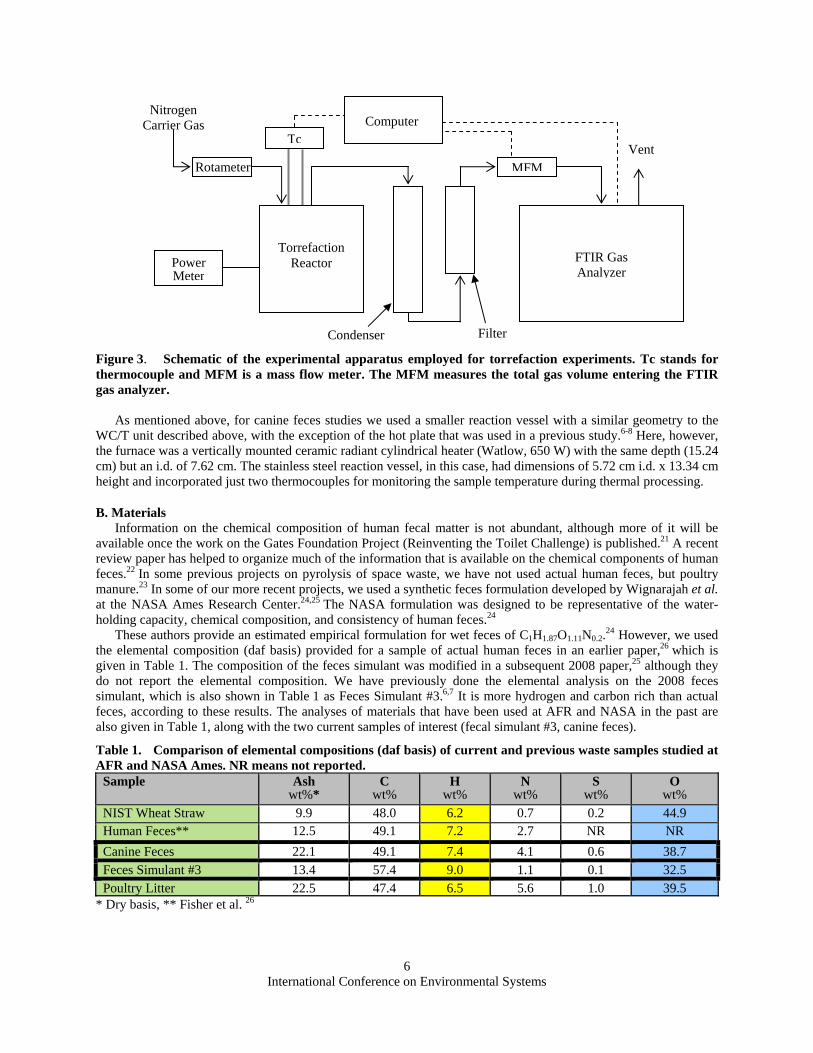
A photograph of the torrefaction reactor system that was assembled for this study is shown in Figure 4, which includes the main components shown in the schematic of Figure 3. The primary components are the reactor (described below) and the FTIR gas analyzer (not shown). A condenser (~10 oC) is employed for collecting condensable products (water, oil) and a wool filter is used to prevent residual particulate species from contaminating the sampling cell of the FTIR instrument. The FTIR gas analyzer has a frequency range of 500 – 6500 cm-1 with a resolution of 0.5 cm-1. The instrument is calibrated for quantitative measurements of CO2, CO, CH4, C2H2 and H2O (which is not completely condensed). The heated (150 oC), multi-pass gas sampling cell has a pathlength of 5 m, enabling detection of many gas species at ppm levels. As noted in a previous study, the CO2 yields are a good indication of the progress of torrefaction reactions.6-8
The carrier gas flow is controlled by a rotameter, as shown in the schematic (Figure 3) and photo depicted in Figure 4. Figure 5 depicts a diagram of the furnace reactor. As shown, the furnace is a vertically mounted ceramic radiant cylindrical heater (Omega, 1350 W) with a depth of 15.24 cm and an i.d. of 15.24 cm. The reaction vessel, also shown in Figure 5, was designed by AFR and fabricated by an outside machine shop (Sharon Vacuum, Brockton, MA). It is made of stainless steel and consists of two parts: a 1.6 L canister (12.37 cm i.d. x 13.34 cm height) and an O-ring sealed mating flange. A PID controller connected to one of the thermocouples is used for controlling the reaction temperature. The ability to maintain good control of temperature is important to separating the various stages of the torrefaction process so that water, for example, will have minimal contamination with hydrocarbons.

International Conference on Environmental Systems
5
Figure 2. TG-FTIR analysis results for major products from feces simulant heated at 30 K/min, after drying at 80 °C for 30 min. Unless otherwise indicated, solid and dashed lines represent evolution rates and product yields, respectively.
International Conference on Environmental Systems
6
Figure 3. Schematic of the experimental apparatus employed for torrefaction experiments. Tc stands for thermocouple and MFM is a mass flow meter. The MFM measures the total gas volume entering the FTIR gas analyzer.
As mentioned above, for canine feces studies we used a smaller reaction vessel with a similar geometry to the WC/T unit described above, with the exception of the hot plate that was used in a previous study.6-8 Here, however, the furnace was a vertically mounted ceramic radiant cylindrical heater (Watlow, 650 W) with the same depth (15.24 cm) but an i.d. of 7.62 cm. The stainless steel reaction vessel, in this case, had dimensions of 5.72 cm i.d. x 13.34 cm height and incorporated just two thermocouples for monitoring the sample temperature during thermal processing.
B. Materials Information on the chemical composition of human fecal matter is not abundant, although more of it will be
available once the work on the Gates Foundation Project (Reinventing the Toilet Challenge) is published.21 A recent review paper has helped to organize much of the information that is available on the chemical components of human feces.22 In some previous projects on pyrolysis of space waste, we have not used actual human feces, but poultry manure.23 In some of our more recent projects, we used a synthetic feces formulation developed by Wignarajah et al. at the NASA Ames Research Center.24,25 The NASA formulation was designed to be representative of the water-holding capacity, chemical composition, and consistency of human feces.24
These authors provide an estimated empirical formulation for wet feces of C1H1.87O1.11N0.2.24 However, we used
the elemental composition (daf basis) provided for a sample of actual human feces in an earlier paper,26 which is given in Table 1. The composition of the feces simulant was modified in a subsequent 2008 paper,25 although they do not report the elemental composition. We have previously done the elemental analysis on the 2008 feces simulant, which is also shown in Table 1 as Feces Simulant #3.6,7 It is more hydrogen and carbon rich than actual feces, according to these results. The analyses of materials that have been used at AFR and NASA in the past are also given in Table 1, along with the two current samples of interest (fecal simulant #3, canine feces).
Table 1. Comparison of elemental compositions (daf basis) of current and previous waste samples studied at AFR and NASA Ames. NR means not reported.
Sample Ash wt%*
Cwt%
Hwt%
Nwt%
S wt%
Owt%
NIST Wheat Straw 9.9 48.0 6.2 0.7 0.2 44.9Human Feces** 12.5 49.1 7.2 2.7 NR NR
Canine Feces 22.1 49.1 7.4 4.1 0.6 38.7Feces Simulant #3 13.4 57.4 9.0 1.1 0.1 32.5Poultry Litter 22.5 47.4 6.5 5.6 1.0 39.5
* Dry basis, ** Fisher et al. 26
Vent
Nitrogen Carrier Gas
Rotameter
Power Meter
Computer Tc
FTIR Gas Analyzer
Torrefaction Reactor
Condenser Filter
MFM

International Conference on Environmental Systems
7
Figure 4. Photograph of the experimental apparatus employed for torrefaction experiments.
Figure 5. Left: diagram of the furnace-heated torrefaction reactor. Right: photograph of the stainless steel reaction vessel. The flange includes gas entry and exit ports as well as access for three thermocouples (TC) monitoring the sample temperature at the edge (inside wall), the center and at an intermediate “midpoint.”
Nitrogen Carrier Gas
Gas Products
Tc (3)
Radiant Ceramic Heater Tc
Furnace
Condenser Particle Filter
Mass Flow Meter

International Conference on Environmental Systems
8
It should be noted that Brian van Herzen of the Climate Foundation reported a formula of C1H1.4O0.6 for human feces,27 which is close to the elemental composition implied in Table 1, which corresponds to C1H1.8O0.6. Of course, there will be variations depending on the diet of the person that produced the sample. There are a lot of data in the literature on the composition of primary sewage sludge samples, which can be considered mostly feces, but can have lots of other ingredients (food waste, soap, dirt, clay, etc.) and have been partly or fully digested, as discussed above. The dry, ash-free (daf) elemental compositions reported by Danso-Boateng et al.28 for primary sewage sludge of 46.93/6.11/50.90/4.17 for C/H/O/N are close to the values reported for human feces in Table 1.
In the case of the current project, an actual human fecal sample bank was investigated as a potential source, OpenBiome (Medford, MA), but it would not provide material for non-medical studies. For this reason, a decision was made to use canine feces samples. The elemental composition was pretty close to human feces, as shown in Table 1.
As discussed above, the composition of the fecal simulant samples used for the large-scale experiments was based on a formulation developed by Wignarajah et al.,25 which includes cellulose (14.3 %), polyethylene glycol (7.1 %), peanut oil (28.6 %), miso (42.9 %), potassium chloride (5.7 %), and calcium chloride (1.4 %), where each amount is weight percent. The water content, determined by drying in an 80 °C oven for a period of 24 hours, is approximately 20 %. For all experiments, the moisture content was adjusted to 50 %, by adding extra water (deionized) to the base simulant. At this level, the simulant has a consistency of pancake batter and a yellowish color.
The canine feces samples were collected periodically from a pet of one of the AFR researchers involved in this project. The dog is a healthy adult (~ 4 years old) female Australian shepherd/unknown mix, weighing about 60 lbs, and is fed a regular diet consisting primarily of a commercial dry dog food. The fecal material was collected immediately after defecation and was typically treated within one to two days of collection. For all experiments, it appeared to be consistent in color, texture and density.
Examples of the simulant and canine feces, along with their torrefied (250 oC in nitrogen) counterparts, are depicted in Figure 6. After heating, the simulant is converted to a blackened char with a granular consistency, accompanied by a modest volume reduction of ~ 25 %, with some compression. On the other hand, the feces retains its initial physical structure, with some minor shrinkage. With gentle crushing, the feces “husks” are converted to powder/sawdust consistency, as shown in the photo, and the volume is reduced to ~ 50 % of the original, as received material.
IV. Results and Discussion
A. Torrefaction Experiments The variables that were studied include sample size, sample composition, gas atmosphere, gas phase residence
time, final temperature, and holding time. Analyses were made of gas composition, char yield and elemental composition, and liquid yield and composition. The solid products were examined for odor, hydrophobicity, and biological activity using standard methods. Several approaches were considered for odor control, which included primarily adjusting the experimental conditions (temperature, gas atmosphere) under the current study. The recovery of moisture and the production of additional water were closely monitored.
The torrefaction experiments focused mainly on two types of materials: 1) a fecal simulant developed at NASA and 2) actual canine feces. As described above, about 1000 g of the fecal simulant was processed in the larger-scale reactor, which was particularly useful for studying the thermal characteristics of the system, such as sample temperature gradients and heating rate, in a furnace-heated geometry. The canine feces experiments allowed us to evaluate the effects of temperature on the solid, liquid and gas composition, and the char properties in terms of hydrophobicity, bioactivity and odor. These samples were treated in the smaller reaction vessel in quantities of about 100 g per run. In all experiments, the sample thermocouples were inserted about halfway (depth-wise) into the sample at the radial positions described above, and the edge thermocouple was used for the temperature control.
Through discussions with UTAS, we learned that the commode uses special bags for capturing fecal matter after each use. The bag is a blend of Teflon 29 and polyester designed to be both hydrophobic and breathable. We therefore conducted thermal tests on the bag material, to ensure its compatibility with the torrefaction conditions. The bag will serve to contain the torrefaction char residue afterwards in the microgravity environment, so it is important that it maintains its integrity.
As described above, FTIR spectra were collected and analyzed continuously throughout most of the runs and analyzed for CO2, CO, CH4, C2H4, and H2O. After cooldown, the reaction vessel, condenser, filter and gas transfer lines were weighed to determine the remaining torrefied sample mass and condensate produced during each run.

International Conference on Environmental Systems
9
Figure 6. Top: Photograph of a sample of undried (50 %, moisture) fecal simulant (left) and a torrefied sample (right), heated to a maximum temperature of ~ 250 °C. Bottom: Photograph of a sample of fresh canine feces (left) and a torrefied sample (right). The torrefied sample was heated to a maximum temperature of ~250 °C and gently crushed. Mass balances were in the range 99-102 % for all runs where gas species were measured and that employed a nitrogen carrier gas. In those experiments where air was used as the carrier gas, the mass balances exceeded 102 % because of the excess CO2 and CO that were produced, as would be expected.
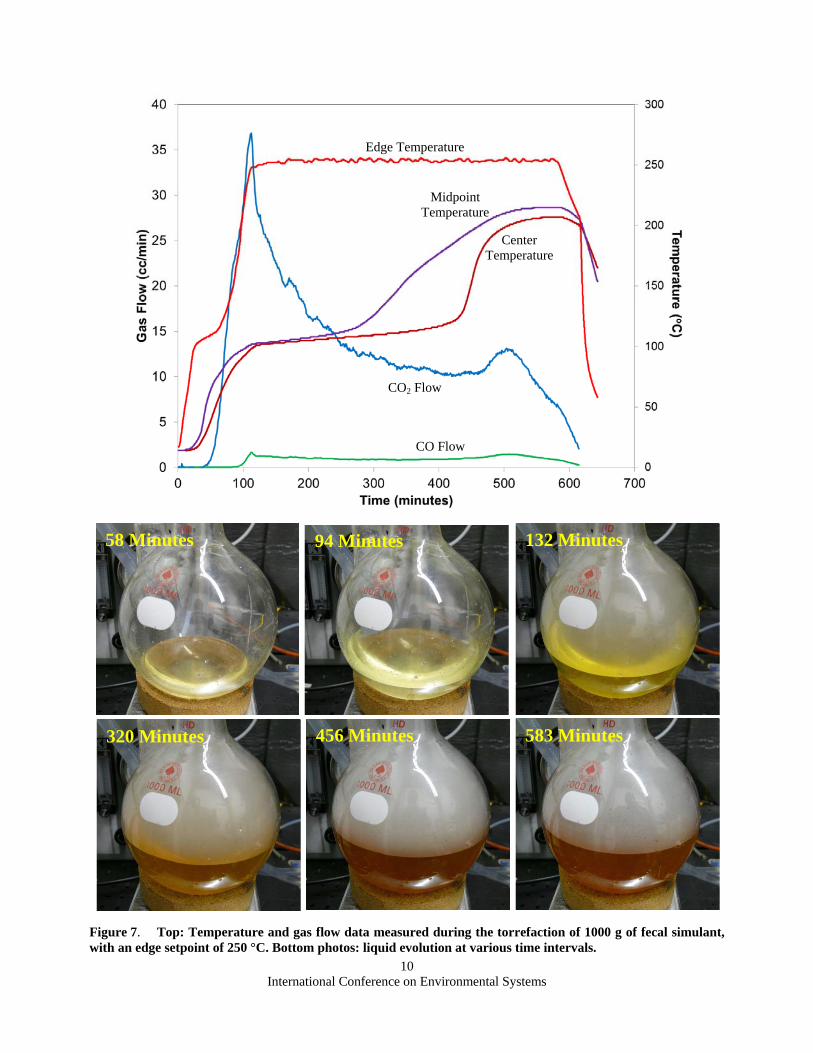
Figures 7 and 8 depict gas-temperature evolution plots that were recorded during the torrefaction of 1000 g of fecal simulant (setpoint = 250 oC) and 100 g of canine feces (setpoint = 225 oC), respectively, in nitrogen (~1 LPM) environments. Also shown are the temperature profiles measured at different locations in the sample, for each case. Not surprisingly, the inner sample temperatures lag behind the edge temperatures in both cases. A plateau was also noted at about 100 oC in each of the sample temperature profiles, which is attributed to boil-off of the water in the simulant. This effect is particularly pronounced with the larger sample. After reaching steady state, both the simulant and feces samples are held for periods of 20 and 60 minutes, respectively, during which time the CO2 and CO production decreases. The other gases that were quantified, CH4 and C2H4, are not plotted since they were found to be present only in small amounts. Some additional organic species that were observed in the gas phase during torrefaction of the simulant include ethanol and acetone. The ethanol is thought to be a fermentation product present in the miso, which represents the largest fraction of material in the simulant, not including water. Additional organics detected during the canine feces torrefaction runs included methanol, isopropanol, acetaldehyde and acetone. None of these gases was quantified during this study, but will be addressed in future work using more sensitive gas analysis methods. In general, it was found that the gas composition becomes more complex for higher torrefaction temperatures (e.g., 250 °C vs. 225 °C) and more realistic samples (e.g., canine feces vs. simulant).
Figures 7 and 8 also display several photographs of the liquid collection flask, taken at different time intervals during each experiment. Initially, the liquid is clear and has a slight yellowish tinge in each case. As the measured
International Conference on Environmental Systems
10
Edge Temperature
Midpoint Temperature
Center
Temperature
CO2 Flow
CO Flow
58 Minutes 94 Minutes 132 Minutes
320 Minutes 456 Minutes 583 Minutes
Figure 7. Top: Temperature and gas flow data measured during the torrefaction of 1000 g of fecal simulant, with an edge setpoint of 250 °C. Bottom photos: liquid evolution at various time intervals.

International Conference on Environmental Systems
11
32 Minutes 54 Minutes 77 Minutes
137 Minutes 190 Minutes 287 Minutes
Figure 8. Top) Temperature and gas flow data measured during the torrefaction of 100 g of canine feces, with an edge setpoint of 225 °C. Bottom photos) liquid evolution at various time intervals.
Edge Temperature
Center Temperature
CO2 Flow
CO Flow

International Conference on Environmental Systems
12
temperatures inside the reaction vessel approach thermal equilibrium, however, we observe some gradual darkening of the liquid, particularly in the higher temperature case (simulant) suggesting the possible presence of oils and tars. It is also interesting to note that an aerosol cloud is observed in the flask in each run, early into the experiment and lasting for most of its duration.
Table 2 summarizes the results of the torrefaction experiments that were performed on both of the main sample materials (simulant, canine feces). It also includes a single experiment that was done on a whole banana, as a representative biomass sample and also as a potential feces analog due to its high moisture content (> 80%). This table includes important experimental parameters, such as the carrier gas and flow rate, measured sample temperatures and heating period. The table also provides the solid, liquid and gas yields (based on the wet sample mass), including the yields for CO2, which was the major non-condensable gas observed in all runs. As shown in Figures 7 and 8, small amounts of CO were observed from both types of samples, typically < 0.1wt.% on an as-received basis for experiments in nitrogen and low air flows. As described above, the solid yields were determined gravimetrically. The liquid yields, primarily water, were also determined gravimetrically, but they also include the minor fraction that was measured in the vapor phase. The liquid yields for the canine feces samples are slightly in excess of the moisture content (3-5%), while for the simulant samples an extra ~10% by weight of water was observed from torrefaction. As discussed above, this is a characteristic of many biomass materials.6-8 The total gas yields are based on the total non-condensable gases that were quantified. Finally, the table provides the calculated electrical energy usage for each experiment, on a per gram sample (wet) basis.
Table 2. Summary of gas, solid and liquid yields for all torrefaction experiments. The nominal moisture contents for the simulant and canine feces were 50 % and 70 %, respectively. For the first three runs, the gas composition was not recorded. Product yields are expressed on an as-received (wet) basis. Run
# Sample Sample
Mass (g)
Carrier Gas, Flow
(LPM)
Max. Temp.
(oC)
CenterTemp. (oC)1
Soak Time (min)
Solid Yield (%)
Liq. Yield (%)2
Gas Yield (%)3
CO2 Yield (%)
Elec. Energy (Wh/g)
201 Sim. 1000 N2, 1 275 205* - 41.5 55.5 - - 1.69 202 Sim. 1000 N2, 1 250 209* - 42.5 53.9 - - 1.93 203 Sim. 1000 N2, 1 225 190* - 44.0 53 - - 1.93 204 Feces 105 N2, 1 250 226 60 23.8 74.1 2.8 2.7 3.70 205 Feces 99.3 N2, 1 225 203 60 22.5 76.3 2.3 2.2 3.69 206 Feces 98.9 N2, 1 200 164 60 25.6 75.0 1.2 1.1 3.40 207 Feces 99.8 Air, 0.5-1 225 223 60 23.0 76.1 9.6 9.0 2.96 208 Feces 100.0 Air, 0.5 200 196 60 27.9 72.0 3.9 3.8 3.33 209 Feces 99.7 Air, 0.5-1 175 158 60 26.8 73.0 1.1 1.1 3.52 210 Sim. 1000 N2, 1 250 207 20 42.5 55.1 1.5 1.4 1.94 211 Feces 100.0 N2, 1 200 159 120 26.2 73.2 0.9 0.9 3.61 212 Banana 104.9 N2, 1 250 220 60 10.2 87.5 2.2 2.0 3.33
1. Average temperature measured at steady state. 2. Includes vapor phase H2O. 3. Excludes vapor phase H2O. * Steady state not achieved. Temperature shown is maximum temperature recorded.
Figure 9 displays plots of the char fraction (top) and CO2 production (bottom) as a function of the maximum measured sample temperature. In contrast to the data provided in Table 2, here the data are provided on a dry sample basis, assuming nominal moisture contents of 50 % and 70 % for the simulant and canine feces, respectively. In addition, the plots include data from our previous work in 2013, which focused primarily on fecal simulants and explored higher processing temperatures.6-8 In general, the char yields are not greatly affected by temperatures below 300 oC. They also appear to be relatively insensitive to the sample type or the carrier gas. In the case of the canine feces, there is more scatter to the data, but this may be due to some variation in the actual moisture content of the as-received material, from run to run. On the other hand, the CO2 production is strongly temperature dependent, more is produced from torrefaction of the canine feces and, not surprisingly, strongly affected by the carrier gas. The banana sample (Run #212, not shown in Figure 9) behaved much like the feces simulant and the canine feces samples, except for the higher water content.

International Conference on Environmental Systems
13
Figure 9. Char fraction (top) and CO2 production (bottom) as a function of the maximum sample temperature during torrefaction. Both sets of data are given on a dry basis. Data plotted in red triangles are for canine feces processed in air and the red squares are for canine feces processed in nitrogen. The blue markers represent simulant data: the blue circle data are from Ref. 6, while the blue diamonds are from the current study.

International Conference on Environmental Systems
14
B. Char and Liquid Analysis Numerous samples of char and liquids derived from torrefaction of fecal simulants and canine feces were
analyzed by Huffman Hazen Laboratories, Inc., (Golden, CO) to assess the char composition and the liquid organic content. Table 3 lists the results for the solids analyses (dry basis), showing the elemental composition (C,H,N,O,S) as well as ash, volatile matter (VM) and fixed carbon (FC), along with the carrier gas and temperature data measured for each run. It also provides the starting composition for the raw fecal simulant and canine feces. In general, the compositions for all torrefied samples are quite similar and only modestly different than the starting material. The volatile matter is observed to decrease with increasing temperature and, overall, the oxygen also appears to be reduced with increasing temperature. Conversely, the percentages of carbon and nitrogen generally increase with increasing temperature. These results are consistent with our previous study using fecal simulants.6-8
Table 4 lists the results for the liquid analyses in terms of total organic carbon (TOC) and dissolved organic carbon (DOC). For all samples, particulate carbon represents about less than 4 % of the TOC. The table also shows the TOC values normalized to a moisture content of 70%, which is the nominal moisture content of the canine feces and is close to literature average values of ~75% for human feces.22 In most cases, the normalized TOC is below 1% and generally declines with decreasing temperature, which is again consistent with our previous work.6-8 Table 3. Composition of chars from various torrefaction experiments involving fecal simulant and canine feces samples. The composition is reported on a dry basis. N/A = Not applicable.
Run # Sample/Moisture (%)
Carrier, Flow (LPM)
Max. Temp. (°C)
CenterTemp. (°C)
Composition (%)
C H N O S Ash VM FC
201 Simulant 50 % N2,1 275 ‐ 57.43 7.61 1.16 18.07 0.16 15.57 66.95 17.48
202 Simulant 50 % N2,1 250 ‐ 58.24 8.05 1.14 22.96 0.07 9.53 71.73 18.74
203 Simulant 50 % N2,1 225 ‐ 56.84 7.91 1.14 18.97 0.11 15.03 70.61 14.36
‐‐‐ Simulant, Raw N/A N/A N/A 49.70 7.77 0.97 28.15 0.06 13.35 75.60 11.05
204 Feces 70% N2,1 250 226 43.81 4.86 4.08 20.44 0.43 26.38 53.58 20.04
205 Feces 70% N2,1 225 203 44.14 4.99 4.52 21.25 0.52 24.58 56.12 19.30
206 Feces 70% N2,1 200 164 41.71 5.22 4.07 25.77 0.52 22.71 60.35 16.94
207 Feces 70% Air,0.5‐1 225 223 40.49 3.88 4.09 20.27 0.51 30.76 46.38 22.86
208 Feces 70% Air,0.5 200 196 40.24 4.85 3.64 26.05 0.50 24.72 57.17 18.11
209 Feces 70% Air,0.5‐1 175 158 39.51 5.20 3.84 26.50 0.56 24.39 60.54 15.07
‐‐‐ Feces, Raw N/A N/A N/A 38.27 5.79 3.21 30.13 0.48 22.08 63.05 14.85
Table 4. Total Organic Carbon (TOC) and Dissolved Organic Carbon (DOC) of liquid products from torrefaction of fecal simulant and canine feces samples. Run # Sample/Moisture
Content(%)/Atmosphere Flow Rate (LPM)
Max. Temp. (°C)
Center Temp. (°C)
Total Org. Carbon (mg/L)
Dissolved Org. Carbon (mg/L)
Normalized1
Total Org.
Carbon (wt.%)
201 Simulant/50%/N2, 1.0 275 11,300 10,900 0.81
202 Simulant/50%/N2, 1.0 250 14,900 14,800 1.06
203 Simulant/50%/N2, 1.0 225 13,800 13,600 0.98
204 Feces/70%/ N2, 1.0 250 226 11,000 10,800 1.10
205 Feces/70%/N2, 1.0 225 203 8840 8690 0.88
206 Feces/70%/N2, 1.0 200 164 8150 7990 0.82
207 Feces/70%/Air, 0.5‐1.0 225 223 9730 9410 0.97
208 Feces/70%/Air, 0.5 200 196 6650 6540 0.66
209 Feces/70%/Air, 0.5‐1.0 175 158 8350 8120 0.83
1.Normalized to 70% moisture content.
International Conference on Environmental Systems
15
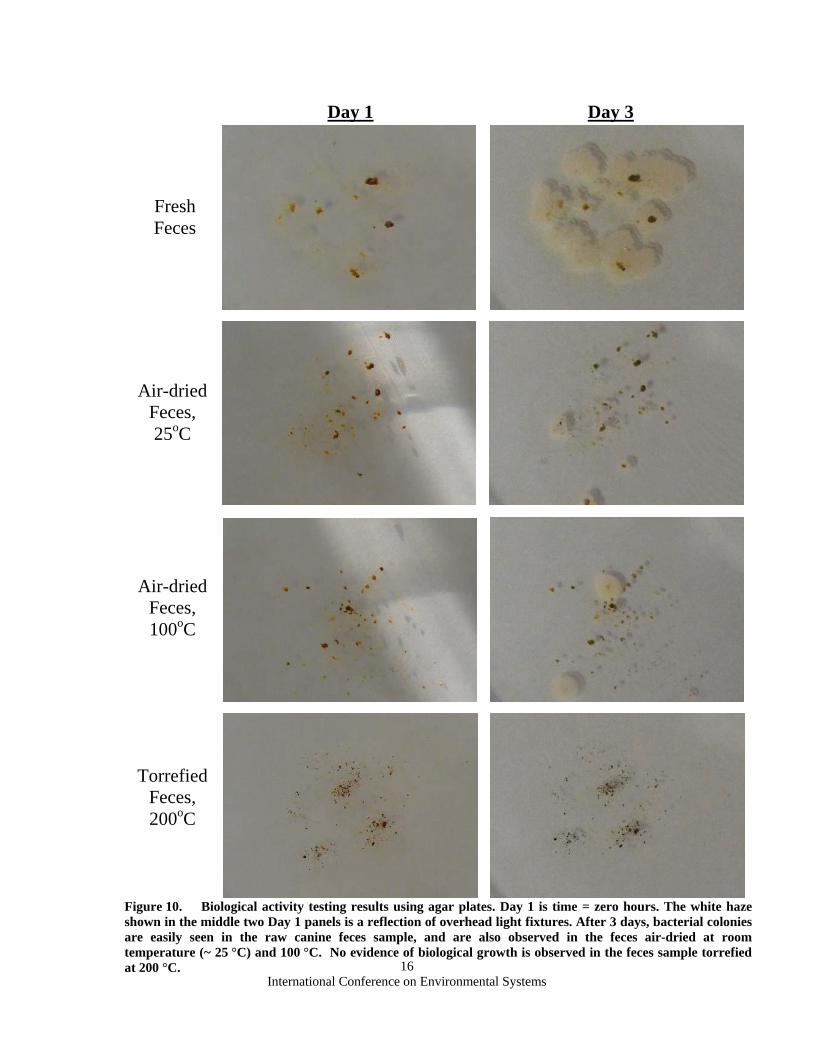
C. Biological Activity Testing and Odor Evaluation One of the expected advantages of biomass torrefaction is the elimination of biological activity. In order to
assess the biological activity of various samples in a preliminary way, agar plates were dusted with a small quantity of the torrefied powder and monitored for evidence of biological growth, such as bacterial colonies. The agar plates are commercial lysogeny broth (LB) agar plates manufactured by EZ BioResearch LLC and are designed to provide results in 1-3 days, depending on temperature (29-38 oC). For our tests, agar plates were treated with several samples of torrefied canine feces, processed at temperatures ranging from 175 – 250 oC (both nitrogen and air) as well as one sample of torrefied simulant. Three additional plates were prepared with fresh canine feces, a feces sample that was air-dried at room temperature for a period of 12 days and a feces sample air-dried for one hour on a hot plate (100 oC ± 10 oC).
Figure 10 compares photographs that were taken immediately after preparation and after incubation, for four of the canine feces samples. As shown, the fresh feces sample exhibits the most bio-activity, but both of the air-dried samples (25 and 100 oC) show signs of some sort of biological growth as well. In contrast, the torrefied sample (Run #206) appears unchanged. In similar fashion, none of the torrefied materials showed any evidence of biological activity. These data suggest that heating feces to 100 oC may be insufficient for sanitization purposes and that torrefaction at temperatures near or above 200 oC is effective for sanitization.
Three different employees at AFR participated in evaluating the odor characteristics of various canine feces samples. For all of the torrefied canine feces samples, the odor was considered negligible, if any. On the other hand, the samples processed at 100 °C or lower still emitted strong and offensive odors. D. Hydrophobicity Testing
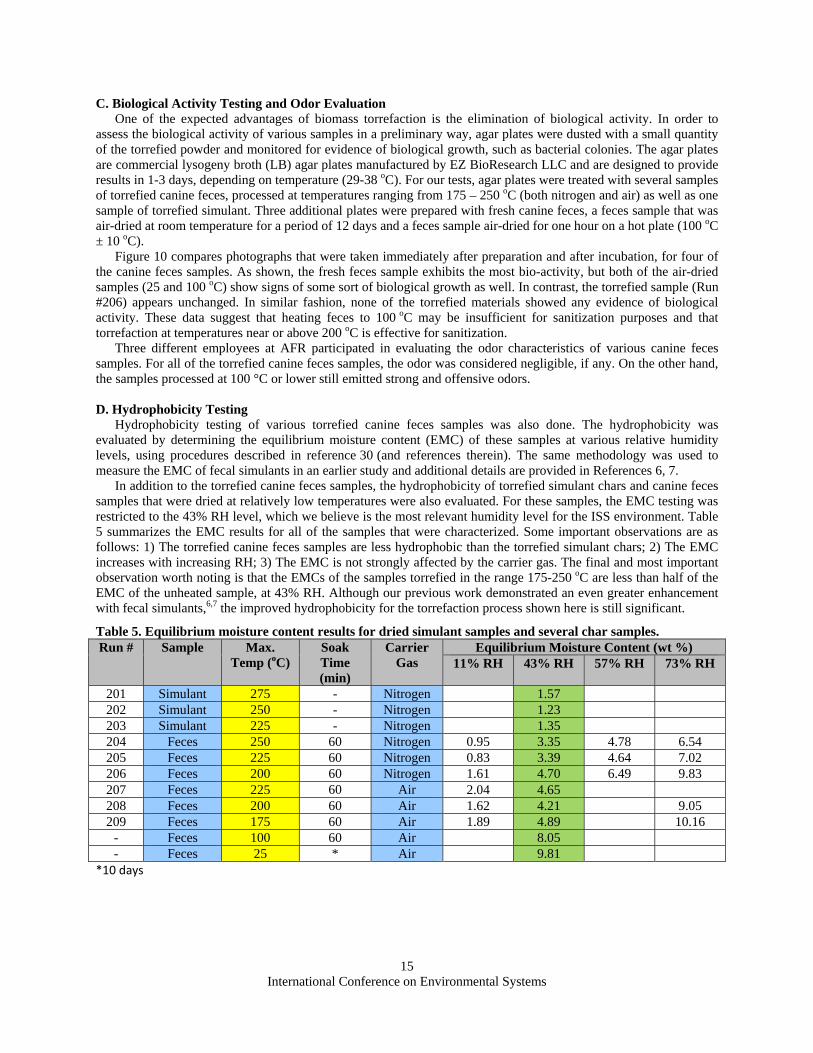
Hydrophobicity testing of various torrefied canine feces samples was also done. The hydrophobicity was evaluated by determining the equilibrium moisture content (EMC) of these samples at various relative humidity levels, using procedures described in reference 30 (and references therein). The same methodology was used to measure the EMC of fecal simulants in an earlier study and additional details are provided in References 6, 7.
In addition to the torrefied canine feces samples, the hydrophobicity of torrefied simulant chars and canine feces samples that were dried at relatively low temperatures were also evaluated. For these samples, the EMC testing was restricted to the 43% RH level, which we believe is the most relevant humidity level for the ISS environment. Table 5 summarizes the EMC results for all of the samples that were characterized. Some important observations are as follows: 1) The torrefied canine feces samples are less hydrophobic than the torrefied simulant chars; 2) The EMC increases with increasing RH; 3) The EMC is not strongly affected by the carrier gas. The final and most important observation worth noting is that the EMCs of the samples torrefied in the range 175-250 oC are less than half of the EMC of the unheated sample, at 43% RH. Although our previous work demonstrated an even greater enhancement with fecal simulants,6,7 the improved hydrophobicity for the torrefaction process shown here is still significant.
Table 5. Equilibrium moisture content results for dried simulant samples and several char samples. Run # Sample Max.
Temp (oC) Soak Time (min)
Carrier Gas
Equilibrium Moisture Content (wt %) 11% RH 43% RH 57% RH 73% RH
201 Simulant 275 - Nitrogen 1.57 202 Simulant 250 - Nitrogen 1.23 203 Simulant 225 - Nitrogen 1.35 204 Feces 250 60 Nitrogen 0.95 3.35 4.78 6.54 205 Feces 225 60 Nitrogen 0.83 3.39 4.64 7.02 206 Feces 200 60 Nitrogen 1.61 4.70 6.49 9.83 207 Feces 225 60 Air 2.04 4.65 208 Feces 200 60 Air 1.62 4.21 9.05 209 Feces 175 60 Air 1.89 4.89 10.16
- Feces 100 60 Air 8.05 - Feces 25 * Air 9.81
*10 days
International Conference on Environmental Systems
16
Fresh Feces
Air-dried Feces, 25oC
Air-dried Feces, 100oC
Torrefied Feces, 200oC
Day 1 Day 3
Figure 10. Biological activity testing results using agar plates. Day 1 is time = zero hours. The white haze shown in the middle two Day 1 panels is a reflection of overhead light fixtures. After 3 days, bacterial colonies are easily seen in the raw canine feces sample, and are also observed in the feces air-dried at room temperature (~ 25 °C) and 100 °C. No evidence of biological growth is observed in the feces sample torrefied at 200 °C.

International Conference on Environmental Systems
17
E. Fecal Bag Testing The fecal bag material currently being used in the space commode is a Gore product (MMT-341) that consists of an “expanded” PTFE (Teflon™) polymer combined with “spun-bound” polyester. The microporous structure and materials provide for a bag that is breathable (~5 micron pore size), yet retains liquids (water). It is important that the bag integrity is not severely affected by the torrefaction process for two reasons: First, in air, Teflon is considered stable up to about 360 °C29, which is considerably higher than the torrefaction temperatures that we are exploring for processing the human solid waste. However, it is important that we verify that no dangerous gaseous products, such as COF2 and HF, are generated from the bag material in our process. Second, we believe that the bag will act as a convenient trap of the torrefied char, preventing the potential escape of char particles and dust in the low-gravity space environment. Consequently, we conducted experiments to assess the effects of thermal treatment on the fecal bag material, in terms of its structure and its decomposition products.
The thermal testing was performed by heating roughly 1 gram swaths of bag material (contained in quartz tubing) in our smaller scale torrefaction reactor, and monitoring the gaseous products that were formed in an air environment (1 LPM). No evidence of COF2 or HF was observed, within the estimated detection limits for these two gases (1 ppm). Figure 11 compares photographs of a sample of the unheated bag material with samples heated to 200 °C and 275 °C, and held for periods of about one hour. At 200 °C, there is some minor discoloration, but overall the bag appears to have retained its fibrous structure. At 275 °C, the bag structure appears to have collapsed or shrunken and, upon close examination, brown globules of material are observed infused within the fibrous framework. This may be the polyester, which has melted and then re-solidified. Interestingly, in both cases, there was approximately 2.7% weight loss of the bag material after heating, which may be due to the loss of some binders, for example.
Figure 11. Photograph showing the unheated fecal bag material compared to pieces exposed to 200 °C and 275 °C. At far right is a magnified image of the piece heated to 275 °C. F. Modeling and Simulation of the Torrefaction Process
The objective of this part of the study was to perform torrefaction-product speciation and to develop a predictive tool (model) for process scale-up. Thermogravimetric (TG) analysis combined with Fourier-Transform Infrared (FTIR) spectroscopic analysis of the evolving products was used to monitor weight changes during feces-simulant torrefaction and the concurrent evolution of volatile products. These data, examples of which were shown in Figure 2, were collected at different heating rates, and were then used to determine the kinetics of each product's evolution. In this way, they provided information needed to prepare an input file for AFR's Functional-Group Biomass (FG-BioMass) pyrolysis/torrefaction model. This computational tool can now be used to predict pyrolysis behavior for any temperature profiles considered for future applications. A summary of the work performed is given below, while details are provided in a separate publication31 and its Appendices.
Unheated 200oC 275oC
International Conference on Environmental Systems
18
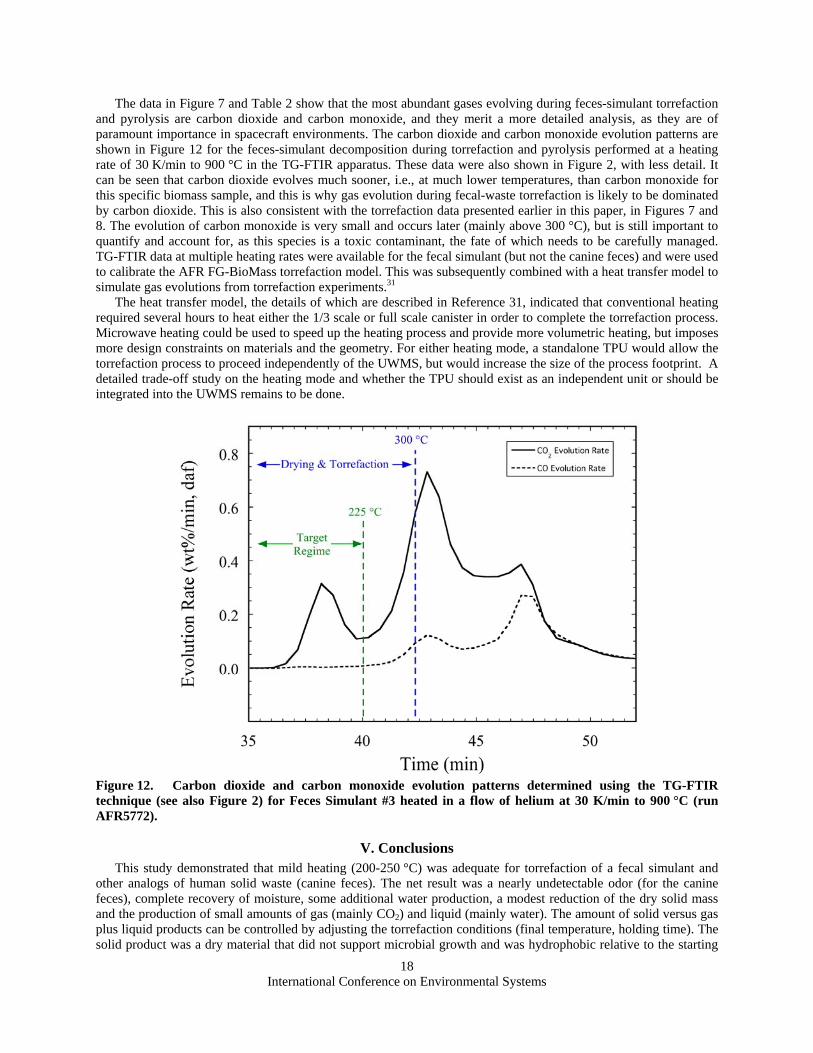
The data in Figure 7 and Table 2 show that the most abundant gases evolving during feces-simulant torrefaction and pyrolysis are carbon dioxide and carbon monoxide, and they merit a more detailed analysis, as they are of paramount importance in spacecraft environments. The carbon dioxide and carbon monoxide evolution patterns are shown in Figure 12 for the feces-simulant decomposition during torrefaction and pyrolysis performed at a heating rate of 30 K/min to 900 °C in the TG-FTIR apparatus. These data were also shown in Figure 2, with less detail. It can be seen that carbon dioxide evolves much sooner, i.e., at much lower temperatures, than carbon monoxide for this specific biomass sample, and this is why gas evolution during fecal-waste torrefaction is likely to be dominated by carbon dioxide. This is also consistent with the torrefaction data presented earlier in this paper, in Figures 7 and 8. The evolution of carbon monoxide is very small and occurs later (mainly above 300 °C), but is still important to quantify and account for, as this species is a toxic contaminant, the fate of which needs to be carefully managed. TG-FTIR data at multiple heating rates were available for the fecal simulant (but not the canine feces) and were used to calibrate the AFR FG-BioMass torrefaction model. This was subsequently combined with a heat transfer model to simulate gas evolutions from torrefaction experiments.31
The heat transfer model, the details of which are described in Reference 31, indicated that conventional heating required several hours to heat either the 1/3 scale or full scale canister in order to complete the torrefaction process. Microwave heating could be used to speed up the heating process and provide more volumetric heating, but imposes more design constraints on materials and the geometry. For either heating mode, a standalone TPU would allow the torrefaction process to proceed independently of the UWMS, but would increase the size of the process footprint. A detailed trade-off study on the heating mode and whether the TPU should exist as an independent unit or should be integrated into the UWMS remains to be done.
Figure 12. Carbon dioxide and carbon monoxide evolution patterns determined using the TG-FTIR technique (see also Figure 2) for Feces Simulant #3 heated in a flow of helium at 30 K/min to 900 °C (run AFR5772).
V. Conclusions This study demonstrated that mild heating (200-250 °C) was adequate for torrefaction of a fecal simulant and other analogs of human solid waste (canine feces). The net result was a nearly undetectable odor (for the canine feces), complete recovery of moisture, some additional water production, a modest reduction of the dry solid mass and the production of small amounts of gas (mainly CO2) and liquid (mainly water). The amount of solid versus gas plus liquid products can be controlled by adjusting the torrefaction conditions (final temperature, holding time). The solid product was a dry material that did not support microbial growth and was hydrophobic relative to the starting
International Conference on Environmental Systems
19
material. In the case of canine feces, the solid product was a mechanically friable material that could be easily compacted to a significantly smaller volume (~50%). In addition, the torrefaction method can be applied using the same or similar conditions to other types of wet solid wastes and is compatible with the Universal Waste Management System (UWMS), now under development by NASA. The best heating mode (conventional or microwave) and integration level (standalone or as part of the UWMS) remains the subject of future work. The proposed torrefaction approach will make it technically feasible to process human fecal waste and wet mixed waste streams and produce additional water and other useful products in space which will benefit long term space travel, such as an extended Lunar stay or a mission to Mars and Asteroids/Phobos. It is beneficial to NASA in also allowing for solid waste sterilization and stabilization, planetary protection, in-situ resource utilization (ISRU) and/or production of chemical feedstocks and carbon materials. In particular, the solid residue has several potential applications in space. These include production of activated carbon, a nutrient-rich substrate for plant growth, as a filler for polymers and composites, radiation shielding, carbon and hydrogen storage, and fuel gas (CH4, CO, H2) production (upon further heating). In addition to its primary purpose to process fecal waste, torrefaction could potentially be beneficial for other types of wastes, including food, waste, wipes, cotton clothing, and brine.
Acknowledgments The support of this work by the NASA-Ames Research Center under contracts NNX13PCA54P and
NNX15CJ46P is gratefully acknowledged. The authors wish to acknowledge helpful discussions with Mr. James Broyan of the NASA Johnson Space Center. Michael Serio also wishes to thank Dr. Kanapathipillai Wignarajah and Prof. Eric Suuberg of Brown University for helpful discussions.
References
1 Metcalf, J., Peterson, L, Carrasquillo, R., and Bagdigian, R., “National Aeronautics and Space Administration (NASA) Environmental Control and Life Support (ECLS) Integrated Roadmap Development,” 42nd International Conference on Environmental Systems, AIAA 2012-3444, 2012.
2 Carrasquillo, R., and Anderson, M., “Environmental Control and Life Support (ECLS) Hardware Commonality for Exploration Vehicles,” 42nd International Conference on Environmental Systems, AIAA 2012-3623, 2012.
3 Barta, D. J., Chullen, C., and Pickering, K. D., “Next Generation Life Support Project: Development of Advanced Technologies for Human Exploration Missions,” 42nd International Conference on Environmental Systems, AIAA 2012-3446, 2012.
4 Broyan, J. L, and Ewert, M. K., “Logistics Reduction and Repurposing Beyond Low Earth Orbit,” 42nd International Conference on Environmental Systems, AIAA 2012-3445, 2012.
5 Anderson, M. S., Ewert, M. K., Keener, J. F., and Wagner, S. A., “Life Support Baseline Values and Assumptions Document,” NASA/TP-2015-218570, March 2015.
6 Serio, M. A., Cosgrove, J. E., and Wójtowicz, M. A., “Torrefaction Processing of Human Fecal Waste,” Final Report under Contract No. NNX13CA54P, November 2013.
7 Serio, M. A., Cosgrove, J. E., Wójtowicz, M. A., Lee, L., Kanapathipilai, W., and Fisher, J., “Torrefaction Processing of Spacecraft Solid Waste,” 44th International Conference on Environmental Systems, ICES-2014-211, Tucson, AZ, July 13-17, 2014.
8 Serio, M. A., Cosgrove, J. E., Wójtowicz, M. A., Lee, J., Wignarajah, K., and Fisher, J., “Space Applications of Torrefaction Processing,” 45th International Conference on Environmental Systems, ICES-2015-291, Bellevue, WA, July 12-16, 2015.
9 Fisher, J. W., Hogan, J. A., Deizeit, L., Liggett, T. Wignarajah, K., Alba, R., Litwiller, E., Pace, G., and Fox, T. G., “Waste Management Technology and the Drivers for Space Missions,” 38th International Conference on Environmental Systems, SAE 2008-01-2047, San Francisco, CA, 2008.
10Pace, G. S., Delzeit, L., and Fisher, J., “Testing of a Plastic Melt Waste Compactor Designed for Human Space Exploration Missions,” 39th International Conference on Environmental Systems, SAE 2009-01-2363, 2009.
11Wignarajah, K., Alba, R., Fisher, J. W., Hogan, J. A., and Fox, T., “Investigations into Water Recovery from Solid Wastes using a Microwave Solid Waste Stabilization and Water Recovery System,” 39th International Conference on Environmental Systems, SAE 2009-01-2341, 2009.
12Fisher, J. W., Hogan, J. A., Delzeit, L., Wignarajah, K., Alba, R., Pace, G., and Fox, T. G., “Water Recovery from Wastes in Space Habitats – a Comparative Evaluation of SBIR Prototypes,” 39th International Conference on Environmental Systems, SAE 2009-01-2342, 2009.
13Stapleton, T. J., Baccus, S., and Broyan, J. L., Jr., “Development of a Universal Waste Management System,” 43rd International Conference on Environmental Systems, AIAA 2013-3400, Vail, CO, July 14-18, 2013.
14 Wannapeera, J. Fungtammasan, B., and Worasuwannarak, N., “Effects of Temperature and Holding Time During Torrefaction on the Pyrolysis Behaviors of Woody Biomass,” Journal of Analytical and Applied Pyrolysis, 92, 99-105, 2011.
International Conference on Environmental Systems
20
15Bergman, P. C. A., Boersma, A. R., Zwart, R. W. R., and Kiel, J. H. A., “Torrefaction for Biomass Co-Firing in Existing
Coal-Fired Power Stations: BIOCOAL,” ECN report No. ECN-C--05-013, 2005. 16Bergman, P. C. A., Boersma, A. R., Kiel, J. H. A., Prins, M. J., Ptasinski, K. J., and Janssen, F. J. J. G., “Torrefaction for
Entrained-Flow Gasification of Biomass,” ECN report No. ECN-C--05-067, 2005. 17Bergman, P. C. A., and Kiel, J. H. A., “Torrefaction for Biomass Upgrading,” ECN report No. ECN-RX--05-180, 2005. 18Nimlos, M. N., Brooking, E., Looker, M. J., and Evans, R. J., ACS Div. of Fuel Chem. Preprints, 48, 590-591, 2003. 19Bridgeman, T. G., Jones, J. M., Shield, I., and Williams, P. T., "Torrefaction of Reed Canary Grass, Wheat Straw and
Willow to Enhance Solid Fuel Qualities and Combustion Properties," Fuel, 87 (6), 844–856, 2008. 20Pach, M., Zanzi, R., and Bjøenbom, E., "Torrefied Biomass a Substitute for Wood and Charcoal," 6th Asia-Pacific Int.
Symp. on Comb. and Energy Utiliz., Kuala Lumpur, 2002. 21Bill and Melinda Gates Foundation, “Water, Sanitation, & Hygiene: Reinvent the Toilet Challenge,”
www.gatesfoundation.org, accessed May 9, 2016. 22 Rose, C., Parker, A., Jefferson, B., and Cartmell, E., “The Characterization of Feces and Urine: A review of the Literature
to Inform Advanced Treatment Technology,” Critical Reviews in Environmental Science and Technology, 45:17, 1827-1979 2015.
23 Serio, M., Kroo, E., Florczak, E., Wójtowicz, M., Wignarajah, K., and Fisher, J., “A Prototype Pyrolysis/Oxidation System for Solid Waste Processing,” 35th International Conference on Environmental Systems, SAE Paper No. 2005-01-3083, 2005.
24 Wignarajah, K., Litwiller, E., Fisher, J. W., and Hogan, J., “Simulated Human Feces for Testing Human Waste Processing Technologies in Space Systems,” 36th International Conference on Environmental Systems, SAE 2006-01-2180, 2006.
25 Wignarajah, K., Hogan, J. A. Fisher, J. W., and Delzeit, L., “Evaluation of the Microwave Enhanced Freeze Drying Technology for Processing Solid Wastes”, 38th International Conference on Environmental Systems, 2008-01-2051, 2008.
26 Fisher, J. W., Pisharody, S., Moran, M. J., Wignarajah, K., Shi, Y., and Chang, S.-G., “Reactive carbon from life support wastes for incinerator flue gas clean-up,” 30th International Conference on Environmental Systems, SAE 2000-01-2283, 2000.
27 www.climatefoundation.org, accessed May 9, 2016. 28 Danso-Boateng, E., Holdich, R. G., Shama, G., Wheatley, A. D., Sohail, M., and Martin, S. J., “Kinetics of faecal biomass
hydrothermal carbonization for hydrochar production,” Applied Energy, 111, 351-357, 2013. 29 Dupont™ Teflon™ AF, “Safety and Handling in Use,” Technical Document K-26987, July, 2013. 30Acharjee, T. C., Coronella, C. J. and Vasquez, V. R., “Effect of Thermal Pretreatment on Equilibrium Moisture Content of
Lignocellulosic Biomass,” Bioresource Technology, vol. 102, pp. 4849-4854, 2011. 31 Serio, M. A., Cosgrove, J. E., and Wójtowicz, M. A., “Torrefaction Processing of Human Fecal Waste,” Final Report under
Contract No. NNX15CJ46P, December 2015.