toronto transit commission / city of toronto...
TRANSCRIPT

Toronto Transit Commission / City of Toronto EGLINTON CROSSTOWN LIGHT RAIL TRANIST
TRANSIT PROJECT ASSESSMENT ENVIRONMENTAL PROJECT REPORT
APPENDIX N – TRAVEL DEMAND FORCASTING REPORT
Eglinton Crosstown LRT -Demand Forecasting Report
February 2010
Prepared by: City and TTC Demand Forecasting group
Eglinton Crosstown LRT – 2 Demand Forecasting Report
Table of Contents
1 Introduction and Purpose 2 Description of Forecasting Work 3 Land Use Assumptions 4 Transit Network Assumptions 5 Forecast Results 6 Summary List of Exhibits Exhibit 4-1: Transit City Plan Exhibit 4-2: Eglinton Crosstown LRT - Airport Alignment Options Exhibit 5-1: Eglinton Crosstown LRT AM Peak Hour Link Volumes Exhibit 5-2: Eglinton Crosstown LRT Routing Option via Renforth Exhibit 5-3: Eglinton Crosstown LRT Routing Option via Martin Grove (Highway 27) List of Tables Table 3-1 - Regional Land Use Assumptions Table 4-1: Description of Eglinton Crosstown LRT Airport Routing Options Table 5-1: 2031 Eglinton Crosstown Forecast Table 5-2: Ridership Forecast (2031) Summary List of Appendices Appendix A – Land Use along the Eglinton Crosstown LRT Corridor Exhibit A-1: Traffic Zones Surrounding the Western Eglinton Crosstown LRT Section Exhibit A-2: Traffic Zones Surrounding the Eastern Eglinton Crosstown LRT Section Exhibit A-3: Traffic Zones Surrounding Pearson International Airport Table A-1: Population and Employment in the Area Surrounding the Eglinton Crosstown LRT Table A-2: Population and Employment Surrounding Pearson International Airport Appendix B – Feeder Bus and Mississauga BRT Descriptions Exhibit B-1: Mississauga Transit Services on BRT Table B-1: Description of AM Peak Transit Network in Study Area Table B-2: Local Bus Routes on the Mississauga BRT Table B-3: GO Bus Routes on the Mississauga BRT Appendix C - Passenger Activity at Eglinton Crosstown Stops Table C-1: Don Mills & Eglinton AM Peak Hour Activity Table C-2: Eglinton Station AM Peak Hour Activity Table C-3: Eglinton West Station AM Peak Hour Activity Table C-4: Jane & Eglinton AM Peak Hour Activity Table C-5: Kennedy Station AM Peak Hour Activity Table C-6: Eglinton Crosstown LRT Underground Station Activity

Eglinton Crosstown LRT – 3 Demand Forecasting Report
Appendix D – Airport Option Link Volume Plots Exhibit D-1: Renforth Option - Eglinton Crosstown and Mississauga BRT Peak Period Link Volumes Exhibit D-2: Martin Grove Option - Eglinton Crosstown and Mississauga BRT Peak Period Link Volumes
Eglinton Crosstown LRT – 4 Demand Forecasting Report
1 INTRODUCTION AND PURPOSE
This report documents the ridership forecasts for the Eglinton Crosstown LRT. The report contains the travel demand forecasts for future Eglinton Crosstown LRT with future (2031) land use in the City of Toronto and surrounding regions. 2 DESCRIPTION OF FORECASTING WORK
The City/TTC’s current forecasting process was used to analyse the Eglinton Crosstown LRT, including two routing options for the LRT to Pearson International Airport. This process involved the following:
- updating the future (2031) land use in the study area - coding the LRT routing options in the City and TTC forecasting models - coding any changes in the feeder bus network - running the City’s GTA model to produce transit demand matrices - running the TTC’s MADITUC model using the derived transit demand matrices from
the GTA model - generating statistics and interpreting the results
The models are coded to represent the 2031 AM peak period transit network, and ridership forecasts are produced for the AM peak period for the year 2031.
3 LAND USE ASSUMPTIONS
Future year (2031) land use assumptions are from the Official Plans for the City of Toronto and surrounding regions.
Table 3-1: Regional Land Use Assumptions
Region Source 2001 POP 2001 EMP 2031 POP 2031 EMP
Toronto Official Plan 2,450,700 1,453,600 2,966,500 1,916,800
Durham Development Charges study
527,000 166,300 849,800 311,000
York York Region Official Plan (September 2004 update)
772,000 386,000 1,540,900 813,200
Peel Peel Region Official Plan (August 2003 update)
981,600 517,800 1,574,500 841,600
Halton Halton Region Official Plan (June 2003 update)
389,300 169,000 592,300 308,000
Hamilton 1999-2001 TMP 498,100 192,400 597,300 248,100
TOTAL 5,618,700 2,885,100 8,121,300 4,438,700 Note: 2031 land use figures for Durham and Halton are not available thus 2021 land use figures are shown. Future land use at the traffic zone level was used in the GTA model to generate trips originating from and destined to each zone. Population and employment land use assumptions at the traffic zone level are shown in Appendix A.
Eglinton Crosstown LRT – 5 Demand Forecasting Report
The location and magnitude of development on the airport lands were obtained from the Greater Toronto Airport Authority’s “Airport Master Plan, 2008-2030” report and supplemented with information from GTAA Planning and Development. This information assisted in estimating the extent of development within the catchment area of the LRT routing options serving Pearson International Airport. 4 TRANSIT NETWORK ASSUMPTIONS
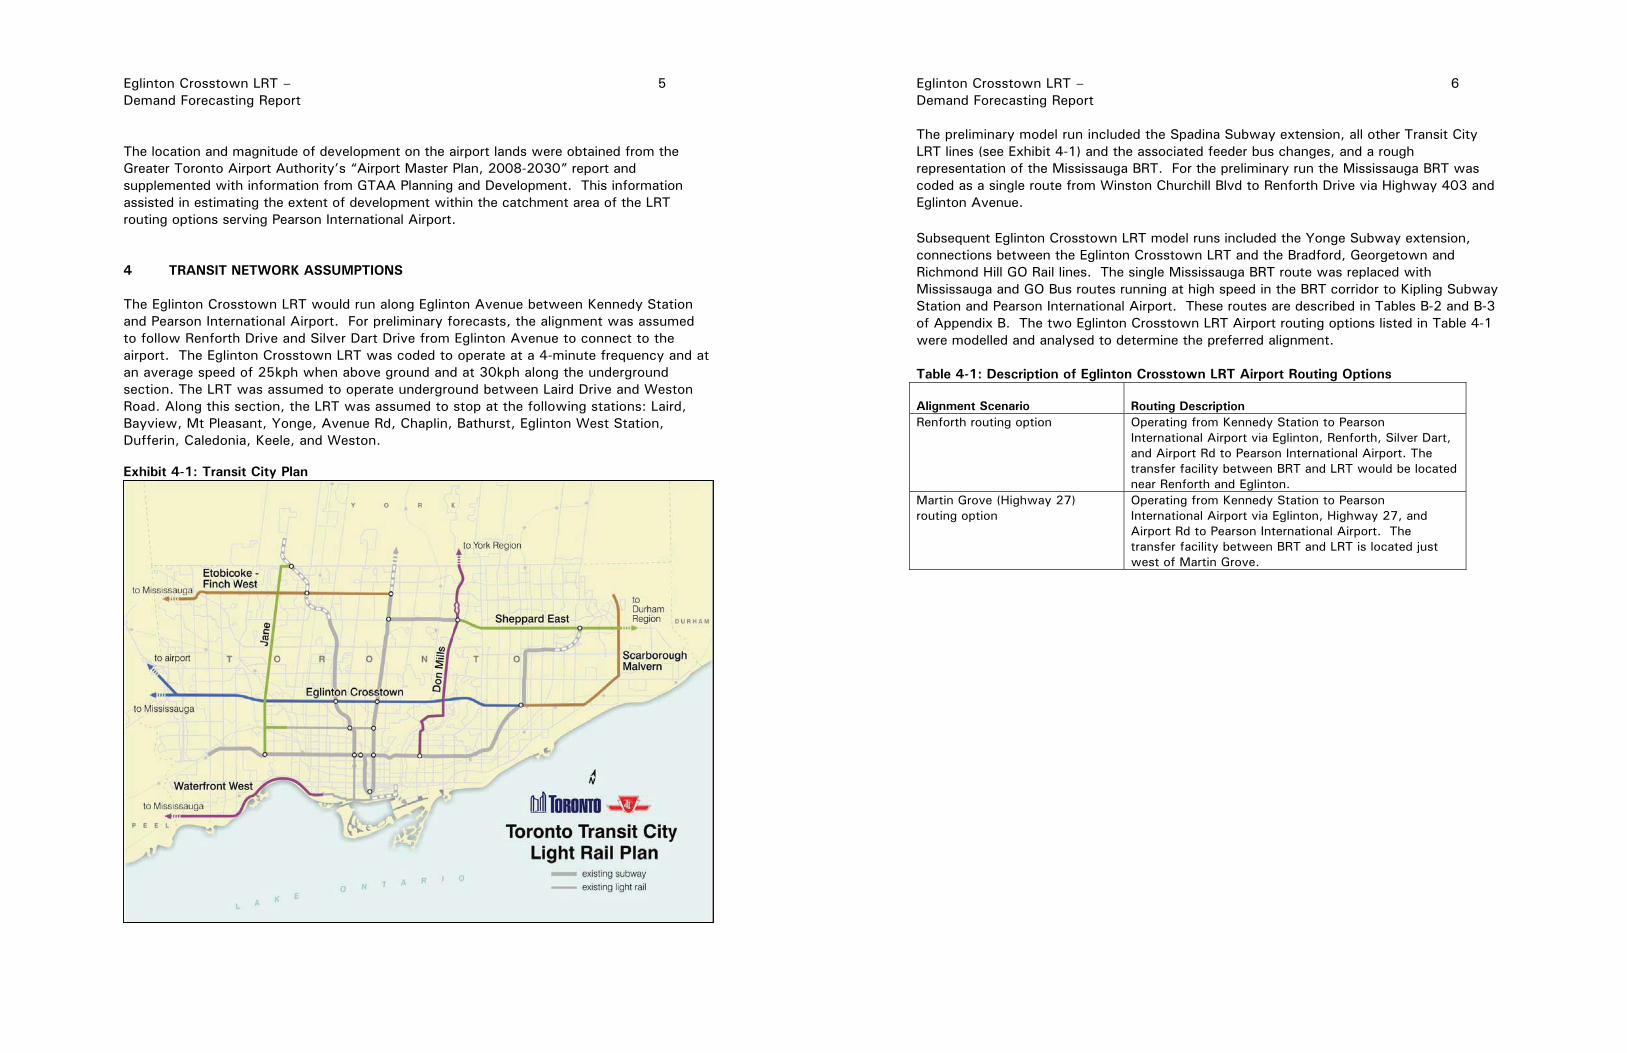
The Eglinton Crosstown LRT would run along Eglinton Avenue between Kennedy Station and Pearson International Airport. For preliminary forecasts, the alignment was assumed to follow Renforth Drive and Silver Dart Drive from Eglinton Avenue to connect to the airport. The Eglinton Crosstown LRT was coded to operate at a 4-minute frequency and at an average speed of 25kph when above ground and at 30kph along the underground section. The LRT was assumed to operate underground between Laird Drive and Weston Road. Along this section, the LRT was assumed to stop at the following stations: Laird, Bayview, Mt Pleasant, Yonge, Avenue Rd, Chaplin, Bathurst, Eglinton West Station, Dufferin, Caledonia, Keele, and Weston.
Exhibit 4-1: Transit City Plan
Eglinton Crosstown LRT – 6 Demand Forecasting Report
The preliminary model run included the Spadina Subway extension, all other Transit City LRT lines (see Exhibit 4-1) and the associated feeder bus changes, and a rough representation of the Mississauga BRT. For the preliminary run the Mississauga BRT was coded as a single route from Winston Churchill Blvd to Renforth Drive via Highway 403 and Eglinton Avenue. Subsequent Eglinton Crosstown LRT model runs included the Yonge Subway extension, connections between the Eglinton Crosstown LRT and the Bradford, Georgetown and Richmond Hill GO Rail lines. The single Mississauga BRT route was replaced with Mississauga and GO Bus routes running at high speed in the BRT corridor to Kipling Subway Station and Pearson International Airport. These routes are described in Tables B-2 and B-3 of Appendix B. The two Eglinton Crosstown LRT Airport routing options listed in Table 4-1 were modelled and analysed to determine the preferred alignment. Table 4-1: Description of Eglinton Crosstown LRT Airport Routing Options
Alignment Scenario
Routing Description
Renforth routing option
Operating from Kennedy Station to Pearson International Airport via Eglinton, Renforth, Silver Dart, and Airport Rd to Pearson International Airport. The transfer facility between BRT and LRT would be located near Renforth and Eglinton.
Martin Grove (Highway 27) routing option
Operating from Kennedy Station to Pearson International Airport via Eglinton, Highway 27, and Airport Rd to Pearson International Airport. The transfer facility between BRT and LRT is located just west of Martin Grove.

Eglinton Crosstown LRT – 7 Demand Forecasting Report
Exhibit 4-2: Eglinton Crosstown LRT - Airport Alignment Options
5 FORECAST RESULTS
5-1 Eglinton Crosstown LRT
This section presents the transit forecasts in the study area for the year 2031. Table 5-1: 2031 Eglinton Crosstown Forecast
Transit City
Route
AM Peak
Passengers per hour range
Daily
Boardings
Annual
Boardings
(millions) Notes
Eglinton Crosstown LRT
5000 to 5400 170,000 52 Does not include refinements
to airport transit trips.
The above table shows the AM peak hour volume is about 5,000 to 5400. This peak hour volume occurs eastbound just west of Eglinton West station. Exhibit 5-1 shows AM peak hour link volumes along the entire line. Daily boardings are expected to be 170,000 with an annual ridership of about 52 million.
Eglinton Crosstown LRT – 8 Demand Forecasting Report
Exhibit 5-1: Eglinton Crosstown LRT AM Peak Hour Link Volumes
Forecasts for activity at major intersections along the route were also produced especially for underground stop locations. This information helps in sizing the station platforms. These station activity tables are shown in Appendix C. 5-2 Forecast (2031) Transit Trips to/from the Airport
A refinement of the forecast transit trips to/from the airport was undertaken to reflect the detailed present and future employment and passenger activity provided by the GTAA. This analysis resulted in a 2031 forecast of about 10,000 daily transit trips made by airport employees to/from the airport. The estimated number of daily transit trips made by air travellers is about 3,000 trips to/from the airport. The majority of these transit trips to/from the airport will be on the Eglinton Crosstown LRT. The remainder will be on the 192 Airport Rocket and one of the proposed Finch West LRT routing options.
Eglinton Crosstown LRT – 9 Demand Forecasting Report
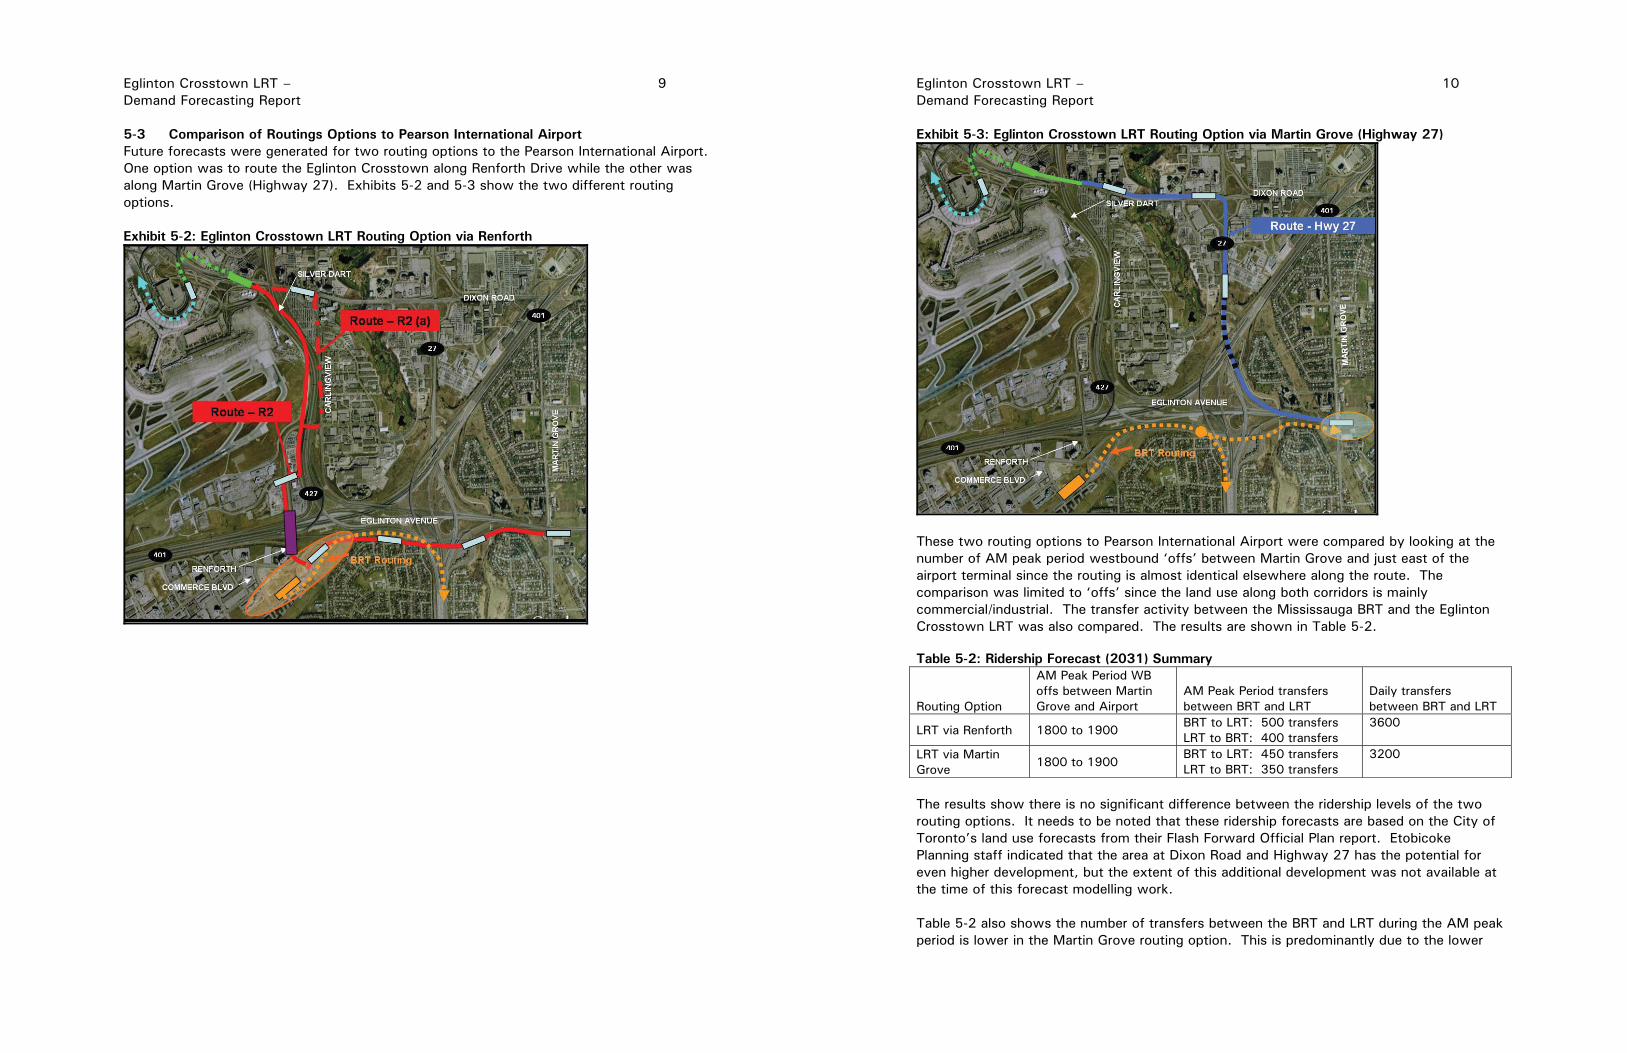
5-3 Comparison of Routings Options to Pearson International Airport Future forecasts were generated for two routing options to the Pearson International Airport. One option was to route the Eglinton Crosstown along Renforth Drive while the other was along Martin Grove (Highway 27). Exhibits 5-2 and 5-3 show the two different routing options. Exhibit 5-2: Eglinton Crosstown LRT Routing Option via Renforth
Eglinton Crosstown LRT – 10 Demand Forecasting Report
Exhibit 5-3: Eglinton Crosstown LRT Routing Option via Martin Grove (Highway 27)
These two routing options to Pearson International Airport were compared by looking at the number of AM peak period westbound ‘offs’ between Martin Grove and just east of the airport terminal since the routing is almost identical elsewhere along the route. The comparison was limited to ‘offs’ since the land use along both corridors is mainly commercial/industrial. The transfer activity between the Mississauga BRT and the Eglinton Crosstown LRT was also compared. The results are shown in Table 5-2.
Table 5-2: Ridership Forecast (2031) Summary
Routing Option
AM Peak Period WB offs between Martin Grove and Airport
AM Peak Period transfers between BRT and LRT
Daily transfers between BRT and LRT
LRT via Renforth 1800 to 1900 BRT to LRT: 500 transfers LRT to BRT: 400 transfers
3600
LRT via Martin Grove
1800 to 1900 BRT to LRT: 450 transfers LRT to BRT: 350 transfers
3200
The results show there is no significant difference between the ridership levels of the two routing options. It needs to be noted that these ridership forecasts are based on the City of Toronto’s land use forecasts from their Flash Forward Official Plan report. Etobicoke Planning staff indicated that the area at Dixon Road and Highway 27 has the potential for even higher development, but the extent of this additional development was not available at the time of this forecast modelling work. Table 5-2 also shows the number of transfers between the BRT and LRT during the AM peak period is lower in the Martin Grove routing option. This is predominantly due to the lower

Eglinton Crosstown LRT – 11 Demand Forecasting Report
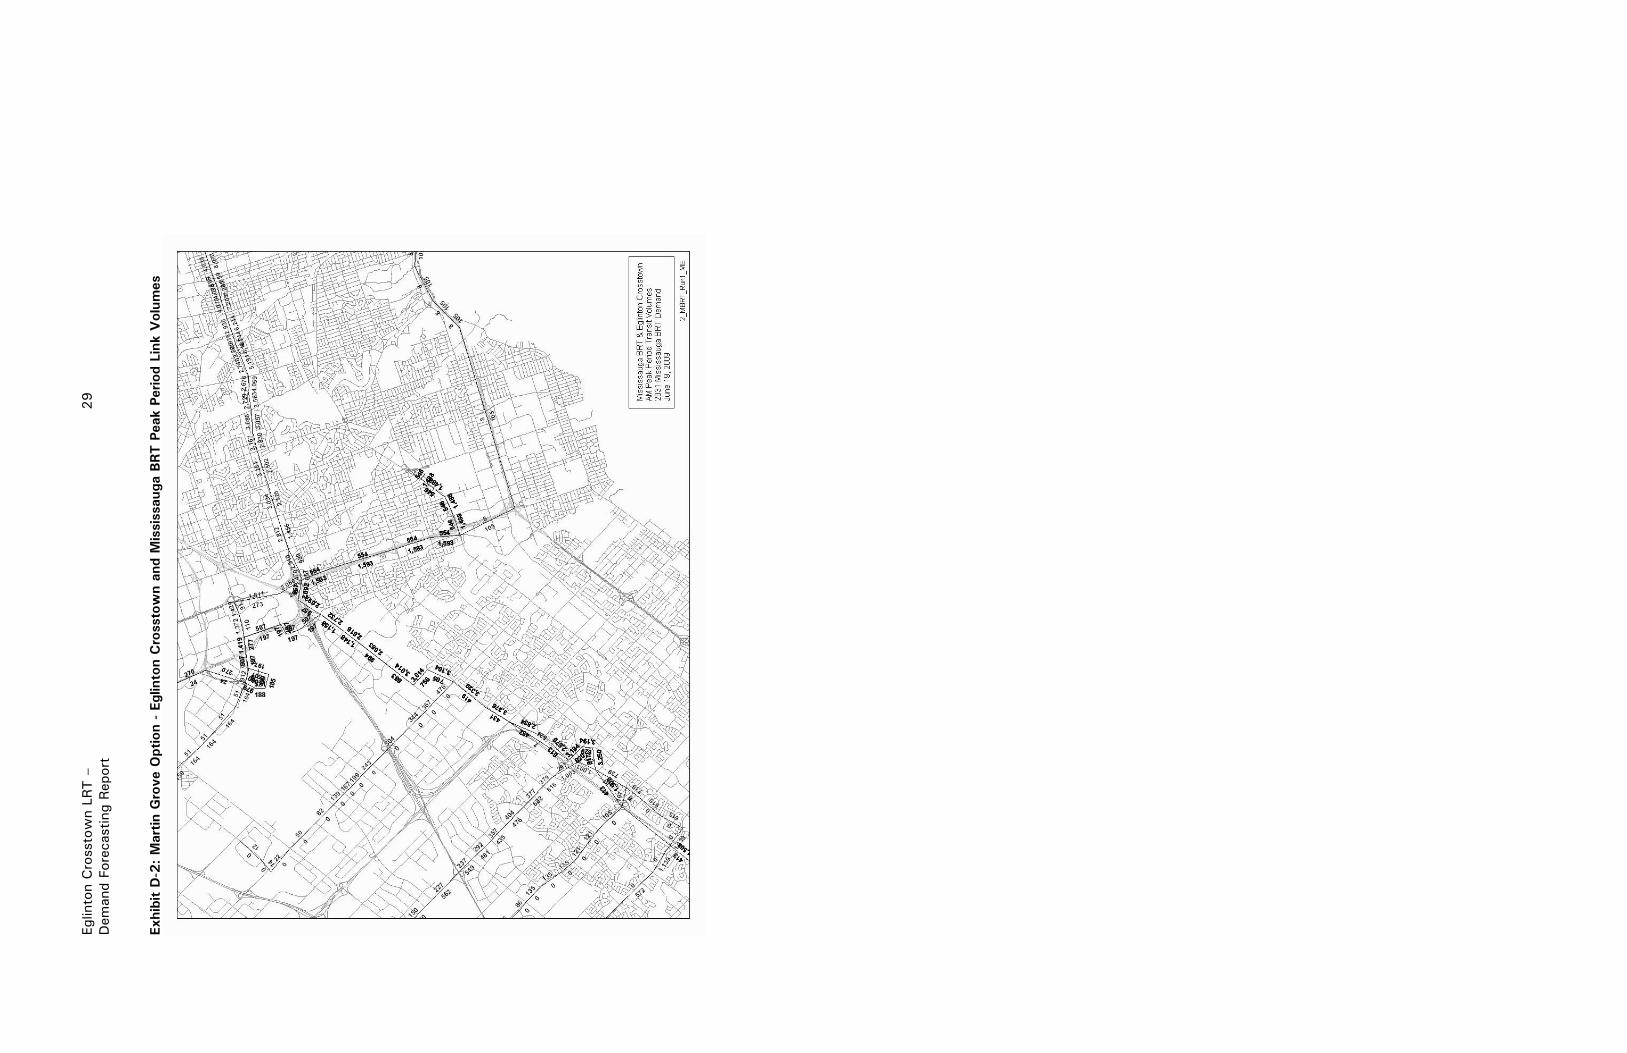
frequency of service of the Mississauga BRT routes connecting with the transfer facility just west of Martin Grove. It is important to remember, for the Martin Grove option, the services on the Mississauga BRT would be split to terminate at either the BRT-LRT transfer facility or Kipling subway station via the 427. In the Renforth option, all services on the Mississauga BRT would terminate at Kipling subway station. The ridership was adjusted using a travel time elasticity model in the Martin Grove option to account for less frequent BRT service connecting to the Eglinton Crosstown. The BRT service is less frequent in the Martin Grove option because the service has to be split into a branch to Kipling station and a branch to Martin Grove transfer facility. Stop activity for the Martin Grove option would likely increase if the land use at Dixon Road and Highway27 intensifies. The 2031 AM peak hour link volumes for the two Airport routings of the Eglinton Crosstown LRT and for the Mississauga BRT are shown in Appendix D.
Eglinton Crosstown LRT Connection with and the 191 Highway 27 Rocket
Forecasts were also produced to estimate the number of transfers between the Eglinton Crosstown LRT and the 191 Highway 27 Rocket. This is an important connection because it would enhance the north-south service in Etobicoke and create opportunities for denser development along the Highway 27 corridor. This analysis resulted in the following 2031 forecasts:
� Approximately 600 AM peak period transfers from the Eglinton Crosstown LRT to northbound on the 191 Highway 27 Rocket
� Approximately 500 AM peak period transfers from the southbound 191 Highway 27 Rocket to the Eglinton Crosstown
� The other movements have negligible number of transfers These forecasts assume the transfer location is located such that it will not cause a significant inconvenience to customers travelling through the transfer facility. At the time of writing the report, the details for this facility was not finalised. Note that these are estimates of the transfer volumes assuming this future network were in place today. In addition, the 191 Highway 27 Rocket was modelled with an average speed of about 28kph over the length of the route. This speed does not account for additional running time that would be required for the connection. Finally, this analysis only looks at possible transfers between the two routes. Further analysis would be needed to estimate the impact on the 191 Highway 27 Rocket through customers. These customers would be inconvenienced by the 191 Highway 27 Rocket diverting from Highway 27 to connect to the Eglinton Crosstown LRT. 6 SUMMARY
This report documents the ridership forecasts for the Eglinton Crosstown LRT operating between Kennedy subway station and Pearson International Airport. Location specific forecasts were also produced to assist in the designs of the stations. Finally, this forecast analysed two alignments to the airport. The forecasts indicate that routing the Eglinton Crosstown via Martin Grove is the preferred alignment.
Eglinton Crosstown LRT – 12 Demand Forecasting Report
Appendix A – Land Use along the Eglinton Crosstown LRT Corridor
Exhibit A-1: Traffic Zones Surrounding the Western Eglinton Crosstown LRT Section Exhibit A-2: Traffic Zones Surrounding the Eastern Eglinton Crosstown LRT Section Exhibit A-3: Traffic Zones Surrounding Pearson International Airport Table A-1: Population and Employment in the Area Surrounding the Eglinton Crosstown LRT Table A-2: Population and Employment Surrounding Pearson International Airport

Eglin
ton
Cro
ssto
wn
LRT –
13
Dem
and
Fore
cast
ing
Rep
ort
Exhib
it A
-1: Tra
ffic
Zones S
urr
oundin
g t
he W
este
rn E
glinto
n C
rossto
wn L
RT S
ection
Eg
linto
n C
ross
tow
n LR
T –
14
Dem
and
Fore
cast
ing
Rep
ort
Exhib
it A
-2: Tra
ffic
Zones S
urr
oundin
g t
he E
aste
rn E
glinto
n C
rossto
wn L
RT S
ection
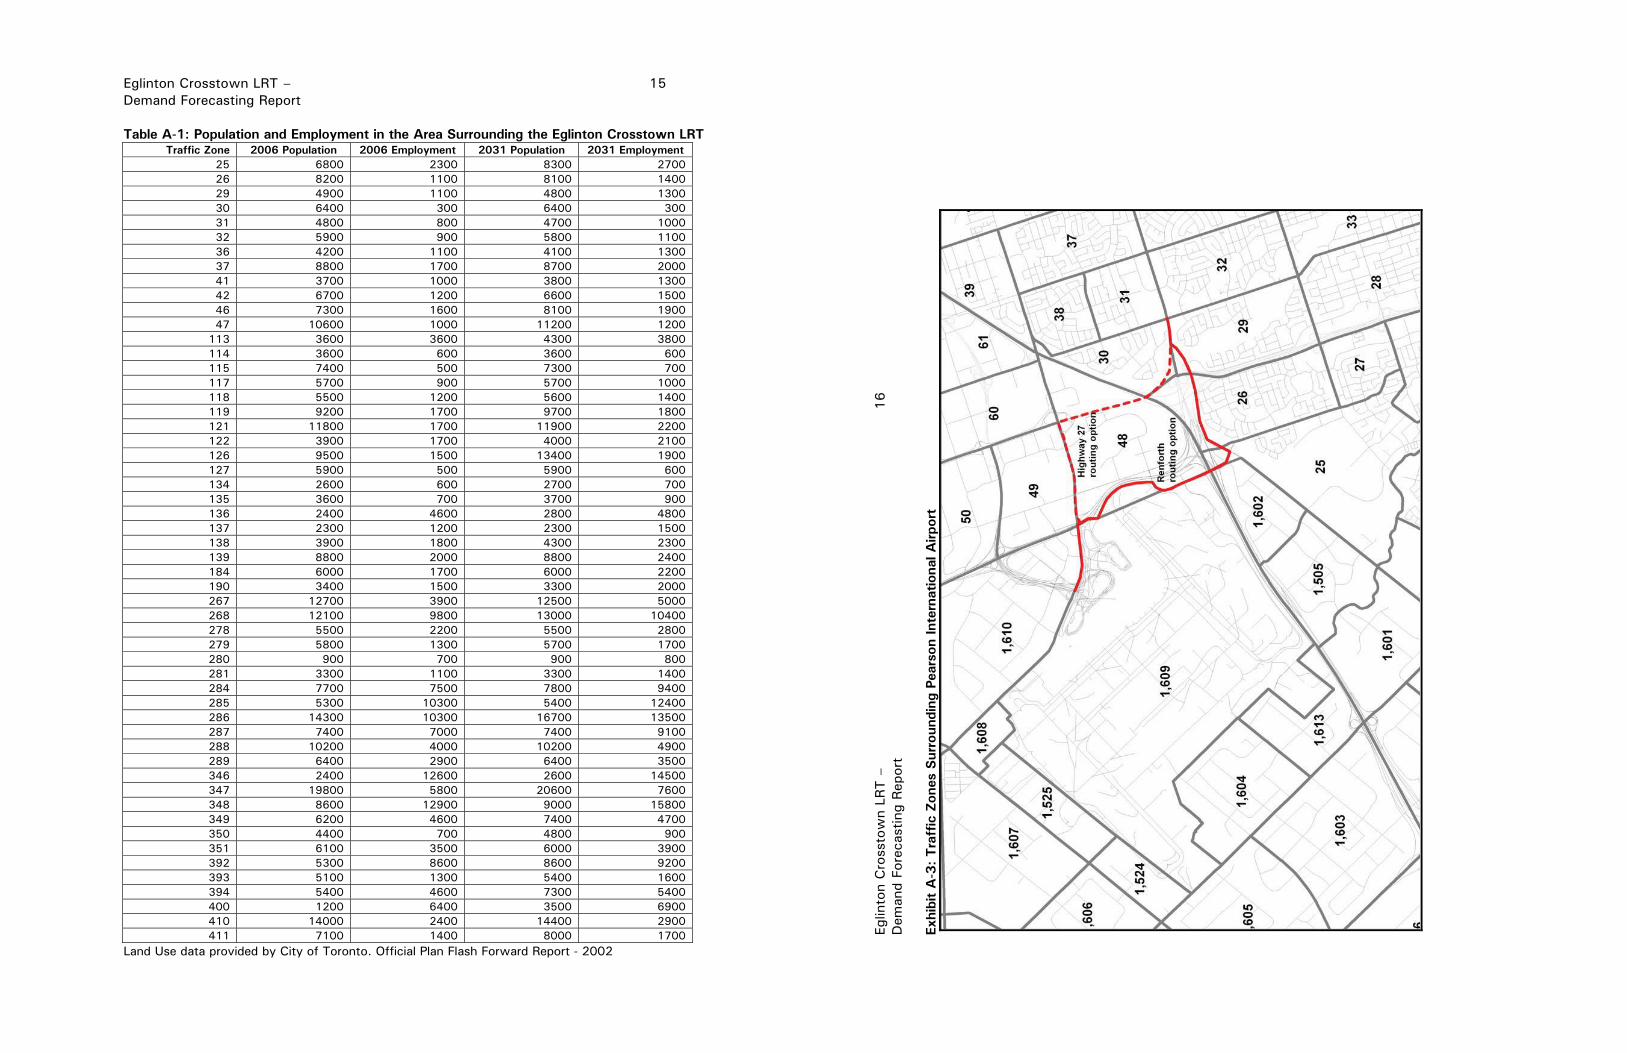
Eglinton Crosstown LRT – 15 Demand Forecasting Report
Table A-1: Population and Employment in the Area Surrounding the Eglinton Crosstown LRT Traffic Zone 2006 Population 2006 Employment 2031 Population 2031 Employment
25 6800 2300 8300 2700 26 8200 1100 8100 1400 29 4900 1100 4800 1300 30 6400 300 6400 300 31 4800 800 4700 1000 32 5900 900 5800 1100 36 4200 1100 4100 1300 37 8800 1700 8700 2000 41 3700 1000 3800 1300 42 6700 1200 6600 1500 46 7300 1600 8100 1900 47 10600 1000 11200 1200
113 3600 3600 4300 3800 114 3600 600 3600 600 115 7400 500 7300 700 117 5700 900 5700 1000 118 5500 1200 5600 1400 119 9200 1700 9700 1800 121 11800 1700 11900 2200 122 3900 1700 4000 2100 126 9500 1500 13400 1900 127 5900 500 5900 600 134 2600 600 2700 700 135 3600 700 3700 900 136 2400 4600 2800 4800 137 2300 1200 2300 1500 138 3900 1800 4300 2300 139 8800 2000 8800 2400 184 6000 1700 6000 2200 190 3400 1500 3300 2000 267 12700 3900 12500 5000 268 12100 9800 13000 10400 278 5500 2200 5500 2800 279 5800 1300 5700 1700 280 900 700 900 800 281 3300 1100 3300 1400 284 7700 7500 7800 9400 285 5300 10300 5400 12400 286 14300 10300 16700 13500 287 7400 7000 7400 9100 288 10200 4000 10200 4900 289 6400 2900 6400 3500 346 2400 12600 2600 14500 347 19800 5800 20600 7600 348 8600 12900 9000 15800 349 6200 4600 7400 4700 350 4400 700 4800 900 351 6100 3500 6000 3900 392 5300 8600 8600 9200 393 5100 1300 5400 1600 394 5400 4600 7300 5400 400 1200 6400 3500 6900 410 14000 2400 14400 2900 411 7100 1400 8000 1700
Land Use data provided by City of Toronto. Official Plan Flash Forward Report - 2002
Eglin
ton
Cro
ssto
wn
LRT –
16
Dem
and
Fore
cast
ing
Rep
ort
Exhib
it A
-3: Tra
ffic
Zones S
urr
oundin
g P
ears
on Inte
rnational A
irport
Eglinton Crosstown LRT – 17 Demand Forecasting Report
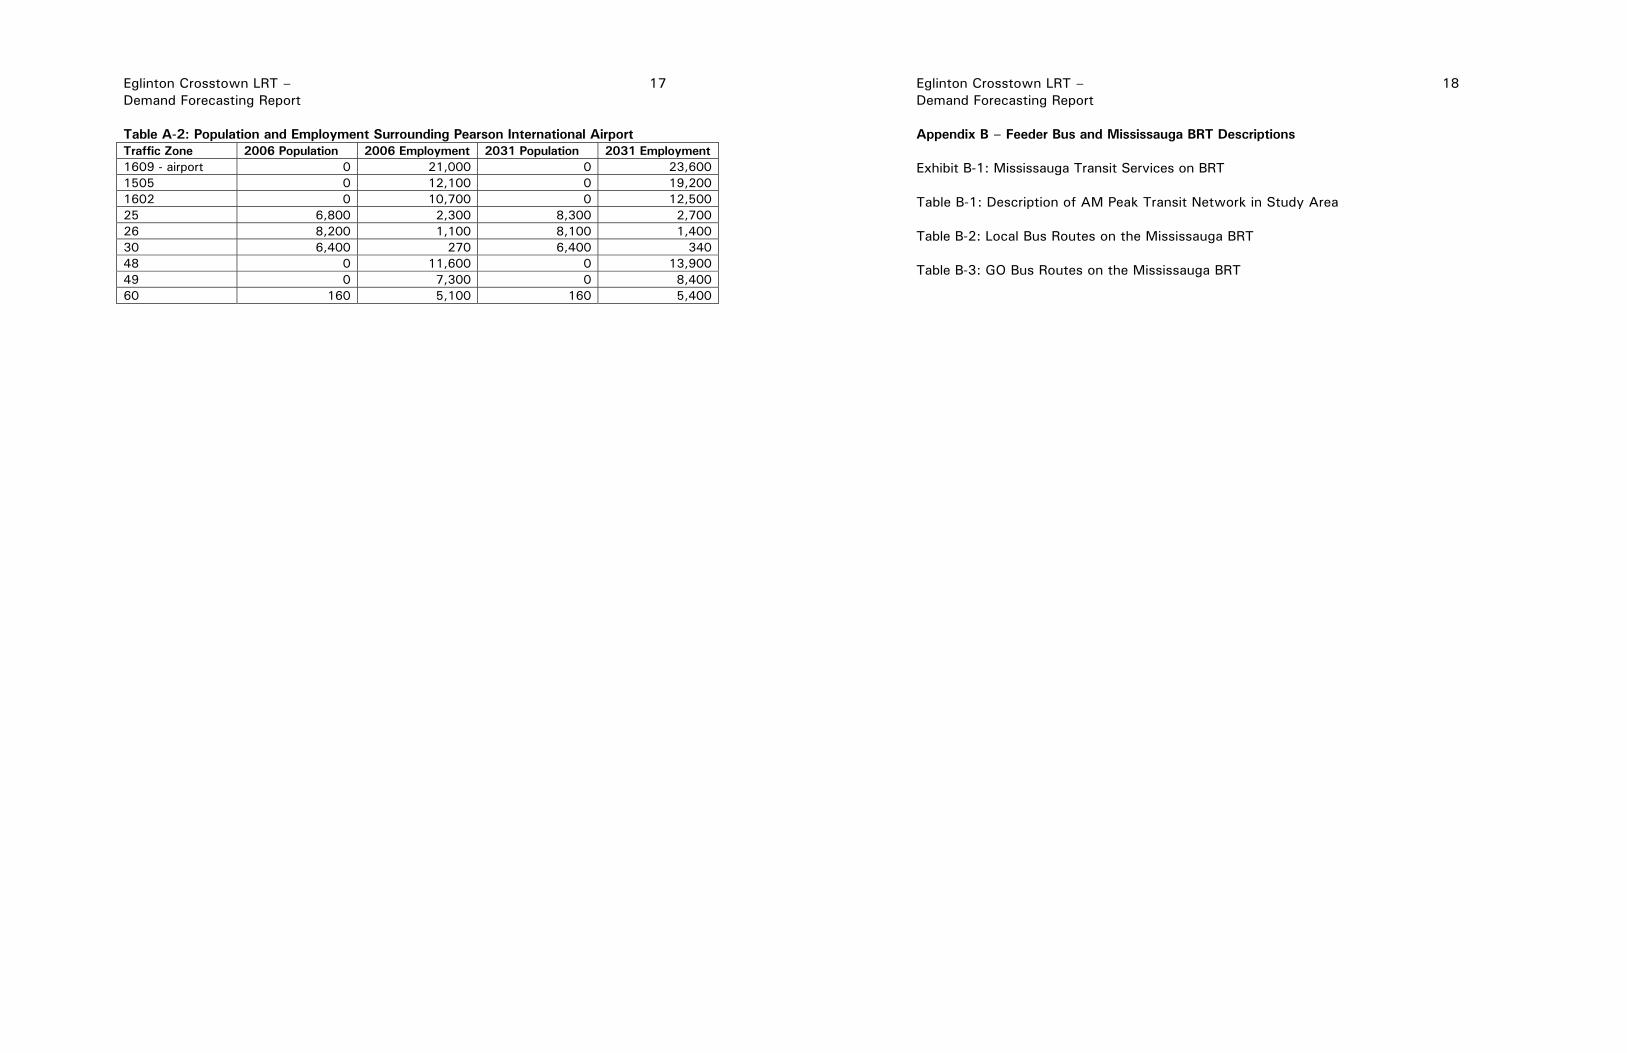
Table A-2: Population and Employment Surrounding Pearson International Airport
Traffic Zone 2006 Population 2006 Employment 2031 Population 2031 Employment
1609 - airport 0 21,000 0 23,600 1505 0 12,100 0 19,200 1602 0 10,700 0 12,500 25 6,800 2,300 8,300 2,700 26 8,200 1,100 8,100 1,400 30 6,400 270 6,400 340 48 0 11,600 0 13,900 49 0 7,300 0 8,400 60 160 5,100 160 5,400
Eglinton Crosstown LRT – 18 Demand Forecasting Report
Appendix B – Feeder Bus and Mississauga BRT Descriptions
Exhibit B-1: Mississauga Transit Services on BRT Table B-1: Description of AM Peak Transit Network in Study Area Table B-2: Local Bus Routes on the Mississauga BRT Table B-3: GO Bus Routes on the Mississauga BRT

Eglinton Crosstown LRT – 19 Demand Forecasting Report
Table B-1: Description of AM Peak TTC Transit Network in Study Area
New LRT Service Routing Description
532 Eglinton Crosstown LRT Operating from Kennedy Station to Pearson International Airport, via Eglinton
New and Modified Bus Services Routing Description 32 Eglinton West The route would be eliminated. A new Mississauga Transit
service to Renforth would replace 32A and 32B west of Renforth.
34 Eglinton East The route would be eliminated. Service east of Kennedy Station would be replaced by 586 Scarborough-Malvern LRT service.
32 Trethewey A new service would operate from Keele & Eglinton to Jane & Lawrence over existing 32C branch routing. AM peak service every 5 min.
100 Flemingdon Park (Broadview Stn-Eglinton Stn)
The branch would be shorted to operate between Broadview Station and Don Mills & Eglinton.
51 Leslie and 56 Leaside The routes would be combined, and would operate from Donlands Station to Steeles, both ways via Donlands, Leaside Bridge, Millwood, Laird, Eglinton, Leslie. AM peak service every 10 min.
54 Lawrence East The route would be shortened to operate to Don Mills & Eglinton only, via Lawrence and Don Mills.
5 Avenue Rd and 61 Avenue Rd North
The routes would be combined, and would operate from Queens Park to Highway 401 via Queen’s Park and Avenue Rd. AM peak service every 7 min 30 s.
Mississauga BRT A new service would operate from Winston Churchill via Highway 403, Eastgate and Eglinton to Renforth. The route would operate every 7 min 30 s at 30 kph. See Table B-2 and Exhibit B-1 for descriptions of services operating on the Mississauga BRT.
Table B-2: Local Bus Routes on the Mississauga BRT
ROUTE Description Direction Mean
Headway Mean Speed
EB/NB 10.0 45.8 100 BRT Mainline (local) - Winston Churchill Blvd to Kipling WB/SB 9.0 46.5
EB/NB 9.0 35.8 109 Meadowvale Town Centre to Kipling - via Erin Mills Parkway / Busway (local) WB/SB 8.6 34.9
EB/NB 6.7 34.7 110 Clarkson GO to Malton Westwood - via UTM / Busway (local) / Airport WB/SB 9.0 33.0
EB/NB 7.5 38.9 202 Shoppers’ World to Kipling - via Hurontario / CCTT / Busway (limited) WB/SB 10.0 39.9
EB/NB 10.0 33.6 205 Kipling to Drew St - via Busway (limited) / Dixie Road
WB/SB 7.5 33.7 209 Meadowvale Town Centre to Kipling - via Creditview Road / Busway (limited)
WB/SB 7.5 42.5 219 Meadowvale Town Centre to Kipling - via W Churchill Blvd / Busway (limited)
EB/NB 16.4 38.5 261 Kipling to Meadowvale Town Centre - via Busway (limited) / Mavis / Financial Ctr
From the City of Mississauga’s Opening Day BRT Operating Plan Concept report Eglin
ton
Cro
ssto
wn
LRT –
20
Dem
and
Fore
cast
ing
Rep
ort
Exhib
it B
-1: M
issis
sauga T
ransit S
erv
ices o
n B
RT
Fr
om t
he C
ity o
f M
issi
ssau
ga’s
Ope
ning
Day
BRT O
pera
ting
Plan
Con
cept
rep
ort

Eglinton Crosstown LRT – 21 Demand Forecasting Report
Table B-3: GO Bus Routes on the Mississauga BRT
ROUTE Description Direction Mean
Headway Mean Speed
EB/NB 45.0 50.3 G403 RT 1A
Streetsville GO Station to Union GO Bus Terminal WB/SB 45.0 50.5
EB/NB 25.7 52.3 G403 RT 1B
Guelph GO Station to York University
WB/SB 45.0 52.2
EB/NB 45.0 50.0 G403 RT 1C
Guelph GO Station to Kipling Station
WB/SB 60.0 50.0
EB/NB 22.5 50.3 G403 RT 1D
Mississauga City Centre Transit Terminal to Langstaff GO Station WB/SB 22.5 50.2
EB/NB 20.0 50.0 G403 RT 1E
Hamilton GO Centre to Kipling Station
WB/SB 45.0 50.0
EB/NB 12.0 47.3 G403 RT 1F
Oakville GO Station to Langstaff GO Station
WB/SB 30.0 47.1
EB/NB 12.0 50.0 G403 RT 1G
Oakville GO Station to Kipling Station
WB/SB 30.0 50.0
EB/NB 10.0 42.9 G403 RT 1H
Mississauga City Centre Transit Terminal to York University
WB/SB 22.5 43.3 G6519 Oakville-Finch
EB/NB 22.5 43.3
EB/NB 90.0 51.0 G6519 Oakville-York Mills
From the City of Mississauga’s 2014 Operating Statistics
Eglinton Crosstown LRT – 22 Demand Forecasting Report
Appendix C - Passenger Activity at Eglinton Crosstown Stops
Table C-1: Don Mills & Eglinton AM Peak Hour Activity Table C-2: Eglinton Station AM Peak Hour Activity Table C-3: Eglinton West Station AM Peak Hour Activity Table C-4: Jane & Eglinton AM Peak Hour Activity Table C-5: Kennedy Station AM Peak Hour Activity Table C-6: Eglinton Crosstown LRT Underground Station Activity

Eglinton Crosstown LRT – 23 Demand Forecasting Report
Eglinton Crosstown LRT Transfers at Key Locations
The tables below show 2031 AM peak hour transfer activity at key locations along the Eglinton Crosstown LRT. The tables were prepared for the station and surface platform designers. Table C-1: Don Mills & Eglinton AM Peak Hour Activity
Route2 Dir2 Sum of Transfers 54 100 525 532 Route1 Dir1 NB NB NB SB EB WB
Walk Outs
Grand Total
54 SB 0 0 0 0 0 90 40 130 100 SB 0 0 80 10 0 0 10 100 525 NB 0 0 0 0 50 260 180 490
SB 0 10 0 0 90 320 180 600 532 EB 30 0 300 130 0 0 300 760
WB 0 0 210 110 0 0 270 590 Walk Ins 10 10 0 30 20 110 0 180 Grand Total 40 20 590 280 160 780 980 2850
54 Lawrence East 100 Flemington 525 Don Mills LRT 532 Eglinton Crosstown LRT
Table C-2: Eglinton Station AM Peak Hour Activity
Route2 Dir2 Sum of Transfers 5 61 103 532 1 Route1 Dir1 WB WB EB EB WB NB SB
Walk Outs
Grand Total
5 EB 0 0 0 0 0 30 0 20 50 61 EB 0 0 0 0 0 30 220 30 280
103 WB 0 0 0 0 0 30 130 20 180 532 EB 0 0 0 0 0 600 1050 910 2560
WB 0 0 0 0 0 480 1160 840 2480 1 NB 0 0 40 780 430 0 0 2380 3630
SB 0 0 10 380 480 0 0 1500 2370 Walk Ins 0 10 0 180 130 270 1300 0 1890
Grand Total 0 10 50 1340 1040 1440 3860 5700 13440
5 Avenue Rd 61 Avenue Rd North 103 Mt Pleasant North 532 Eglinton Crosstown LRT 1 Yonge-University-Spadina Subway
Eglinton Crosstown LRT – 24 Demand Forecasting Report
Table C-3: Eglinton West Station AM Peak Hour Activity
Route2 Dir2 Sum of Transfers 63 532 1 Route1 Dir1 WB EB WB NB SB
Walk Outs
Grand Total
63 EB 0 90 10 80 120 10 310 109 EB 0 0 0 0 0 0 0 532 EB 0 0 0 310 1680 90 2080
WB 10 0 0 470 640 120 1240 1 NB 0 350 410 0 0 150 910
SB 0 500 150 0 0 50 700 Walk
Ins 10 240 100 140 630 0 1120 Grand Total 20 1180 670 1000 3070 420 6360
63 Ossington 109 Ranee 532 Eglinton Crosstown LRT 1 Yonge-University-Spadina Subway
Table C-4: Jane & Eglinton AM Peak Hour Activity
Route2 Dir2 Sum of Transfers 532 535 Route1 Dir1 EB WB NB SB
Walk Outs
Grand Total
532 EB 0 0 70 50 10 130 WB 0 0 140 100 20 260
535 NB 240 90 0 0 10 340 SB 430 130 0 0 10 570 Walk Ins 110 0 20 20 0 150 Grand Total 780 220 230 170 50 1450
532 Eglinton Crosstown LRT 535 Jane LRT

Eglinton Crosstown LRT – 25 Demand Forecasting Report
Table C-5: Kennedy Station AM Peak Hour Activity
Route2 Dir2 Sum of Transfers 12 20 21 43 57 113 532 586 2 3 GO Rail Route1 Dir1 EB EB EB WB EB WB WB EB WB NB NB SB
Walk Outs
Grand Total
12 WB 0 0 0 0 0 0 20 0 40 30 0 0 10 100 20 WB 0 0 0 0 0 0 80 0 60 30 0 0 10 180 21 WB 0 0 0 0 0 0 30 0 90 0 0 0 0 120 43 EB 0 0 0 0 0 0 0 20 170 0 0 0 10 200 57 WB 0 0 0 0 0 10 70 0 200 0 0 0 10 290
113 EB 0 0 0 0 0 0 0 0 10 20 0 0 0 30 532 EB 20 10 0 0 20 0 0 220 160 190 0 20 90 730 586 WB 0 0 0 10 0 0 1230 0 2850 300 10 10 80 4490
2 EB 0 0 0 20 10 0 130 260 0 1470 10 0 110 2010 3 SB 60 30 0 0 0 0 740 90 9400 0 10 10 120 10460
GO Rail SB 0 0 0 0 0 0 110 0 180 10 0 0 40 340 Walk Ins 0 10 0 10 40 0 230 90 2510 180 0 250 0 3320
Grand Total 80 50 0 40 70 10 2640 680 15670 2230 30 290 480 22270
12 Kingston Rd 20 Cliffside 21 Brimley 43 Kennedy 57 Midland 113 Danforth 532 Eglinton LRT 586 Scarborough-Malvern LRT 2 Bloor-Danforth Subway 3 Scarborough RT
Eglinton Crosstown LRT – 26 Demand Forecasting Report
Boardings, Alightings and Link Volumes on the Eglinton Crosstown LRT
The following section contains 2031 AM peak hour forecast boardings, alightings and link volumes on the Eglinton Crosstown LRT. The information was used for traffic simulations and station design.
Table C-6: Eglinton Crosstown LRT Underground Station Activity 2031 AM Peak Hour
Westbound Peak Hour
Stop Ons Offs Link Volume
LAIRD 400 100 4600
BAYVIEW 450 550 4500
MT PLEASANT 550 400 4650
EGLINTON STN 1100 2600 3150
AVENUE RD 150 550 2800
CHAPLIN 100 350 2550
BATHURST 450 350 2600
EGLINTON W STN 750 1050 2250
DUFFERIN 500 500 2250
CALEDONIA 100 150 2200
BRADFORD GO 150 100 2250
KEELE 150 750 1650
GEORGETOWN GO 0 50 1600
WESTON 100 150 1550
Eastbound Peak Hour
Stop Ons Offs Link Volume
WESTON 550 50 3400
GO RAIL 100 0 3500
KEELE 800 250 4000
BRADFORD GO 400 50 4400
CALEDONIA 200 50 4500
DUFFERIN 900 400 5050
EGLINTON W STN 1100 1850 4300
BATHURST 600 350 4500
CHAPLIN 200 200 4500
AVENUE RD 250 250 4500
EGLINTON STN 1400 2700 3200
MT PLEASANT 100 1100 2200
BAYVIEW 150 500 1850
LAIRD 50 150 1750
The Link Volume is the number of passengers leaving the station on the Eglinton Crosstown LRT.

Eglinton Crosstown LRT – 27 Demand Forecasting Report
Appendix D – Airport Option Link Volume Plots Exhibit D-1: Renforth Option - Eglinton Crosstown and Mississauga BRT Peak Period Link Volumes Exhibit D-2: Martin Grove Option - Eglinton Crosstown and Mississauga BRT Peak Period Link Volumes
Eglin
ton
Cro
ssto
wn
LRT –
28
Dem
and
Fore
cast
ing
Rep
ort
Exhib
it D
-1:
Renfo
rth O
ption -
Eglinto
n C
rossto
wn a
nd M
issis
sauga B
RT P
eak P
eriod L
ink V
olu
mes
Eglin
ton
Cro
ssto
wn
LRT –
29
Dem
and
Fore
cast
ing
Rep
ort
Exhib
it D
-2:
Mart
in G
rove O
ption -
Eglinto
n C
rossto
wn a
nd M
issis
sauga B
RT P
eak P
eriod L
ink V
olu
mes