topics
DESCRIPTION
Improving Customer Service at BTU Through Benchmarking APPA National Conference Anaheim, California - June 20, 2005. Topics. Business Process Customer Service Goals Measuring Goals Using Benchmarking Sample Benchmarking for BTU What Did They Tell Us Changes We Have Made Going Forward. - PowerPoint PPT PresentationTRANSCRIPT

Improving Customer Service at BTU Through Benchmarking
APPA National Conference Anaheim, California - June 20, 2005

Topics
Business Process
Customer Service Goals
Measuring Goals
Using Benchmarking
Sample Benchmarking for BTU
What Did They Tell Us
Changes We Have Made
Going Forward
Business Process
Set Goals
Measure Progress
Compare to Goals

Customer Service Goals
Customer Satisfaction
Timeliness on answering calls
Cost Control
Process
Reduce Inaccurate Bills
Meter Reading Accuracy
Reduce Write-Offs

Measurement of Customer Service Goals
Some are Straight Forward – Cost
Some are Rather Subjective – Satisfaction
Comparisons With Others is Time Consuming

Benchmarking Does All The Measurement
Compares Costs with Other Utilities
Shows Policies Which Affect Costs
Gives Statistical Data – Ex. Time of Calls
Best Practices

Key Benchmarks
Overall Scorecard
Meter Readings
Billing
Credit & Collections
Field Service
Call Center
Payment Services
Internet
CIS

© PA Consulting Group 2004 CS Results - 8
Overall Scorecard
COST Median 1st Q N= Median 1st Q* Customer Service Exp Per Adj Customer $42.65 $30.12 23 $46.03 $36.67* Customer Service Exp (Ex Sppt Proc) Per Adj Customer $36.66 $27.22 23 $40.80 $32.73* Customer Service Exp (Excluding Uncollectibles) Per Adj Customer $36.24 $28.45 23 $46.03 $32.91* Customer Service Exp (Ex Uncoll & Sppt Proc) Per Adj Customer $31.78 $24.08 23 $33.09 $27.12
Total Call Ctr Exp Per Adj Customer $7.55 $3.80 24 $8.30 $6.20Total Meter Reading Exp Per Adj Customers $6.90 $5.70 22 $7.48 $5.06Total Field Service Exp Per Adj Customers $5.24 $2.39 16 $4.75 $2.76Total Billing Exp Per Adj Customers $7.42 $6.04 21 $5.66 $4.66Payment Processing Exp Per Adj Customers $2.58 $1.18 21 $0.94 $0.66Total Credit Exp (Including Uncollectibles) Per Adj Customer $8.29 $4.93 19 $9.88 $6.87Uncollectible Exp Per Adj Customer $3.85 $2.33 22 $7.19 $3.95CS Support Exp Per Adj Customers $2.35 $1.59 9 $1.11 $0.36
SERVICE LEVELS% of Calls Answered by CSRs Within 30 Seconds 80.0% 85.0% 18 74.0% 79.4%% of Calls Abandoned Including Major Events 5.50% 4.08% 21 3.85% 3.00%Overall Meter Reading Inaccuracy 0.150% 0.085% 19 0.078% 0.025%Missed Manual Meter Reads 0.680% 0.200% 16 1.110% 0.296%AMR Missed Meter Reads 0.460% 0.148% 9 0.590% 0.140%Bill Inaccuracy-% Bills Adj. After Mailing To Customer 0.66% 0.06% 19 0.37% 0.20%
SAFETY* Lost Time Incident Rate - All CS 0.00 0.00 14 1.00 0.43* OSHA Recordable Incident Rate - All CS 1.00 0.00 16 3.33 2.52* Vehicular Accident Rate per 1,000,000 Miles - All CS 0.00 0.00 13 4.63 1.45
* These measures are included in your total score and in your process score
APPA CS IOUCS

© PA Consulting Group 2004 CS Results - 9
Staffing Levels and Outsourcing
Company Only FTEs per 100,000 Adjusted Customers
Report Page #64 (1000309) Calc: E.1/((SUM{A.2}+SUM{A.3}+SUM{A.4}+(SUM{A.5}+SUM{A.6}+SUM{A.7})*2+SUM{A.8}*3)/100000)

© PA Consulting Group 2004 CS Results - 10
Meter Activity Scorecard
COST Median 1st Q N=Median 1st Q* Total Meter Reading Exp Per Adj Customers $6.90 $5.70 22 $7.48 $5.06* Total Meter Reading Exp Per Total Meter Reads $0.56 $0.47 22 $0.67 $0.44
(Manual, R/SC AMR-Billing Read, & Interval)SERVICE LEVELS* Estimated R/SC Reads As a % of R/SC Reads 0.027% 0.000% 23 1.018% 0.075%* Overall Meter Reading Inaccuracy 0.150% 0.085% 19 0.078% 0.025%* Manual Meter Reading Inaccuracy 0.167% 0.078% 18 0.080% 0.023%* Missed Manual Meter Reads 0.680% 0.200% 16 1.110% 0.296%
AMR Reading Inaccuracy 0.100% 0.067% 8 0.010% 0.003%* AMR Missed Meter Reads 0.460% 0.148% 9 0.590% 0.140%* R/SC AMR Meters % of Total Meters 1.001% 12.174% 25 0.861% 42.366%SAFETY* Lost Time Incident Rate Meter Reading 0.00 0.00 13 1.37 1.00* OSHA Recordable Incident Rate Meter Reading 0.50 0.00 14 9.04 7.15* Vehicular Accident Rate per 1,000,000 Miles-Meter Reading 0.00 0.00 13 8.71 0.44
* These measures are included in your total score and in your process scoreR/SC = Residential/Small Commercial; C/I = Commercial/Industrial
APPA CS IOUCS

© PA Consulting Group 2004 CS Results - 11
Total Meter Reading Expense (Including Pensions & Benefits)Per Adjusted Customers
Page #172.1 (1000081) Source: B.3/(A.2+A.3+A.4+(A.5+A.6+A.7)*2+A.8*3)I.9.2
Mean Quartile 1 Quartile 2 Quartile 3
$8.54 $6.35 $7.00 $10.58
Mean Quartile 1 Quartile 2 Quartile 3
$8.54 $6.35 $7.00 $10.58
© PA Consulting Group 2004 CS Results - 12
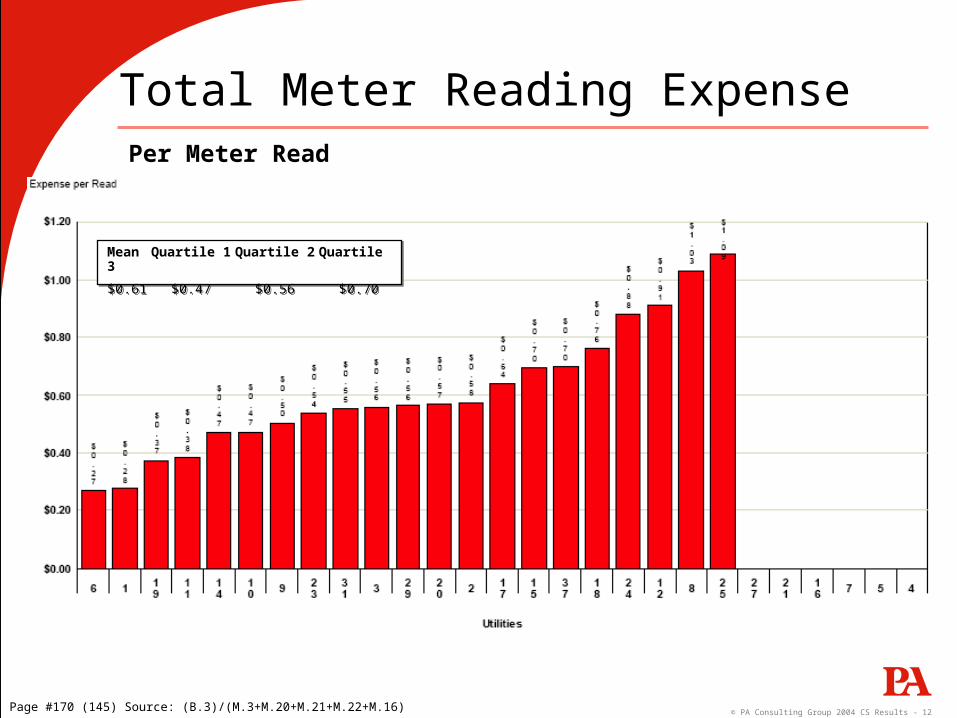
Total Meter Reading ExpensePer Meter Read
Page #170 (145) Source: (B.3)/(M.3+M.20+M.21+M.22+M.16)
Mean Quartile 1 Quartile 2 Quartile 3
$0.61 $0.47 $0.56 $0.70
Mean Quartile 1 Quartile 2 Quartile 3
$0.61 $0.47 $0.56 $0.70

© PA Consulting Group 2004 CS Results - 13
Meter Density — Electric
Meters per Square Mile of Service Territory
Page #180 (174) Source: (M.2.1+M.17)/(A.15.1)
Mean Quartile 1 Quartile 2 Quartile 3
831.19 1,041.03 576.39 352.22
Mean Quartile 1 Quartile 2 Quartile 3
831.19 1,041.03 576.39 352.22

© PA Consulting Group 2004 CS Results - 14
Total Billing ExpensePer Bill Issued
Mean Quartile 1 Quartile 2 Quartile 3
$1.03 $0.73 $0.98 $1.16
Mean Quartile 1 Quartile 2 Quartile 3
$1.03 $0.73 $0.98 $1.16
Page #256 (198) Source: B.7/O.1

© PA Consulting Group 2004 CS Results - 15
Uncollectibles per RevenueThe difference in performance between companies is substantial, and not entirely explained by gas vs electric, or other characteristics of the companies.
Mean Quartile 1 Quartile 2 Quartile 30.31% 0.08% 0.17% 0.41%Mean Quartile 1 Quartile 2 Quartile 30.31% 0.08% 0.17% 0.41%
Mean Quartile 1 Quartile 2 Quartile 30.35% 0.18% 0.30% 0.45%Mean Quartile 1 Quartile 2 Quartile 30.35% 0.18% 0.30% 0.45%
WaterElectric
Page #323 (80551) Source: B.17.1/A.12
Page #325 (50230) Source: B.17.3/A.14

© PA Consulting Group 2004 CS Results - 16
Cost Optimization Framework - Credit & Collections
AnnualCost
Collection Activity (e.g. 24 hour notices/yr)
C = Cost of Collection
A = Cost of Write-offs
D= A + B+ C = Total Credit Cost
Current Level of Activity
Minimum Cost
• There is a trade-off between the cost of collection and the value of reduced write-offs and interest on DSO
• The cost of collection plus the cost of write-off and interest on DSO equals “total credit cost"
• The "total credit cost" is "U" shaped -- meaning there is a minimum cost point
• There is a trade-off between the cost of collection and the value of reduced write-offs and interest on DSO
• The cost of collection plus the cost of write-off and interest on DSO equals “total credit cost"
• The "total credit cost" is "U" shaped -- meaning there is a minimum cost point
$40M
$20M
$10M$11M
B = Interest on DSO
2M1.8M
3M 4M1.0M
Note: Not to Scale

© PA Consulting Group 2004 CS Results - 17
Field Service Orders per Customer
Page #233 (8043) Source: N.1/(A.2+A.3+A.4+A.5+A.6+A.7+A.8)
Mean Quartile 1 Quartile 2 Quartile 3
0.76 0.35 0.53 0.84
Mean Quartile 1 Quartile 2 Quartile 3
0.76 0.35 0.53 0.84

© PA Consulting Group 2004 CS Results - 18
Percent of Calls Answered by Call Center Representatives Within 30 Seconds
Page #120 (7446) Source: I.3.1+I.3.2
Mean Quartile 1 Quartile 2 Quartile 3
71.6% 85.0% 80.0% 58.0%
Mean Quartile 1 Quartile 2 Quartile 3
71.6% 85.0% 80.0% 58.0%

© PA Consulting Group 2004 CS Results - 19
Website Transactions Completed On Your Site
Page #52 (91831) Source: D.1
Payment and View Bill make up the greatest percentages of completed web transactionsPayment and View Bill make up the greatest percentages of completed web transactions
© PA Consulting Group 2004 CS Results - 20
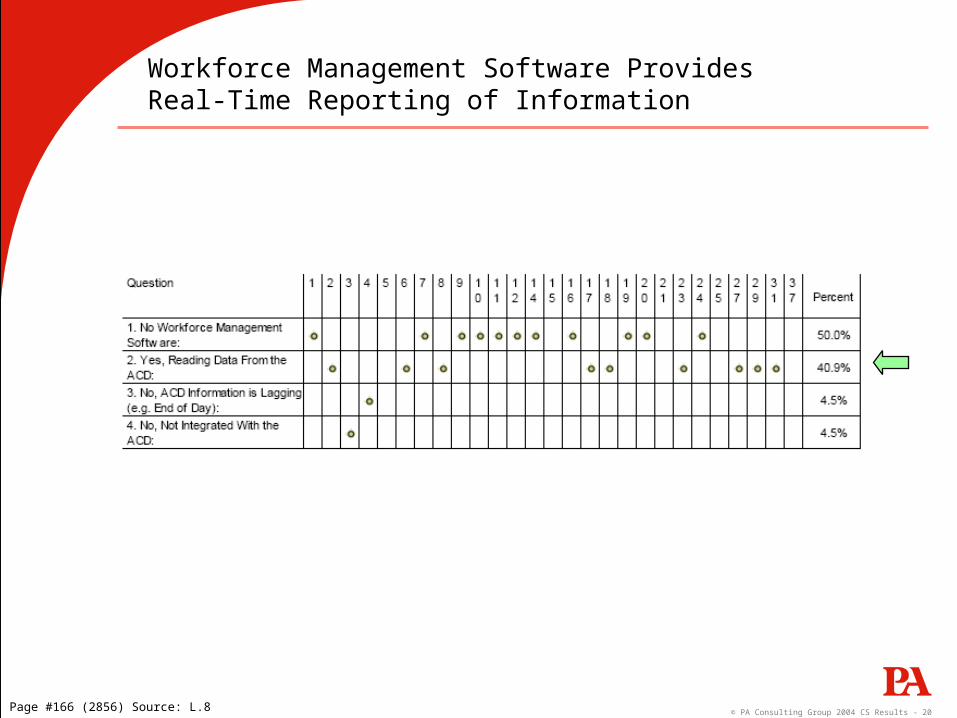
Workforce Management Software Provides Real-Time Reporting of Information
Page #166 (2856) Source: L.8

© PA Consulting Group 2004 CS Results - 21
Customer Payment Methods
Methods of Receiving Payments
Page #286 (315) Source: P.2
More than 30% of payments are collected outside of the mail system
© PA Consulting Group 2004 CS Results - 22
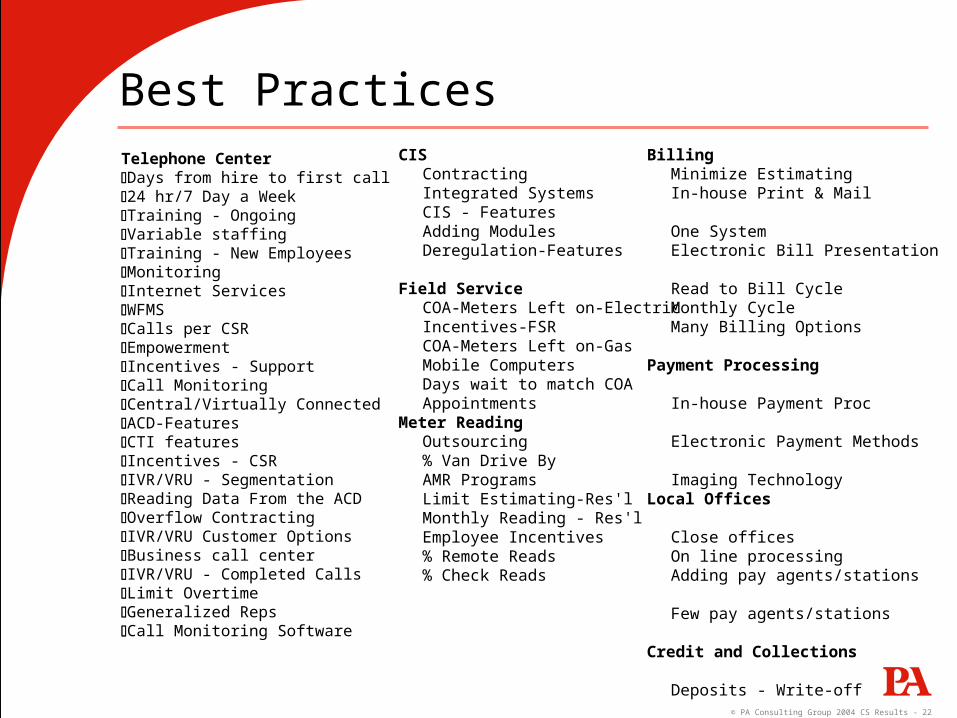
Best PracticesTelephone Center Days from hire to first call24 hr/7 Day a WeekTraining - OngoingVariable staffingTraining - New EmployeesMonitoringInternet ServicesWFMSCalls per CSREmpowermentIncentives - SupportCall MonitoringCentral/Virtually ConnectedACD-FeaturesCTI featuresIncentives - CSRIVR/VRU - SegmentationReading Data From the ACDOverflow ContractingIVR/VRU Customer OptionsBusiness call centerIVR/VRU - Completed CallsLimit OvertimeGeneralized RepsCall Monitoring Software
CISContractingIntegrated SystemsCIS - FeaturesAdding ModulesDeregulation-Features
Field ServiceCOA-Meters Left on-ElectricIncentives-FSRCOA-Meters Left on-GasMobile ComputersDays wait to match COAAppointments
Meter ReadingOutsourcing% Van Drive ByAMR ProgramsLimit Estimating-Res'lMonthly Reading - Res'lEmployee Incentives% Remote Reads% Check Reads
BillingMinimize EstimatingIn-house Print & MailOne SystemElectronic Bill PresentationRead to Bill CycleMonthly CycleMany Billing Options
Payment Processing
In-house Payment ProcElectronic Payment Methods
Imaging TechnologyLocal Offices
Close officesOn line processingAdding pay agents/stations
Few pay agents/stationsCredit and Collections
Deposits - Write-offDisconnect RateOffer payment agreementsNo Field CollectionsDeposits - InitiationOutbound callingTimely disconnectionLate Payment FeesCredit ScoringFollow disconnect policy

What Did They Tell BTU ?
Ring,RING, RING
Our Overall Costs are Low
We Do Not Use Technology as Much as Others
Answering of Calls Needs Improvement

What Changes Have We Made ?
Replacing our Phone SystemIVR Completed CallsChange Call Center Process
Replace CIS SystemCreated Formalized Call Center TrainingOutsource Some Field Work During Peak PeriodsUse More Days for Read and LeaveConsidering Eliminating Field CollectionsLook at AMR for Hard to ReadTrack Payment Process Better

How Do We Plan To Go Forward ?