top-down or bottom-up forecasting? peter … · review of the top-down and bottom-up approaches and...
TRANSCRIPT
versão impressa ISSN 0101-7438 / versão online ISSN 1678-5142
Pesquisa Operacional, v.27, n.3, p.591-605, Setembro a Dezembro de 2007 591
TOP-DOWN OR BOTTOM-UP FORECASTING?
Peter Wanke* Centre for Logistics Studies The COPPEAD Graduate School of Business Federal University of Rio de Janeiro (UFRJ) Rio de Janeiro – RJ [email protected] Eduardo Saliby The COPPEAD Graduate School of Business Federal University of Rio de Janeiro (UFRJ) Rio de Janeiro – RJ [email protected]
* Corresponding author / autor para quem as correspondências devem ser encaminhadas
Recebido em 02/2007; aceito em 09/2007 Received February 2007; accepted September 2007
Abstract The operations literature continues on inconclusive as to the most appropriate sales forecasting approach (Top-Down or Bottom-up) for the determination of safety inventory levels. This paper presents the analytical results for the variance of the sales forecasting errors during the lead-time in both approaches. The forecasting method used was the Simple Exponential Smoothing and the results led to the identification of two supplementary impacts upon the forecasting error variance, and consequently, upon safety inventory levels: the Portfolio Effect and the Anchoring Effect. The first depends upon the correlation coefficient of demand between two individual items and the latter, depends upon the smoothing constant and upon the participation of the individual item in total sales. It is also analysed under which conditions these variables would favour one forecasting approach instead of the other. Keywords: forecasting approach; exponential smoothing; safety inventory levels.
Resumo A literatura de operações permanece sem concluir sobre a abordagem mais adequada de previsão de vendas (Top-Down ou Bottom-Up) para o dimensionamento de estoques de segurança. Nesse manuscrito são apresentados os resultados analíticos para a variância dos erros de previsão no tempo de resposta com amortecimento exponencial nessas duas abordagens. Os resultados apontam dois impactos complementares na variância do erro de previsão, e conseqüentemente, nos níveis de estoque de segurança: Efeito Portifólio e Efeito Ancoragem. O primeiro depende do coeficiente de correlação da demanda entre os produtos e o segundo, da constante de amortecimento e da participação das vendas do produto nas vendas totais. É analisado sob quais condições essas variáveis favoreceriam uma abordagem de previsão em detrimento da outra. Palavras-chave: abordagem de previsão; amortecimento exponencial; níveis de estoque de segurança.
Wanke & Saliby – Top-down or bottom-up forecasting?
592 Pesquisa Operacional, v.27, n.3, p.591-605, Setembro a Dezembro de 2007
1. Introduction
The objective of this paper is to analyse the behaviour of the variance of the sales forecasting error under the Top-Down and Bottom-Up approaches in order to identify under which conditions one approach would be preferred instead of the other in terms of lower safety inventory levels.
In previous studies, analyses were carried out using the Simple Exponential Smoothing method on actual sales data (see for example Kahn, 1998 and Lapide, 1998). They led to different conclusions about the adequacy of these approaches for different levels of the correlation coefficient, the sales variance and the share of a given product in total or aggregate sales. In this research, the expressions for the variance of the forecasting errors during the lead-time, assumed to be discrete, were analytically demonstrated and the two main effects that may favour the Top-Down approach to the detriment of the Bottom-Up were identified: the Portfolio Effect and the Anchoring Effect. Differently from previous researches, it was considered that sales forecasts were frozen (had the same value) during the lead-time.
The results indicate that a product with small participation in total sales and negatively correlated with the aggregate sales of the remaining products (or individual items) tends to present lower forecasting error variance under the Top-Down approach due to the compensation of part of its variance with the aggregate variance of the remaining items. Even when dealing with higher participation in total sales and correlation coefficient, the Top-Down approach may present better results than Bottom-Up if the product sales variance is sufficiently greater than the variance of the aggregate sales of the remaining products, given that a less than proportional portion of the total variance is added to the product variance.
The remainder of the paper is structured as follows: sections 2 and 3 are dedicated to the review of the Top-Down and Bottom-Up approaches and to the Simple Exponential Smoothing concepts, respectively. In section 4, the expressions for the variance of the sales forecasting errors during the lead-time are analytically demonstrated for these two approaches and the impacts of the forecasting errors on safety inventories are discussed. Readers should recall that sales forecasts were considered to be frozen during the lead-time. Finally, in section 5, the adequacy of those approaches to different classes of products or items is argued.
2. Top-Down and Bottom-Up Approaches
There exists great consensus amongst authors about the conceptualisation and operationalisation of the Top-Down (TD) and Bottom-Up (BU) sales forecasting approaches. For example, according to Lapide (1998), under the TD approach, sales forecasting is done first by aggregating all individual items, and then by disaggregating these aggregate data into individual items again, generally based on the historical percentage of the item within the total group. In this sense, Schwarzkopf et al. (1988) point out that in the TD approach is primarily forecasted the aggregate total and the subsequent disaggregation is done based on the historical proportions of each individual item. As regards the BU approach, each one of the individual items is forecasted separately and then all the forecasts are summed up in case an aggregate forecast for the group is deemed necessary (Lapide, 1998). In other words, under the BU approach, the forecaster prepares first the forecasts for each individual item, aggregating them thereafter under the interest level of the analysis (Jain, 1995).
Wanke & Saliby – Top-down or bottom-up forecasting?
Pesquisa Operacional, v.27, n.3, p.591-605, Setembro a Dezembro de 2007 593
Several authors have tried to relate the adequacy of the TD and BU approaches for different characteristics of the sales historical data such as, for example: the correlation coefficient between the sales of the individual item being studied and the aggregate sales of the remaining items ( ρ ), the share or proportion of the item being studied in the aggregate total sales ( f ), and the ratio between the sales variance of the individual item being studied and
the aggregate sales of the remaining items ( 2k ). An implicit premise in some of the researched papers is related to the Portfolio Effect, a concept initially defined by Zinn et al. (1989) to evaluate the inventory centralization impact upon the total sales variance.
According to the Portfolio Effect, inventory centralization minimizes the total variance whenever the correlation coefficient of sales between the markets is – 1 and the ratio between the sales variance of markets is 1. Generally speaking, the rationale behind the variance reduction, according to the authors, is the compensation of the sales fluctuations between two markets: when the sales from one market go up, the sales for the other market go down by the same amount.
One example of that is Kahn’s (1998) paper, according to which in the TD approach, the peaks and valleys inherent to each item are cancelled off by the aggregation. The negative correlation among the individual items would reduce the aggregate sales variance. Also corroborating the main conclusions of the Portfolio Effect, Schwarzkopf et al. (1988) point out that estimates based on aggregate data are more precise than those based on individual forecasts when the individual items present independent sales patterns (null correlation).
However, Lapide (1998) suggests that, as a rule of thumb, the TD approach makes sense if and only if all the individual items sales are growing, decreasing or remaining stable, thus characterizing a positive correlation amongst the sales of different items. The author continues on ascertaining that a family of products frequently comprises items that potentially cannibalise each other, as in the case of a family with new and old products. For those items, the sales pattern is very different, given that some items increase to detriment of the others (negative correlation), which would render the BU approach preferable.
Gordon et al. (1998) and Gelly (1999) discourse on the adequacy of the TD and BU approaches for other characteristics of the sales historical data. More specifically, these authors studied more than 15,000 aggregate and disaggregate historical data series generating forecasts with Triple Exponential Smoothing. The BU approach yielded more precise forecasts in 75% of the series, and a greater accuracy was verified within individual items with strong positive correlation and whenever they represented a large proportion of the aggregate total sales. On the other hand, when the data were negatively correlated, the TD approach showed itself more accurate regardless of the item’s participation in the aggregate total sales.
Finally, in the case study presented by Gelly (1999), the TD approach revealed itself to be more adequate for individual items that present more a predictable sales pattern throughout time, as for example, with a small sales coefficient of variation ( CV ). That small CV could result from a large participation of the individual item in the aggregate total sales. It could also result from a small ratio between the sales variance of the individual item and the variance of the aggregate sales of the remaining items. The characteristics that favour the TD and BU approaches are summarized in Table 1.

Wanke & Saliby – Top-down or bottom-up forecasting?
594 Pesquisa Operacional, v.27, n.3, p.591-605, Setembro a Dezembro de 2007
Table 1 – Characteristics that favour the TD and BU approaches.
Author Top-Down Bottom-Up
Kahn (1998) Negative correlation ( ρ )
Lapide (1998) Positive correlation Negative correlation
Gelly (1999)
Small coefficient of variation ( CV )
High participation in total sales ( f )
Low ratio between the sales variance of the individual item and the aggregate sales variance of the
remaining items ( k )
Gordon et al. (1998) Negative correlation
Any participation in total sales
Positive correlation
High participation in total sales
Schwarzkopf et al. (1988) Null correlation
3. Simple Exponential Smoothing
According to Gijbels et al. (1999), the Simple Exponential Smoothing (SES) is the most commonly used model in sales forecasting. Its main advantages are related to the fact that it is a non-parametric model based on a simple algebraic formula that quickly enables the updating of the local level estimation of the sales data.
In the last twenty years, some researches were carried out to better comprehend and describe the SES and its extensions from a statistical perspective. For example, Chatfield et al. (2001) compare a variety of potential Exponential Smoothing models derived from autoregressive moving averages, structural models and non-linear dynamical spaces and conclude why the SES and its extensions are robust even despite changes in the variance of the historical data. Blackburn et al. (1995) show that the SES may introduce spurious autocorrelations in series that the trend component may have been removed and that these autocorrelations would depend upon the average age of the data and of the smoothing constant value. Finally, Gijbels et al. (1999) compare the SES with the Kernel Regression enabling a better understanding of the equivalence and best adequacy between both approaches.
The SES and its extensions were developed in the late 1950s by Brown, Winters, and Holt, amongst other authors (Chatfield et al., 2001). Among its main premises and limitations, it is worth highlighting that in the SES, eventual growth or decrease trends, seasonal fluctuations and cyclical variations are not considered. For example, the sales forecast for a random variable X with SES is as follows:
1 1(1 ) ,t t tF X Fα α− −= ⋅ + − ⋅
where tF is the forecast of X for period t , 1tX − is the actual sales of X in period 1t − ,
1tF − is the forecast of X in period 1t − , and α is the smoothing constant, which ranges from 0 and 1.
Wanke & Saliby – Top-down or bottom-up forecasting?
Pesquisa Operacional, v.27, n.3, p.591-605, Setembro a Dezembro de 2007 595
4. Forecasting Errors During Lead-Time
This research predominantly departs from the sample errors that are intrinsic to sales and inventory corporate planning systems. When all the historical data are available, estimates for the mean and standard deviation may be determined with the desired significance level. Inferences about the probability distribution of the sales random variable may also be done. However, many corporate systems do not use or have all the historical data, which generates uncertainty about if the forecasting errors result from random noises or from a change in one or more of the parameters values in the underlying demand model. Unfortunately, a priori, it is not possible to clarify those questions regarding the actual sales level; they can only be solved a posteriori (Silver et al., 2002).
Many forecasting models do not use all available historical data. The moving averages use only the last n data and the SES attributes declining weights upon past data (Silver & Peterson 1985). In these circumstances, according to the authors, the best average sales estimate is simply the sales forecast for the next period. As regards estimating the sales variance, the variance of the forecasting error should be used.
According to Silver & Peterson (1985) and Greene (1997), the forecasting error variance and the sales variance are not equal. According to these authors, the best adequacy of the forecasting error variance is related to the use of forecasting for sales estimation. For instance, the safety inventory level must be determined to protect against variations in the sales forecasting errors. In general, the forecasting error variance tends to be greater than the sales variance (Silver et al., 2002). This is due to the additional sampling error introduced by the forecasting models when using only part of the available historical data.
According to Harrison (1967) and Johnson & Harrison (1986), a more complex situation that must be considered occurs when the sales forecasting is considered during the replenishment lead-time ( LT ), assumed here to be discrete. In this case, the forecasting error variance during the lead-time must be estimated. According to Silver & Peterson (1985), the exact relation between the forecasting error variance and the variance of the forecasting error during the lead-time depends upon complicated relations between the sales pattern, the forecasting review procedures and the value of n used in the moving average, or the value of the smoothing constant used in the SES (see Harrison, 1967). According to the authors, one of the reasons for such complexity is that the recurrence procedure in the SES introduces a certain degree of dependence between the forecast errors at different periods of time separated by the lead-time. More recently, Snyder et al. (2004) established formulae for calculating means and variances of sales forecasts during lead-time considering several exponential smoothing models. Like Johnston & Harrison (1986), these authors considered that sales forecasts could vary during the lead-time.
Using frozen sales forecasts during the lead-time is a very common managerial practice, since it tends to be worthless to review sales forecasts values when replenishment orders are still being processed (Greene, 1997). Unless it is possible for the decision-makers to change previously placed orders during the replenishment lead-time, there is little value in reviewing sales forecasts during time interval between the placement and the receipt of an order. This research departs from previous studies for considering the sales forecasts frozen during the lead-time. In other words, for the purpose of calculating forecast errors mean and variances, sales forecasts are supposed not to change during the lead-time.
Wanke & Saliby – Top-down or bottom-up forecasting?
596 Pesquisa Operacional, v.27, n.3, p.591-605, Setembro a Dezembro de 2007
Let the following variables be introduced (source: the authors):
tA product A sales at time period t,
tB aggregate sales of the remaining products (excluding tA ) at t,
tT total aggregate sales ( t tA B+ ) at t,
Aµ expected value of tA (assumed to be constant over t),
Bµ expected value of tB (assumed to be constant over t),
Tµ expected value of tT (assumed to be constant over t),
Aσ standard deviation of tA (assumed to be constant over t), ( )V A variance of tA ,
Bσ standard deviation of tB (assumed to be constant over t), ( )V B variance of tB ,
ABρ correlation coefficient between tA and tB also assumed constant,
Tσ standard deviation of tT ( 2 2 2A B AB A Bσ σ ρ σ σ+ + ⋅ ⋅ ⋅ ), ( )V T variance of tT ,
k ratio between the standard deviations, /A Bσ σ , f historical share of product A sales, /A Tµ µ ,
,A tF sales forecast of tA ,
,T tF sales forecast of tT , LT replenishment lead-time assumed here to be discrete,
LTµ expected value of LT ,
LTσ standard deviation of LT , ( )V LT variance of LT ,
ALT aggregated A sales during the lead-time,
ALTF aggregated sales forecast of A during the lead-time,
ALTE sales forecast error of A during the lead-time, A A ALTE LT LTF= − .
In the remaining text, as a rule, ( )E ⋅ denotes the expected value and ( )V ⋅ denotes the variance of a given random variable. Also, whenever a variable is constant over time, the index t is omitted.
4.1 Bottom-Up Approach
In this case, the results are derived for an individual item (A). From the above definitions, it follows that:
(a) aggregated A sales during the lead-time:
,A tLT
LT A=∑ (1)

Wanke & Saliby – Top-down or bottom-up forecasting?
Pesquisa Operacional, v.27, n.3, p.591-605, Setembro a Dezembro de 2007 597
(b) frozen sales forecast of A during lead-time:
, ,A A tLTF F LT= ⋅ (2)
(c) sales forecast error of A during the lead-time:
.A A ALTE LT LTF= − (3)
Substituting (1) and (2) into (3), we have:
, .A t A tLT
LTE A F LT= − ⋅∑ (4)
Taking the expected values in equation (4), we have:
( ) ( ) ( ) ( ).A AE LTE E A E LT E F LT= ⋅ − ⋅
But ( ) ( )AE A E F= , as shown in Appendix 1. So:
( ) ( ) ( ) ( ).A A AE LTE E F E LT E F LT= ⋅ − ⋅
Supposing that AF and LT are not correlated, we have:
( ) 0.AE LTE =
Taking the variance of ALTE in equation (4) and supposing that A and LT are not correlated, just as A and AF , but that ALT and ALTF present correlation given by
LTA LTFAρ ⋅ , we have:
( ) ( ) ( ) 2 ( ) ( ).A t A LTA FTLA t ALT LT
V LTE V A V F LT - ρ V A V F LT⋅= + ⋅ ⋅ ⋅ ⋅ ⋅∑ ∑ (5)
But LTA LTFAρ ⋅ is equal to:
( ) ( ) ( ).
( ) ( )
t A t ALT LT
LTA FTLAt A
LT
E A F LT E A E F LT
V A V F LTρ ⋅
⋅ ⋅ − ⋅ ⋅=
⋅ ⋅
∑ ∑
∑
That is: 2( ) ( ) .
( ) ( )LTA FTLA
t ALT
E A V LTV A V F LT
ρ ⋅⋅
=⋅ ⋅∑
(6)
Substituting (6) into (5), we have: 2( ) ( ) ( ) 2 ( ) ( ).A t A
LTV LTE V A V F LT E A V LT= + ⋅ − ⋅ ⋅∑ (7)
But, as indicated in Appendix 2: 2( ) ( ) ( ) ( ) ( ).t
LTV A E A V LT E LT V A= ⋅ + ⋅∑ (8)

Wanke & Saliby – Top-down or bottom-up forecasting?
598 Pesquisa Operacional, v.27, n.3, p.591-605, Setembro a Dezembro de 2007
And according to what is indicated in Appendix 3:
2 2( ) ( ) ( ) ( ) ( ) ( ) ( ).A A A AV F LT E F V LT E LT V F V F V LT⋅ = ⋅ + ⋅ + ⋅ (9)
Thus, substituting (8) and (9) into (7) and observing that ( ) ( )AE F E A= , we have:
2( ) ( ) ( ) ( ) ( ) ( ) ( ).A A AV LTE E LT V A E LT V F V F V LT= ⋅ + ⋅ + ⋅ (10)
Finally, as shown in Appendix 4:
( )( ) .2AV AV F αα
⋅=
− (11)
Substituting (11) into (10), we have:
{ }2( ) ( ) ( ) ( ) ( ) .2AV LTE V A E LT E LT V LTα
α = ⋅ + ⋅ + −
That is:
2 2 2( ) ( ) .2A A LT LT LTV LTE ασ µ µ σ
α = ⋅ + ⋅ + −
(12)
This result is identical to that obtained by Eppen & Martin (1988) for the variance of the total forecast error during the lead-time, considering sales to be essentially a constant process and the use of simple exponential smoothing (see their equations (18) and (19)).
4.2 Top-Down Approach
In the BU approach the variance of the forecasting error during the lead-time is given by equation (12). Assuming that f is nearly constant, it must be taken into consideration that the forecasting of tA in the TD approach depends upon the forecasting of tT , and that is given by:
, , .A t T tF f F= ⋅ (13)
As such, taking the variance of ,A tF in equation (13), we have:
2( ) ( ).A TV F f V F= ⋅ (14)
In a similar way to equation (11) and supposing the same smoothing constant:
( )( ) .2T
V TV F αα
⋅=
− (15)
Substituting (15) into (14), we have: 2 ( )( ) .
2Af V TV F α
α⋅ ⋅
=−
(16)

Wanke & Saliby – Top-down or bottom-up forecasting?
Pesquisa Operacional, v.27, n.3, p.591-605, Setembro a Dezembro de 2007 599
Thus, expanding the term ( )V T in (16), we have:
2 ( ) ( ) 2 ( ) ( )( ) .
2AB
A
f V A V B V A V BV F
α ρ
α
⋅ ⋅ + + ⋅ ⋅ ⋅ =−
(17)
Substituting (17) into (10) and also considering that /A Bk σ σ= , we have:
22
221( ) ( ) ( ) 1 ( ) ( ) .
2AB
AfV LTE V A E LT E LT V LT
kkρα
α ⋅⋅ = ⋅ + ⋅ + + ⋅ + −
That is:
22 2 2
221( ) 1 ( )
2AB
A A LT LT LTfV LTE
kkρασ µ µ σ
α ⋅⋅ = ⋅ + ⋅ + + ⋅ + −
(18)
As a validation procedure, spreadsheet Monte-Carlo simulations were performed to confirm the results of equations (6), (8), (9), (12) and (18). Long-range time series (more than 1,000 observations) were randomly generated and the forecasts were summed up during the lead-time, which was also randomly generated. Specifically, A and B sales were generated through correlated normal bivariate distributions and lead-times were supposed to be discrete and uniformly distributed. These distributions were chosen for the sake of simplicity, since the abovementioned results are non-parametric. Both forecasting approaches were applied when generating these data. The average error after 60 replications (randomly generated runs) was about 1% of the theoretical results given by these formulae. It is worth emphasizing that equations (12) and (18) are the key results for the analysis that follows.
Thus, equalling (12) and (18) and then isolating k on the left side of the equation in order to express it in terms of f and ABρ (since the remainder terms are cancelled off during this operation) one gets the critical value of k ( criticalk ). It equals the variances of the forecasting error during the lead-time in the TD and BU approaches:
2 2
2
( 1) 1.
1AB AB
critical
f f fk
f
ρ ρ ⋅ ⋅ + ⋅ − + =
− (19)
Finally, a closer look into equations (12) and (18) shows that if k > criticalk , the variance of the forecasting error during the lead-time is smaller under the TD approach.
4.3 Discussion of Results
According to the results, the smaller the values of ABρ and ( )E f , the greater the chances that the TD approach will minimize the forecasting error variance, and consequently, the safety inventory levels. The Portfolio Effect explains part of the result: an individual item negatively correlated with the aggregate sales of the remaining items presents lower forecasting error variance under the TD approach due to the compensation of part of its variance with the aggregate variance of the remaining items.

Wanke & Saliby – Top-down or bottom-up forecasting?
600 Pesquisa Operacional, v.27, n.3, p.591-605, Setembro a Dezembro de 2007
Even for higher values of ABρ and ( )E f , the TD approach may present better results when compared to the BU if the value of k is sufficiently high, that is, if Aσ is sufficiently higher than Bσ . That result is fully explained by the Anchoring Effect (given that the Portfolio Effect is not present): a less than proportional portion of the total variance is added to the variance of product A. In Figure 1, the Portfolio Effect and the Anchoring Effect are illustrated with numerical examples for the particular case where 1LTµ = and 0LTσ = (equations (12) and (18)).
Portfolio and Anchoring Effects Combined:Let σA = 10, σB = 20, E( f) = 0.30, ρAB = -0.40, and α = 0.10.
BU Variance = 2 · σA2 / (2 - α) = 2 · 100/(2 – 0.10) = 105.26.
TD Variance = σA2 + [α · E( f)2/ (2 - α)] · σT
2,TD Variance = 100 + [0.10 · 0.302 / (2 – 0.10)] · [102 + 202 + 2 · 10 · 20 · (-0.40)],
TD Variance = 100 + 1.61 = 101.61.
kcritical = 0.28, that is, choose the TD approach whenever k > kcritical (k = 0.5).
The total variance (340) is smaller than the sum of the variances of A and B (500) due to the Portfolio Effect generated by the negative correlation.
The Anchoring Effect supplements the Portfolio Effect, incorporating into the variance of A a portion of the total variance less than proportional to that of the Portfolio Effect [α · E( f)2 / (2 - α)].
Anchoring Effect Only :Let σA = 10, σB = 2, E( f) = 0.80, ρAB = +0.40, and α = 0.10.
BU Variance = 2 · σA2 / (2 - α) = 2 · 100/(2 – 0.10) = 105.26.
TD Variance = σA2 + [α · E( f)2 / (2 - α) ] · σT
2,TD Variance = 100 + [0.10 · 0.802 / (2 – 0.10)] · [102 + 22 + 2 · 10 · 2 · (+0.40)],
TD Variance = 100 + 4.04 = 104.04.kcritical = 2.22 (k = 5).
The total variance (120) is greater than the sum of the variances of A and B (104) due to theirpositive correlation. There is no Portfolio Effect.
A less than proportional portion of the total variance is incorporated into the variance of A [α · E( f)2 / (2 - α)], due to the Anchoring Effect.
Figure 1 – Portfolio and anchoring effects.
In Figure 2, the results of equation (19) are generalized and the indifference lines between the TD and BU approaches for different values of ( )E f , k and ABρ are presented. Essentially, if k > criticalk the TD approach must be chosen; otherwise, the BU approach. In other words, given a pair ( ( )E f , ABρ ), if the actual value of k is greater than the respective value of criticalk linked to that pair, the TD approach must be chosen in the Simple Exponential Smoothing instead of the BU approach.

Wanke & Saliby – Top-down or bottom-up forecasting?
Pesquisa Operacional, v.27, n.3, p.591-605, Setembro a Dezembro de 2007 601
k cri
tical
Top-Down: k > k criticalBottom-Up: k < k critical
8
6
4
2
0-1 -0.8 -0.6 -0.4 -0.2 0 0.2 0.4 0.6 0.8 1
ABρ
90.0)( =fE
75.0)( =fE
50.0)( =fE
25.0)( =fE10.0)( =fE
k cri
tical
Top-Down: k > k criticalBottom-Up: k < k critical
8
6
4
2
0-1 -0.8 -0.6 -0.4 -0.2 0 0.2 0.4 0.6 0.8 1
k cri
tical
Top-Down: k > k criticalBottom-Up: k < k critical
8
6
4
2
0-1 -0.8 -0.6 -0.4 -0.2 0 0.2 0.4 0.6 0.8 1
ABρ
90.0)( =fE
75.0)( =fE
50.0)( =fE
25.0)( =fE10.0)( =fE
Figure 2 – Indifference lines and recommended choice between TD and BU approaches.
One notices from Figure 2 that, the smaller the values of ABρ and ( )E f get, the greater are the chances (area of the graph above the indifference lines) of the TD approach to minimize the forecasting error variance with SES. The fact that can explain that result is the conjoint presence of the Portfolio and Anchoring Effects. However, even for higher values of ( )E f and ABρ , the TD approach may present lower forecasting error variance if the value of k is
sufficiently high, due to the Anchoring Effect: 2( ) /(2 )E fα α⋅ − .
5. Conclusions and Implications
In this paper, the impacts of the Top-Down and Bottom-Up approaches upon the variance of the forecasting errors during the lead-time, and consequently, on the safety inventory levels, were analytically shown. In both approaches, greater values of the smoothing constant and of the lead-time (expected value and variance) increase the error variance by the same amount.
The Portfolio and Anchoring Effects explain why the Top-Down approach may minimize the variance of the forecasting errors during the lead-time. Under the Portfolio Effect, present when the correlation is negative, the total variance is lower due to the offsetting of the individual item variance with the variance of the remaining individual items. Under the Anchoring Effect, which is seen even when the correlation is positive, the term
Wanke & Saliby – Top-down or bottom-up forecasting?
602 Pesquisa Operacional, v.27, n.3, p.591-605, Setembro a Dezembro de 2007
2( ) /(2 )E fα α⋅ − implicates the incorporation of a less than proportional portion of the total variance into the variance of the individual item given that ( )E f and α are lower than 1.
When the analytical solutions for the variance of the forecasting errors during the lead-time under the Top-Down and Bottom-Up approaches are made equal, the terms α , LTµ , and
LTσ are cancelled off. The choice of the lower variance approach depends upon the comparison of the value of k with criticalk given by equation (19). That is, the lead-time and the smoothing constant do not specifically influence the determination of the more adequate forecasting approach.
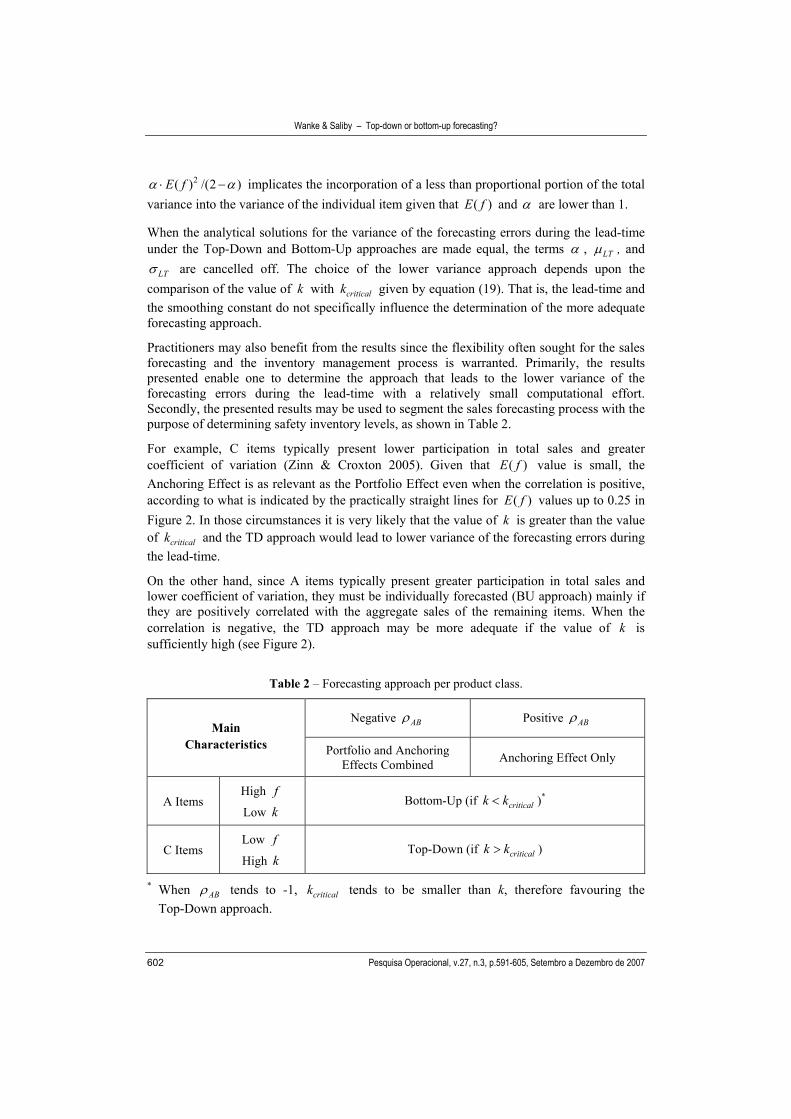
Practitioners may also benefit from the results since the flexibility often sought for the sales forecasting and the inventory management process is warranted. Primarily, the results presented enable one to determine the approach that leads to the lower variance of the forecasting errors during the lead-time with a relatively small computational effort. Secondly, the presented results may be used to segment the sales forecasting process with the purpose of determining safety inventory levels, as shown in Table 2.
For example, C items typically present lower participation in total sales and greater coefficient of variation (Zinn & Croxton 2005). Given that ( )E f value is small, the Anchoring Effect is as relevant as the Portfolio Effect even when the correlation is positive, according to what is indicated by the practically straight lines for ( )E f values up to 0.25 in Figure 2. In those circumstances it is very likely that the value of k is greater than the value of criticalk and the TD approach would lead to lower variance of the forecasting errors during the lead-time.
On the other hand, since A items typically present greater participation in total sales and lower coefficient of variation, they must be individually forecasted (BU approach) mainly if they are positively correlated with the aggregate sales of the remaining items. When the correlation is negative, the TD approach may be more adequate if the value of k is sufficiently high (see Figure 2).
Table 2 – Forecasting approach per product class.
Negative ABρ Positive ABρ Main
Characteristics Portfolio and Anchoring Effects Combined Anchoring Effect Only
A Items High f
Low k Bottom-Up (if criticalk k< )*
C Items Low f
High k Top-Down (if criticalk k> )
* When ABρ tends to -1, criticalk tends to be smaller than k, therefore favouring the Top-Down approach.

Wanke & Saliby – Top-down or bottom-up forecasting?
Pesquisa Operacional, v.27, n.3, p.591-605, Setembro a Dezembro de 2007 603
Finally, suggestions for future research involve the behaviour of the forecasting error variance under these two approaches when the standard deviation of f is not assumed to be zero. Some pertinent issues are therefore raised. For example, would this assumption favour a given forecasting approach? Specifically, under which conditions of α , ABρ , and k is a good approximation to assume f constant? What are the biases incurred in that approximation? What are the impacts of the covariance between T and f on both forecasting approaches? What are the implications for the sales forecasting and for the determination of safety inventory levels?
References
(1) Blackburn, K.; Orduna, F. & Sola, M. (1995). Exponential smoothing and spurious correlation: a note. Applied Economic Letters, 2, 76-79.
(2) Brown, R.G. (1982). Advanced Service Parts Inventory Control. Materials Management Systems Inc, Vermont.
(3) Chatfield, C.; Koehler, A.B. & Snyder, R.D. (2001). A new look at models for exponential smoothing. The Statistician, 50, 147-159.
(4) Eppen, G. & Martin, K. (1988). Determining safety stock in the presence of stochastic lead time and demand. Management Science, 34, 1380-1390.
(5) Gelly, P. (1999). Managing bottom-up and top-down approaches: ocean spray’s experiences. The Journal of Business Forecasting, 18, 3-6.
(6) Gijbels, I.; Pope, A. & Wand, M.P. (1999). Understanding exponential smoothing via kernel regression. Journal of the Royal Statistician Society, 61, 39-50.
(7) Gordon, T.P.; Morris, J.S. & Dangerfield, B.J. (1997). Top-down or bottom-up: which is the best approach to forecasting. The Journal of Business Forecasting, 6, 13-16.
(8) Greene, J.H. (1997). Production and Inventory Control Handbook. McGraw-Hill, New York.
(9) Harrison, P.J. (1967). Exponential smoothing and shot-term sales forecasting. Management Science, 13, 821-842.
(10) Jain, C.L. (1995). How to determine the approach to forecasting. The Journal of Business Forecasting, 14, 2-3.
(11) Johnston, F.R. & Harrison, P.J. (1986). The variance of lead-time demand. Journal of the Operational Research Society, 31, 303-308.
(12) Kahn, K.B. (1998). Revisiting top-down versus bottom-up forecasting. The Journal of Business Forecasting, 17, 14-19.
(13) Lapide, L. (1998). A simple view of top-down versus bottom-up forecasting. The Journal of Business Forecasting, 17, 28-29.
(14) Mentzer, J.T. & Krishnan, R. (1988). The effect of the assumption of normality on inventory control/customer service. Journal of Business Logistics, 6, 101-120.
Wanke & Saliby – Top-down or bottom-up forecasting?
604 Pesquisa Operacional, v.27, n.3, p.591-605, Setembro a Dezembro de 2007
(15) Schwarzkopf, A.B.; Tersine, R.J. & Morris, J.S. (1988). Top-down versus bottom-up forecasting strategies. International Journal of Production Research, 26, 1833-1843.
(16) Silver, E.A. & Peterson, R. (1985). Decision Systems for Inventory Management and Production Planning. Wiley & Sons, New York.
(17) Silver, E.A.; Pyke, D. & Peterson, R. (2002). Decision Systems for Inventory Management and Production Planning and Scheduling. Wiley & Sons, New York.
(18) Snyder, R.; Koehler, A.; Hyndman, R. & Ord, J. (2004). Exponential smoothing models: mean and variances for lead-time demand. European Journal of Operational Research, 158, 444-455.
(19) Zinn, W. & Croxton, K.L. (2005). Inventory considerations in networking design. Journal of Business Logistics, 26, 149-168.
(20) Zinn, W.; Levy, M. & Bowersox, D.J. (1989). Measuring the effect of inventory centralization/decentralization on aggregate safety stock: the ‘square root law’ revisited. Journal of Business Logistics, 10, 1-14.
(21) Zwillinger, D. & Kokosa, S. (2000). Standard Probability and Statistics Tables and Formulae. Chapman & Hall, New York.
Appendix 1 – Establishing ( )AE F
Let the forecast of A with the SES be given by (A 1):
, 1 , 1(1 ) .A t t A tF A Fα α− −= ⋅ + − ⋅ (A 1)
Taking the expected values, assumed to be constant over time, we have:
( ) ( ) (1 ) ( ),A AE F E A E Fα α= ⋅ + − ⋅ ( ) ( ).AE F E A=
Appendix 2 – Establishing tLT
V( A )∑
The variance of the random sum of product A sales during the discrete lead-time was determined with factorial moment generating function (Zwillinger & Kokosa 2000), thus corroborating the results previously presented by Mentzer & Krishnan (1988).
( )tΦ represents the factorial moment generating function of the random sum of A during the lead-time. Its variance is obtained by evaluating the following expression for 1t = :
2´́ ( ) (́ ) ´́ ( ) ,tLT
V( A ) t t t= Φ +Φ −Φ∑ (B 1)
where (́ )tΦ and ´́ ( )tΦ are the first and second derivatives of ( )tΦ , respectively. Let AΦ (t) and ( )LTP t be the factorial moment generating functions of the random variables A (continuous) and LT (discrete), respectively and let t be a supporting variable:
Wanke & Saliby – Top-down or bottom-up forecasting?
Pesquisa Operacional, v.27, n.3, p.591-605, Setembro a Dezembro de 2007 605
( ) ( ) ,AAΦ t t f A dA= ⋅ ⋅∫ (B 2)
( ) ( ).LTLT
LTP t t p LT= ⋅∑ (B 3)
( )tΦ is obtained by substituting (B 2) into (B 3):
( )( ) ( ) ( ).LTA
LTt t f A dA p LTΦ = ⋅ ⋅ ⋅∑ ∫ (B 4)
Finally, differentiating (B 4) with respect to t and substituting the results into (B 1), we have:
2( ) ( ) ( ) ( ).tLT
V( A ) E A V LT E LT V A= ⋅ + ⋅∑
Appendix 3 – Establishing ( )AV F LT⋅
The variance of the product of the random variables ,A tF and LT yields identical result to what was presented by Brown (1982).
The result 2 2( ) ( ) ( ) ( ) ( ) ( ) ( )A A A AV F LT E F V LT E LT V F V F V LT⋅ = ⋅ + ⋅ + ⋅ is equivalent to calculating the variance of the frozen sales forecasting during the lead-time from equation (C 1).
2 2 2( ) ( ) ( ) .A A AV F LT E F LT E F LT⋅ = ⋅ − ⋅ (C 1)
Appendix 4: Establishing ( )AV F
Let the forecast of At with SES be given by (D 1):
, 1 , 1(1 ) .A t t A tF A Fα α− −= ⋅ + − ⋅ (D 1)
Let (D 2) be the expansion of the recursive terms in (D 1): 2 3
, 1 2 3 4(1 ) (1 ) (1 )A t t t t tF A A A Aα α α α α α α− − − −= ⋅ + ⋅ − ⋅ + ⋅ − ⋅ + ⋅ − ⋅ +… (D 2)
Taking the variances of (D 2), we have:
{ }2 2 4 6( ) 1 (1 ) (1 ) (1 ) ( ).AV F V Aα α α α = ⋅ + − + − + − + ⋅ … (D 3)
Finally, solving the sum to infinity of the geometric progression with ratio 1 α− in (D 3), we have:
( )( ) .2AV AV F αα
⋅=
−