tools to analyze and address service quality ... · tools to analyze and address service quality...
TRANSCRIPT
Slide © 2007 by Christopher Lovelock and Jochen Wirtz Kunz - Services Marketing 18
Tools to Analyze and Address Service Quality & Profitability Problems
! Pareto Chart " Separating the trivial from the important. Often, a majority of
problems is caused by a minority of causes (i.e. the 80/20 rule)
! Fishbone diagram
" Cause-and-effect diagram to identify potential causes of problems
! Blueprinting " Visualization of service delivery, identifying points where failures
are most likely to occur
Slide © 2007 by Christopher Lovelock and Jochen Wirtz Kunz - Services Marketing 19
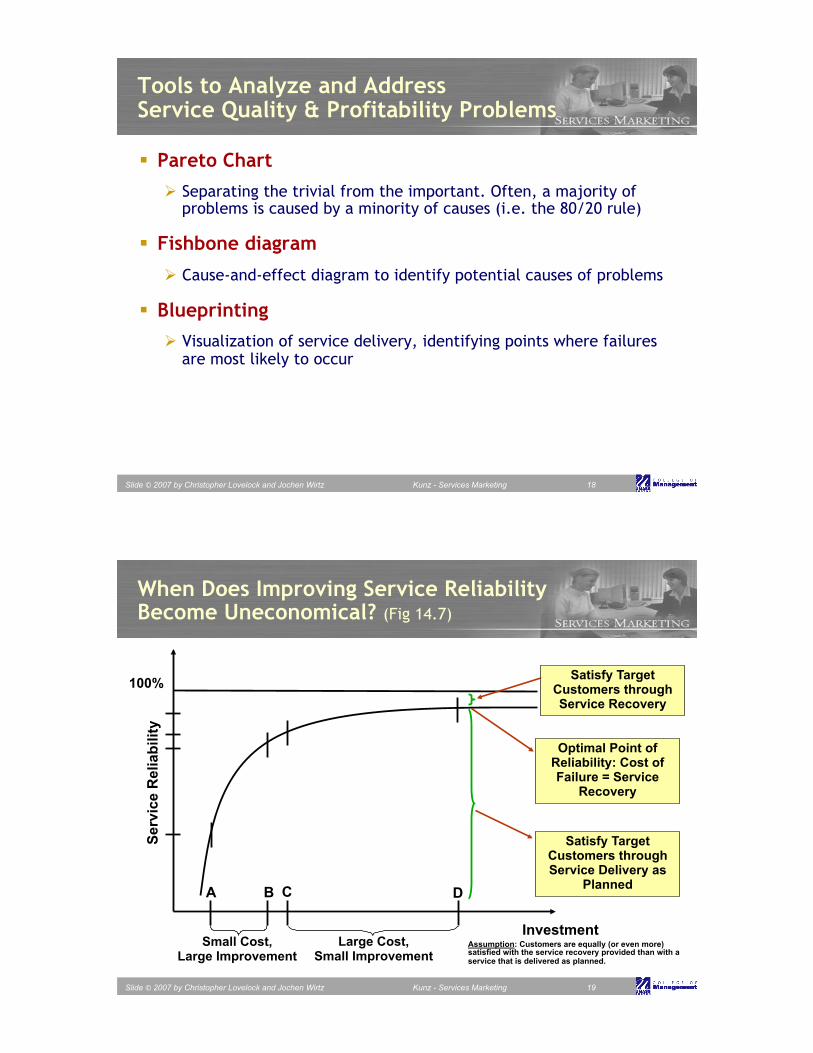
When Does Improving Service Reliability Become Uneconomical? (Fig 14.7)
Satisfy Target Customers through Service Recovery
Optimal Point of Reliability: Cost of Failure = Service
Recovery
Satisfy Target Customers through Service Delivery as
Planned
100%
Serv
ice
Rel
iabi
lity
Investment Small Cost,
Large Improvement Large Cost,
Small Improvement
A B C D
Assumption: Customers are equally (or even more) satisfied with the service recovery provided than with a service that is delivered as planned.

Slide © 2007 by Christopher Lovelock and Jochen Wirtz Kunz - Services Marketing 20
Cause-and-Effect Chart for Flight Departure Delays (Fig 14.5)
Aircraft late to gate
Late food service
Late fuel
Late cabin cleaners
Poor announcement of departures
Weight and balance sheet late
Delayed Departures
Delayed check-in procedure
Acceptance of late passengers
Facilities, Equipment Front-Stage
Personnel Procedures
Materials, Supplies
Customers
Gate agents cannot process
fast enough
Late/unavailable airline crew
Arrive late Oversized bags
Weather Air traffic
Frontstage Personnel
Procedures
Materials, Supplies
Backstage Personnel
Information
Customers
Other Causes
Mechanical Failures Late pushback
Late baggage
Slide © 2007 by Christopher Lovelock and Jochen Wirtz Kunz - Services Marketing 22
Approach to support your client
1. Situation Analysis " Interview with the Management " Analysis of the Industry " SWOT " Major Service Management Problems?
2. Problem definition " Priorities of Problems " Be aware of the resources " Finding the right tools to deliver an answer for the problem " Don’t oversee easy fixes of (smaller) problems
" Prepare the application of the tools and execute " Based on this deliver recommendations

Slide © 2007 by Christopher Lovelock and Jochen Wirtz Kunz - Services Marketing 23
Typical Management Problems (1)
! What should we offer?
! Service Flower, Outsourcing Decision, Full Services & No Frills, Blue-Print, Customer Integration
! What are the customer needs?
! Market research (Ethnography) , Mystery Shopping, Risks, Search Attributes
! Do we offer good quality? Is the customer satisfied?
! Gap Model, ServQual, Hard & Soft Measures, Productivity Measures, Service standards
Slide © 2007 by Christopher Lovelock and Jochen Wirtz Kunz - Services Marketing 24
Typical Management Problems (2)
! How can we improve our service? Why do we fail sometimes?
! Fishbone-Diagram, Blue-Printing, Pareto-Diagram, Critical incident technique, Employee Empowerment
! How can we retain the customer? How can we ensure the customer comes back?
! Service Recovery, Reward & Loyalty Programs, Script, Risk, Convenience
! Does the customer get our message right? What does he receive?
! Communication Metaphors, Corporate Identity, Scripts & Roles, Servicescape

Slide © 2007 by Christopher Lovelock and Jochen Wirtz Kunz - Services Marketing 25
What Happens, When, in What Sequence? Time Dimension in Augmented Product (Fig 3.3)
Before Visit
Reservation
internet
Parking Get car
Check in
Porter
Use room
Meal Pay TV
Room service
Internet Check out
Time Frame of An Overnight Hotel Stay (Real-time service use)
USE GUESTROOM OVERNIGHT
Internet
Slide © 2007 by Christopher Lovelock and Jochen Wirtz Kunz - Services Marketing 26
Blueprinting the Restaurant Experience: A Three Act Performance
! Act 1: Prologue and Introductory Scenes
! Act 2: Delivery of Core Product
" Cocktails, seating, order food and wine, wine service " Potential fail points: Menu information complete? Menu intelligible?
Everything on the menu actually available?
" Mistakes in transmitting information a common cause of quality failure—e.g. bad handwriting; poor verbal communication
" Customers may not only evaluate quality of food and drink, but how promptly it is served, serving staff attitudes, or style of service
! Act 3: The Drama Concludes
" Remaining actions should move quickly and smoothly, with no surprises at the end
" Customer expectations: Accurate, intelligible and prompt bill, payment handled politely, guest are thanked for their patronage

Slide © 2007 by Christopher Lovelock and Jochen Wirtz Kunz - Services Marketing 27
Developing a Blueprint
Define “big picture” before “drilling down” to obtain a higher level of detail
! Identify key activities in creating and delivering service
! Which persons are involved?
! Distinguish between “front stage” and “backstage”
! Clarify interactions between customers and staff, and support by backstage activities and systems (key elements of the script).
! Identify potential fail points; take preventive measures; prepare contingency
! Develop standards for execution of each activity— times for task completion, maximum wait times, and scripts to guide interactions between employees and customers
Slide © 2007 by Christopher Lovelock and Jochen Wirtz Kunz - Services Marketing 28
Key Components of a Service Blueprint
1. Identify principal customer actions 2. Front-stage actions by customer-contact personnel 3. Identify & define scripts (detailed) 4. Define standards for front-stage activities 5. Specify physical evidence 6. Line of interaction (customers and front-stage personnel) 7. Line of visibility (between front stage and backstage) 8. Backstage actions by customer contact personnel 9. Support processes involving other service personnel 10. Support processes involving IT
- Identify fail points and risks of excessive waits - Set service standards and do failure-proofing (detailed) - Points to improve profitability (e.g. SST)

Slide © 2007 by Christopher Lovelock and Jochen Wirtz Kunz - Services Marketing 29
Exercise & individual homework
! Develop a detailed blueprint for your service company
Including customer actions, Front-stage actions, scripts (detailed), standards, physical evidence, Line of interaction, Line of visibility, Backstage actions, Support processes involving other service personnel, Support processes involving IT, Fail Points, Waiting time
! E-mail me till Monday your blueprint (e.g. ppt, photo, scan)
Slide © 2007 by Christopher Lovelock and Jochen Wirtz Kunz - Services Marketing 31
Where are
Failure points, Standards, Physical evidence

Slide © 2007 by Christopher Lovelock and Jochen Wirtz Kunz - Services Marketing 32
Setting Service Standards
! Service providers should design standards for each step sufficiently high to satisfy and even delight customers " Standards may include time parameters, script for a technically correct
performance, and prescriptions for appropriate style and demeanor
" Must be expressed in ways that permit objective measurement
! First impression is important as it affects customer’s evaluations of quality during later stages of service delivery " Research by Marriott Hotels indicates that four of five top factors
contributing to customer loyalty come into play during the first 10 minutes of service delivery
! Customer perceptions of service experiences tend to be cumulative
! For low-contact service, a single failure committed front stage is relatively more serious than in high-contact service
" Viewed more seriously because there are fewer subsequent opportunities to create a favorable impression
Slide © 2007 by Christopher Lovelock and Jochen Wirtz Kunz - Services Marketing 33
Improving Reliability of Processes by Failure Proofing
! Analysis of reasons for failure often reveals opportunities for failure proofing to reduce/eliminate future risk of errors
! Need fail-safe methods for both employees and customers ! Errors include:
" Treatment errors—human failures during contact with customer ! e.g., lack of courteous or professional behavior, failure to acknowledge, listen
to, or react appropriately to the customer
" Tangible errors—failures in physical elements of service ! e.g., noise pollution, improper standards for cleaning of facilities and uniforms,
equipment breakdown
! Goal of fail-safe procedures is to prevent errors such as: " Performing tasks incorrectly, in the wrong order, too slowly " Doing work that wasn’t requested in the first place
! See Service Perspectives 8.1 – Poka Yokes

Slide © 2007 by Christopher Lovelock and Jochen Wirtz Kunz - Services Marketing 34
Benefits of Blue Printing
! Provides a platform for innovation.
! Recognizes roles and interdependencies among functions, people, and organizations.
! Transfers and stores service knowledge.
! Designs moments of truth from the customer’s point of view.
! Suggests critical points for measurement and feedback in the service process
! Clarifies competitive positioning
! Provides understanding of the ideal customer experience.
Slide © 2007 by Christopher Lovelock and Jochen Wirtz Kunz - Services Marketing 35
Different Services – Different Flow Charts
Park Car
Check In
Spend Night in Room Breakfa
st
Check Out
Breakfast
Prepared
Maid Makes
up Room
People Processing – Stay at Motel Possession Processing – Repair a DVD Player
Travel to
Store
Technician Examines
Player, Diagnoses Problem
Leave Store
Return, Pick up Player and Pay
Technician Repairs Player
(Later) Play DVDs at Home
Mental Stimulus Processing – Weather Forecast
Turn on TV, Select Channel
View Presentation of Weather Forecast
TV Weatherperso
n Prepares Local Forecast
Confirm Plans for Picnic
Meteorologists Input Data to Models and Creates Forecast
from Output
Collect
Weather
Data
Information Processing – Health Insurance
Learn about
Options
Select Plan, Complete
Forms Pay
Customer Information Entered in Database
Printed Policy
Documents Arrive
Insurance Coverage
Begins
University and Insurance Company Agree on Terms of
Coverage

Slide © 2007 by Christopher Lovelock and Jochen Wirtz Kunz - Services Marketing 36
Blue-print for Delivery of a People-Processing Service
People Processing – Dental Treatment
Making appointment
Arrive at office
Waiting Meeting the doctor
Treat-ment
Close Visit
Arrangement of next steps
Leave Office
Tangible
• phone quality • reminder card • Give Away
Roles
• Patient • Receptionist
Preparation of Waiting room
Preparation of Exam room
Production of Supply material
Availability of Give Away
Reading the patient file
Up-to-date IT-System
Availability of Parking Pass
Core? (Fac/enhance) Roles? Scripts? Tangibles? Line of Visibility? Flexibility?
• Patient • Receptionist
• Patient • Other Patient
• Patient • Doctor • Assistant
• Patient • Receptionist • Patient
• Chair • Atmosphere •
• Journals • Atmosphere • Room
• Equipment • Chair
• Chair • Atmosphere • Business Card
• Lollipop • Parking
Slide © 2007 by Christopher Lovelock and Jochen Wirtz Kunz - Services Marketing 37
Where might be possibility
to redesign this process?

Slide © 2007 by Christopher Lovelock and Jochen Wirtz Kunz - Services Marketing 38
Redesigning Service Processes
Slide © 2007 by Christopher Lovelock and Jochen Wirtz Kunz - Services Marketing 39
Why Redesign?
! Not profitable anymore ! Rising Quality issues (e.g. waiting time) ! Revitalizes process that has become outdated ! Changes in external environment make existing practices obsolete
and require redesign of underlying processes " Creation of brand-new processes to stay relevant
! Rusting occurs internally " Natural deterioration of internal processes; creeping bureaucracy; evolution of
spurious, unofficial standards - Extensive information exchange
- Data redundancy
- High ratio of checking or control activities to value-adding
activities, increased exception processing
- Customer complaints about inconvenient and unnecessary procedures

Slide © 2007 by Christopher Lovelock and Jochen Wirtz Kunz - Services Marketing 40
Process Redesign: Approaches and Potential Benefits
! Eliminating non-value-adding steps
! Delivering direct service
! Bundling services
! Redesigning physical aspects of service processes
! Shifting to more customer participation
Slide © 2007 by Christopher Lovelock and Jochen Wirtz Kunz - Services Marketing 41
Process Redesign: Approaches and Potential Benefits (1) (Table 8.1)
! Eliminating non-value-adding steps
" Streamline front-end and back-end processes of services with goal of focusing on benefit-producing part of service encounter
" Eliminate non-value-adding steps " Improve efficiency " More customized service " Differentiate company
! Delivering direct service
" Bring service to customers instead of bringing customers to provider " Improve convenience for customers " Productivity can be improved if companies can eliminate expensive retail locations " Increase customer base

Slide © 2007 by Christopher Lovelock and Jochen Wirtz Kunz - Services Marketing 42
Process Redesign: Approaches and Potential Benefits (2) (Table 8.1)
! Shifting to self-service
" Increase in productivity and service quality " Lower costs and perhaps prices " Enhance technology reputation " Greater convenience
! Bundling services
" Involves grouping multiple services into one offer, focusing on a well-defined customer group
" Often has a better fit to the needs of target segment " Increase productivity " Add value for customers through lower transaction costs " Customize service " Increase per capita service use
Slide © 2007 by Christopher Lovelock and Jochen Wirtz Kunz - Services Marketing 43
Process Redesign: Approaches and Potential Benefits (3) (Table 8.1)
! Redesigning physical aspects of service processes
" Focus on tangible elements of service process; include changes to facilities and equipment to improve service experience
" Increase convenience " Enhance the satisfaction and productivity of front-line staff " Cultivate interest in customers " Differentiate company
Slide © 2007 by Christopher Lovelock and Jochen Wirtz Kunz - Services Marketing 44
Levels of Customer Participation
! Customer Participation
" Actions and resources supplied by customers during service production
and/or delivery
" Includes mental, physical, and even emotional inputs
! Three Levels
" Low—Employees and systems do all the work - Often involves standardized service
" Medium—Customer inputs required to assist provider - Provide needed information and instructions - Make some personal effort; share physical possessions
" High—Customer works actively with provider to co-produce the service - Service cannot be created without customer’s active participation - Customer can jeopardize quality of service outcome (e.g., weight loss, marriage
counseling)