tools for the assessment of operation and maintenance
TRANSCRIPT

j! 2 0 2 . 6 94TO WHO/EOS/94.57ORIGINAL: ENGLISHDISTR.: LIMITED
World Health Organization
Tools for the Assessment ofOperation and Maintenance
Status of Water Supplies
Draft Report
Operation and MaintenanceWorking Group
Water Supply and SanitationCollaborative Council
Tools for the Assessment ofOperation and Maintenance Status
of Water Supplies
Draft Report
Prepared for the World Health Organization by
Andrew CottonLiliane PintelonJan Janssens — — -Ludo Gelders ! '; fY .'•'"'
i ' ••'• ''• : '" ' / \ > • ('• '
1. h.i. t«/ i I ^S J
June 1994
•• , • " • • - - • • , - • - •
. . . • . J 1 - ? . • • ' • ' i
'-,.••':,\ : •; ;:.- - ; - - 1 , - 1 <•+ \ | -J- : i

This document is not issued to the general public and all rights are reserved by theWorld Health Organization. The document may not be reviewed, abstracted, quoted,reproduced or translated, in part or in whole, without the prior written permission ofWHO. No part of this document may be stored in a retrieval system or transmittedin any form or by any means - electronic, mechanical or other without the priorwritten permission of WHO.
The views expressed in documents by named authors are solely the responsibilityof those authors.

ACKNOWLEDGEMENTS
The authors would like to thank the World Health Organization forsponsoring the preparation of this report which is one of the activitiesdeveloped by the Working Group on Operations and Maintenance of theWater Supply and Sanitation Collaborative Council. The valuable assistanceof Richard Franceys of WEDC is also acknowledged.
Dr. Andrew CottonWEDCLoughborough University of TechnologyLeicestershireUK
Dr. Liliane PintelonIndustrial StudiesCatholic University LeuvenBelgium
Ir. Jan JanssensIWSA/TECHWAREBrusselsBelgium
Prof. Ludo GeldersIndustrial StudiesCatholic University LeuvenBelgium


CONTENTS
EXECUTIVE SUMMARY 1
TERMS OF REFERENCE 3
INTRODUCTION
Objectives 4
Operation and maintenance performance 4
A FRAMEWORK FOR O&M PERFORMANCE MEASUREMENT
The purpose of auditing 7Performance reporting tools for the O&M function 13PERFORMANCE INDICATORS FOR THE O&M OFURBAN WATER SUPPLIES
Introduction 22Existence of O&M management system 22Methodology 23Performance indicator selection 24Performance indicator summary table 30
PERFORMANCE INDICATORS FOR THE O&M OFRURAL WATER SUPPLIES
Introduction: the state of O&M 32O&M management systems 33Performance indicator selection 34Performance indicator summary table 44
RECOMMENDATIONS FOR FURTHER WORK
Framework 46
Expected project output 47
REFERENCES 48
GLOSSARY & ABBREVIATIONS 54
ANNEX 1Background to the project 57ANNEX 2:Recommendations for future work 58
A sample checklist of questions to be used in the audit

EXECUTIVE SUMMARY
The objective of this study is to review the literature on the performance measurementof operations and maintenance for urban and rural water supplies and to draw up aproposed list of performance indicators to assist in the assessment of the status ofoperations and maintenance (O&M). This should provide a useful tool for O&Mmanagers.
The wider objective of this study is to contribute to improved sector performance andbetter levels, standards and coverage of service at lower costs. Furthermore, thisshould contribute to the long term sustainability of the service.
A framework is proposed which comprises firstly an audit of the O&M function usingchecklists for assessment and secondly an outline performance reporting tool. Theaudit procedure enables periodic 'snapshots' of the O&M function to be taken inorder to make rapid assessments for strategic purposes. The performance reportingtool is meant to be used on a regular basis by the O&M management for closefollow-up of the O&M function and its activities. The framework is applicable to bothurban and rural water supplies.
Within this overall framework, a number of performance indicators for the O&M ofurban and rural water supplies are defined and their application discussed. Thereneeds to be a performance target associated with each performance indicator; noattempt is made to prescribe target values, as this has to be undertaken locally. Therecommended procedure is to assess the status, or performance, of O&M bycomparing each performance indicator with its respective target. This assessmentshould lead O&M managers to act in order firstly to rectify shortcomings in existingperformance and secondly to improve future performance.
A conscious attempt has been made to suggest only those performance indicatorswhich are of primary relevance to O&M and which can be assessed without toomuch difficulty.
In urban water supply the management of O&M is normally centralised andcontrolled by public sector agencies which cover the abstraction, treatment,transmission and distribution of water. Performance indicators are suggested for thefollowing areas of activity in O&M of urban water supply.
• Service• Equipment• Financial• Personnel• Materials• Work order control
In rural water supply, the models for O&M management range from highlycentralised ones which are entirely within the public sector, to community managedschemes owned, operated and maintained by a local community-based organisation(VLOM-based systems). In between these extremes there is a continuous spectrumof models involving the community, the various tiers of government, and the private

sector. Performance indicators are grouped into the same categories as describedabove for urban water supply.
Further work still needs to be carried out in order to achieve the aims of this project.This report represents only the first of three stages. Stage 2 involves testing theO&M assessment procedure in a limited number of case study areas, the results ofwhich will be used to provide feedback for the continued implementation of theproject. It is hoped to be able to be able to analyse performance indicators from urbanwater utilities in Mauritania and Senegal. Stage 3 comprises the final evaluation ofthe O&M assessment procedure through its application at regional level. The resultsobtained will be reviewed by the Operations and Maintenance Working Group whowill recommend further action in a number of countries.
On completion of the project, it is anticipated that the following benefits will beidentifiable: the provision of a manual and general guidelines for O&M assessmentof value to sector professionals; the availability of annotated checklists and parametersfor O&M performance evaluation; increasing awareness amongst sector professionalsof the importance of the O&M function and tangible improvements brought aboutduring the implementation of the stages of this project.

TERMS OF REFERENCE
1. The proposal for this activity has been developed by the Working Group onOperations and Maintenance of the Collaborative Council for Water Supply andSanitation. Further background notes are given in Annex 1.
2. The project will address both urban and rural water supplies.
3. A desk study will be carried out to develop a general framework and indicatorparameters for the assessment of operations and maintenance status of water suppliesin lesser and least developing countries. This will be achieved through a review ofcurrently available literature, including available case study material, on performancecategories, indicators and targets which relate to the operations and maintenance statusof urban and rural water supplies.
4. One of the outputs from the final report will be a proposed list of performanceindicators which will form the basis of a usable tool.
5. Recommendations will be made for further work regarding:
the testing of the operation and maintenance assessment proceduresusing studies;
the subsequent application of these procedures and their evaluation.
6. The report will be structured as follows.
Introduction, background and TOR
Philosophy/draft framework for urban and rural supplies
Proposed performance indicators for urban and rural supplies
Recommendations for future work
References

INTRODUCTION
Objectives
The objectives of this study are to review the literature on the performancemeasurement of operations and maintenance for urban and rural water supplies andto draw up a proposed list of performance indicators to assist in the assessment of thestatus of operations and maintenance. This should provide a useful tool for O&Mmanagers.
The wider objective of this study is to contribute to improved sector performance andbetter levels, standards and coverage of service at lower costs. Furthermore, thisshould contribute to the long term sustainability of the service.
Definitions
This section presents definitions of the most important terms and concepts withrespect to operation and maintenance. A further classification of terms can be foundin the glossary at the end of this publication.
"Operation and Maintenance" is used as a general concept covering all kinds ofactivities carried out by technical departments in water supply utilities and bycommunities in order to sustain its public services and to maintain its existing capitalassets.
The term "Operation" refers to the procedures and activities involved in the actualdelivery of services to the public , for example, abstraction, treatment, pumping,transmission and distribution of drinking water.
"Maintenance" refers to activities aimed at keeping existing capital assets inserviceable condition, for example, repair of water distribution pipes, pumps, publictaps etc.
Operations and Maintenance Performance
The crucial role of good operations and maintenance (O&M) practices in both urbanand rural water supply has been recognised for many years. If water supplies are tobe operated and maintained satisfactorily, it is essential to have an effective O&Mmanagement system. In order to be effective, O&M managers (whether they be publicutilities or community-based organisations) need to be able to measure the status ofthe O&M functions.
The objective of this paper is to develop simple tools to assist in the assessment ofthe status of O&M locally at either the utility or project level. It is not intended thatthese tools be used only by external evaluators; by setting out a framework as wellas suggesting suitable performance indicators, it is the intention that further tools bedeveloped for use by local planners and managers on the ground, which are tailoredto the local situation.

Performance indicators are tools of great potential value to all managers. Equippedwith information provided through performance measurement, management canformulate policy and implement action that is relevant to the problems revealed, oravoid action that is irrelevant and/or inappropriate, and which might have beenadopted in the absence of this information. Performance indicators are normallyapplied in three main fields: problem diagnosis, performance monitoring and futureplanning.
The approach adopted is to define performance indicators having quantitative orqualitative values which cover the field of O&M activity. Associated with eachperformance indicator is a performance target; the status, or 'performance', of O&Mis then assessed by comparing each performance indicator with its respective target.This assessment procedure is not an end in itself. The global objective is to improvethe performance of O&M; therefore, having assessed the status of O&M, action mustbe taken by O&M managers firstly to rectify shortcomings in existing performanceand secondly to improve future performance. This enables performance comparisonsto be made:
- between different time periods for a programme or organisation;
- between different programmes or organisations.
The application of performance indicators to the water supply function is by no meansnew. However, most of the literature reviewed pertained to the overall evaluation ofprojects and programmes rather than specifically focusing on the status of O&M. Thismeans that whilst lists of performance indicators already exist, it is important toreview their relevance specifically to the O&M function.
Whilst such an approach has the apparent advantage of simplicity, the characterisationof performance in this way is obviously dependent on the number of indicators usedand the quality of the data upon which they are assessed. Difficulties can arise wheninterpreting performance indicators; for example, it may be difficult to determineexactly which are the decisive factors in a particular situation, and the informationgathered may not offer any real guidelines for improvement.
In an attempt to address these difficult problems, a framework is proposed whichcomprises firstly an audit of the O&M function using checklists for assessment andsecondly an outline performance reporting tool. The audit procedure enables periodic'snapshots' of the O&M function to be taken in order to make rapid assessments forstrategic purposes. The performance reporting tool is meant to be used on a regularbasis by the O&M management for close follow-up of the O&M function and itsactivities. There is no attempt to devise a diagnostic procedure for fault detection, asit is beyond the scope of this project; guidelines for this have been proposed byUNCHS (1989).

The framework is intended to encompass both urban and rural water supplies. At firstsight, its application might appear to be biased towards large urban water utilities.However, the philosophy underlying the approach is to improve the effectiveness andefficiency of the management of O&M; this is equally as valid for small communitysupplies as it is for large urban networks. Whilst the details (such as relevantperformance indicators) may differ, the principles remain the same.
It is apparent that public utilities (into which category the vast majority of watersupply agencies still fall) have lagged far behind manufacturing industry inmaintenance management. This can be attributed in part to the fact that maintenanceproblems which result in loss of production of manufactured goods have moreimmediately quantifiable effects on sales and profits. There may be lessons to belearned by the water sector from industry; this review therefore encompasses literaturerelating to industrial maintenance management in addition to the water sector. Manyperformance indicators came to light during the course of the literature review.However, in line with the objective of this study, an attempt has been made to selectonly those indicators which are of primary importance and can be measured withouttoo much difficulty.
No attempt is made to prescribe arbitrary performance targets as this must be donewithin the local context. The setting of appropriate targets is by no meansstraightforward; the following key issues can be identified (adapted from Koch, 1991):
involvement of customer/community representatives in the targetsetting process;time and support required to complete this process;relationship of local standards to regional or national standards;standards of management;engendering a 'cultural environment' which gives priority to O&Mmanagement.

A FRAMEWORK FOR OPERATIONS AND MAINTENANCEPERFORMANCE MEASUREMENT
In this chapter a framework for O&M performance measurement is proposed,comprising an audit of the O&M function and a performance reporting tool. Theframework is applicable to both urban and rural water supplies.
The Purpose of Auditing
The audit is a systematic procedure to objectively obtain and evaluate evidenceabout the O&M organisation and practice of any given organisation. Auditing,although not commonplace, is growing in popularity as the results provide avaluable tool for understanding the way O&M works.
Audits may be carried out for several reasons:
whenever scrutiny of O&M is required,
prior to making organisational or policy changes,
when independent opinion is needed in addition to internal views.
for comparative purposes; or to establish performance targets for newfacilities.
Audits are normally carried out using checklist and questionnaire responses, basedon individual interviews (a sample checklist can be found in Annex 2). The maindisadvantage of this method is the danger of being too narrow in focus. This canbe avoided by working with well structured checklists supported and crossreferenced by a framework. Ideally, this framework should contain all relevantO&M elements, the relationships between those elements, and the links between theO&M function and other business functions. The framework should present anindependent view of the O&M functions, objectives, organisation and practices,against which checklist questions and answers can be evaluated.
Box 1 illustrates this type of framework. Two parts can be distinguished:'background' consists of general information on the developing country and theWS&S, while 'management' focuses on O&M organisation and practices. There arethree sub-sections to the management part of the framework: the O&M environmentwhich determines the scope for the O&M manager, the O&M management functionand the management tools available to the manager (A discussion of these elementswill follow in the section on audit procedure).

Box 1 Overview of framework
Developing countryW «ter supply & sanitation system
Q&M cnrinuunintservice industryO&M respooibilitiesO&M philosophy
objectivesplanningresourcesperformance
m«u«m«t tnnla
M MISOR techniqueshuman resource management
management
background
Prior to beginning an audit, careful planning of the contents and structure ofchecklists is essential. A suitable choice of open or closed questions has to bemade; the emphasis of questions may need to change according to the interviewee;and if figures are not available, decisions about estimations will be required.
The value of auditing is important at three levels: for consultants it provides basicinformation about the O&M function, and a context against which more detailedinformation from performance indicators can be interpreted. For staff membersworking within O&M it helps to make the O&M function transparent, removing'company blindness' from work, and for international comparisons, this informationhelps develop guidelines for O&M practices and planning for future investments inWS&S plants.
A Structured Audit Procedure
The checklist should begin with a section on 'background information' (see Marcelis(1979) & (1984) and Kelly (1991)), which provides general information and anoverview of maintenance management within the organisation. This is proceededby sections dealing with the differing elements of the maintenance managementsystem. These sections are discussed in greater detail below.

Background information
This information provides a broad context to the WS&S system and prepares theinterviewers for the type of answers to follow. Background information needs tobe gathered prior to beginning the interviews and includes details on:
Developing country
The O&M practices within an organisation may be affected by the developmentstatus of the nation in question. The types of issues that need to be addressedinclude:
Technology needs and availability of appropriate technology. These differbetween countries because of variations in economic development, politics,infrastructure, raw materials and climate (see Chiteris (1982), Alaerts et al(1977)).
Political agendas and international contacts, i.e. donor/host relationships,organised technology transfer programmes (see Nakajima (1982)).
Water supply and sanitation systems
Details of the WS&S system are required before considering O&M organisation andpractice. Issues include:
age of the WS&S system (if new, running-in failures may be expected; if old,rehabilitation may be urgent)
capacity utilisation and efficiency (low utilisation may indicate design over-capacity or system malfunction)
long-term capacity strategy (the ability of the current design to cope with therapidly growing urban population (Pickford (1977))
standardisation issues (especially important if the system is not installed bylocal firms)
O&M organisation and practices
Service industry: WS&S is normally a function of a public utility based within the'service industry', and as such, performance evaluation is much more difficult toquantify than in manufacturing industry. With the latter, breakdowns leading toproduction loss and lost sales opportunities can be relatively easily quantified. WithWS&S systems, breakdowns leading to reduced quality and/or quantity in suppliedwater and subsequent health and environmental problems are difficult to quantify inmonetary terms or with accurate statistics. This complicates the O&M managementfunction, since it is difficult to objectively choose between policies advocating, forexample, more investment in O&M or ensuring there are fewer or shorterbreakdowns.

Responsibilities: It is important to have a clear understanding of all O&Mresponsibilities, including the way O&M is organised and how it relates to theoverall management of the WS&S system. For example, O&M may form either asubstantial or minor part of WS&S management. If the former is the case, O&Mwill have considerable decision-making power over elements such as purchasingspare parts and hiring personnel; if the latter, decision-making power will be limited.This difference in power needs to be taken into account when evaluating O&Morganisation and practices.
Philosophy: An understanding of the O&M environment depends on the attitudemanagement staff adopt with the function. If, for example, O&M is seen as an areaof major concern for management, it may be easier to invest in maintenanceresources, or to adopt and implement maintenance philosophies such as RCM(reliability centred maintenance), or TPM (total productive maintenance).
One concept which offers a view on maintenance engineering that is a combinationof management, financial engineering and other practices applied to physical assetsis life cycle costing, or terotechnology (see Box 2). The global approach advocatedby this concept ensures that all cost components (investment and operating costs)and all O&M related aspects are considered.
Box 2 Life Cycle Costing
disposal
prform anee assessment specification
Î Imodification
peration
design
Ybuild or buy
commissioning installation
O&M Management
Objectives: From a management viewpoint, objectives need to be as clear aspossible, since they will form the basis for determining O&M policy and forsupporting O&M decisions. Moreover, setting realistic targets motivates staff toachieve and maintain them. Although a statement of clear objectives may seem anobvious requirement, in practice they are often lacking from the O&M function.
10

Objectives tend to be general, such as 'O&M should keep the plant running';whereas ideally they need to be explicitly stated, such as 'O&M budget is $X,downtime should not exceed Y hours; personnel utilisation should be at least Z%\
Planning: O&M and maintenance decisions concerning equipment fall into threecategories of planning: long term (strategic), medium term (tactical) and short term(operational).
• Strategic planning is concerned with the provision of resources to ensure acontinuous, satisfactory performance of the plant. This will include decisionsconcerning construction of new WS&S systems, capacity enlargement projectsand major rehabilitation projects. These decisions should take into account thefollowing: life cycle costs, economic factors (i.e. available budget, ability tocharge consumers for water supplied, economic and physical growth in the areaserved), technology and technical aspects (appropriateness of the technologyused, modular design, local construction firms), support aspects (provision ofspare parts, training programmes) etc. Too often many of these elements areoverlooked.
• Tactical planning is designed to ensure effective and efficient plant operation,by adopting the right O&M policy. With maintenance, for example, this meansfinding the right mix of preventative and corrective maintenance interventions.
• Operational planning occurs once aggregate allocation of resources has beenmade. Daily operational planning assumes that a rational work order and jobdocumentation system exists. It should be noted that not every employee hourshould be scheduled in advance in order to achieve sound operational planning;a certain amount of capacity may be reserved for emergency tasks.
Resources: Sound resource management is crucial for effective O&M management.The types of resources to consider are personnel, repair shop, materials andinformation & documentation. For WS&S plants in developing countries, it isadvisable to rely on own, or at least local, resources. In practical terms this meanstraining personnel instead of being dependent on outside (mostly foreign)consultants, engineers and workers, or stocking the right number of parts, since poorinfrastructure may delay the replacement of spare parts.
Personnel management involves hiring and training the right people, ensuring abroad mix of skills throughout the organisation and motivating staff to performcompetently. If the objective of O&M is to provide the safe, reliable and efficientoperation of production plants, the following skills are required from O&Mpersonnel to achieve this goal:
operational skills that allow systems and equipment to function within theirdesigned capabilities.
deviation-detection skills that help identify and analyse those factors, areasand operational characteristics that may lead to potential or actual failure.
11

repair skills that enable the restoration of systems and equipment to theiroriginal operating condition.
documentation skills that enable the recording of the entire event.
A repair shop is a useful resource for O&M. Equipped with powered machine tools,welding equipment and electrical test equipment, the repair shop can correct and/ormanufacture spares as and when required.
The MRO (Maintenance, Repair and Operating Supplies) store of the WS&S systemwill normally carry a variety of spare parts and consumable goods. The mainmanagement issue involves guaranteeing availability of these parts by identifying theright trade off between stocking (the number of parts in stock) and stock-outs (howto ensure a reasonable level of service) for spares.
Used correctly, information and documentation can be an asset to O&Mmanagement. Data in the form of technical information on equipment parts,interchangeability of spares, sequences of (dis)assembly and equipment failurehistory can help to transform the management process. Increasingly, computerisedmaintenance information systems are being used in this sphere. Similarly,administrative procedures can aid O&M functions by maintaining efficient andeffective maintenance activities through well structured systems.
The choice of appropriate performance indicators and the development of a soundperformance reporting system are important elements to O&M, which are discussedin greater detail later in this chapter.
Management tools
There are a variety of management tools available that can be used to support thedecision-making process for the O&M function.
Mann (1983) reports that investment in data processing equipment for O&M mayyield benefits. Further studies report that the use of a computerised informationsystem can help achieve better labour productivity, equipment availability, controlof the MRO store (through more accurate, timely information and cross referencing),availability of technical data, maintenance history information and easierperformance reporting.
Human resource management concepts (see Pulat & Alexander (1991) and DeGroóte (1986)) may be adopted and adapted to training and the motivation ofpersonnel.
12

Design review methods may be used for checking the maintainability and reliabilityof WS&S plants, depending on the specific characteristics and logistics indeveloping countries.
Operational research techniques (see Pintelon (1992), Bornstein & Rosenhead(1990)) may be useful in ensuring the optimum use of resources. Although somemay be inappropriate for WS&S in developing countries, models such as repair-limit(for the replacement of old equipment), or those for determining the optimum sparepart inventory can be effectively employed. Computer simulations can be of valuein testing alternative scenarios and predicting the outcome of using differentmaintenance policies.
Performance reporting tool
Performance reporting
Performance reporting is an indispensable part of all management functions.Typically, the performance reporting tool is used on a regular basis by O&Mmanagement in order to keep a close check on all O&M functions and activities.Monthly, or bi-monthly reports aid management by evaluating performance for theprevious period and anticipating problems that may subsequently arise.
Until recently, performance reporting for O&M had been relatively neglected inpractice, reflecting both the low profile of this function and the difficulty ofquantifying performance in this area. The output of O&M has proven difficult toevaluate because:
maintenance is a service function, and as such, the merits and shortcomingsof the rendered service are not immediately apparent. This makes it difficultto justify the use of resources and level of expenditure on assuring properplant performance.
the evaluation of O&M performance depends on the perspective applied:accountants may perceive O&M in terms of costs, while engineers will focuson performance in terms of reliability, availability, and maintainability ofequipment.
it is difficult to distinguish between operations and maintenance functions.For example, more extensive maintenance may be required because ofoperator faults, or simply because more plant activity was required.
A conceptual approach to performance reporting: literature review
The O&M manager must address a wide range of management jobs within thedepartment: planning, purchasing, personnel, quality control, inventories, technicalproblems and budgets. To assist the manager in the task of evaluating performancewithin these sections, a review of conceptual approaches to management is detailedbelow.
13

within these sections, a review of conceptual approaches to management is detailedbelow.
Box 3 gives an overview and brief evaluation of the methods used for maintenanceevaluation drawn from both literature and practice.
Box 3 Overview of performance tools
Type of PI system
IndicatorsOverall PI (Box 4)PI collection (Box 5)Structured PI list (Box 6)BenchmarksChecklists (Box 7)Surveys (Box 8)
Graphical reportsPie, line & bar chart(Box 9)Perf. potential graphs(Box 10)Radar graphs
Elaborated methodsHIM (Box 12)Luck (Box 13)MMT(BoxU)
Advantages
Popular (compact)More completeStandardised
Quick insightAcceptable if available
Popular
Actual vs target
Clear insight
GlobalFairly globalHandy management tool
Disadvantages
Too strong aggregationNot always conclusiveNot yet for control purposes
Rough and rigidTo be used with caution
Misuse
Often subjective
Limited number of Pis
Rigid and complexComplexCareful implementationrequired
Box 4 Example for overall performance indicator
The following overall PI represents the relative merits, on a year-to-year basis, of themaintenance function within an organisation (a detailed discussion of this PI may befound in Jardine (1970)):
E =xC + yL+zW
where:C = total maintenance cost expressed as a percentage of the replacement value of the plant and
equipmentL = lost time due to maintenance expressed as a percentage of the scheduled production hoursW = waste of materials due to poor maintenance expressed as a percentage of the total output at
the appropriate stage of the processx * total cost of maintenance in base yeary = total cost of lost time due to poor maintenance in base yearz n total cost of waste produced due to poor maintenance in the base yeark = a constant such that the efficiency index equals 100 in the base year
14

Box 5 Example for MRO (maintenance, repair and operating supplies) store
items in inventoryitems removed from inventoryitems added to inventoryinventory valueaverage value of inventorynumber of movementsvalue issuednumber of stockoutsturnover
Box 6 Example for maintenance efforts, effects and effectiveness
maintenance effort:department operationmanpowerwork ordereconomyservice assessmentservice operationmaintenance intensityservice cost
maintenance effects:plant conditionbreakdown severity (MTTR)breakdown frequency (MTBF)plant performancemachine utilisationoutput quality
overall effectiveness:progress in cost reduction indexdegree of maintenance intensity index
overall economy service index
Box 7 Example for materials management
indicatorrotation ($/month)% no-demand% dead items
value norm3-43-51-3
noteexclusive critical itemsnot available when neededno demand for 2 years
15

Box 8 Maintenance cost as % of total production costs
Sectorpharmaceuticalmetal workingtextilespaperchemicalmining
%2
1-33-5
8-1010-1515-25
Box 9 Example for maintenance budget
Box 10 Example of perf. potential graph
master scorepoor 0
123456789
Excellent 10
overtime (%)10
9
8
7
6
0
1
2
4
5
effectivrty0
20
40
80
100
f%) budget variance (%)+/-10
+/-8
+/-B
+/-4
+/-2
+/-0
Note:overtime % = hours worked in overtime/total number of hours worked * 100effectivity = % of jobs done RFT (Right the first time), i.e. jobs executedproperly so that no new intervention is required (say within 3 days) after the firstonebudget variance = (budget - costs)/budget * 100
16
Box 11 Example of radar graph
suppliers' « U n a / turnover
spares Inventoryreplacement value stock ir
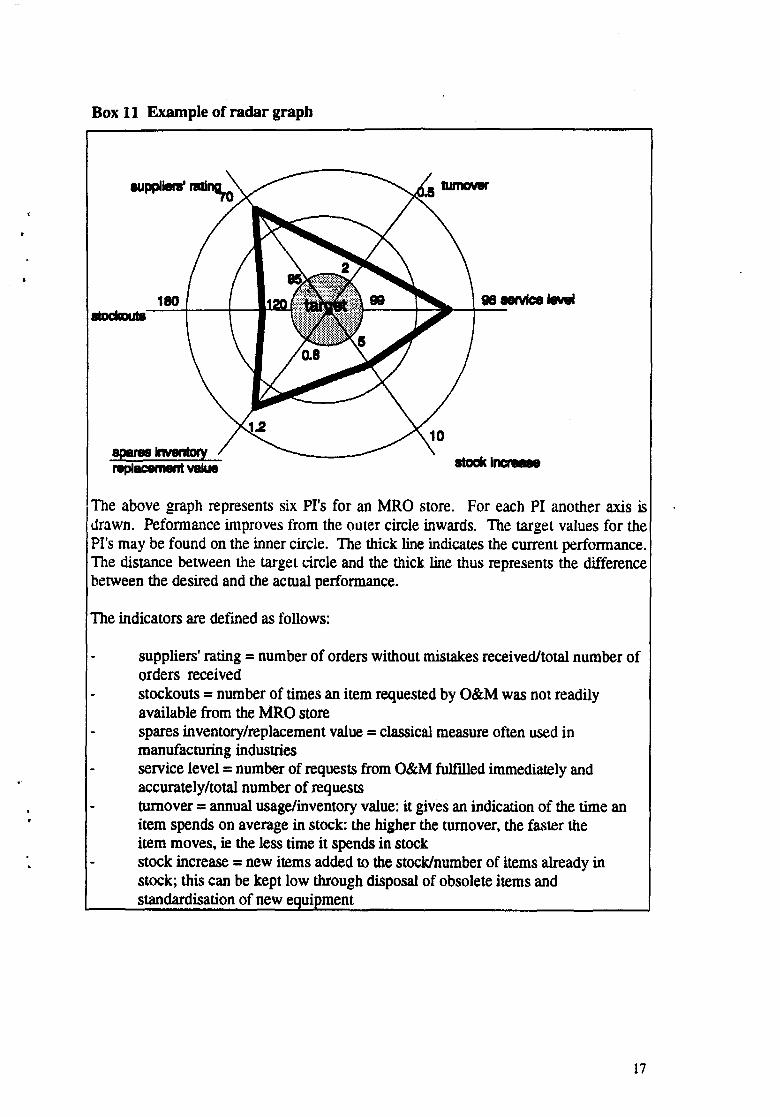
The above graph represents six Pi's for an MRO store. For each PI another axis isdrawn. Peformance improves from the outer circle inwards. The target values for thePi's may be found on the inner circle. The thick Une indicates the current performance.The distance between the target circle and the thick line thus represents the differencebetween the desired and the actual performance.
The indicators are defined as follows:
suppliers' rating = number of orders without mistakes received/total number oforders receivedstockouts = number of times an item requested by O&M was not readilyavailable from the MRO storespares inventory/replacement value = classical measure often used inmanufacturing industriesservice level = number of requests from O&M fulfilled immediately andaccurately/total number of requeststurnover = annual usage/inventory value: it gives an indication of the time anitem spends on average in stock: the higher the turnover, the faster theitem moves, ie the less time it spends in stockstock increase * new items added to the stock/number of items already instock; this can be kept low through disposal of obsolete items andstandardisation of new equipment
17

Box 12 Example of elaborated method (after Hibi)
integrated efficiency scale =(total repair cost + total amount of production losses, yieldratio, supplies, energy, quality, etc resulting from shutdown by failure or malfunction)
total value of control scale
Box 13 Example of elaborated method (after Luck)
The graph represented below is modelled after Luck (Jardine (1970)). Four aspectscontributing to the global performance are chosen and measured along the four sidesof a square. A suitable scale on the side of the square is then chosen by the decision-maker for each index such that the graduations on the opposite sides of the squareresult in a (not necessarily linear) progression through six subjective ranking valuesfrom P (poor), through A+, A, A- (average), G (good) to E (excellent). The actualperformance for each of the aspects is indicated on the sides of the squares andopposite sides are connected. The intersection of these lines gives the overallperformance. By projecting the intersection point perpendicularly onto the diagonal anumerical value for the global performance is found.
PLANNINGG A+ A A- P
-1
GL
S '° A
A-
P
N 1/Nf
/ ^̂ wL/ ^ ^/ \
s
8CECL
Omgood
WORKLOAD
18

Box 14 Example of elaborated method (maintenance management tool)
CONTROL BOARD - Parted T
•Eauipment ( 10 ) Availability
Ratio Report -
Availability
m/c 1
m/c 2
m/c 3
Parlad T
Actual Expactad Attention
Follow-up
Capacity
(hours)
Resort - Parted T
t1 t2 t3 t4
- standard repon
iMiaa M I
- planned production
— actual production
|m/c2J
hi-Period T
19

Performance reporting tool: an example
In order to make the performance evaluation process as productive as possible, onecould think of organising chosen performance indicators (Pi's) through a controlboard linked to a network of detailed reports. An example of such a maintenancemanagement tool (MMT) used in some Belgian firms can be found in Pintelon(1992) and is illustrated in Box 14.
The small but carefully chosen number of Pi's on the bi-monthly generated controlboard gives a clear picture of the different aspects of O&M performance and theirinter-relationships. By comparing actual values for these Pi's over a given periodwith predetermined target values, it is possible to identify potential problem areas.The causes of these problems can then be tracked by investigating the detailedreports in question.
For example, one of the indicators on the control board may relate to the % ofovertime worked. Assume that the % of overtime for a period was 25%, a figuremuch higher than the target of 5% or less. If this occurs continuously, thenreference could be made to various reports - a trend report, a pie chart showing the% of time maintenance workers spent on their different duties, or a stacked bar chartshowing the number of hours and overtime hours spent on each of the areas. Moredetails to help identify the problem could be found in the shift reports or top-ten-job-list for the job area in question.
Guidelines for the use of detailed reports
Self-supporting. Detailed reports (DR's) should contain all the necessaryinformation required to read and understand its contents. Cross referencingto additional information from other reports should be avoided.
Function. A DR should also contain information about its location andfunction in the DR network. This permits more efficient searching withinthe network.
Uniformity. DR's should be as uniform as possible in order to facilitateconsultation.
Selection. Avoid generating numerous 'just-in-case' DR's that areinfrequently used. The user should be able to generate additional reports ifnecessary.
Statistical relevance. Statistics that are used need to be relevant and easilyaggregated and disaggregated.
Duplication. Avoid duplication in order to maintain a clear and transparentDR network. A small degree of duplication cannot be avoided and cansometimes be of interest.
Graphs. The choice of graphical representation needs to be made carefully.
20

Guidelines for the selection of performance indicators
Purpose. Pi's should be matched to the objectives of O&M and their rolein achieving those objectives needs to be clear.
Visibility. Each PI should be relevant and transparent in order to provideinsight.
Definition. Defining a performance indicator is a time consuming processin which Pi's are suggested, critically analysed and redefined until aconsensus is reached on their value. All persons involved in the use,analysis and targeting of O&M should contribute to this process.
Control power. Pi's should be used to report on the performance of O&Mwhich is under the control of the user, i.e. on the process that he or she,either alone or collectively, can influence. Informative Pi's can beinteresting, but for effective management, control Pi's are needed.
Computation. The method of computation and data collection must becarefully defined for each PI. The method must allow for validation of inputdata (how data can be retrieved, interpreted), and clear definition of datacollection points.
Consistency. Pi's must remain consistent over time, and in the face of othervariations in, for example, exchange rates, inflation or interest rates.
Comparability. Careful consideration must be given to comparison of Pi'sbetween divisions or companies because of differentials in circumstancesand/or targets.
Aggregation. The use of a single PI to evaluate overall efficiency should beavoided, since the ratios used in aggregation may obscure valuableinformation. It is recommended that a relatively small number of ratios bechosen for each topic, such as capital, manpower, material, equipment andservice.
Data integrity. The integrity of data and timeliness are essential elements forPi's. Since Pi's aggregate large quantities of information, it is crucial thatthey are reliable, with cross-checks being built in where possible.
21

PERFORMANCE INDICATORS FOR THE OPERATION ANDMAINTENANCE OF URBAN WATER SUPPLIES
Introduction
Frequent disruption to water supply and poor water quality can be a serious threat tohuman health, safety and socio-economic development in urban areas. In addition, theincidence of unaccounted-for-water that arises from leakages, differing types of watersupply systems, illegal connections to distribution pipes or failures in the accountingsystem may have a considerable impact in terms of water shortages or costs ofdeveloping a new water supply. Thus, the importance of effective O&M to the overallWS&S system should not be underestimated.
Effective O&M must be co-ordinated with government departments that haveresponsibility for activities that may lead to the contamination of ground or surfacewater supplies, especially through landfills, sewerage systems or hazardous wastedisposal.
The introduction of performance indicators for O&M of urban water supplies willhelp management evaluate the performance of this function and plan for major capitalimprovements.
Existence of an O&M management system
For performance indicators to be effective, it is important that a functioningmanagement system is in place (this applies equally to rural water supplies). In orderto assess the thoroughness of the management system, a level of perfection1 (seeMarcelis' philosophy, Marcelis (1979) & (1984)) could be assigned. Five categoriesof 'perfection' can be identified, based on the following criteria (see also Box 15):
structure of the management process: how far are decisions taken accordingto established procedures?
feedback process: how far, and how often, are decision outcomes checkedwith the corresponding objectives?
forecast horizon: how far ahead does management look for their decisionsconcerning O&M?
integration level: are decisions concerning O&M taken with sufficientinsight and knowledge of the broader context?
22

Box 15 Criteria used to assess thoroughness of O&M management system(after Marcelis)
Level ofperfection
very lowlow
mediumhighvery high
Managementprocess
structure
no rulesrules ofthumbrules
proceduressystems
Feedback
neversometimes
regularlyoften
always
Forecasthorizon
nosmall
reasonableconsiderable
large
Integration
noa little
reasonablefar-going
total
Methodology
When choosing performance indicators for O&M, several factors need to be takeninto account. The following example indicates the types of questions required in thesearch for appropriate Pi's.
Example: If we are planning to use performance indicator x (PIx) for measuringperformance in area X, where PIx = % overtime and X = personnel utilisation, thenthe following types of questions should be considered:
is X an area under the control of O&M?will the PIx measure record what is needed?will problems in area X be detected by the use of PIx?does PIx give an idea of the magnitude of the problem?is data available to compute PIx?is PIx accepted by the people involved?are there any other indicators that can help identify the cause of the problem?can alternative solutions be found?who, besides O&M, will use PIx?
It should be noted that PI results not achieving target levels do not necessarily meanthat the O&M function is below standard. Instead, this may indicate that O&M worksin a difficult environment (ie, with inappropriate technology, excessive delays fordelivery of spare parts, etc). Awareness of this point may prevent the wrongconclusions being drawn and help motivate staff within O&M. Thus, it is crucial thatwith formal performance reporting systems that:
(i) a thorough understanding of the O&M function and its context has beenmade, ie, through the auditing procedure.
(ii) that the expectations concerning O&M performance are realistic and that acommitment to carry out corrective action is present amongst staff.
23

Performance indicator (PI) selection
The Pi's for urban WS&S systems are grouped into the following areas:
• Service
• Equipment• Financial• Personnel• Materials• Work order control
No attempt was made to rank the performance indicators (ie, A, B, or C) in the urbanenvironment since ranking depends too much on the specific working context. Toevaluate the overall performance of O&M, indicators should not be considered on anyindividual basis, but as part of a bigger whole. It is hoped that the case study work inthe next stage of the project will enable rankings to be investigated.
Service Pi's
. One way of measuring the performance of the WS&S system is through consumerperception of the water supply service, including water quality and water delivery.O&M practices will contribute significantly to the satisfactory performance of theseaspects of the service.
Water quality may be expressed by its bacteriological content, depending on localwater quality standards and objectives (for a more detailed discussion of this measure,the reader is referred to the rural water systems chapter).
Water quality indicator = percentage of samples > target number ofE.coli per100ml
The objective is to reduce this indicator.
In order to measure the performance of water delivery services, an indicator recordingthe availability of the water supply is used. This indicator records the extent to whicha continuous water supply is provided over a set period.
Water supply indicator = number of hours of water supply per day /24 hours
The objective is to increase this indicator, ideally to 1 or 100%.
Equipment Pi's
The availability and reliability of equipment is an integral part of the O&Mmanagement function which should be subject to regular performance evaluation.This group of performance indicators focuses on equipment which is the responsibility
24

of O&M, such as treatment plants, pumping systems, distribution networks andmaintenance vehicles.
Two commonly used indicators to evaluate maintenance practices are MTBF (meantime before failure) and MTTR (mean time to repair). The higher the value forMTBF, the less frequently breakdowns occur and the more efficiently the systemoperates. A low MTBF value indicates poor standards of maintenance work(incorrect or inappropriate repairs), or equipment failures (through fatigue). Theobjective is to increase the indicator.
MTTR indicates how long repair work takes to complete. Low MTTR values pointto systems which are 'maintenance friendly', that is systems that are easy to maintainthrough modular design and/or efficiently organised maintenance work. The objectiveis to decrease the objective.
While MTBF is frequently used as a measure of the system's reliability, MTTRindicates the system's maintainability. In combination, MTBF and MTTR measure theoverall availability of the system. The performance indicators are defined as follows:
MTBF - length of period considered/number of failures in that period
MTTR ~ total time spent on repairs/number of repairs
availability = MTBF/(MTBF + MTTR)
Although system failures and breakdowns cannot be ruled out completely, it isimportant to limit their incidence as much as possible. If breakdowns do occur, it ispreferable that they are small in nature and quick to repair.
Several other indicators can be used to evaluate equipment performance, including:number of failures, number of severe failures, and top-ten critical item list
Other related indicators, which are more specifically designed for WS&S systems are:
Unaccounted for water (UFW) = total annual production - total annual meteredconsumption + estimated annual non-meteredconsumption
% of UFW = UFW/total annual production
The objective is to reduce both the indicators.
% of fire hydrants in working condition = number of fire hydrants in workingcondition/total number of fire hydrants
% of consumer meters in working condition in domestic, industrial, commercial,institutional consumer categories = consumer meters working/total number of
meters
25

The objective is to increase both the indicators.
Financial Pi's
Effective budgetary control and measurement of costs and revenues is a key elementto successful O&M management Several performance indicators have been definedto assist in this task:
The Year-to-date measure (YTD) establishes to what extent the annual budget hasalready been used, by calculating costs incurred to the present time and comparingthis figure with the budget allocation for the same period.
The cost component percentages (ie, labour, materials, contractors) indicatoridentifies the areas where money has been spent and where potential savings can bemade.
The remaining indicators falling within this group focus on relative measurement ofthe costs and revenues of WS&S systems, by calculating the average costs and/orrevenues per consumer, per connection, and per km of distribution mains served, etc(for a more detailed discussion of these measures, refer to the chapter on performancemeasurement in WS&S systems in rural areas). These indicators are valuable forcomparisons between systems, as long as the systems in question are similar instructure.
operating revenue per capita served = operating revenue/population served
operating costs per capita served = operating cost/population served
operating surplus (loss) per capita served » operating revenue minus operating
costs/population served
operating costs per connection = operating costs/number of connections
total costs per connection = total costs/number of connections
operating costs per m3 water billed = annual operating cost/total annual waterbilled
% of O&M asset expenditure to asset value = total annual O&M expenditure/total asset value
% of expenditure for staff to O&M expenditure = total annual expenditure forstaff salaries and benefits/total annual O&M expenditure
annual maintenance expenditure per new capital investments
annual maintenance expenditure per km of distribution means
26

working ratio = operating costs/operating revenue
Personnel PVs
Human resources can, in the right environment, significantly improve the O&Mfunction of WS&S systems. In the wrong environment, they can weaken and hinderthe same system. Developing a way to evaluate the performance of personnel iscrucial if the latter is to be avoided. The performance indicators defined in this groupare designed to provide an insight into the workload of O&M employees.
If different skill groups are represented within the personnel structure, it may bepreferable to calculate performance for the whole staff complement and the differentskill groupings, since an average figure for the whole staff may be skewed by, forexample, an overstaffed crew of mechanics or understaffed crew of electricians.
The following indicators can be defined:
% overtime = amount of time worked in overtime/total time worked
% time idle = amount of idle time/total time worked
% absenteeism = amount of time lost through absenteeism/total time worked
% time spent on training = amount of time for training/total time worked
Occasional periods of overtime are to be expected, especially when large repairs haveto be undertaken, but in general it is preferable that the percentage of overtime shouldbe kept to a minimum where possible to reduce costs. Idle time is a useful indicatorof staffing levels: a small amount of idle time is normal (ie, reserved for emergencytasks), large idle time figures may indicate overstaffing. Absenteeism throughphantom illnesses or unauthorised leave should be kept to a minimum: staffmotivation is a useful tool to help reduce its incidence. Training is crucial to theeffective transfer of technology and sufficient time for staff development needs to bemade available.
Materials Pi's
The proper functioning of O&M depends to a large extent on the availability of the(right) materials. The indicators defined below measure materials managementpractices:
The first three indicators reflect the financial importance of the materials componentin the O&M function, and may be of use in comparing the performance of similarsystems.
annual usage = annual amount of money spent on spares and materials
27

inventory value = value of inventory in MRO store
number of spare parts and materials in MRO inventory
The next set of indicators evaluate the MRO. The results obtained from theseindicators may be used to alter management practices, for example, by employingadditional personnel to check, store, and retrieve elements if the number of issues andreceipts recorded is very large.
number of issues
number of receipts
number of orders running
Frequent breakdowns may be the result of using badly repaired spares or spares thathave had excessive use. If the figure for new spares is low this may indicate that theequipment is easy to maintain or that new spares are not available. The followingindicators are measures that are used to determine how frequently spares are replaced.
number of new spares used
number of repaired spares used
Two other indicators can be used to measure service levels. The average lead-times isa measure of the service from the suppliers to the MRO, while the number ofstockouts is a measure of the service between MRO and O&M.
average lead-time « average time between placement of the order with the supplierand receipt of the order
number of stockouts
Work order control Pi's
Work order control allows the use of O&M resources to be effectively planned andapplied. In the following list, the first two indicators are used to evaluate the workorder system: too many small jobs are difficult to plan, as are too few large jobs. Themeasure for backlog indicates the future workload for O&M: an excessive backlogmay require the temporary hiring of contractors.
The operating costs indicators measure the effort spent on their respective category ofmaintenance work. Those for planning allow a large portion of O&M work to beplanned in advance.
number of jobs carried out (specified per type: equipment, distribution system,vehicles, building and grounds)
28

duration of jobs = average time spent on O&Mjob
backlog = amount of work overdue (days)
% of operating costs spent on preventative maintenance (PM)
% of operating costs spent on corrective maintenance (CM)
% of operating costs spent on modification jobs
% planned work = hours planned at the beginning of the week/hours to be workedduring week
% work according to plan = hours worked according to plan/total number of ordersplanned
29

Summary of Performance Indicators for Urban Water Supply
Service Pi's
water qualitywater supply
Equipment PVs
MTBFMTTRavailabilitynumber of failuresnumber of severe failurestop-ten critical list itemunaccounted-for water (UFW)% of UFW% fire hydrants in working condition% of consumer meters in working condition in consumer categories: domestic, industrial,commercial, institutional
Financial Pi's
YTD costcost component percentages: labour, materials, contractorsoperating revenue per capita servedoperating costs per capita servedoperating surplus (loss) per capita servedoperating costs per connectiontotal costs per connectionoperating costs per m3 water producedoperating costs per m3 water billed% of O&M asset expenditure to asset value% of expenditure for staff to O&M expenditureannual maintenance expenditure per new capital investmentannual maintenance expenditure per km of distribution meansworking ratio
Personnel Pi's
% overtime% idle time% absenteeism% time spent on training
30

Materials Pi's
annual usageinventory valuenumber of spare parts and materials in MRO inventorynumber of receiptsnumber of orders runningnumber of new spares usednumber of repaired spares usedaverage lead-timenumber of stockouts
Work order control Pi's
number of jobs carried out (specified per type: equipment, distribution system, vehicles,building and grounds)duration of jobsbacklog% of operating costs spent on progressive maintenance (PM)% of operating costs spent on corrective maintenance (CM)% of operating costs spent on modification jobs% planned work% work according to plan
31

PERFORMANCE INDICATORS FOR O&M OF RURAL WATERSUPPLIES
Introduction: The State of O&M
Problems of O&M are widespread, if not universal, with rural water supplies. If afunctioning management system for O&M is in place, then performance indicators canbe a valuable management tool for assessing the status of O&M. That is, carefullyselected performance indicators can highlight the successes and failures of the O&Mmanagement system. Indeed, a major problem to date has been setting up suchfunctioning management systems for the O&M of rural water supplies. In remoteareas, all too often the community is left to its own devices without the necessaryinitial or follow-up support from external agencies.
There are numerous reports which highlight problems with O&M of rural watersupplies. In many cases the reason is that there is simply no effective managementsystem in place; the necessary actions required to improve the situation may be fairlyobvious, but nevertheless difficult to implement. A few examples are quoted below.
Feacham et al (1976) in an ex-post evaluation of rural water supplies in Lesothocomment that,
'..(the Ministry) have until now had no policy for the maintenance of rural watersupplies. *
More recently, reporting on the Burkina Faso rural water supply programme, WASH(1986) state that,
'..the greatest failure of the project is the lack of a functioning pump maintenancesystem.'
Morrison-Maierle/Sheladia (1987) comment that in Lesotho,
'..the organisational plan for maintenance of handpumps has not beenimplemented.'
WASH (1985) report that in drought-stricken Ethiopia,
'Effective O&M, for all practical purposes, is non-existent.'
In the Solomon Islands WASH (1986) observed that,
'..plans to implement an effective maintenance programme had not been drafted.'
And so the list goes on.
Engendering the right 'cultural environment' (Koch, 199Í), in which staff appreciatethe very concept of O&M, is not a simple task, as illustrated by the followinganecdote from South Asia (Smith 1993).
32

'The likely consequences of a policy resulting in poor maintenance were outlined; theengineer was asked what would happen, as the scheme would eventually cease tofunction. He replied that (the government organisation) would then request further aidto rebuild the scheme.'
There are some success stories; Easton (1985) reports that in Malawi most pipebreakages were repaired in two days or less. The evaluation of the rural water supplyprogramme (WASH, 1986) observed that,
'..the division of maintenance responsibilities between the local communities and theRWS (Department of Water) is reasonable and effective. '
O&M Management Systems
There are a number of models for O&M management (WASH, 1993; Arlosoroff etal, 1987; WHO, 1992). The essential differences relate to the degree of involvementof the user community, the role of different public institutions and tiers ofgovernment, and the involvement of the private sector. The most useful documentreviewed in this respect was the report by WASH (1993), which includes a succinctoverview of maintenance management models and a series of field-based case studiesto illustrate these different models.
In summary, the models for O&M management range from highly Centralised oneswhich are entirely the responsibility of government, to community managed schemesowned, operated and maintained by a local community-based organisation. Inbetween these extremes there is a continuous spectrum of models involving thecommunity, the various tiers of government, and the private sector.
Arlosoroff et al (1987) identify three systems when considering community watersupplies using handpumps.
Village level maintenance has been epitomised by the concept of VLOM - originally'Village Level Operation and Maintenance', but more recently 'Village LevelOperation and Maintenance Management'. All routine inspections and minor repairsare carried out by trained people from the community, hereafter referred to ascaretakers. A mechanism for support, and the reporting and repair of serious faultsis put in place. There is minimum intervention from external agencies. Communitybased O&M management is hereafter referred to as VLOM.
Area-mechanic maintenance in which a trained mechanic who is locally based carriesout repairs, involving the communities to a greater or lesser extent.
Centralised maintenance systems use a team of trained technicians who travel outfrom a depot in order to effect inspection and repair of facilities. Communities havelittle if any input. It is most common for the public sector to carry out this service,although the private sector may be involved.
The traditional model of centralised management tends to be unresponsive and
33

expensive to operate (Arlosoroff et al 1987). In reviewing evaluation reports, forexample, SWECO (1978), Ashford and Miller (1979) and Agrell et al (1984) inBotswana; UNICEF (1984) in Uganda, it is clear that the institutional problemsassociated with centralised maintenance may run very deep. Recent trends haverecognised that adopting the VLOM approach may be more realistic than perseveringwith centralised maintenance through the attempted reform of institutions which vergeon the moribund.
At opposite ends of the spectrum lie the two distinct management approaches whichcould be encountered, namely VLOM and centralised management. Many of theperformance indicators discussed below can in principle be applied to either; however,when the performance indicators are evaluated, it is important to realise that twocategories of management response are possible.
1. Diagnose the cause of the problems and look for ways around bottlenecks in orderto improve the rating as measured by the performance indicators. This could applyeither to VLOM or to a centralised or partly centralised system which appears to befunctioning.
2. The particular management system in place may not be amenable to piecemealimprovements; if the problems run so deep, an alternative response is to conceptuallyoverhaul the management system, for example by moving away from a centralisedsystem towards VLOM or by looking to public-private sector partnerships.
Performance indicators are a useful management tool to assess the effectiveness ofan O&M management system; Box 13 describes posible criteria for assessing themanagement system. However, several of the documents quoted previouslyhighlight the total absence of just such a system. If it is obvious from first sightthat no system exists, then the assessment procedure whereby a list of performanceindicators are evaluated need go no further. If there is no management system forO&M, the first step is to put one in place.
Performance Indicator (PI) Selection
The basic principles of the methodology have already been outlined in theIntroduction and in the chapter on performance indicators for urban water supplies.The grouping of indicators used, namely
• Service• Financial• Personnel• Materials• Work order control
are the same as for urban water supply with the exception that no indicators areproposed under the heading equipment.
An attempt is made in the summary table at the end of this chapter to rank theperformance indicators into three categories (Office of Drinking Water, 1991) thereby
34

suggesting their relative importance.
Category 'A': indicates major performance deficiencies which should be thecentral focus of improvement programmes.
Category 'B ' : indicates factors which routinely contribute to poor performance.
Category ' C : indicates factors which contribute to a performance problem butonly have minor effects
It is understood that such classification is somewhat arbitrary without the support ofcase study or field investigation. However, the classification is incorporated as a 'firstattempt' and it is hoped to refine the system during the subsequent stages of theproject. It is suggested that an O&M assessment procedure concentrates on category'A' indicators. If serious problems are highlighted here, the probability is that theO&M management system is in crisis and performance improvement actions can beproposed on the basis of these indicators alone. It should not be necessary to proceedfurther to the 'B' and ' C indicators unless the objective is a full performance audit.Conversely if no serious problems are identified under category 'A', the assessmentprocedure should progress down the hierarchy of 'B ' and ' C indicator categories.
Service Pis: Number of supply points in working order
Most rural water supplies deliver water to public supply points, whether they bestandposts or handpumps. A simple count of the number of these which are notdelivering any water is a direct indication of the O&M status.
Functioning Supply = Number in working order/total numberPoints Indicator
This indicator also points to the actual benefits which the water supply providesbecause it is indirectly related to:
- the percentage of the population utilising the system;
- the per capita water consumption.
The objective is to increase the number of functioning supply points.
Service Pis: Reliability
A common measure of the reliability of a mechanical system is the 'mean time beforefailure' or MTBF, that is the length of time for which the system can be expected tooperate before some maintenance input is required to rectify problems which havecaused the system to breakdown. The 'mean time to repair' or MTTR is alsoimportant, because it reflects the average period for which the system will be out ofservice when it does break down.
35

In many rural water situations alternative water sources are rarely available; theconcepts of MTBF and MTTR need to be used to define reliability in a way whichreflects the most serious problems for people, namely the lack of availability of waterdue to breakdown (Arlosoroff et al, 1987). The term 'reliability' is defined as theprobability that the system will be functioning on any one day.
Reliability = Functioning time/total elapsed timeIndicator
This can be illustrated by an example.
The water supply to village 'A' has a surface water source with a stream intakestructure which silts up during the rainy season. The MTBF is 6 months and theMTTR is 1 week.
The water supply to village 'B' is using handpumps. The MTBF is 20 months andthe MTTR is 1.5 months.
In terms of MTBF, village 'B ' is judged to have a more 'reliable' supply than village'A'. However, in terms of reliability as defined above,
reliability for village 'A' = 26/27 x 100 = 96%
reliability for village'B' = 20/21.5 x 100 = 93%
Therefore according to the reliability indicator, village 'A' has a more reliablewater supply.
For a handpump supply, this is a relatively straightforward indicator as the problemswill be due to handpump malfunction. However, for piped supplies there are anumber of different components within the system which may cause failure.Examples are the intake structure, pipelines, storage reservoirs and public standposts;larger rural supplies may include simple treatment and electrically powered pumping.Different components will have different reliabilities; for example if a longer timehorizon were adopted for the simple example shown above, pipeline breakages maybecome more frequent and the overall system reliability may reduce.
Whilst the simple definition of reliability is a good indicator to apply to an overallsystem, it is sensible to apply it to individual components of more complex systems.This enables 'weak points' to be highlighted.
The reliability indicator may also point to problems with the system of reporting,diagnosing and repairing faults. The objective is to increase the reliability.
Service Pis: Water Quantity
It has long been established that the provision of an adequate quantity of water iscrucial if anticipated health benefits are to be achieved (Cairncross and Feacham,1993). Public supply points (handpumps and standposts) should be planned and
36

designed on the basis of the quantity of water to be delivered to a particularpopulation catchment. Lack of maintenance or inadequate operation can lead toreductions in the quantity delivered; conversely, assessing the quantity can indicateO&M problems.
A thorough evaluation ofhandpump performance is available (Arlosoroff et al, 1987).The discharge from a sample of handpumps can be measured by timing how long ittakes to fill a bucket of known volume; this can then be compared with therecommended rating as given by Arlosoroff et al.
In piped water supplies, a lack of flow may indicate leaks or breakages in thepipelines. The discharge can be measured as described above, and the valuesobtained should be compared with measurements taken immediately after the systemhas been commissioned. The problem in comparing the measured discharge with adesign value is that errors in hydraulic design are not uncommon and a standpost maynever be capable of delivering its so-called design flow.
A flow rating indicator can be defined.
Flow Rating - Present discharge/discharge after commissioningIndicator
If (as is commonly the case) the water supply system is not checked in this muchdetail after commissioning, the design flow or design rating could be used.
In addition, the pressure available at the standpost determines how much water isdischarged. The pressure of water issuing from a tap can be measured using a simpleBourdon pressure gauge which is connected to the tap using a short length of flexiblehose and an adjustable clip. Ideally, the residual pressure at the tap should not be lessthan 5 metres to ensure a reasonable flow. Unusually low pressure may indicateO&M problems such as breakages or leakage elsewhere in the system. However, itis important to note that low pressure can also result from the following.
1. Poor hydraulic design of the transmission and distribution pipelines, leading tozones of chronic low pressure.
2. The system has not been properly commissioned; valve settings need to be adjustedto ensure that the flow distribution throughout the system is satisfactory.
A pressure rating indicator can be defined.
Pressure Rating = Present pressure/pressure after commissioningIndicatorIf the residual pressure after commissioning is unknown, the design value of residualpressure should be used.
The objective is to increase both the flow and pressure rating indicators.
37

Service Pis: Short term interruptions to supply
The concept of reliability has been applied to describe the medium and long termperformance of a system in terms of the availability of water. A characteristic ofmany supplies is that they are discontinuous, with water only being delivered to thetaps for a few hours each day. Whilst this is a particular problem in urban areas, itcan also affect piped supplies in rural areas and be particularly acute in the dryseason. This can be measured by the supply continuity indicator.
Supply continuity = Average number of hours supply per day/24indicator
A high value for this indicator implies good continuity of supply. The problem whicharises is how to compute the average number of hours per day supplied; ideally itshould be an annual average using data from each day of the year in the differentsupply zones to account for weekly, monthly and seasonal variations in supply andconsumption. Efforts should be made to obtain a value for at least each month of theyear .
Service Pis; Water quality
At the planning and design stage the water source, whether it be ground or surfacewater, will usually be sampled and chemical and bacteriological parametersdetermined. A water quality surveillance programme (WHO 1985) should be able tomonitor and detect deterioration in water quality which will indicate O&M problems.It is important to realise that diagnosing problems in piped systems involvingtreatment and storage can be complicated.
Whilst sampling at public supply points gives an indication of problems within thesystem, it does not necessarily indicate the quality of water which is actuallyconsumed within the home. Family hygiene awareness greatly affects the way wateris stored and used in the home once it has been collected from the public supplypoint. Agrell et al (1984) comment on the results of a water quality survey in ruralcommunities in Botswana:
'The survey revealed that although the majority of the supplies deliveredbacteriologically safe water, water in containers in the home was usually grosslycontaminated.'
WHO (1983) suggests that the target for drinking water quality is zero E.Colibacteria. Recognising that such targets may take many years, it is stated that,'It is not unusual that a protected spring without chlorination contains 5-10 E.Coli per100 ml and in an unprotected spring the number might exceed 100.'
Depending on the frequency of water quality surveillance, a water quality indicatorcan be defined in terms of the number of indicator bacteria.
Water Quality = Number of samples > target number of E.Coli per 100 ml
38

Indicator
As with other performance indicators, the target number of E.Coli per 100 ml has tobe set locally, taking account of local water quality standards and objectives.
The objective is to reduce this indicator.
Financial Pi's
Lack of finance is one of the major reasons for the failure of traditional centralisedmanagement of O&M. Cost recovery from rural water supplies is poor or non-existent; the necessary public sector subsidies are often too low and too unreliable topermit this model to be effective. More appropriate VLOM models have tried toovercome this by developing a system which depends upon involvement and controlby the user community for the user community. In general, financial balance sheetsare not available for most rural water supplies, and traditional financial indicators canbe difficult to apply .
If the O&M system is centralised, the necessary information on costs should beobtainable. However, WASH (1992) comment on the difficulties of extractinginformation on levels of subsidy in order to calculate meaningful financial indicatorsfor O&M performance. A VLOM system may or may not pay the village caretakers,but a maintenance fund will normally be required in order to purchase spare parts.
Cost Indicator = Average O&M cost per user
Revenue Indicator = Operating revenue/population served
Cost Recovery = (Receipts + subsidies)/average O&M costIndicator
A major difficulty in defining a cost recovery indicator is that the average O&M costshould represent the money actually needed to carry out O&M. The problem withthe centralised approach is that a budgetary allocation may be made for eachhousehold or each community based on the expected income from user charges andsubsidies; in other words, whilst 'the books balance', the actual demand for O&M isnot met. This does not reflect the expenditure necessary to operate and maintain thesystem; the result is a spiralling deterioration of the assets. The initial problem hereis that whoever is undertaking the performance assessment needs to be able to makean intelligent guess at the actual average O&M cost which is required. Priority-basedbudgeting is potentially an important tool in this respect.
If the cost indicator points to a very poor performance in a centralised system, it isappropriate to consider an alternative management system more along the lines ofVLOM.
39

Personnel Pi's
The availability and deployment of human resources are a key component in O&Mmanagement. Whilst 'shortage of staff is often quoted anecdotally as a reason forpoor O&M performance, it may be that the deployment of existing staff is inefficient.Ashford and Miller (1979) comment on pump operators in Botswana:
'These pumpers would be underemployed, in that for long periods each day theywould be doing nothing except watching an engine run.'
The personnel requirements will be substantially different for the VLOM andcentralised management approaches. For a VLOM system, the crucial issue is thata functioning water committee exists for each community water supply.
VLOM Personnel Indicator = No. of systems with functioningcommittees/total no. of systems
One possible measure of this is to check that caretakers have been identified for thecommunity water supplies. This gives a primary indication of whether or not thesystem is working according to its original concept.
The objective is to increase this indicator. Similar indicators can be applied to thedifferent levels of the VLOM system; for example, there might be an 'area mechanic'responsible for a number of water supplies. Other performance indicators e.gfunctioning supply points and reliability can be used to point to the effectiveness ofthe personnel involved.
If there are centralised mobile maintenance teams, a prerequisite is that they aremobile. The percentage of serviceable vehicles on the road gives an indication of thepotential effectiveness of mobile maintenance teams.
Maintenance team indicator = No. of vehicles on-the-road/no. ofvehicles in fleet
The objective is to increase this indicator. Personnel indicators for centralisedsystems depend upon the size, complexity and spatial distribution of the watersupplies.The effectiveness of staff, whether under a VLOM or a centralised system, dependsupon the level of skill and training. For a VLOM system the different categories ofpeople who require training include: local caretakers; operators; and area mechanics.There is evidence that women make very effective caretakers (Arlosoroff et al, 1987)and it is suggested that the VLOM training indicator be evaluated by gender(PROWWESS, 1990).
Training Indicator - No. VLOM personnel trained in eachcategory per community (VLOM)
40
For a centralised system,
Training Indicator = No. of skilled staff trained/no, of skilled staff(Centralised)
This takes no account of the relevance or quality of the training, and as part of aninstitutional development programme, the issue of human resource developmentshould be analysed in detail.
With centralised systems, the percentage of absenteeism, the percentage of idle timeand the percentage of overtime worked can also be used as indicators of effectiveness,providing that a good record keeping system exists.
Materials PPs
The purchase, delivery and storage of materials for O&M of water supplies is anintegral part of the O&M management system, whether it be VLOM or centralised,and it should be subject to performance checks. For example, the delivery time forspare parts may constitute a 'critical path' in terms of effecting repairs.'Accessibility' of spares can be defined as the mean time from identifying the needfor spare parts or materials to their arrival in the right place. In a VLOM system theprocess might involve the trained caretaker diagnosing the need for a spare, travellingto the nearest supplier and returning with the required part; this may require morethan one journey if parts are out of stock. For a centralised system, accessibility islargely dependent on the stores procedures.
Spare parts accessibility indicator = Mean time for arrival of identifiedspares/materials
The objective is to reduce this indicator. Several other indicators can be used toassess performance.
1. Number of outstanding repairs due to lack of spares.
2. Number of outstanding materials orders.
3. Number of items out of stock.
The objective is to reduce all three indicators.
If very few spare parts are used, this suggests that O&M are not being carried out tothe extent which is required. For example, Arlosoroff et al (1987) report that forhandpump systems the average period between actions necessary to repair breakdownsor correct poor performance is six months. This average encompasses a widevariation depending upon pump type and service conditions.One possible indicator would be
Spare Parts = Number of spare part requisitions per supply per year
41
This indicator is rather crude and difficult to define precisely; however, based on thefindings of Arlosoroff et al (1987), if for example a handpump scheme hadrequisitioned no spare parts in four years, it might reasonably be assumed that it isnot fully functional.
Work Order Control PPs
Any parts of the O&M management system which perform a service, for example amobile maintenance team, or a VLOM area mechanic need to function to maximumefficiency. Effective control of their work is essential to avoid unnecessary delays inresponding to breakdowns.
Poor performance may also point to factors which are more far reaching. Forexample in centralised systems, inadequate vehicle maintenance is often a seriousproblem; in VLOM systems, the key personnel have to be equipped with appropriatetools which are in working order. The number of visits to site which are required toeffect a repair is likely to be a function of the skill and competence of the workers.Incorrect problem diagnosis can waste a lot of time, particularly with centralisedsystems dealing with water supplies which are widely dispersed.
Work Order Control - Backlog of jobsIndicator
The objective is to reduce this indicator.
Other indicators which relate more specifically to centralised systems include thenumber of employees per job and the average duration of jobs; these are describedmore fully in the chapter on performance indicators for urban water supplies
Health Indicators
Health indicators are not included in the recommended indicators for assessment ofthe status of O&M. Whilst many investments in improved water supply are
42

predicated on health benefits, direct and specific linkages between improved watersupply and better health status are notoriously difficult to demonstrate conclusively(Bradley et al, 1992). Additional interventions such as improved family hygiene andsanitation provision are crucial in fully realising potential health benefits. Becausehealth indicators are difficult to interpret in terms of water supply only, they are notincluded in the proposed list of indicators.
43

Summary of Performance Indicators for Rural Water Supply
The following table summarises the preceding discussion of performance indicators.Each indicator is categorised as 'A', *B\ or 'C which suggests its relative importanceas defined in the Introduction.
Category 'A': indicates major performance deficiencieswhich should be the central focus of improvementprogrammes.
Category 'B': indicates factors which routinely contribute topoor performance.
Category "C: indicates factors which contribute to aperformance problem but only have minor effects
INDICATOR
ManagementSystem(0)
Functioningsupply points
Reliability
Spare partsAccessibility
Cost
OperatingRevenue
Cost Recovery
DEFINITION
System in existence andbeing followed
Number in working order
Total number
Functioning time
Total elapsed time
Mean time for arrival of idenspares/materials
Average O&M cost per user
Operating revenue
Population served
Receipts + subsidies
Average O&M cost
xlOO
xlOO
CATEGORY
A
A
A
xlOO
44

VLOM Personnel
Maintenance team
Supply continuity
Row Rating
Pressure Rating
Water Quality
Training (VLOM)
Training(Centralised)
Materialsand spares.
No. of systems withfunctioning committees
Total No. of systems
No. of vehicles on-the-road
No. of vehicles in fleet
xlOO
xlOO
Average No.hours daily supply
24
Present discharge
Discharge aftercommissioning
Present pressure
Pressure aftercommissioning
xlOO
xlOO
% samples > target number Rcoli per 100 ml
No. VLOM personnel trained in eachcategory per community
No. of skilled staff trainedxlOO
Work Control
No. of skilled staff
No.outstanding repairs due tolack of spare parts
Number of outstanding materialsorders
Number of items out of stock.
Number of spare part requisitionsper water supply per year
Backlog of jobs
B
B
B
B
B
B
B
B
C
B
45

RECOMMENDATIONS FOR FURTHER WORK
Framework
The project 'Development of tools for the assessment ofO&Mstatus of water suppliesin lesser and least developed countries ' was originally conceived in three phases. Inessence, this report constitutes the output from Stage 1 of the original conceptionwhich is described below.
Stage 1: Literature review
See Terms of Reference for this project
Stage 2: Testing of O&M Assessment Procedure using Case Studies
During stage 2 the testing and the consolidation of the O&M assessment procedurewill be carried out using checklists and questionnaires which allow a rapidcomparative analysis. The assessment procedure will be applied to a limited numberof selected case studies which will be representative of different O&M practices. Afield investigation of operation and maintenance in selected countries/projects will beundertaken.
An interregional forum of executive sector professionals and decision makers fromthe countries and regions involved in the project will be convened to review results,evaluate experiences gained so far, and provide feed-back to the project in its furtherimplementation.
The expected output of this project component is a draft Final Report with anelaborated O&M assessment procedure with indicator parameters measuring O&Mperformance in water supply systems.
The duration of this stage is estimated at 6 months.
Stage 3: Application of Assessment Procedure and Evaluation
A final evaluation of the O&M assessment procedure will be carried out through itsapplication to a limited number of regions, chosen because of their great needs andthe high level of investment in water supply facilities.
The results obtained will be reviewed by the Operations and Maintenance WorkingGroup, who will test and evaluate the final results in a number of countries, andpropose future actions.
The duration of this stage is estimated at 12 months.
An organisation chart, implementation charts and schedules are shown in Annex 2.
46

Expected Project Output
By the end of the project, the following outputs are anticipated.
1. A manual and general guidelines for O&M assessment of water supplies in LDC'sapplicable at regional, country and project level for sector professionals involved inthe management of O&M of water supplies.
2. A set of annotated checklists and parameters for O&M performance evaluation.
3. Through the above activities, many sector professionals in both the public andprivate sector as well a government officials in LDC's will have been madeincreasingly aware of the importance of operation and maintenance.
4. Tangible improvements in O&M performance may have been achieved followingthe assessments and feed-back which have been carried out as part of this project.
The overall benefit of the project will be a major contribution to improved sectorperformance and better standards of service at lower cost; consequently, greaterservice coverage should be possible. The project will contribute to the long-termsustainability of water and sanitation services.
It is essential that the procedures and tools resulting from the project meet therequirements of those who will use them, and that the information generated will forma sound basis for policy decisions and planning. Therefore, the project will onlygenerate the expected benefits if national institutions and ESA's give concrete supportto the project and contribute to the outputs.
47

REFERENCES
—, Soft Options in Sewer Renovation, World Water and Environmental Engineer,April, 1992, pp 12-14.
Agrell J-O., Schultzberg G., and White R., Evaluation of the Village Water SupplyProgramme in Botswana, SIDA, 1984.
Alaerts, G., Ombregt, J. P. and Van Haute, A., Waterzuivering en Waterconsumptiein Derde-Wereldlanden, Het Ingenieursblad, Vol. 54, no 7, 1985, pp 371-376.
Arlosoroff S., Tschannerl G., Grey D., Journey W., Karp A., Langeneffer O. andRoche R., Community Water Supply - the Handpump Option, World Bank,Washington DC, 1987.
Ashford R. and Miller J., SIDA Report on Needs to Improve District Councils'Capacity to Maintain and Operate Village Water Supplies, Ministry of LocalGovernment and Lands, Botswana, 1979.
Austin, J.H. and Bachelor, D., Trainee Involvement in the Training Process, J.AWWA, Vol. 73, 1981, pp 299-303.
Austin, J. H., and Jordan, J. K., Operation and Maintenance of Water Systems inDeveloping Countries, J. AWWA, Vol. 79, 1987, pp 70-77.
Barrett, A.D. and Pescod, M.B., Water Supply in Developing Countries: Improvingon Current Practice, Journal of the Institutions of Water Engineers and Scientists,Vol.36, no 5, 1982, pp 323-342.
Bornstein, C.T. and Rosenhead, J., The Role of Operational Research in LessDeveloped Countries: A Critical Approach, EJOR, Vol.49, 1990, pp 156-178.
Bourne, P.G., Water and Sanitation for All, in Water and Sanitation Economic andSociological Perspectives, Academic Press, New York, 1984.
Bradley D., Stephens C , Harpham T., and Cairncross S., A Review ofEnvironmental Health Impacts in Developing Country Cities, Urban ManagementPaper 6, The World Bank, Washington DC, 1992.
Buttery, L.M., New Survey of US Maintenance Costs, Hydrocarbon Processing,Vol. 58, 1978, pp.85-90.
Chitnis, B. V., Transfer of Maintenance Technology: (I) Choice of Technology,Maintenance Management International, Vol. 3, 1982, pp 11-16.
Christer, A.H., OR and Maintenance Modelling: Tutorial Notes, ORSA/TIMSMeeting, Buenos Aires, 1987.
De Groóte, P., Industrial Maintenance in Developing Countries, Maintenance
48

Management International, Vol. 7, 1988, pp 121-129.
De Groóte, P., Guide for Action in the Field of Human Resources Development forIndustrial Maintenance in African Countries, UNIDO report, Nairobi, 23-27 June,1986.
De Vries Robbe, A.A.C., Wie is er Bang van een Checklist ?, TechnischeBedrijfsvoering, Vol. 2, 1984, pp 52-56.
Dev, H. K., Transfer of Maintenance Technology: (II) The Need of Asian Countries,Maintenance Management International, Vol. 3, 1982, pp 17-22.
DGS International, Checklist, Maintenance Consultants (Industrializing Countries),Ghent (Belgium), 1987.
Easton A., Pipe Breakage Analysis of the Rural Water Supply in the Central Region,Kawinga and Zomba Projects 1983-84, Water Department, Ministry of Works andSupplies, Lilongwe, Malawi, 1985.
Feacham R., Lesotho Village Water Supplies: an Ex-Post Evaluation, London Schoolof Hygiene and Tropical Medicine, 1977.
Fountain, B., and Shipmann, H., Guidelines for Development of Urban Fringe andRural Village Projects in Developing Countries, Technical Report, Urban ResourcesConsultants (Washington), 1979.
Gavin, J., Darling, J., Game, R.C., Laport, R. and Stromberg Ch. PerformanceIndicators for Selected Water Supply and Sanitation Utilities in Ecuador. WASHField Report No. 376 (1992).
Hibi, S., How to Measure Maintenance Performance, Nórdica, Hong Kong, 1977.
Husband, T., Maintenance Management and Terotechnology, Saxon House,Farnborough, 1978.
Janssens J. G., Operation and Maintenance of Water Systems, in: Water Supply andSanitation - Beyond the Decade, Asia and Pacific Regional Consultation, June 1990,Ed. Asian Development Bank, 137-154, 1990.
Janssens J. G., McPherson H. J., and Hueb J., Operation and Maintenance forSustainable Improved Water Supply and Sanitation Services, Forum of the WaterSupply and Sanitation Collaborative Council, Oslo, Norway, 18-20 September 1991.
Janssens J. G., Issues and Necessary Components of Successful O&M for Better Useof Existing Assets in Water Supply and Sanitation, Water Malaysia '92 Conference,8th ASP AC- IWSA Regional Conference and Exhibition, Kuala Lumpur, Malaysia,26-30 October 1992.
Jardine, A.K.S. (Ed.), Operational Research in Maintenance, Manchester Univ.Press, London, 1970.
49

Jordan, J.K., Establishing a Maintenance Program, J. AWWA, Vol. 79, 1987, pp 32-36.
Jordan, J. and Wyatt, A. Estimating Operations and Maintenance Costs for WaterSupply Systems in Developing Countries. WASH Technical Report No. 48 (1989).
Keller, R.T. and Chinta, R.R., International Technology Transfer, The Executive,Vol.4, no2, 1990, pp 33-40.
Kelly, A., Maintenance Planning and Control, Butterworths, London, 1984.
Kelly, A., Maintenance Systems Auditing - An Aid to Effective MaintenanceManagement, Maintenance, Vol. 3, no 3, 1988, pp 6-12.
Krishnamurthy, V., Maintenance Problems in Developing Countries and InternationalCooperation, Terotechnica, Vol.2, 1987, pp 223-226.
Larrick, Ch. L. and Adams, L. W., Developing Nations Face Problems in Water andWastewater Management, Water & Sewage Works, Vol. 125, no 6, 1978, pp 62-63.
Lijklema, L. and Tyson, J.M., Urban Water Quality: Interactions Between Sewers,Treatment Plants and Receiving Waters, Water Science Technology, Vol. 27, no 5-6,1993, pp 29-33.
Lohani, B.N. and Thani, N.C., Water Pollution Control in Developing Countries,Conference Proceedings (Bangkok), 1978.
Luck, W.S., Now You Can Really Measure Maintenance Performance, FactoryManagement, Vol.114, 1956, pp 81-86.
Luxhoj, J. T. and Tao, P., Measuring the Productivity of Construction MaintenanceOperations, J. AWWA, Vol. 82, 1990, pp 35-39.
Mann, L., Maintenance Management, Lexington Press, Lexington, 1983.
Mann, L., Impact of Maintenance as Chemical Plant Production Costs, MaintenanceManagement International, Vol.7, 1988, pp.77-84.
Marcelis, W.J., Onderhoudsbesturing in Ontwikkeling, Kluwer, Deventer, 1984.
Marcelis, W.J., Onderhoudsbesturing op Maat, Kluwer, Deventer, 1979.
Marcelis W.J., Checklist Onderhoudsbesturing, Bedrijfsvoering, Vol. 3,1979, pp 14-17.
McGarry, M.G., Matching Water Supply Technology to the Needs and Resourcesof Developing Countries, Water Resources Journal, no 154, 1987, pp 11-19.Morrison-Maierle/Sheladia Consulting Engineers, Lesotho Rural Water andSanitation Project Sixth Annual Report, Maseru, Lesotho, 1987.
50

Muyibi, S.A., Planning Water Supply and Sanitation Projects in DevelopingCountries, J. Water Resources Planning and Management, Vol. 118, no 4, 1992, pp351-355.
Nakajima, S., Transfer of Maintenance Technology: (III) The Role of ProfessionalInstitutions, Maintenance Management International, Vol. 3, 1982, pp 23-25.
Newbrough, E.T., Effective Maintenance Management, McGraw-Hill, New York,1967.
Neyret, G.M.J., Some Considerations Regarding the Application of ModernTechnology, Terotechnica, Vol. 2, 1981, pp 135-137.
Niebel, B., Engineering Maintenance Management, Marcel Dekker, New York,1985.
Noiret, A., Evaluation de l'Efficacité de la Maintenance, Conférence sur l'Entretiendans les Industries des Procédés, Louvain-la-Neuve, November 1978.
Office of Drinking Water, Ed. Optimizing Water Treatment Plant PerformanceUsing the Composite Correction Programme. Office of Technology Transfer andRegulatory Support, Office of Research and Development, U.S. EnvironmentalProtection Agency, EPA/625/6-91/027 (1991).
Pickford, J., Sewage Treatment in Developing Countries, Water Pollution Control,Vol. 76, no 1, 1976, pp 65-66.
Pintelon, L. and Van Wassenhove, L., A Maintenance Management Tool, OMEGA,Vol. 18, no 1, pp 59-70.
Pintelon, L., Performance Reporting and Decision Tools for MaintenanceManagement, Unpublished Ph.D. thesis, Catholic University Leuven - Dept. ofIndustrial Management - Leuven, Belgium), May 1990.
Pintelon, L., Maintenance Management, Course Text Industrial ManagementDivision, K.U.Leuven, 1992.
Pintelon, L.M., and Gelders, L.F., Invited Review: Maintenance Management:Decision Making, EJOR, Vol.58, 1992, pp 301-317.
Pintelon L and Gelders L., A Challenge for the Maintenance Management in the90's (in dutch) Het Ingenieursblad, No. 6-7, pp 43-51.
Priel, V.Z., Twenty Ways to Track Maintenance Performance, Factory, Vol.56,1962, pp.88-91.
PROWWESS, Participatory Evaluation, UNDP/WHO/World Bank/UNICEF, Geneva,1990.Pulat, B.M., and Alexander, D.C. (eds), Industrial Ergonomics: Case Studies,Industrial Engineering and Management Press (HE), Norcross-Georgia, 1991.
51

Roark, Ph., Hodgkin, J. and Wyatt, A. Model of Management Systems for theOperation and Maintenance of Rural Water Supply and Sanitation Facilities. WASHTechnical Report No. 71 (1992).
Schiller, S., Organizational Learning for Local Control of Discretionary CostCenters, ífT-Gõthenburg School of Economics, Gõtheborg (S), 1989.
Schulz, C. R. and Okun, D. A., Surface Water Treatment for Communities inDeveloping Countries, Wiley, 1984.
Simpson, J. R., Water Pollution Control in Developing Areas: Problems and Needs,Water Science Technology, Vol. 14, no 9-11, 1982, pp 1353-1373.
Smith M.D., Personal Communication, 1993.
SWECO Consulting Group, Botswana Rural Water Supply, SIDA, Stockholm,Sweden, 1978.
UNICEF, Joint Mid-Implementation Report on the Assisted Rural Water SupplyProject Uganda, Kampala, Uganda, 1984.
Union Africaine des Distributeurs d'Eau - UADE. Plan de Maintenance. RapportVADE, Abidjan (Cote d'Ivoire) (1988).
United Nations Centre for Human Settlements - UNCHS (HABITAT). DiagnosticAssessment of Operations and Maintenance Problems - Guideline Framework.Nairobi (Kenya) (1989).
United Nations Centre for Human Settlements - UNCHS (HABITAT). Overview ofIssues and Strategic Options in Operations and Maintenance - Analysis andSynthesis Report. Nairobi (Kenya) (1989).
United Nations Centre for Human Settlements - UNCHS (HABITAT). TheMaintenance of Infrastructure and its Financing and Cost Recovery. Nairobi (Kenya)(1989).
Van Brussel, H., Onderhoudschecklists, Doelmatige Bedrijfsvoering, Vol. 2, no 5,1990, pp 4-8.
van Vuuren, L. R. J. and Hoffmann, J. R. H., Operational Achievement of DrinkingWater Quality, Water Pollution Control, Vol. 77, no 1, 1978, pp 39-44.
Water and Sanitation for Health (WASH), Models of Management Systems for theOperation and Maintenance of Rural Water Supply and Sanitation Facilities,Technical Report 71, 1993.
Water and Sanitation for Health (WASH), Performance Indicators for SelectedWater Supply and Sanitation Utilities in Equador, Field Report 376, 1992.
Water and Sanitation for Health (WASH), Estimating Operations and Maintenance
52

Costs for Water Supply Systems in Developing Countries, Technical Report 48,1989.
Water and Sanitation for Health (WASH), Development of a National Policy for theMaintenance of Rural Water Supply Systems in Solomon Islands, Field Report 234,1988.
Water and Sanitation for Health (WASH), Malawi Self-Help Rural Water SupplyProgramme: Final Evaluation, Field Report 186, 1986.
Water and Sanitation for Health (WASH), Emergency Water Supply and SanitationAssistance to Ethiopia - Operations and Maintenance Aspects, Field Report 146,1985.
WHO-CWS, Proc. Advisory Committee of the Operations and Maintenance WorkingGroup, WHO/CWS/91.6, Feb. 1991.
WHO-CWS, Proc. Operations and Maintenance Working Group, Vols 1 & 2,WHO/CWS/90.14 & 90.15, 1990.
WHO-CWS, Proc. Operations and Maintenance Working Group, June 1993.
WHO, Guidelines for Drinking Water Quality, Vol. 3 Drinking Water QualityControlin Small Community Supplies, Geneva, 1985.
WHO, Minimum Evaluation Procedure, Geneva, 1983.
Winter, J.L., Zakrzewski, R.S. and King, R.E. (eds), Maintenance ManagementQuality Production, Society of Manufacturing Engineering, Dearborn (Michigan),1987.
53

GLOSSARY
Accounts receivable. Money owed to the utility, usually for a service billed but forwhich income has not yet been received.
Condition based maintenance (CBM). Maintenance to be activated when a valueor given system parameter reaches or surpasses a preset value.
Corrective maintenance. Activities in response to breakdown, or detected defects,or simply something when it breaks down.
Current assets. Liquid assets plus the value of inventory if parts and materials.
Current liabilities. Credit extended to the authority, including long and short termloans, and accounts payable.
Design-out maintenance (DOM). The focus is on improvements in the equipmentdesign in order to simplify maintenance operations and/or increase reliability.
Fixed assets. The present value of the utility's physical assets.
Failure based maintenance (FBM). Maintenance to be carried out only onoccurrence of failure or breakdown.
Liquid assets. The sum of cash on hand and debts owed to the utility, includingaccounts receivable.
Operating costs. The sum of all costs expended for:
(i) materials, energy, chemicals and parts(ii) contracts for services and repairs(iii) personnel(iv) taxes
Operating costs do not include depreciation or the costs of capital constructionprojects including debt service for such projects.
Operating revenue. Income received from billing for the provisioning of water prorata of m3.
Opportunity based maintenance (OBM). When a component fails, the opportunitymay be taken during the ensuing shutdown to carry out preventative maintenanceon other components which have not yet failed.
Periodic maintenance. Activities normally carried out at intervals of more than oneyear, often as part of large scale programmes of predetermined cycles.
Preventative maintenance. Activities aimed at interruption of the deteriorationprocess at an early stage based on systematic, prescheduled programmes ofproviding early detection of beginning effects.
54

Rehabilitation. Activities carried out to correct major defects, wear and tear, inorder to restore a facility to a good working condition without significantlyexpanding beyond its originally designed function or extent.
Routine maintenance. Preventative and corrective maintenance normally not ofmajor scale and typically carried out one or more times every year.
Total assets. The sum of fixed assets, current assets and work in progress.
Total costs. The sum of operating costs, debt services and other costs not directlyrelated to the utility's operations. Depreciation should be considered separatelysince it does not require current expenditure.
Total revenue. The sum of operating revenues and income from grants, subsidies,or other sources not directly related to the provision of the utility's loans.
Use based maintenance (UBM). Time based or fixed period maintenance.
55

LIST OF ABBREVIATIONS
CB Control boardCM Corrective maintenanceDR Detailed reportHRM Human resource managementMMIS Maintenance management information systemMMT Maintenance management toolMRO Maintenance, repair and operating suppliesMTBF Mean time before failureMTTR Mean time to repairO&M Operations and maintenanceOR Operational researchPI Performance indicatorPM Preventative maintenanceRCM Reliability centred maintenanceRFT Right first timeTPM Total productive maintenanceUFW Unaccounted for waterWS&S Water supply and sanitation
56

ANNEX 1
Background to the Project
The following background notes are taken from the report of the Working Group onOperations and Maintenance, WHO, Geneva, June 1993.
Project Title: Development of Tools for Assessment of Operation ana Maintenanceof Urban and Rural Water Supply
As a response to the lack of sufficient guidelines on how to assess operation andmaintenance services in both urban and rural areas, the Operation and MaintenanceWorking Group concurred that the development of tools and methods for this purposeshould facilitate the work of those responsible for project evaluation.
The ultimate beneficiaries of the methods and tools for the assessment of O&M statuswill be the projects conducted by external support agencies and the O&M servicesunder the responsibility of the water supply and sanitation institutions in developingcountries. The methodology will have a considerable degree of flexibility toaccommodate the special needs of the different potential users. Two sets of tools andguidelines will be prepared to cover the specific needs of urban and rural operationand maintenance respectively. WEDC and IWSA are involved in the conducting ofthis activity.
57

ANNEX 2
- Recommendations for future work: flow charts and schedules.
- A checklist of sample questions used in the audit of O&M.
58

A checklist of sample questions to be used in auditing O&M
I. BACKGROUND
1.1 Developing country
PopulationClimateEconomic situationUrban area (city, small city, slums, etc)Political situation and national institutions (e.g., attitude towards WS&Stechnology)Host/donor relationshipsLocationInfrastructure (accessibility, logistics, etc)
1.2 WS&S system
Plant site (distance from city, access roads, size, provision for futureexpansion)Facilities (laboratories, storage for materials, and chemical products, etc)Unit processes, storage and transportation (+ equipment)Capacity (design capacity, number of customers served, demand pattern,water quality, charging principles, etc)Technology (appropriateness, safety, flexibility, etc)Interaction between sewers, treatment plants, and receiving waters
The answers to some of these questions will be qualitative, others quantitative.Performance indicators to be used are: (see Gavin et al (1992) and Office ofDrinking Water (1991))
Operational area indicators:
total population density, i.e., total population in service area/sq. km of servicearea
coverage in service area, i.e. population served by utility/total population inservice area
% of domestic consumption, i.e. domestic consumption (m3)/total waterconsumption (m3)
% of metered production i.e., metered production (m3)/total production (m3)
water production per connection, i.e. total production (mVday)/number of serviceconnections
served population connected i.e., persons served directly by pipeline/total
59

population in service area
number of fire hydrants
% of metered connections, i.e. metered connections/total connections
% of metered consumption, i.e. metered consumption/total consumption
(domestic) consumption per capita served, i.e., total consumption(Utres/day)/population served (litres/capita/day)
consumption per water connection, i.e., total consumption/water connections
length of distribution mains in km per 1000 urban population
meters of pipeline per connection, i.e. total length (meters) of distributionpiping/total number of connections
persons per connection, i.e., persons served directly by pipeline/total number ofconnections
Personnel related indicators:
water production per employee, i.e. water production/number of employees
wastewater collection per employee, i.e. wastewater collected/number ofemployees
Financial indicators:
(Refer to glossary for explanation of terms)
operating revenue per m3 produced, i.e. annual operating revenue/populationserved
total revenue per capita served, i.e. total annual revenue/population served
operating revenue per connection, i.e. annual operating revenue/number ofconnections
total revenue per connection, i.e. total annual revenue/number of connections
ratio of operating revenue to total production, i.e. annual operating revenue/totalwater production (mVday)
operating revenue bulled per m3 water, i.e. annual operating revenue/billed waterproduction (mVyear)
60

total costs per capita served, i.e. total costs/population served
total surplus (loss) per capita served, i.e. (total revenues - total costs)/populationserved
total costs per connection, i.e., total costs/number of connections
total asset values
debt service as % of operating revenue, i.e. debt service/operating revenues
fixed assets per capita served, i.e. fixed assets/population served
quick ratio, i.e. liquid assets/current liabilities
current ratio, i.e. current assets/current liabilities
operating ratio, i.e. total costs/total revenues
cash coverage of total costs (days), i.e. cash assets (total costs/365)
cash and accounts receivable coverage of total costs (days) i.e. liquid assts/(totalcosts/365)
asset turnover i.e. total revenue/total assets
average collection period (days) i.e. accounts record turnover/(annual billedrevenue/365)
II. MANAGEMENT
II. 1 O&M environment
(a) Service industry
is there a definition of the objectives of the WS&S?is there a long term strategy concerning the WS&S?
(b) O&M responsibilities
what are the tasks of the O&M department (and their relative importance)concerning equipment, distribution systems, buildings and ground,vehicles, etc?how does the O&M department fit in to the organisation chart of theWS&S?is there a detailed organisation chart of the O&M department, includingnumbers and skills?
61

(c) O&M philosophy
is O&M a major concern to management?are there any clear ideas about O&M?are concepts like terotechnology known and/or implemented?
II.2 O&M management
(a) Objectives
state the objectives of O&Mare these objectives specific or general?if these objectives are specific, are they attainable?how is the budget for O&M determined?what aspects are considered in this budget?how is the budget follow-up organised?
(b) Planning
explain the strategic planning procedureexplain the tactical planning procedureexplain the operational planning procedurehow much planning is there: none/a little/some/a lot/nearly all activities?is the current planning satisfactory?can work load (and potential backlog) be estimated?are there any support tools for the planner?is there a planner?
(c) Resources
Personnel
how many people work in O&M?what is their workload (number and duration of jobs, idle time...)?are the educational qualifications of personnel satisfactory?can additional training programmes be easily organised?how much of the WS&S system depends on locals and/or foreigners?are the employees motivated?is personnel rotation low or high? Why?are there any socio-cultural aspects making O&M difficult?what are the skills of the personnel?how are new employees trained (on-the-job, formal classes)?
Repair shop
62

is a repair shop available in the WS&S system?if yes, is it well equipped?are there any problems concerning personnel or materials here?
MRO store
Data
how many parts are kept in stock?what is their value?is it possible to perform an ABC analysis?what about item repairability, criticality?how much dependence on outside suppliers is there for spare part supply?what problems are most important for spare part supply?
is historical information on O&M jobs and equipment behaviouravailable?if yes, is this information complete, reliable, and readily available?what information is kept for management purposes?can employees be motivated to collect data?is a good equipment documentation system available?is a work order system used?are job descriptions available?
(d) Performance
is performance evaluated on a regular basis?who evaluates O&M performance?which performance indicators and reports are used?is there a performance follow-up procedure?
II.3 Management tools
(a) MMIS
is there a (computerised) management information system?if not, why not (cost, effectiveness)?if yes, what kind of system, what modules?
(b) Operational research techniques
are there any optimisation techniques used?is data available?is there any interest for such decision support models?
63

are there any design review methods used?are there potential application items?if it is decided to use a given method, is there knowledge in-house toperform it?does O&M have any impact on equipment design or purchase?if yes, how and how much?if not, who has?
(c) Human resource management
is there a HRM policy?what HRM activities are organised?who is in charge of HRM?
64