tools and techniques useful in quality planning, assurance, and
TRANSCRIPT
1-800-COURSES www.globalknowledge.com
Expert Reference Series of White Papers
Tools and
Techniques Useful
in Quality Planning,
Assurance, and
Control
Copyright ©2016 Global Knowledge Training LLC. All rights reserved. 2
The Tools and Techniques Useful in Quality Planning, Assurance, and Control Tim McClintock, Global Knowledge Senior Instructor
Introduction The Project Management Institute’s (PMI’s®) best practices related to quality are all founded firmly in:
the quality theories of W. Edwards Deming, Joseph M. Juran, and Phillip Crosby;
International Organization for Standardization (ISO) approach to quality management; and
well-known quality approaches such as total quality management (TQM), Six Sigma, voice of the
customer (VOC), and failure mode and effects analysis (FMEA) design reviews.
Modern quality management and project management are complementary, they both emphasize customer satisfaction. Quality leads to customer satisfaction. The main objective in quality management is making sure that the project meets the needs that it was originally created to meet—nothing more, nothing less. In other words, to ensure quality you must meet the needs of the stakeholder. Meeting or exceeding requirements, on the other hand, is not part of project quality management. According to the PMBOK® Guide, quality is “the degree to which a set of inherent characteristics fulfill requirements.” The project manager and project management team have a special responsibility to balance quality and grade (a category or rank assigned to products or services having the same functional use but different technical characteristics) to ensure that quality expectations are met. This means that it might be possible and reasonable to have a quality, low-grade product, but it is never acceptable to have a low-quality product. At the beginning of the project, requirements are determined with the stakeholders. These requirements become the foundation for the work of the project. After that, the project manager’s job is to ensure that the agreed work is done, no extras included. Quality is not about giving the customer extras, which are often based on possibly erroneous perceptions of what you believe the customer wants. These extras add time, possibly costs, and other impacts to a project, but do not always result in increased customer satisfaction. Project quality management consists of three major processes:
1. Plan quality management: identifying the quality requirements and standards for the project and
product (planning process group).
2. Perform quality assurance: auditing the quality requirements and quality control results to ensure that
appropriate quality standards are used (executing process group).
3. Control quality: monitoring and recording the results of quality activities to assess performance and
recommend necessary changes (monitoring and controlling process group).
The definition of quality is central to understanding these three processes. To be able to define quality, you need to be clear about the meaning of the following terms:
Validation: assurance that the product meets the agreed-upon needs
Verification: compliance with requirements
Precision: repeatable measures in a tight grouping
Copyright ©2016 Global Knowledge Training LLC. All rights reserved. 3
Accuracy: closeness of a measure to the true value
Tolerance: range of acceptable results
The quality management planning process determines the quality standards that are applicable to the project and devising a way to satisfy them. The goal is to create a quality management plan which documents the following:
the way the team will implement the quality policy
the way the quality of both the project and the product will be assured during the project
the resources required to ensure quality
the additional activities necessary to carry out the quality plan
Identification of these items might require updates to the project management plan or schedule, emphasizing
the evolving nature of the plan and project documents. The plan, like other components created during the
planning phase, is written by the project manager with input from stakeholders. When planning for quality on a
project follow the corporate quality policies that are in place. If a corporate quality policy does not exist, the
project team should create one for the project. The project team might even need to adapt an existing policy to
better suit the nature of the project.
Quality Planning Tools and Techniques Various tools and techniques are employed on each of these three major processes.
Cost-Benefit Analysis The cost-benefit analysis is similar to a cost-benefit ratio. The costs and benefits are measured to analyze the trade-offs of providing quality.
Cost of Quality Cost of quality (COQ) includes all the costs that conform to the required quality of the project, including the cost to ensure conformance to requirements as well as the cost of nonconformance, and finding the right balance. Modern quality management philosophy emphasizes preventing mistakes rather than detecting them later because the cost of nonconformance is very high. The following costs are associated with quality:
Prevention costs are associated with keeping defective products away from the customer. Examples include quality training, quality planning, reliability engineering, test engineering, or data analysis.
Appraisal costs are associated with checking the product to make sure it is conforming, such as inspection, testing, calibration, studies, or surveys.
Failure costs can be categorized in a couple of ways: o Internal: Nonconformance that is found while the product is still within the performing
organization is called internal failure costs, and includes rework or scrap. o External: Nonconformance that is found when the product has been given to the customer is
called external failure costs, and includes repair or returns.
The cost of nonconformance can also be classified as direct or indirect: o Direct: Direct failure costs include scrap, warranty costs, rework, engineering changes, liability
insurance, or inventory costs. o Indirect: Indirect failure costs include fewer sales, lost customers, increased costs to get
customers back, decreased team morale, or decreased project efficiency.
Copyright ©2016 Global Knowledge Training LLC. All rights reserved. 4
Additional Planning Tools A wide variety of other tools can be applied to quality planning. The PMBOK Guide identifies the following examples:
Brainstorming is a technique for gathering information, where multiple unfiltered inputs and ideas are solicited and captured for later analysis and decision making.
Force field analysis (FFA) is a technique for analyzing ideas by grouping characteristics or factors that are for (pros) and against (cons) the idea.
Nominal group technique (NGT) is an enhancement of brainstorming that adds mechanisms for ranking ideas. It is based on the assumption that a nominal group (one that has agreed to work as a team) will produce better results than a group engaging in traditional brainstorming. NGT collects anonymous input from group members and encourages discussion of all input. Then each member prioritizes the input items. The items are further prioritized based on their cumulative score.
Quality Control The goal of controlling quality is referenced in the 5th edition of the PMBOK Guide by the control quality process. According to the PMBOK Guide, the control quality process is defined as the “process of monitoring and recording the results of executing the quality activities to assess performance and recommend necessary changes.” In other words, quality control focuses on project results ensuring that they comply with the quality standards defined for the project and eliminating any causes of unsatisfactory performance. This process measures the details of the product results, such as deliverables or defects, and also of the project management results, such as schedule. The PMBOK Guide acknowledges that often a specialized organizational unit with specific expertise in quality control performs quality control. Many of the techniques under the control quality process assume a working knowledge of statistical quality control, in particular the concepts of sampling and probability. The distinctions between attribute and variable sampling, precision and accuracy, and tolerance and control limits are fundamental components of a working knowledge of statistical quality control:
Prevention aids in identifying and avoiding potential problems so that they never enter or impact the process.
Inspection helps to identify and eliminate or correct errors so that they are not delivered to the customer.
Tolerance is a range of acceptable performance or results.
Tools Useful in Both Quality Planning and Control
Quality There are seven basic quality tools identified as appropriate for use in both the quality management plan and control quality processes. They are known as Ishikawa’s seven basic tools of quality: cause-and-effect diagrams, flowcharting, check sheets, Pareto diagrams, control charts, histograms and scatter diagrams. Ishikawa’s seven basic tools are also referred to as the 7QC tools.
Copyright ©2016 Global Knowledge Training LLC. All rights reserved. 5
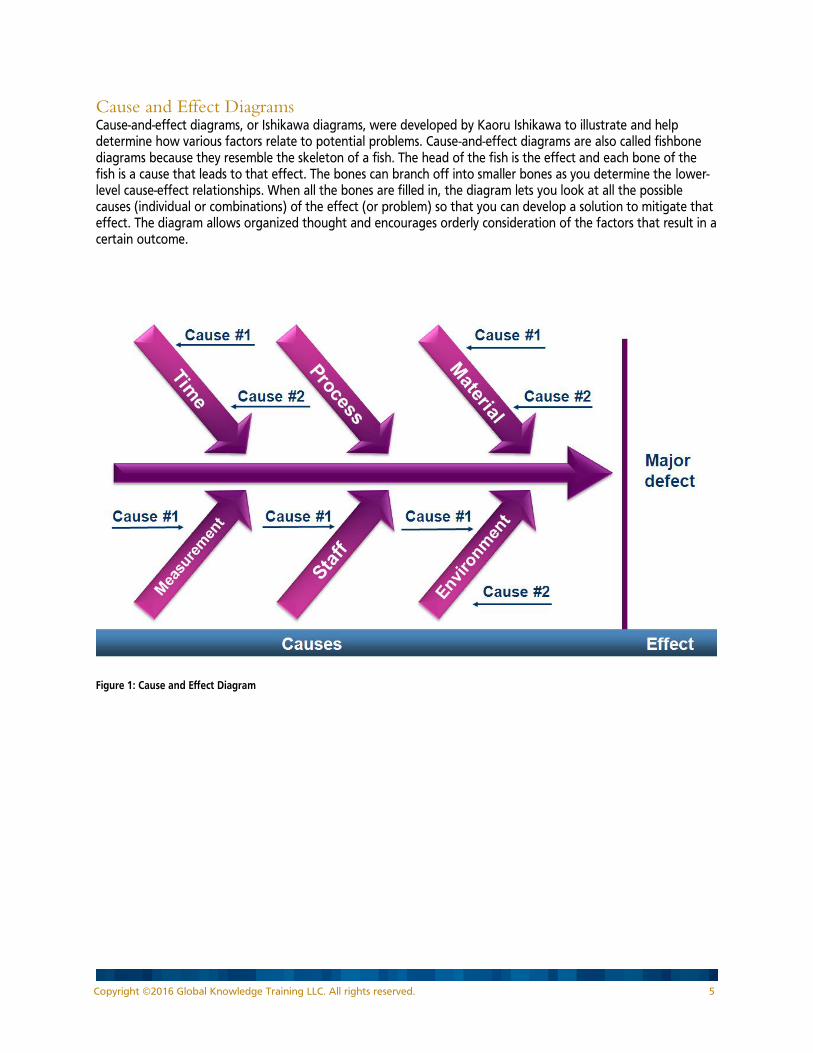
Cause and Effect Diagrams Cause-and-effect diagrams, or Ishikawa diagrams, were developed by Kaoru Ishikawa to illustrate and help determine how various factors relate to potential problems. Cause-and-effect diagrams are also called fishbone diagrams because they resemble the skeleton of a fish. The head of the fish is the effect and each bone of the fish is a cause that leads to that effect. The bones can branch off into smaller bones as you determine the lower-level cause-effect relationships. When all the bones are filled in, the diagram lets you look at all the possible causes (individual or combinations) of the effect (or problem) so that you can develop a solution to mitigate that effect. The diagram allows organized thought and encourages orderly consideration of the factors that result in a certain outcome.
Figure 1: Cause and Effect Diagram
Copyright ©2016 Global Knowledge Training LLC. All rights reserved. 6
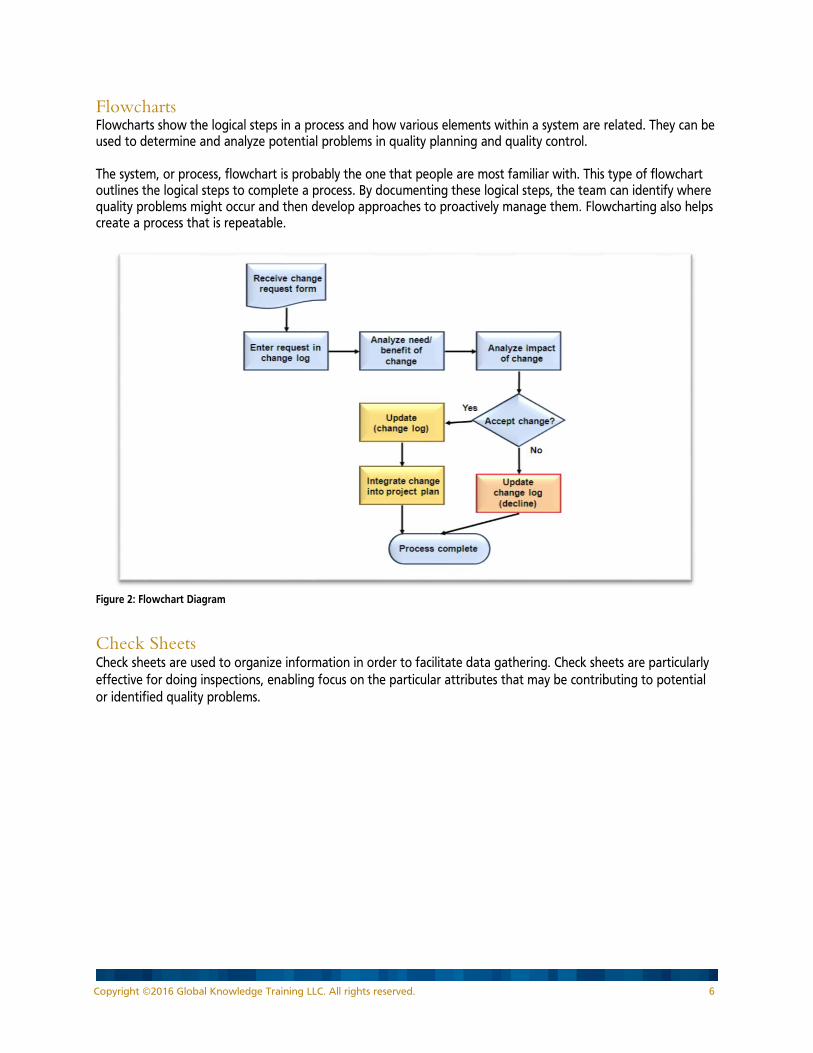
Flowcharts Flowcharts show the logical steps in a process and how various elements within a system are related. They can be used to determine and analyze potential problems in quality planning and quality control. The system, or process, flowchart is probably the one that people are most familiar with. This type of flowchart outlines the logical steps to complete a process. By documenting these logical steps, the team can identify where quality problems might occur and then develop approaches to proactively manage them. Flowcharting also helps create a process that is repeatable.
Figure 2: Flowchart Diagram
Check Sheets Check sheets are used to organize information in order to facilitate data gathering. Check sheets are particularly
effective for doing inspections, enabling focus on the particular attributes that may be contributing to potential
or identified quality problems.
Copyright ©2016 Global Knowledge Training LLC. All rights reserved. 7
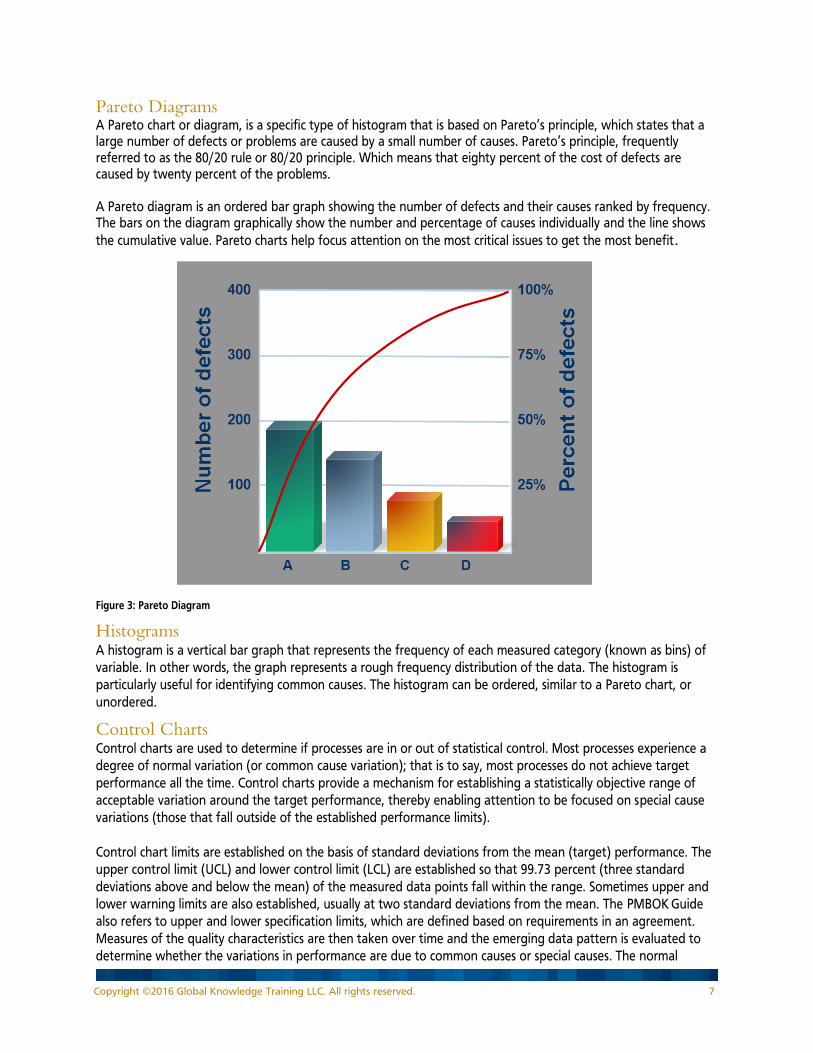
Pareto Diagrams A Pareto chart or diagram, is a specific type of histogram that is based on Pareto’s principle, which states that a large number of defects or problems are caused by a small number of causes. Pareto’s principle, frequently referred to as the 80/20 rule or 80/20 principle. Which means that eighty percent of the cost of defects are caused by twenty percent of the problems. A Pareto diagram is an ordered bar graph showing the number of defects and their causes ranked by frequency. The bars on the diagram graphically show the number and percentage of causes individually and the line shows
the cumulative value. Pareto charts help focus attention on the most critical issues to get the most benefit.
Figure 3: Pareto Diagram
Histograms A histogram is a vertical bar graph that represents the frequency of each measured category (known as bins) of
variable. In other words, the graph represents a rough frequency distribution of the data. The histogram is
particularly useful for identifying common causes. The histogram can be ordered, similar to a Pareto chart, or
unordered.
Control Charts Control charts are used to determine if processes are in or out of statistical control. Most processes experience a
degree of normal variation (or common cause variation); that is to say, most processes do not achieve target
performance all the time. Control charts provide a mechanism for establishing a statistically objective range of
acceptable variation around the target performance, thereby enabling attention to be focused on special cause
variations (those that fall outside of the established performance limits).
Control chart limits are established on the basis of standard deviations from the mean (target) performance. The
upper control limit (UCL) and lower control limit (LCL) are established so that 99.73 percent (three standard
deviations above and below the mean) of the measured data points fall within the range. Sometimes upper and
lower warning limits are also established, usually at two standard deviations from the mean. The PMBOK Guide
also refers to upper and lower specification limits, which are defined based on requirements in an agreement.
Measures of the quality characteristics are then taken over time and the emerging data pattern is evaluated to
determine whether the variations in performance are due to common causes or special causes. The normal
Copyright ©2016 Global Knowledge Training LLC. All rights reserved. 8
average run length (ARL) is 370 data points, based on work by American physicist, engineer, and statistician
Walter A. Shewhart, who showed that there is a 0.27 percent chance of a measure falling outside of the control
limits even when a process is in control. There are many rules for identifying special cause variations, but the following ones are more common:
Rule of Seven, or Seven Run Rule: Seven data points in a row are above or below the mean.
Trend of Seven Rule: Seven data points in a row follow a trend up or down.
Rule of One: Any single data point is outside of the control limits (upper or lower).
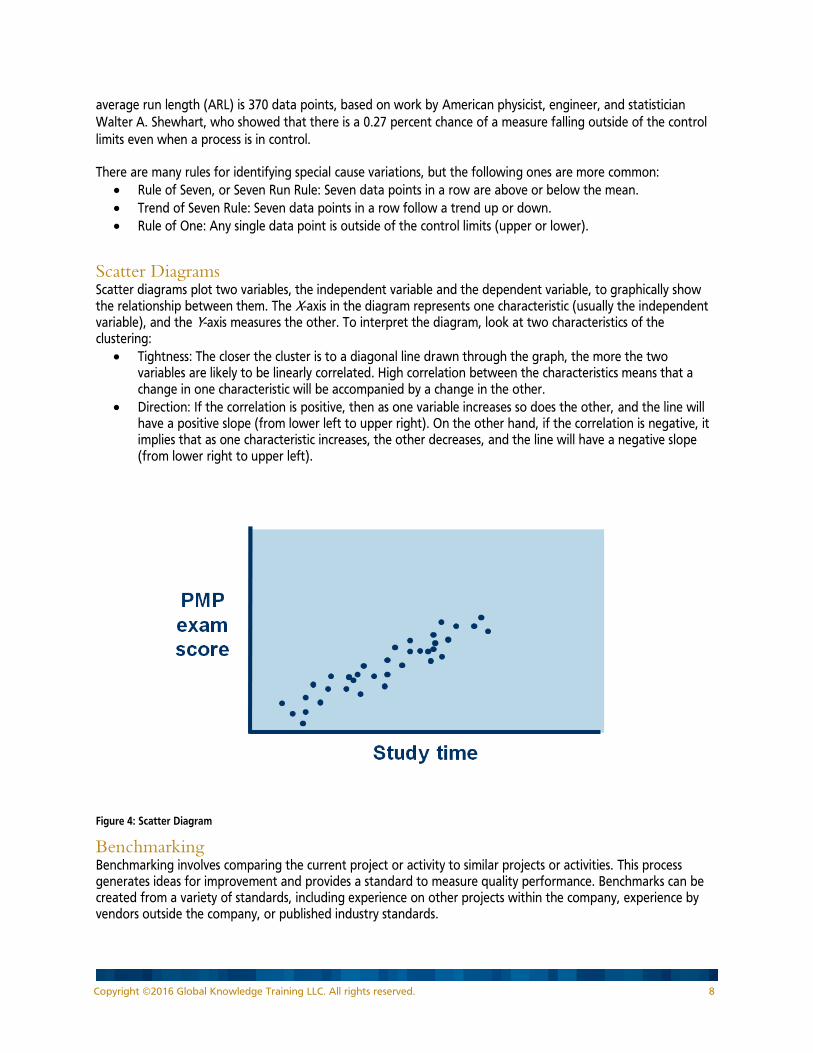
Scatter Diagrams Scatter diagrams plot two variables, the independent variable and the dependent variable, to graphically show the relationship between them. The X-axis in the diagram represents one characteristic (usually the independent variable), and the Y-axis measures the other. To interpret the diagram, look at two characteristics of the clustering:
Tightness: The closer the cluster is to a diagonal line drawn through the graph, the more the two variables are likely to be linearly correlated. High correlation between the characteristics means that a change in one characteristic will be accompanied by a change in the other.
Direction: If the correlation is positive, then as one variable increases so does the other, and the line will have a positive slope (from lower left to upper right). On the other hand, if the correlation is negative, it implies that as one characteristic increases, the other decreases, and the line will have a negative slope (from lower right to upper left).
Figure 4: Scatter Diagram
Benchmarking Benchmarking involves comparing the current project or activity to similar projects or activities. This process generates ideas for improvement and provides a standard to measure quality performance. Benchmarks can be created from a variety of standards, including experience on other projects within the company, experience by vendors outside the company, or published industry standards.
Copyright ©2016 Global Knowledge Training LLC. All rights reserved. 9
Design of Experiments Design of experiments is the process of going through what-if scenarios with a limited number of samples to determine the optimal solution to improve quality. It is a statistical method that identifies the variables that will have the greatest effect on the quality of the project. Typically, this method is used on the product of the project, but it also can be applied to the project management process. For example, a senior network analyst is more expensive, but he or she can install and troubleshoot hardware in a shorter amount of time than a junior network analyst. In this case, the experiment can yield an appropriate mix of junior and senior analysts to provide an optimum mix of analysts for the installation phase of the project. The benefit of this technique is that all major or important factors can be changed at one time, rather than one at a time.
Statistical Sampling Statistical sampling is an approach to selecting a few representative items for inspection and then extrapolating the results to the whole. The type of sampling and the frequency or size of the sample should be established in the quality management plan. There are two types of sampling:
Attribute sampling is the determination of whether a sample conforms (for example, true/false, right/wrong, pass/fail, and so forth).
Variable sampling is the determination of the degree of conformity (for example, number of calls per hour, weight of chickens, and so forth).
Quality Assurance The PMBOK Guide defines the perform quality assurance process as “the auditing of quality requirements and the results from quality control measurements to ensure that appropriate quality standards and operational definitions are used.” The perform quality assurance process ensures that the project meets the quality standards outlined during the planning process. Although most of this work is done during project execution, the PMBOK Guide performed throughout the project. The perform quality assurance process provides an umbrella for continuous process improvement. During this process, the measurements taken during quality control are analyzed to determine if the processes followed are within the acceptable range of tolerance, or if adjustments need to be made. During quality assurance, the quality standards and methods used are evaluated and adjusted if necessary.
Tools and Techniques of the Perform Quality Assurance Process A wide variety of tools are available for the management and control of quality.
Affinity Diagrams Affinity diagrams are used to organize large numbers of ideas for review and analysis. It is an excellent tool for organizing large amounts of ideas and data into meaningful groups by finding relationships between the ideas. It makes data easier to review and analyze. The affinity diagram was developed by a Japanese anthropologist Jiro Kawakita and is therefore also known as “the KJ method” (The Japanese put their family name first).
Process Decision Program Charts (PDPC) This technique helps to identify the steps necessary to reach a goal. It also enables analysis of the incremental steps required, thereby facilitating identification of potential problems or pitfalls before they are encountered.
Interrelationship Diagraphs An interrelationship diagraph is a visual display of the cause-and-effect relationships between multiple variables, complex problems, or desired outcomes.
Copyright ©2016 Global Knowledge Training LLC. All rights reserved. 10
Tree Diagrams Tree diagrams, also known as systematic diagrams, are used to break down broad categories into finer and finer levels of detail, which helps move from generalities to specifics.
Prioritization Matrices Prioritization matrices provide a mechanism for ranking the relative importance of ideas or issues.
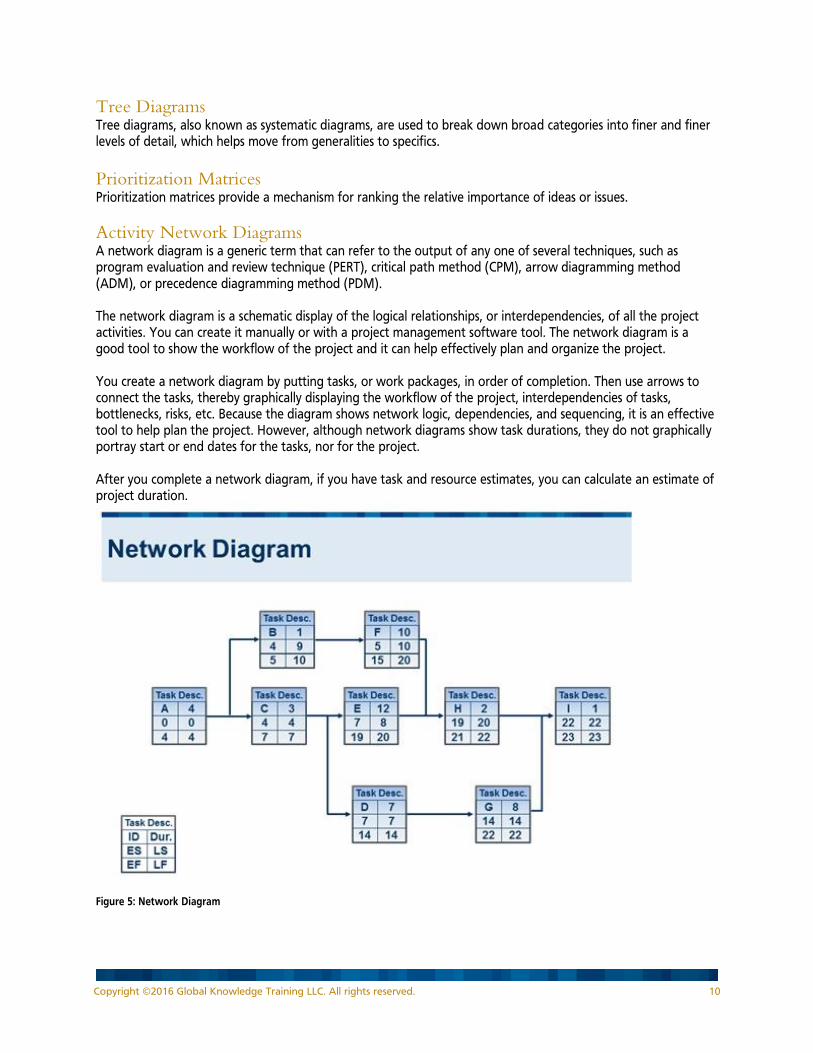
Activity Network Diagrams A network diagram is a generic term that can refer to the output of any one of several techniques, such as program evaluation and review technique (PERT), critical path method (CPM), arrow diagramming method (ADM), or precedence diagramming method (PDM). The network diagram is a schematic display of the logical relationships, or interdependencies, of all the project activities. You can create it manually or with a project management software tool. The network diagram is a good tool to show the workflow of the project and it can help effectively plan and organize the project. You create a network diagram by putting tasks, or work packages, in order of completion. Then use arrows to connect the tasks, thereby graphically displaying the workflow of the project, interdependencies of tasks, bottlenecks, risks, etc. Because the diagram shows network logic, dependencies, and sequencing, it is an effective tool to help plan the project. However, although network diagrams show task durations, they do not graphically portray start or end dates for the tasks, nor for the project. After you complete a network diagram, if you have task and resource estimates, you can calculate an estimate of project duration.
Figure 5: Network Diagram
Copyright ©2016 Global Knowledge Training LLC. All rights reserved. 11
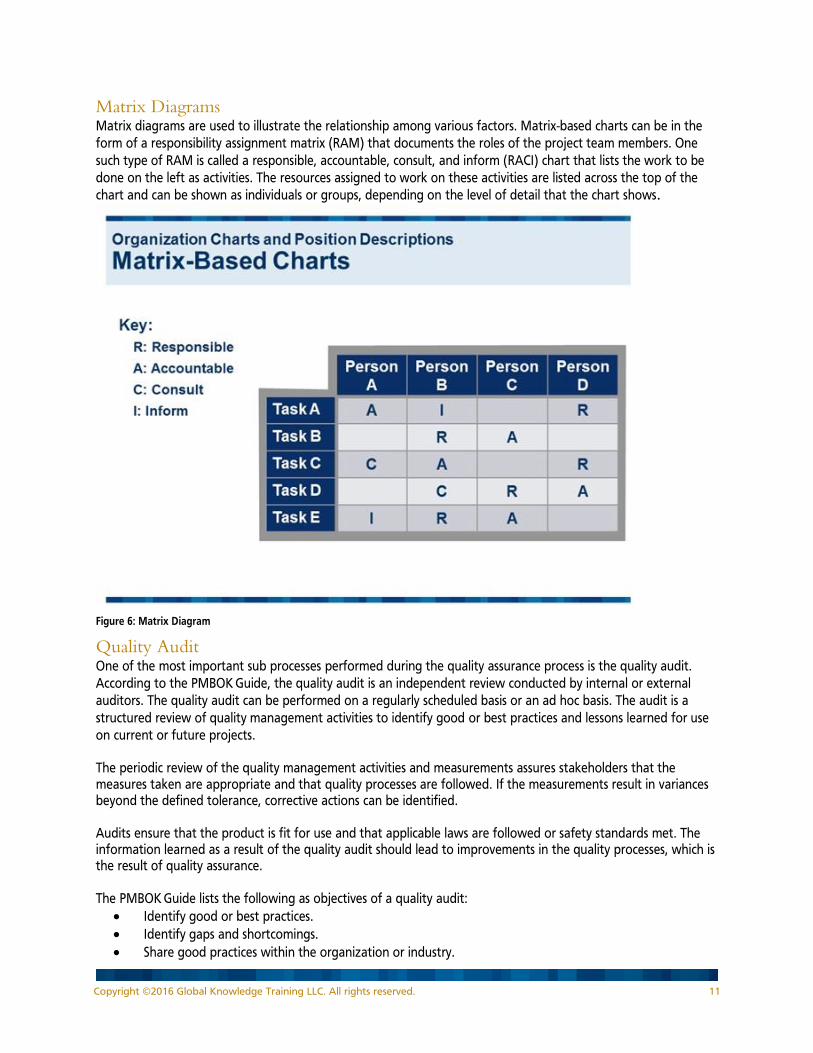
Matrix Diagrams Matrix diagrams are used to illustrate the relationship among various factors. Matrix-based charts can be in the
form of a responsibility assignment matrix (RAM) that documents the roles of the project team members. One
such type of RAM is called a responsible, accountable, consult, and inform (RACI) chart that lists the work to be
done on the left as activities. The resources assigned to work on these activities are listed across the top of the
chart and can be shown as individuals or groups, depending on the level of detail that the chart shows.
Figure 6: Matrix Diagram
Quality Audit One of the most important sub processes performed during the quality assurance process is the quality audit.
According to the PMBOK Guide, the quality audit is an independent review conducted by internal or external
auditors. The quality audit can be performed on a regularly scheduled basis or an ad hoc basis. The audit is a
structured review of quality management activities to identify good or best practices and lessons learned for use
on current or future projects. The periodic review of the quality management activities and measurements assures stakeholders that the measures taken are appropriate and that quality processes are followed. If the measurements result in variances beyond the defined tolerance, corrective actions can be identified. Audits ensure that the product is fit for use and that applicable laws are followed or safety standards met. The information learned as a result of the quality audit should lead to improvements in the quality processes, which is the result of quality assurance. The PMBOK Guide lists the following as objectives of a quality audit:
Identify good or best practices.
Identify gaps and shortcomings.
Share good practices within the organization or industry.
Copyright ©2016 Global Knowledge Training LLC. All rights reserved. 12
Proactively improve processes to raise team productivity.
Highlight contributions identified through the audit in the lessons learned repository.
Process Analysis Process analysis involves applying the procedures that are defined in the process improvement plan to identify necessary areas of improvement. A key tool of process analysis is root cause analysis. A root cause analysis focuses on determining what happened, why it happened, and how to reduce the possibility of having it happen again.
Conclusion When creating products, providing services, and achieving results, consistency is the goal of quality management. It is achieved through the consistent application of the tools and techniques associated with the processes of quality planning, control quality, and quality assurance. An effective project manager must be familiar with and have an excellent working understanding of the tools and techniques of quality, and should strive for continuous improvement of the related processes. Only then will the work consistently lead to true customer satisfaction.
Learn More Learn more about how you can improve productivity, enhance efficiency, and sharpen your competitive edge
through training.
Practical Project Quality Planning Quality for Project Managers
Visit www.globalknowledge.com or call 1-800-COURSES (1-800-268-7737) to speak with a Global Knowledge
training advisor.
About the Author Tim McClintock is a speaker, business consultant and certified project management professional (PMP®) who
specializes in both strategic business planning and development, as well as tactical management practices across
several sectors including corporate clients, governmental agencies, and non-profit organizations. His articles and
white papers have appeared in publications such as Business Week, Tech Republic, and Modern Analyst.
He has worked with clients such as Cisco, Intel, Deloitte & Touche, Booz Allen Hamilton, Verizon, Citigroup,
Lockheed Martin, Exxon Mobil, MetLife, Sabre, the cities of Chicago, Los Angeles, and Palo Alto, National
Aeronautics and Space Administration (NASA), National Security Administration (NSA), Department of Defense
Information Systems Agency (DISA), Lawrence Livermore National Laboratory, General Dynamics, National
Institutes of Health(NIH), MITRE Corporation, and the United States military.