tool 5, the share approach communicating numbers to your ... · communicating numbers to your...
TRANSCRIPT

The SHARE Approach
Communicating Numbers to Your Patients: A Reference Guide for Health Care Providers
Workshop Curriculum: Tool 5
The SHARE Approach is a 1-day training program developed by the Agency for Healthcare Research and Quality (AHRQ) to help health care professionals work with patients to make the best possible health care decisions. It supports shared decisionmaking through the use of patient-centered outcomes research (PCOR).

2 Communicating Numbers to Your Patients: A Reference Guide for Health Care Providers (Workshop Curriculum: Tool 5)
Numeracy is key to shared decisionmaking
Numbers are all around us—especially in the health care setting. Yet many Americans, even those with college degrees, have trouble using and making sense of numbers.1
Low health numeracy makes it hard to read, listen to, talk about, and evaluate quantitative information. As a result, people with low health numeracy may be less likely to make the choices and take the actions needed to stay well.2,3
For example, people with low health numeracy may have trouble understanding risks and benefits and, consequently, may not understand treatment options—an integral part of shared decisionmaking. If they do get treatment, they may have trouble following their treatment plan and, therefore, may have worse medical outcomes.4
This handout offers tips to help your patients make sense of numbers so they can be as informed as possible. Use these techniques with all your patients—not just those with whom you think have limited health literacy. When it comes to shared decisionmaking, clearer is better.
Use Numbers Clearly
Try these tips:
› Elaborate by providing estimated numbers. Avoid explaining risks in purely descriptive terms (such as “low risk”).5 For example, say, “Studies show that out of every 100 people who have a stent, 1 to 2 people may develop a blood clot at the stent site.”6
› Use frequencies instead of decimals or percentages.7,8 For example, say, “13 out of 100” instead of “.13” or “13 percent.”
› Keep denominators and timeframes the same when you compare numbers.1 For example, say, “About 6 out of 10 women like you, who do not take this medicine will break a bone in the next 10 years. About 3 out of 10 women like you who take this medicine will break a bone in the next 10 years. Taking the medicine can lower your chance of breaking a bone by about half.”
› Give absolute risk instead of relative risk.1 Absolute risk estimates the number of health events among individuals in a group, and gives a better sense of personal or individual risk. For example, say, “Three out of 1,000 nonsmokers may have a stroke in their lifetime, and 6 out of 1,000 smokers may have a stroke in their lifetime,” instead of “Smokers have 2 times the risk of having a stroke in their lifetime.”
› Frame outcomes in both positive and negative terms.5 For example, say, “With this treatment, 2 out of 10 people get side effects, and 8 out of 10 people do not get side effects.”
› Find out which measurement system your patient uses—standard or metric. For example, say, “Would you like me to explain using ounces or grams?”

3 Communicating Numbers to Your Patients: A Reference Guide for Health Care Providers (Workshop Curriculum: Tool 5)
Make numbers meaningful
Many people have trouble connecting with numbers. The way you present numbers to your patients can help them connect.9
Try these strategies to maximize understanding
› Limit numbers. Focus on just a few concepts at a time and highlight key information when you discuss numbers and their significance. Use numbers when precision is needed, such as for risk and benefit statistics, healthy blood sugar numbers, and dosing instructions.10
› Use everyday words.11 For example, say, “about half” instead of “49 percent.”
› Do the math. Perform calculations for your patients.10 For example, tell them what their risk is over a 10-year period rather than expecting them to calculate it from an annual risk rate.
› Use analogies and comparisons to familiar objects.11 For example, say, “A gallstone can be as small as a grain of sand or as large as a golf ball. Your gallstone was about half of a centimeter big, or about the size of a small green pea.”
› Show pictures.5 For example, use the Wong-Baker FACES pain scale rating to help patients communicate their level of pain.
› Use the teach-back technique. Refer to Using the Teach-Back Technique: A Reference Guide for Health Care Providers (Tool 6). Ask your patient to explain the numbers you just presented in his or her own words. This lets you make sure your patient understands. Check for understanding when you explain visuals (graphs, charts, and tables) that have numbers.
Communicating risk with visual aids
Visual aids are simple graphical representations of numerical expressions of probability. They include icon arrays, bar graphs, and line charts, among others. Supplementing good visual aids with text can help patients see the risk numbers in context, thus providing information and not just data.1,5
There are several types of graphs that can be used to show different information
› Icon arrays (also called pictographs) show ratios
› Pie graphs show ratios
› Bar graphs compare numbers
› Line graphs show change over time
4 Communicating Numbers to Your Patients: A Reference Guide for Health Care Providers (Workshop Curriculum: Tool 5)
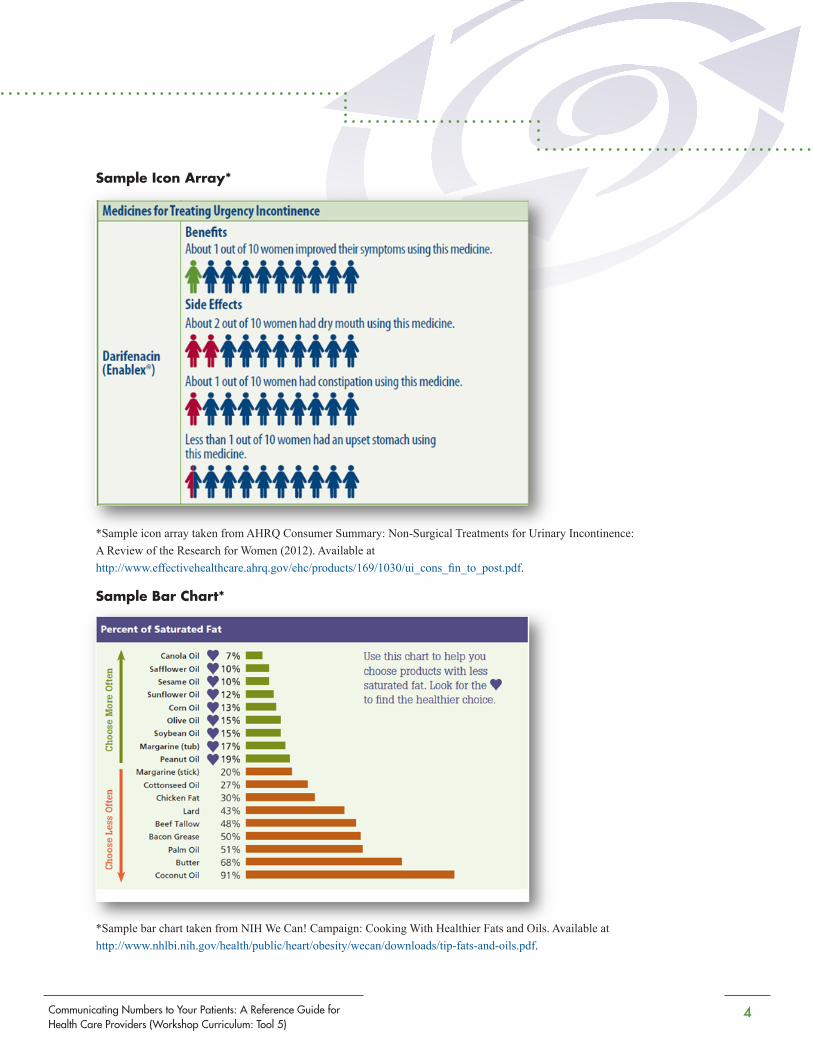
Sample Icon Array*
*Sample icon array taken from AHRQ Consumer Summary: Non-Surgical Treatments for Urinary Incontinence: A Review of the Research for Women (2012). Available at http://www.effectivehealthcare.ahrq.gov/ehc/products/169/1030/ui_cons_fin_to_post.pdf.
Sample Bar Chart*
*Sample bar chart taken from NIH We Can! Campaign: Cooking With Healthier Fats and Oils. Available at http://www.nhlbi.nih.gov/health/public/heart/obesity/wecan/downloads/tip-fats-and-oils.pdf.

5 Communicating Numbers to Your Patients: A Reference Guide for Health Care Providers (Workshop Curriculum: Tool 5)
Learn more about risk communication and health numeracy
Information on Presenting Probabilities
Trevena L., Zikmund-Fisher B., Edwards A., Gaissmaier W., Galesic M., Han P., King J., Lawson M., Linder S., Lipkus I., Ozanne E., Peters E., Timmermans D., Woloshin S.. Presenting probabilities. In Volk R & Llewellyn-Thomas H (editors). 2012 Update of the International Patient Decision Aids Standards (IPDAS) Collaboration's Background Document. Chapter C.; 2012.Available at: http://ipdas.ohri.ca/IPDAS-Chapter-C.pdf
Information on Numeracy and Risk/Benefits
Peters E., Hibbard J., Slovic P., Dieckmann N. Numeracy skill and the communication, comprehension, and use of risk-benefit information. Health Aff (Millwood). 2007 May-Jun; 26(3):741-8.Available at: http://content.healthaffairs.org/content/26/3/741
Information on Tables, Charts, and Diagrams
Toolkit for Making Written Material Clear and Effective. Section 2, Part 5, Chapter 7: Guidelines for tables, charts, and diagrams. Centers for Medicare & Medical Services; 2010.Available at: http://www.cms.gov/Outreach-and-Education/Outreach/WrittenMaterialsToolkit/Downloads/ToolkitPart05Chapter07.pdf
This tool is to be used in conjunction with the Agency for Healthcare Research and Quality’s SHARE Approach workshop. To learn more about the workshop, visit www.ahrq.gov/shareddecisionmaking.

www.ahrq.gov/shareddecisionmaking April 2014 | AHRQ Pub. No. 14-0034-5-EF
Communicating Numbers to Your Patients: A Reference Guide for Health Care Providers (Workshop Curriculum: Tool 5)
References1. Fischhoff B., Brewer N., Downs J., eds. Communicating risks and benefits: an evidence-based user’s
guide. Silver Spring (MD): U.S. Food and Drug Administration; 2011.2. Neilsen-Bohlman L., Panzer A.M., Kindig D.A. Health Literacy: A Prescription to End Confusion.
Washington, DC: National Academies Press; 2004.3. Coleman C., Kurtz-Rossi S., McKinney J., et al. The Calgary Charter on Health Literacy: Rationale
and Core Principles for the Development of Health Literacy Curricula; 2009.4. Reyna V.F., Nelson W.L., Han P.K., et al. How numeracy influences risk comprehension and medical
decision making. Psychol Bull 2009 Nov;135(6):943-73. PMID: 19883143.5. Paling J. Strategies to help patients understand risks. BMJ 2003 Sep 27;327(7417):745-8. PMID:
14512489.6. What Are the Risks of Having a Stent? National Heart, Lung, and Blood Institute. http://www.nhlbi.
nih.gov/health/health-topics/topics/stents/risks.html. Accessed February 28, 2014.7. Fagerlin A., Zikmund-Fisher B.J., Ubel P.A. Helping patients decide: ten steps to better risk
communication. J Natl Cancer Inst 2011 Oct 5;103(19):1436-43. PMID: 21931068.8. Waters E.A., Weinstein N.D., Colditz G.A., et al. Formats for improving risk communication in
medical tradeoff decisions. J Health Commun 2006 Mar;11(2):167-82. PMID: 16537286.9. Peters E., Hibbard J., Slovic P., et al. Numeracy skill and the communication, comprehension, and use
of risk-benefit information. Health Aff (Millwood) 2007 May-Jun;26(3):741-8. PMID: 17485752.10. Peters E., Meilleur L., Tompkins M.K. Numeracy and the Affordable Care Act: opportunities and
challenges. Roundtable on Health Literacy, Institute of Medicine. 2013.11. The Patient Education Materials Assessment Tool (PEMAT) and User’s Guide. An Instrument To
Assess the Understandability and Actionability of Print and Audiovisual Patient Education Materials. AHRQ Publication No. 14-0002-EF. Rockville (MD): Agency for Healthcare Research and Quality; 2013.