too much face and not enough books: the relationship between
TRANSCRIPT
Computers in Human Behavior xxx (2011) xxx–xxx
Contents lists available at SciVerse ScienceDirect
Computers in Human Behavior
journal homepage: www.elsevier .com/locate /comphumbeh
Too much face and not enough books: The relationship between multiple indicesof Facebook use and academic performance
Reynol Junco ⇑Department of Academic Development and Counseling, Lock Haven University, 104 Russell Hall, Lock Haven, PA 17745, United States
a r t i c l e i n f o a b s t r a c t
Article history:Available online xxxx
Keywords:FacebookAcademic performanceGrade point averageHierarchical linear regressionStudent engagement
0747-5632/$ - see front matter � 2011 Elsevier Ltd. Adoi:10.1016/j.chb.2011.08.026
⇑ Tel.: +1 814 441 0339; fax: +1 570 484 2517.E-mail address: [email protected]
Please cite this article in press as: Junco, R. Too mperformance. Computers in Human Behavior (20
Because of the social media platform’s widespread adoption by college students, there is a great deal ofinterest in how Facebook use is related to academic performance. A small number of prior studies haveexamined the relationship between Facebook use and college grade point average (GPA); however, thesestudies have been limited by their measures, sampling designs and failure to include prior academic abil-ity as a control variable. For instance, previous studies used non-continuous measures of time spent onFacebook and self-reported GPA. This paper fills a gap in the literature by using a large sample (N = 1839)of college students to examine the relationship among multiple measures of frequency of Facebook use,participation in Facebook activities, and time spent preparing for class and actual overall GPA. Hierarchi-cal (blocked) linear regression analyses revealed that time spent on Facebook was strongly and signifi-cantly negatively related to overall GPA, while only weakly related to time spent preparing for class.Furthermore, using Facebook for collecting and sharing information was positively predictive of the out-come variables while using Facebook for socializing was negatively predictive.
� 2011 Elsevier Ltd. All rights reserved.
1. Introduction
1.1. Facebook use by college students
Since its introduction to a handful of college campuses in2004, Facebook has become nearly ubiquitous at universities. Re-cent data are reflective of this trend. For instance, in 2009 and2010, researchers from the Pew Research Center’s Internet andAmerican Life Project found that between 67% and 75% of col-lege-aged young adults used social networking websites (Jones& Fox, 2009; Lenhart, 2009; Lenhart, Purcell, Smith, & Zickuhr,2010). In late 2010, an EDUCAUSE Center for Applied Research(ECAR) study of 36,950 students from 126 US universities andone Canadian university revealed that of the 90% of studentswho used social networking sites, 97% said they used Facebook.This 97% reported activity on the site daily (Smith & Caruso,2010). In another study, students reported devoting a lot of timeto Facebook, spending an average of over 1 h and 40 min a day onthe site (Junco, 2011).
While research shows that almost all college students useFacebook, factors such as gender, race and socioeconomic statusyield varying degrees of technological ownership, adoption anduse within the demographic (Cooper & Weaver, 2003; DiMaggio,Hargittai, Celeste, & Shafer, 2004; Hargittai, 2008a; Junco, Merson,
ll rights reserved.
uch face and not enough book11), doi:10.1016/j.chb.2011.08.
& Salter, 2010; Kaiser Family Foundation, 2004). While almost allof the research on digital inequalities focuses on the Internet andcommunication technologies, Hargittai (2008b) conducted the onlypublished study of gender, ethnic and socioeconomic differencesbetween users and non-users of social networking sites. She foundthat Latino students were less likely to use Facebook than Cauca-sians, and that students whose parents had a college degree weremore likely to use Facebook than students whose parents did nothave a college degree (Hargittai, 2008b). Therefore, not all studentsuse Facebook and it is reasonable to assume that non-users aremarked by one or more of several common factors.
Even though there is professional and popular interest in howFacebook use affects student learning, not much research has beenconducted on the topic (Abramson, 2011; Kamenetz, 2011; Pychl,2008). Some studies have examined the relationship betweenFacebook use and psychosocial outcomes. For instance, Ellison,Steinfield, and Lampe (2007) found that there is a positive relation-ship between using Facebook and forming and maintaining socialcapital. Valenzuela, Park, and Kee (2009) found that civic participa-tion, life satisfaction, and social trust were related to the intensityof college students’ Facebook use. In newer research, Ellison,Steinfield, and Lampe (2011) extended their previous study andfound that engaging in social information-seeking behaviors onFacebook (to learn more about a person with whom the useralready has a connection) was related to increased social capital,while using Facebook to maintain relationships and meet strangerswas not.
s: The relationship between multiple indices of Facebook use and academic026
2 R. Junco / Computers in Human Behavior xxx (2011) xxx–xxx
1.2. Facebook and student engagement
The construct of student engagement, defined as ‘‘the amount ofphysical and psychological energy that the student devotes to theacademic experience,’’ was originally proposed by Astin in 1984 (p.297). Astin’s (1984) theory of student engagement was based onfive tenets: (1) Engagement refers to the investment of physicaland psychological energy; (2) Engagement occurs along a contin-uum (some students are more engaged than others and individualstudents are engaged in different activities at differing levels); (3)Engagement has both quantitative and qualitative features; (4) Theamount of student learning and development associated with aneducational program is directly related to the quality and quantityof student engagement in that program; and (5) The effectivenessof any educational practice is directly related to the ability of thatpractice to increase student engagement.
Since Astin’s (1984) original work, student engagement hasevolved to refer to the time and effort students invest in educa-tional activities that are empirically linked to desired college out-comes. In a notable divergence from Astin’s (1984) definition ofthe concept, engagement is no longer limited to time devoted topurely academic outcomes; now, engagement encompasses vari-ous factors, including investment in the academic experience ofcollege, interactions with faculty, involvement in co-curricularactivities and interaction with peers (Kuh, 2009; Pascarella &Terenzini, 2005). While an exhaustive review of the research onengagement is beyond the scope of this paper, it is important topoint out a key finding: in their meta-analysis of how collegeaffects students, Pascarella and Terenzini (2005) reported thatstudent engagement was directly related to student academic per-formance. Specifically, a more engaged student will earn bettergrades and have a higher chance of persisting through to gradua-tion (Pascarella & Terenzini, 2005).
Because Facebook is intended as a platform for engagement,and because students spend a significant amount of time usingthe site, it makes sense to study the relationship between Facebookuse and student engagement (Heiberger & Harper, 2008; Morrin,2007). To date, three studies have examined the relationship be-tween Facebook use and student engagement in order to makeinferences about how Facebook use is related to a construct(engagement) related to student success (Heiberger & Harper,2008; HERI, 2007; Junco, 2011). The Heiberger and Harper (2008)and HERI (2007) studies found positive correlations between socialnetworking website use and college student engagement. For in-stance, a higher percentage of high-frequency users of social net-working websites participated in and spent more time in campusorganizations than low-frequency users. Additionally, more high-frequency users reported daily interactions offline with closefriends with whom they developed strong connections (HERI,2007). Conversely, the Junco (2011) study found that while timespent using Facebook was positively related to time spent in co-curricular activities, it was negatively related to scores on a scaledesigned to measure student engagement.
In 1987, Chickering and Gamson proposed seven principles forgood practice in undergraduate education, all of which were re-lated to student engagement. They are: (1) student/faculty contact;(2) cooperation among students; (3) active learning; (4) promptfeedback; (5) emphasizing time on task; (6) communicating highexpectations; and (7) respecting diversity. The fifth principle,‘‘emphasizing time on task,’’ is important in conceptualizing therelationship between Facebook use and academic success. Specifi-cally, Chickering and Gamson (1987) state that ‘‘time plus energyequals learning,’’ and there can be no substitute for time studentsspend engaged in academic work (p. 6). If indeed students arespending their time engaging with a technology such as Facebook,their available time to spend on academic tasks might be limited.
Please cite this article in press as: Junco, R. Too much face and not enough bookperformance. Computers in Human Behavior (2011), doi:10.1016/j.chb.2011.08.
Furthermore, Astin (1984) states that students reach academicgoals because of the time and effort spent on activities designedto reach those goals. For instance, if getting good grades is animportant goal, the amount of time students spend studying is acritical factor in reaching that goal. If student time is spent else-where—on Facebook, for instance—less time will be allotted tofocusing on academic activities and grades may suffer as a result.
1.3. Technology use and academic outcomes
Most of the research on the academic outcomes of technologyuse has been conducted at the primary or secondary school leveland has found disparate results. As with the research on studentengagement, a comprehensive review is beyond the scope of thispaper; however, the following section highlights a number of stud-ies illustrative of the mixed effects of technology use on academicoutcomes. For instance, some studies have found a positiverelationship between using technology with elementary and/orhigh school students and academic outcomes like standardizedtest scores and course grades (Shapley, Sheehan, Maloney, &Caranikas-Walker, 2010; Suhr, Hernandez, Grimes, & Warschauer,2010; Tienken & Wilson, 2007). On the other hand, some studieshave found a negative relationship between technology use andacademic outcomes in these settings (Aypay, Erdogan, & Sozer,2007; Waight & Abd-El-Khalick, 2007). Still other studies havefound contradictory positive and negative results. In a review ofthe literature on interactive white boards (IWB), DiGregorio andSobel-Lojeski (2010) found both positive and negative relation-ships between IWB use and academic outcomes such as learningmeasures, student attitudes, and motivation. The conflicting re-sults found in these studies are quite possibly due to differencesin the technologies being measured (for instance, laptops vs. IWBs)and to differences in how the technologies are used (for instance,using laptops for subject area practice vs. using them for the crea-tion of content).
While studies at the university level have also found contradic-tory results, they serve to further clarify how specific uses of tech-nology may be related to academic outcomes. For instance, Bliuc,Ellis, Goodyear, and Piggott (2010) discovered that students whoreported using discussion boards as tools to find answers—ratherthan improve their understanding of a topic—were utilizing thattechnology in ways that encouraged reproduction and task com-pletion rather than deep learning; those students also had lower fi-nal course grades. Rizzuto, LeDoux, and Hatala (2009) found thatusing a course management system for required actions (like post-ing comments) was positively related to course test scores. Sappand Simon (2005) found that more students in online coursesfailed to complete the course and had lower grades than studentsin matched face-to-face courses. In related research, Weatherly,Grabe, and Arthur (2003) found that students in a section of a psy-chology course who were provided lecture slides via a course man-agement system had lower exam scores than a control section,presumably because of decreased attendance. Research on collegestudents has largely focused on institutionally supported technol-ogies like course management systems, while very few studieshave examined the effects of technologies more commonly usedby students, such as Facebook.
1.4. Facebook use and grades
As of this writing, three published peer-reviewed studies haveexamined the relationship between Facebook use and grades(Kirschner & Karpinski, 2010; Kolek & Saunders, 2008; Pasek, More,& Hargittai, 2009). Pasek et al. (2009) examined the relationshipbetween Facebook use and academic performance, and found therewas no relationship between Facebook use and grades. Kolek and
s: The relationship between multiple indices of Facebook use and academic026
R. Junco / Computers in Human Behavior xxx (2011) xxx–xxx 3
Saunders (2008) found that there were no differences in overallgrade point average (GPA) between users and non-users of Face-book. Kirschner and Karpinski (2010), on the other hand, foundthat Facebook users reported a lower mean GPA than non-users;additionally, Facebook users reported studying fewer hours perweek than non-users (Kirschner & Karpinski, 2010).
The lack of consensus in the research may be partially due tothe fact that the few existing studies have been limited by theirmeasures and/or sampling designs. The Pasek et al. (2009) studyused three datasets, in which Facebook use was quantified with ayes/no question in one sample and an ordinal scale in the others.In the first dataset, researchers used an interval-level scale to askcollege students about their Facebook use. The options were:‘‘No, have never used it,’’ ‘‘Tried it once, but have not used it since,’’‘‘Yes, have tried it in the past, but do not use it nowadays,’’ ‘‘Yes,currently use it sometimes,’’ and ‘‘Yes, currently use it often.’’Researchers then split the sample into Facebook users and non-users, with those who reported ‘‘Yes, currently use it sometimes’’and ‘‘Yes, currently use it often’’ as users and those who reportedother options as non-users. The second and third datasets includedstudents aged 14–22, which makes generalizing to college studentsdifficult because the lower end of this range falls outside of the col-lege student demographic. For these datasets, the students wereasked if they had access to the Internet and if they ‘‘Use online so-cial network sites (SNS) like MySpace or Facebook most days, onceor twice a week, less often or never,’’ with a follow-up prompt forFacebook use. Respondents who did not have access to the Inter-net, who reported ‘‘never’’ using SNSs or who reported not usingFacebook were considered non-users, and those reporting Face-book use were considered users.
The Kirschner and Karpinski (2010) paper examined differencesbetween Facebook users and non-users but did not analyze actualtime spent on Facebook (though their methods suggest this infor-mation was collected). It should also be noted the Kirschner andKarpinski (2010) study was conducted with a relatively small(N = 219) sample of mostly upper-level undergraduate (juniorand senior) and graduate students. Lastly, the study by Kolek andSaunders (2008) examined student Facebook profiles and foundthere were no differences in overall GPA between users and non-users. It is important to note that ‘‘non-users’’ in the Kolek andSaunders (2008) study were those students from a randomly se-lected sample of the university’s student database that researcherscould not find on Facebook. These students could have either beennon-users or had privacy settings enabled to disallow searching,confounding the results of these findings.
Previous studies of Facebook use and academic performancehave also been limited in how student grades were measured. Untilnow, all studies have used self-reported, non-continuous mea-sures. Students in the first sample in the Pasek et al. (2009) studywere asked to report grades on an 8-point Likert scale with anchorsfor ‘‘Mostly F’s’’ to ‘‘Mostly A’s’’ and categories in between such as‘‘A’s and B’s.’’ For the second and third samples, GPA was coded ona four-point scale from ‘‘D or less’’ to ‘‘A.’’ Kirschner and Karpinski(2010) used a five-point Likert scale (where 0 was 1.99 and below,1 was 2.0–2.49, 2 was 2.5–2.99, 3 was 3.0–3.49, and 4 was 3.5–4.0).Kirschner and Karpinski (2010) also coded time spent studying ona 5-point Likert scale (where 0 was less than 1 h per week, 1 was1–5 h, 2 was 6–10 h, 3 was 11–15 h, and 4 was 16 or more hours).
None of the previous studies have explored what students do onFacebook. The Facebook platform allows for different activities—from commenting on user content to sending private messages,uploading photos, and lurking (seeing what others are doing);these activities could be related to outcomes in different ways thanfrequency of use. One study that used a small sample (N = 92)examined users’ activities, but the authors did not relate their find-ings to academic outcomes (Pempek, Yermolayeva, & Calvert,
Please cite this article in press as: Junco, R. Too much face and not enough bookperformance. Computers in Human Behavior (2011), doi:10.1016/j.chb.2011.08.
2009). Prior studies of Facebook use and academic performancehave used rough measures of Facebook frequency of use and havenot examined how specific Facebook activities might impact aca-demic outcomes; however, a study by Junco (2011) found that timespent on Facebook was negatively related to scores on a scale ofstudent engagement and that some Facebook activities werepositively predictive of student engagement, while others werenegatively predictive. Since student engagement is related toimportant academic outcomes, it could follow that certain Face-book activities may be related to those outcomes as well (Kuh,2009; Pascarella & Terenzini, 2005).
Like the research on educational applications of technology,other areas of Internet research have progressed to relate activitiesto psychosocial outcomes. Research on psychological well-beinghas shown that Internet use and online activities are importantin predicting well-being (Cotten, 2008; Gordon, Juang, & Syed,2007; Morgan & Cotten, 2003). Ellison et al. (2011) found thatusing Facebook for social information-seeking was related to in-creased social capital, and Pempek et al. (2009) found that studentsused Facebook to aid pre-established peer social relationships pri-marily by communicating via public comments. While not focusedon Facebook, a study by Junco, Heiberger, and Loken (2011)supports the idea that online activities matter when examiningacademic outcomes; the study found that using Twitter in educa-tionally relevant ways led to increases in student engagement.Given these results, it is reasonable to believe that certain typesof Facebook activities matter when examining grades.
1.5. Current study and research questions
Given the few studies available, as well as those studies’ con-flicting findings and methodological concerns, it is important toadd to the literature on Facebook use and grades by using ex-panded assessment measures to evaluate how much time is spenton Facebook and the relationship of time spent engaged in variousFacebook activities to GPA. The current study serves to extend pre-vious research by using multiple measures of frequency of Face-book use and frequency of engagement in various types ofFacebook activities. The effect of gender, ethnicity and socioeco-nomic status are important variables when examining the out-comes of technology use, but only one of the previous studies onFacebook use and grades took those factors into account (Paseket al., 2009). In this study, gender, ethnicity and socioeconomic sta-tus are included as control variables. Previous studies relied onself-report of student grades; however, this study will examine ac-tual overall student grade point averages collected through theuniversity registrar. In any linear model of Facebook use andgrades, it is important to control for high school GPA (HSGPA), con-sistently found to be the strongest predictor of overall college GPA(DeBerard, Speilmans, & Julka, 2004; Geiser & Santelices, 2007;Williford, 2009). In this study, HSGPA was included in the analysesin order to parse out the variance attributable to pre-existing dif-ferences in academic ability and also to place other predictors incontext. Lastly, a continuous measure of time spent studying wasused as an outcome variable.
Astin (1984) stated that students reach academic goals becauseof the time and effort spent on activities designed to reach thosegoals, and Chickering and Gamson (1987) emphasized that theamount of time students spend engaged in academic work ishighly related to academic success. Because students have a fixedamount of time available in any given day, and because time ontask is an important factor in academic success, this paper positsthat students who spend more time on Facebook will have lesstime to study and therefore will have lower grades. Research onInternet use has revealed that some online activities have a posi-tive effect and some a negative effect on psychological outcomes;
s: The relationship between multiple indices of Facebook use and academic026

4 R. Junco / Computers in Human Behavior xxx (2011) xxx–xxx
a similar pattern has also been detected related to technology useand academic outcomes (Bliuc et al., 2010; Cotten, 2008; Ellisonet al., 2011; Gordon et al., 2007; Junco & Cotten, 2010; Juncoet al., 2011; Morgan & Cotten, 2003; Pempek et al., 2009; Rizzutoet al., 2009). Junco’s (2011) findings confirmed that some Facebookactivities were positively related and some negatively related tostudent engagement. Therefore, this study will also examine theextent to which Facebook activities relate to time spent studyingand student grades.
The research questions examined were:
� Question 1: Is there a relationship among time spent on Facebook,frequency of Facebook activities and grades?� Question 2: Is there a relationship among frequency of checking
Facebook, frequency of Facebook activities and grades?� Question 3: Is there a relationship among time spent on Facebook,
frequency of Facebook activities and time spent preparing for class?� Question 4: Is there a relationship among frequency of checking
Facebook, frequency of Facebook activities and time spent prepar-ing for class?
2. Methods
2.1. Participants
All students surveyed were US residents admitted through theregular admissions process at a 4-year, public, primarily residentialinstitution in the northeastern United States (N = 3866). The stu-dents were sent a link to a survey hosted on SurveyMonkey.com, asurvey-hosting website, through their university-sponsored emailaccounts. For the students who did not participate immediately,two additional reminders were sent, 1 week apart. Participants wereoffered a chance to enter a drawing to win one of 90 $10 Amazon.comgift cards as incentive. A total of 1839 surveys were completed for anoverall response rate of 48%. The data were downloaded as an SPSSfile directly from SurveyMonkey, screened for anomalies andanalyzed using PASW (formally SPSS) Statistics 18.0.
2.2. Instrument/measures
To provide multiple measures for accuracy checks in reporting,students were asked to estimate their time spent on Facebook(FBTime) as well as how often they checked Facebook (FBCheck).Students were asked to determine average time spent daily andtime spent ‘‘yesterday,’’ as well as the average number of timesthey check Facebook daily and ‘‘yesterday.’’ FBTime was evaluatedby asking students: ‘‘On average, about how much time per day doyou spend on the following activities?’’ and ‘‘How much time didyou spend on each of these activities yesterday?’’ with a promptfor Facebook (along with prompts for other technologies includedfor forthcoming analyses). Students used a pull-down menu to se-lect the hours and minutes spent using Facebook. FBCheck wasevaluated by asking students: ‘‘On average, how many times perday do you check Facebook?’’ and ‘‘How many times did you checkFacebook yesterday?’’ Respondents were permitted to input anumber of their choosing in a blank field. Hours and minutes usingFacebook were converted to minutes for this study. Students werealso asked: ‘‘About how many hours do you spend in a typical 7-day week doing each of the following?’’ with a prompt for ‘‘prepar-ing for class.’’ As with time spent on Facebook, answers to thequestion were converted to minutes for these analyses.
Students were asked to approximate the frequency with whichthey participated in various activities on Facebook. The possibletypes of Facebook activities change according to the addition ordeletion of features, so the list of Facebook activities was devel-oped by soliciting input from the author’s Facebook network. The
Please cite this article in press as: Junco, R. Too much face and not enough bookperformance. Computers in Human Behavior (2011), doi:10.1016/j.chb.2011.08.
author’s Facebook network includes a mix of undergraduate andgraduate students, researchers, faculty members, technologyindustry professionals and personal friends. A public status updatewas posted stating: ‘‘I need your help for my next research project.What are the things you do on Facebook?’’ The items submitted by39 members of the network were then collated and compiled into anon-overlapping list of 14 items. These 14 items were shared withtwo separate groups of undergraduate students for input, revisedand posted on Facebook for comments. All of the items from theoriginal list were kept, and most of them were edited for clarityand relevance. The final list of 14 items can be viewed in theAppendix. In the survey, students were asked: ‘‘How frequentlydo you perform the following activities when you are on Face-book?’’ Facebook activity items were coded using a five-point Lik-ert scale ranging from ‘‘Very Frequently (close to 100% of thetime)’’ to ‘‘Never.’’ For this study, ‘‘Never’’ was coded as 1; ‘‘Rarely(25%)’’ as 2; ‘‘Sometimes (50%)’’ as 3; ‘‘Somewhat Frequently(75%)’’ as 4; and ‘‘Very Frequently (close to 100% of the time) as 5.
Students gave the researcher permission to access their aca-demic records to obtain their overall grade point averages. OverallGPAs were measured on a 4.0 scale ranging from 0 for ‘F’ to 4.0 for‘A’. Students also gave the researcher permission to obtain their ac-tual high school grade point averages (HSGPAs), which were sub-mitted to the university during the admissions process. Highschool grades were also measured on a 4.0 scale ranging from 0for ‘F’ to 4.0 for ‘A’.
2.3. Analyses
Descriptive statistics were run to illustrate the demographiccharacteristics of the sample and to describe Facebook use. Corre-lations were examined to evaluate the relationship between Face-book frequency-of-use measures and time spent preparing forclass. To answer the research questions, four hierarchical(blocked) linear regression analyses were conducted to determinewhich variables predict overall college GPA and time spent pre-paring for class. Using hierarchical linear regression allows forthe selection of number and order of predictors inserted intothe model, and ‘‘blocks’’ or groups them based upon a theoreticalconstruct. The blocks, in order, were: demographic variables (gen-der, ethnicity and parental education level), high school GPA, fre-quency of Facebook use (FBTime or FBCheck) and frequency ofFacebook activities. Demographic variables were included in theirown block because previous research has found the effect of gen-der, socioeconomic status and/or ethnicity is significant in rela-tion to technology use (Cooper & Weaver, 2003; DiMaggioet al., 2004; Hargittai, 2008a; Junco et al., 2010; Kaiser FamilyFoundation, 2004). High school GPA was included as both a con-trol variable and in order to compare other predictors’ relativeimpact on the dependent variables. Frequency and activities wereincluded in separate blocks to evaluate the relative impact ofeach, as previous research has shown that online activities oftenmatter more than time spent online when evaluating outcomes(Cotten, 2008; Ellison et al., 2011; Gordon et al., 2007; Junco &Cotten, 2010; Junco et al., 2011; Morgan & Cotten, 2003; Pempeket al., 2009). Categorical variables were dummy-coded for pur-poses of the regression analyses. The reference categories forthese variables were: female, Latino students and ‘‘some college’’for highest parental education.
Analyses were conducted to test whether the data met theassumptions of hierarchical linear regression. To test for homo-scedasticity, collinearity and important outliers, collinearity diag-nostics and examinations of residuals were performed. The curveestimation procedure of PASW was used to plot both linear andquadratic functions to examine linearity and found that all vari-ables met the requirements of linearity needed for a hierarchical
s: The relationship between multiple indices of Facebook use and academic026
R. Junco / Computers in Human Behavior xxx (2011) xxx–xxx 5
blocked linear regression. Examination of model fit using thecurve estimation procedure indicated there were a number ofoutliers, which were removed from subsequent analyses. First,15 outliers were deleted because they had high school GPAsgreater than 4.00 (while some high schools award extra academicpoints for advanced placement or honors courses, this was not astandard practice of high schools in this sample). Second, 20 out-liers were deleted because they had high school GPAs less than2.00 (like those who had GPAs above 4.00, those below 2.00 werenot the norm in this sample and were enrolled through admis-sions exceptions). Third, 17 outliers were deleted based on fre-quency of use measures: 15 cases where students reportedspending greater than or equal to 600 min per day on Facebook,and two cases where students reported checking Facebook over500 times per day. Lastly, nine outliers were deleted because theyreported studying greater than 4200 min per week. In summary,61 cases were removed from subsequent analyses, bringing thetotal sample size to 1778 students. Collinearity diagnostics foundthat the independent variables were not highly correlated,with all tolerance coefficients being greater than 0.20. Examina-tion of the residual plots show that variance of residual errorwas constant across all values of independents, indicatinghomoscedasticity.
3. Results
3.1. Descriptive statistics
Sixty-four percent of those who took the survey were femaleand 36% were male. The mean age of the sample was 21 with astandard deviation of four. The age of participants ranged from17 to 56, though over 86% were between 18 and 22 years old.Thirty percent of students in the sample were first year students,24% were sophomores, 21% were juniors and 25% were seniors.Highest educational level attained by either parent was as follows:28% had a high school degree or less, 25% completed some college,34% were college graduates and 13% had a graduate degree. Interms of race and ethnicity, the sample was overwhelmingly Cau-casian, with 91% of students listing that as their race. Additionally,5% of the sample was African American, 2% were Latino, 1% wereAsian American, and 2% identified as ‘‘other’’ (Native Americanswere included in ‘‘other’’ because there were only four in the sam-ple). The gender, race, and ethnic breakdown of the sample wassimilar to that of the overall university population, excepting aslight overrepresentation of women in this sample. The averageHSGPA in the sample was 3.32 (SD .46) and the average overallGPA was 2.95 (SD .65). Students reported preparing for class anaverage of 706 min (SD 526) per week.
In this sample, 92% of students reported spending at least sometime on Facebook, congruent with findings by Smith and Caruso(2010). Facebook users in this sample spent a substantial amountof time on Facebook, reporting a mean of 106 min (SD 93) on thesite per day and spending a mean of 79 min (SD 82) on the site‘‘yesterday.’’ Students also reported checking Facebook frequently,with a mean of 6 (SD 8) times per day on average and a mean of 5(SD 7) times ‘‘yesterday.’’ To further examine the relationship be-tween FBTime and FBCheck, an additional variable was calculateddividing the amount of time students spent on Facebook by thenumber of times they checked the site. The mean amount of timespent on Facebook per check was 24 min (SD 20). Furthermore,students reported spending an average of 22 min (SD 22) on Face-book each time they checked ‘‘yesterday.’’
The average amount of time spent on Facebook was much high-er than reported by Ellison et al. (2007) and Pempek et al. (2009),and closer to averages reported by Junco (2009). A possible
Please cite this article in press as: Junco, R. Too much face and not enough bookperformance. Computers in Human Behavior (2011), doi:10.1016/j.chb.2011.08.
explanation for the higher averages in the current study may bethat, like in the Junco (2011) study, students were given the oppor-tunity to select a continuous estimate of time spent instead of aforced-choice categorical estimate. This may have led to moreintrospection about how much actual time is spent on Facebook.Furthermore, categorical questions may reflect an a priori bias onthe part of the researcher about how much time researchers be-lieve students spend on Facebook that may not be reflected in con-tinuous questions.
Students reported participation in a variety of Facebook activi-ties, with ‘‘viewing photos,’’ ‘‘commenting on content’’ and ‘‘check-ing to see what someone is up to’’ being the three most popularactivities (see Fig. 1). Frequencies of Facebook activities found inthe current study were generally congruent with those reportedby Pempek et al. (2009), though that study used a different mea-surement scale and did not examine the same activities.
3.2. Correlations
The correlation between HSGPA and FBTime was not significant(Pearson’s r = �.038, p > .1). There was a weak correlation betweentime spent preparing for class and FBTime (Pearson’s r = �.089,p < .001). There was a weak correlation between time spent pre-paring for class and overall GPA (Pearson’s r = .220, p < .001). Therewere moderate correlations between FBCheck and FBTime (Pear-son’s r = .422, p < .001) and between FBCheck ‘‘yesterday’’ andFBTime ‘‘yesterday’’ (Pearson’s r = .480, p < .001). Since FBTimeand FBTime ‘‘yesterday’’ were highly correlated (Pearson’s r = .76,p < .001), only FBTime was used in the regression analyses. Fur-thermore, since FBCheck and FBCheck ‘‘yesterday’’ were also highlycorrelated (Pearson’s r = .81, p < .001), only FBCheck was used inthe analyses.
3.3. Regression analyses
� Question 1: Is there a relationship among time spent on Facebook,frequency of Facebook activities and grades?The hierarchical linear regression predicting overall GPA using
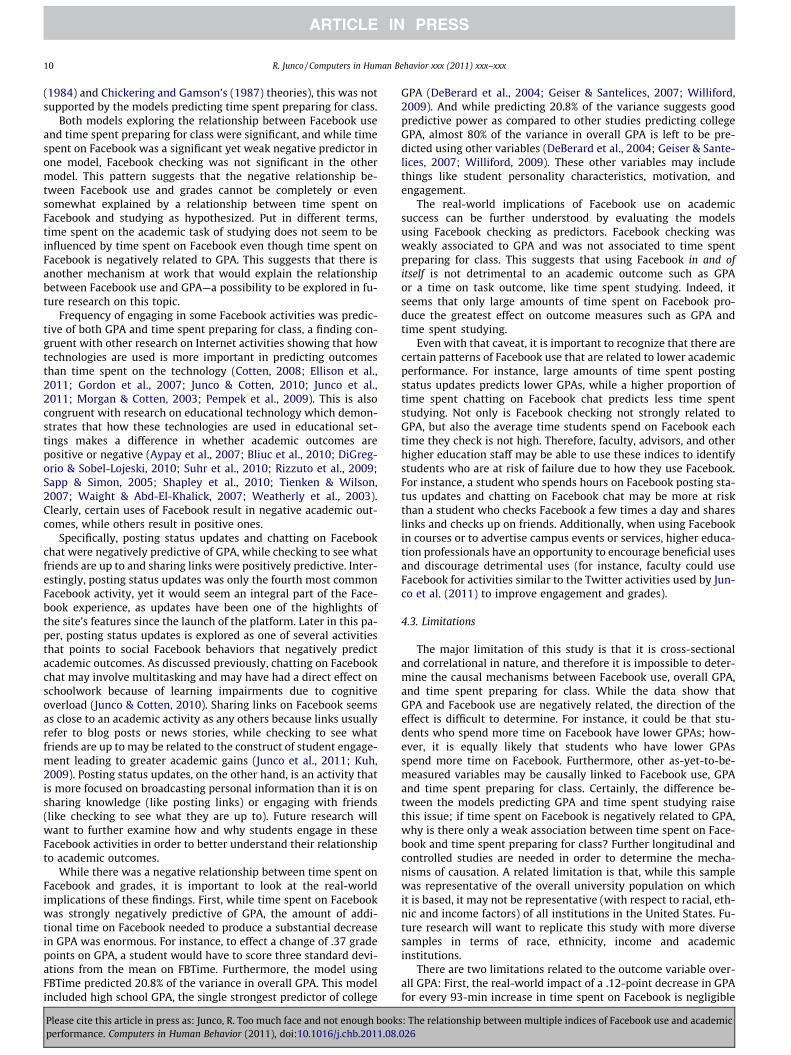
FBTime (F(25,1736) = 19.530, p < .001, Adjusted R2 = .208) was signif-icant. In this model, HSGPA, checking to see what friends are up to,sharing links and having a parent (or parents) with an advancedgraduate degree were all positive predictors of overall GPA, whileFBTime, being African American, posting status updates and beingmale were negative predictors of overall GPA (Table 1).
� Question 2: Is there a relationship among frequency of checkingFacebook, frequency of Facebook activities and grades?
The hierarchical linear regression predicting overall GPA usingFBCheck (F(25,1741) = 17.262, p < .001, Adjusted R2 = .187) was sig-nificant. In this model, HSGPA and having a parent (or parents)with an advanced graduate degree were positive predictors ofoverall GPA, while chatting on Facebook chat, posting status up-dates, being male and FBCheck were negative predictors of overallGPA (Table 2).
� Question 3: Is there a relationship among time spent on Facebook,frequency of Facebook activities and time spent preparing for class?
The hierarchical linear regression predicting time spent prepar-ing for class using FBTime (F(25,1736) = 2.909, p < .001, AdjustedR2 = .026) was significant. In this model, HSGPA was the only posi-tive predictor of time spent preparing for class, while being male,chatting on Facebook chat, and FBTime were negative predictors(Table 3).
s: The relationship between multiple indices of Facebook use and academic026
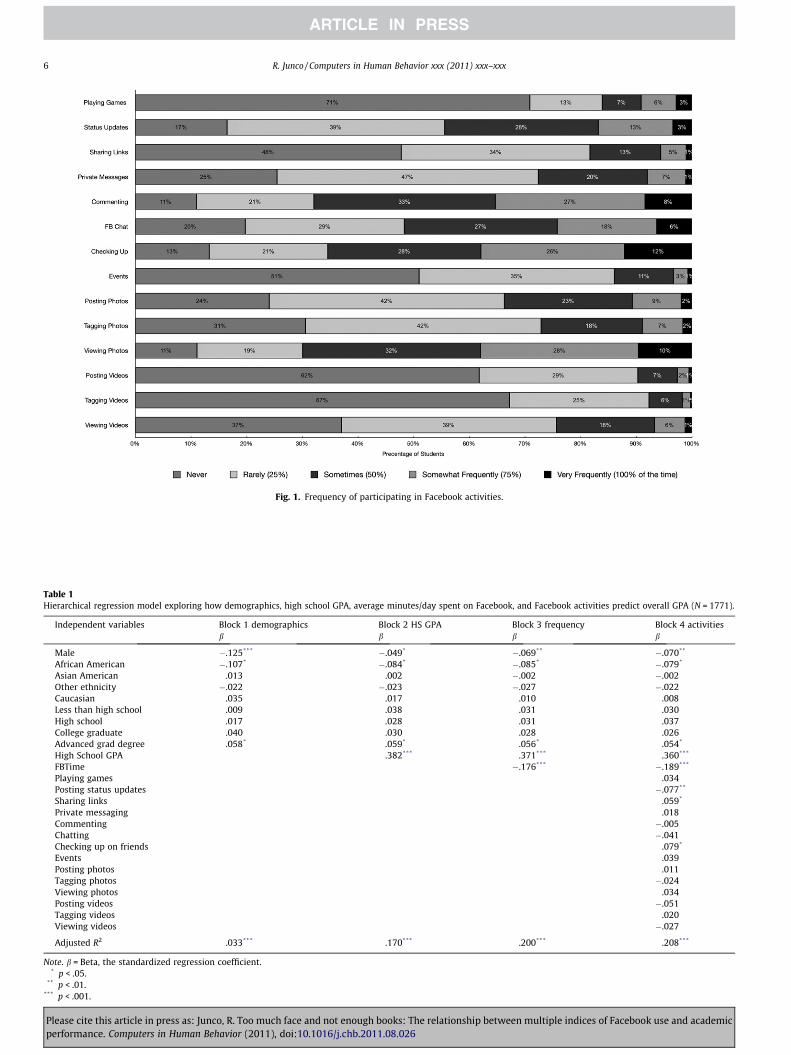
Fig. 1. Frequency of participating in Facebook activities.
Table 1Hierarchical regression model exploring how demographics, high school GPA, average minutes/day spent on Facebook, and Facebook activities predict overall GPA (N = 1771).
Independent variables Block 1 demographics Block 2 HS GPA Block 3 frequency Block 4 activitiesb b b b
Male �.125*** �.049* �.069** �.070**
African American �.107* �.084* �.085* �.079*
Asian American .013 .002 �.002 �.002Other ethnicity �.022 �.023 �.027 �.022Caucasian .035 .017 .010 .008Less than high school .009 .038 .031 .030High school .017 .028 .031 .037College graduate .040 .030 .028 .026Advanced grad degree .058* .059* .056* .054*
High School GPA .382*** .371*** .360***
FBTime �.176*** �.189***
Playing games .034Posting status updates �.077**
Sharing links .059*
Private messaging .018Commenting �.005Chatting �.041Checking up on friends .079*
Events .039Posting photos .011Tagging photos �.024Viewing photos .034Posting videos �.051Tagging videos .020Viewing videos �.027
Adjusted R2 .033*** .170*** .200*** .208***
Note. b = Beta, the standardized regression coefficient.* p < .05.
** p < .01.*** p < .001.
6 R. Junco / Computers in Human Behavior xxx (2011) xxx–xxx
Please cite this article in press as: Junco, R. Too much face and not enough books: The relationship between multiple indices of Facebook use and academicperformance. Computers in Human Behavior (2011), doi:10.1016/j.chb.2011.08.026

Table 2Hierarchical regression model exploring how demographics, high school GPA, Average times/day checked Facebook, and Facebook activities predict overall GPA (N = 1776).
Independent variables Block 1 demographics Block 2 HS GPA Block 3 frequency Block 4 activitiesb b b b
Male �.124*** �.048* �.055* �.062*
African American �.102* �.080* �.081* �.069Asian American .015 .003 .003 .002Other ethnicity �.019 �.020 �.023 �.014Caucasian .042 .022 .021 .024Less than high school .010 .038 .036 .033High school .019 .029 .029 .032College graduate .043 .031 .030 .025Advanced grad degree .059* .060* .059* .056*
High school GPA .383*** .382*** .368***
FBCheck �.072 �.060*
Playing games �.004Posting status updates �.088**
Sharing links .051Private messaging .023Commenting �.008Chatting �.089**
Checking up on friends .066*
Events .042Posting photos .026Tagging photos �.039Viewing photos .031Posting videos �.062Tagging videos .026Viewing videos �.030
Adjusted R2 .033*** .171*** .175*** .187***
Note. b = Beta, the standardized regression coefficient.* p < .05.
** p < .01.*** p < .001.
Table 3Hierarchical regression model exploring how demographics, high school GPA, average minutes/day spent on Facebook, and Facebook activities predict time spent preparing forclass (N = 1762).
Independent variables Block 1 demographics Block 2 HS GPA Block 3 frequency Block 4 activitiesb b b b
Male �.100*** �.085*** �.096*** �.101***
African American �.033 �.028 �.029 �.022Asian American .005 .003 .000 �.001Other ethnicity .038 .038 .035 .042Caucasian .010 .007 .003 .009Less than high school .015 .021 .017 .017High school �.030 �.028 �.026 �.029College graduate �.044 �.046 �.047 �.048Advanced grad degree �.017 �.017 �.018 �.019High school GPA .077** .071** .061*
FBTime �.095*** �.062*
Playing games �.019Posting status updates �.023Sharing links .007Private messaging �.017Commenting .045Chatting �.090**
Checking up on friends .031Events .008Posting photos �.008Tagging photos �.049Viewing photos .023Posting videos �.002Tagging videos �.039Viewing videos .031
Adjusted R2 .009** .014*** .023*** .026***
Note. b = Beta, the standardized regression coefficient.* p < .05.
** p < .01.*** p < .001.
R. Junco / Computers in Human Behavior xxx (2011) xxx–xxx 7
Please cite this article in press as: Junco, R. Too much face and not enough books: The relationship between multiple indices of Facebook use and academicperformance. Computers in Human Behavior (2011), doi:10.1016/j.chb.2011.08.026

Table 4Hierarchical regression model exploring how demographics, high school GPA, average times/day checked Facebook, and Facebook activities predict time spent preparing for class(N = 1767).
Independent variables Block 1 demographics Block 2 HS GPA Block 3 frequency Block 4 activitiesb b b b
Male �.100*** �.085*** �.088*** �.099***
African American �.028 �.023 �.024 �.015Asian American .007 .004 .004 .002Other ethnicity .041 .040 .039 .046Caucasian .017 .013 .013 .020Less than high school .016 .021 .020 .019High school �.027 �.025 �.025 �.028College graduate �.042 �.044 �.045 �.048Advanced grad degree �.016 �.016 �.016 �.018High school GPA .079** .079** .065**
FBCheck �.037 �.017Playing games �.030Posting status updates �.027Sharing links .004Private messaging �.016Commenting .043Chatting �.105***
Checking up on friends .025Events .010Posting photos �.003Tagging photos �.054Viewing photos .021Posting videos �.005Tagging videos �.037Viewing videos .030
Adjusted R2 .009** .015*** .015*** .024***
Note. b = Beta, the standardized regression coefficient.⁄ p < .05.
** p < .01.*** p < .001.
8 R. Junco / Computers in Human Behavior xxx (2011) xxx–xxx
� Question 4: Is there a relationship among frequency of checkingFacebook, frequency of Facebook activities and time spent prepar-ing for class?
The hierarchical linear regression predicting time spent prepar-ing for class using FBCheck (F(25,1741) = 2.744, p < .001, AdjustedR2 = .024) was significant. In this model, HSGPA was a positive pre-dictor of time spent preparing for class, while chatting on Facebookchat and being male were negative predictors (Table 4).
4. Discussion
4.1. Research questions
� Question 1: Is there a relationship among time spent on Facebook,frequency of Facebook activities and grades?
FBTime was negatively predictive of overall GPA. Furthermore,frequency of checking to see what friends are up to and sharinglinks were positively predictive of overall GPA, while frequencyof posting status updates was negatively predictive. Confirmingprevious research, HSGPA proved the strongest predictor of overallGPA with a b weight of .360 (DeBerard et al., 2004; Geiser & Sante-lices, 2007; Williford, 2009). The b weight of time spent on Face-book was �.189. Therefore, an increase of one standard deviationin time spent on Facebook (93 min) decreased overall GPA by.189 standard deviation, while an increase of one standard devia-tion in HSGPA (.46) equated to a .360 standard deviation increasein overall GPA. In other words, time spent on Facebook is half asstrong of a predictor of overall GPA as HSGPA, the strongest singlepredictor of college grades.
While taking important control variables into account, timespent on Facebook is a strong negative predictor of overall college
Please cite this article in press as: Junco, R. Too much face and not enough bookperformance. Computers in Human Behavior (2011), doi:10.1016/j.chb.2011.08.
GPA. Specifically, large increases in time spent on Facebook relateto lower overall GPAs. In this model, increasing time spent on Face-book by one standard deviation (or 93 min) was related to a .189standard deviation decrease in GPA. Because the mean time spenton Facebook was 106 min, an increase of one standard deviationserves to double time spent on Facebook. To further illustrate this,consider this example: a student who spends 279 min (or threetimes the standard deviation of FBTime) more on Facebook thanaverage has an overall GPA .37 points (the standard deviation ofoverall GPA multiplied by .189 then multiplied by three) lowerthan average.
This finding is congruent with both Astin’s (1984) and Chicker-ing and Gamson’s (1987) theories that the amount of time engagedin academic work is predictive of academic success. While timespent on Facebook in and of itself might theoretically not beproblematic, large amounts of time spent on Facebook seem to de-tract from time spent focusing on academic work. Focusing lesstime on academic work would certainly negatively impact aca-demic success, measured in this case by grades. These results showthat students have to spend an enormous amount of time on Face-book for that use to have a substantial real-world impact on overallGPA.
� Question 2: Is there a relationship among frequency of checkingFacebook, frequency of Facebook activities and grades?
Frequency of checking Facebook was also negatively predictiveof overall GPA, although the relationship was not strong. Further-more, frequency of checking to see what friends are up to was pos-itively predictive of overall GPA, while frequency of chatting onFacebook chat and frequency of posting status updates were nega-tively predictive. Again, HSGPA was the strongest predictor ofoverall GPA with a b weight of .368. The b weight of FBCheck
s: The relationship between multiple indices of Facebook use and academic026

R. Junco / Computers in Human Behavior xxx (2011) xxx–xxx 9
was �.060, which was much lower than the corresponding bweight for FBTime. An increase of one standard deviation in HSGPA(.46) equated to a .368 standard deviation increase in overall GPA,while an increase of one standard deviation in FBCheck (8 checks)decreased overall GPA by .060 standard deviation. In this model,the predictive strength of FBCheck was nowhere near the predic-tive strength of HSPGA. In fact, frequency of chatting on Facebookchat, posting status updates and checking to see what friends areup to were stronger predictors of overall GPA.
It seems that the behavior of checking Facebook is not related totime spent on Facebook for a few reasons: First, there was only amoderate correlation between FBCheck and FBTime (Pearson’sr = .422, p < .001). While the correlation was significant, the vari-ables do not share a large amount of variance. Squaring Pearson’sr gives the proportion of variance shared by the two variables; inthe case of FBCheck and FBTime, the proportion of variance sharedis only 18%. Second, it is clear that the FBCheck model predicts asubstantially lower proportion of the variance in overall GPA bothby examining the b weights and by evaluating the adjusted R2 ascompared to the FBTime model. This makes further sense if oneconsiders the difference between the two behaviors illustrated byan example: one student may log into Facebook once and spend2 h on the site, while another may log into Facebook ten timesand spend only 2 min online each time. Lastly, the average amountof time students spent on Facebook each time they checked the sitewas low, showing that the moderate correlation between FBTimeand FBCheck cannot be explained by students checking Facebookfew times but staying on for long periods of time during each login.
While there is a negative relationship between average numberof times a student checks Facebook and overall GPA, that relation-ship is weak and does not contribute much to real-world changesin overall GPA. Therefore, the simple act of checking Facebook isnot as worrisome a behavior when it comes to academic outcomesas time spent on Facebook. This conclusion is congruent with bothAstin’s (1984) and Chickering and Gamson’s (1987) theories abouttime, effort and academic outcomes—that is, using Facebook in andof itself is not problematic; however, large amounts of time spenton Facebook seem to detract from academic activities related toGPA. The following two models explore the relationship betweenFacebook use and time spent studying in order to evaluate whetherthe relationship between Facebook use and GPA can be explainedby students spending less time preparing for their courses.
� Question 3: Is there a relationship among time spent on Facebook,frequency of Facebook activities and time spent preparing for class?
Even though time spent on Facebook was significantly nega-tively related to time spent preparing for class, the relationshipwas weak after including Facebook activities. Before activities wereincluded in the third block, time spent on Facebook was a strongernegative predictor of time spent preparing for class (with a bweight of �.095). The inclusion of Facebook activities in the modeldecreased the predictive ability of time spent on Facebook. Oneexplanation for this drop in b value is that the main activity thatproduced the negative relationship between FBTime and timespent studying was chatting via Facebook chat. Therefore, partici-pation in Facebook chat is related to less time spent preparingfor class, presumably because of the amount of time necessary toengage in chat and the focus needed to do so.
Unlike previous models, HSGPA was not the strongest predictorof time spent studying with a b weight of .061, which made it aweaker predictor than being male, frequency of chatting on Face-book chat or FBTime, respectively. In fact, HSGPA was the weakestpredictor of time spent preparing for class, suggesting that prioracademic ability is only slightly related to time spent studying.
Please cite this article in press as: Junco, R. Too much face and not enough bookperformance. Computers in Human Behavior (2011), doi:10.1016/j.chb.2011.08.
While HSGPA predicted college GPA, it does not seem that this ef-fect is because students with stronger academic abilities study anymore (or less) than those with weaker abilities. The b weight oftime spent on Facebook was �.062. Therefore, an increase of onestandard deviation in time spent on Facebook (93 min) decreasedhours spent preparing for class by .062 standard deviation, show-ing a weak relationship between the two.
While taking important control variables into account, timespent on Facebook is a weak negative predictor of time spentstudying. Specifically, large increases in time spent on Facebook re-lated to slightly less time spent preparing for class. In this model,an increase of one standard deviation in FBTime (93 min) relatedto a .062 standard deviation decrease in time spent preparing forclass, which equated to 33 min per week. To further illustrate this,consider an example of a student scoring three standard deviationsabove the mean on time spent on Facebook. This student wouldspend 279 min (or 4 h and 40 min) more on Facebook than averageand would spend 99 min (or 1 h and 40 min) less per week prepar-ing for class than average.
Interestingly, the fact that Facebook use was weakly related totime spent preparing for class was not congruent with the fact thattime spent on Facebook was strongly related to overall GPA, andwas not congruent with Astin’s (1984) and Chickering and Gam-son’s (1987) theories of time on task. The fact that time spent onFacebook is only slightly negatively related to time spent preparingfor class suggests that there is another mechanism at work otherthan the detraction of time away from studying that is responsiblefor a negative relationship between time spent on Facebook andgrades. An examination of the relationship between frequency ofchatting on Facebook chat and time spent preparing for classmay shed some light on this finding. Junco and Cotten (2010) foundthat time spent chatting online was related to students reportingnot getting their schoolwork done. In that study, chatting onlinewas related to multitasking and may have had a direct effect onschoolwork because of learning impairments due to cognitiveoverload (Junco & Cotten, 2010). While not examined in the cur-rent study, it could be that an activity like chatting lends itselfmore to multitasking and to multitasking’s resultant academicimpairments.
� Question 4: Is there a relationship among frequency of checkingFacebook, frequency of Facebook activities and time spent prepar-ing for class?
Facebook checking was not related to time spent preparing forclass. Furthermore, a similar pattern of results emerged withHSGPA being weakly, positively related to time spent preparingfor class, and chatting on Facebook chat being negatively related.As was discovered in the models examining Facebook use andGPA, checking Facebook is weakly related to time spent on Face-book, and therefore must be treated as a wholly different behavior.
4.2. Summary
Congruent with findings by Kirschner and Karpinski (2010) butconflicting with findings by Kolek and Saunders (2008) and Paseket al. (2009), time spent on Facebook was strongly negatively pre-dictive of overall college GPA. In this sample, time spent on Face-book was half as strong of a predictor as the strongest singlepredictor of college GPA, high school GPA. Additionally, while timespent on Facebook was a strong negative predictor of GPA, check-ing Facebook was a weak negative predictor, supporting the ideathat these are two different behaviors. While models predictingoverall GPA supported the notion that time spent on Facebookwould detract from time spent on academic activities (and there-fore lead to poorer academic performance as suggested by Astin’s
s: The relationship between multiple indices of Facebook use and academic026
10 R. Junco / Computers in Human Behavior xxx (2011) xxx–xxx
(1984) and Chickering and Gamson’s (1987) theories), this was notsupported by the models predicting time spent preparing for class.
Both models exploring the relationship between Facebook useand time spent preparing for class were significant, and while timespent on Facebook was a significant yet weak negative predictor inone model, Facebook checking was not significant in the othermodel. This pattern suggests that the negative relationship be-tween Facebook use and grades cannot be completely or evensomewhat explained by a relationship between time spent onFacebook and studying as hypothesized. Put in different terms,time spent on the academic task of studying does not seem to beinfluenced by time spent on Facebook even though time spent onFacebook is negatively related to GPA. This suggests that there isanother mechanism at work that would explain the relationshipbetween Facebook use and GPA—a possibility to be explored in fu-ture research on this topic.
Frequency of engaging in some Facebook activities was predic-tive of both GPA and time spent preparing for class, a finding con-gruent with other research on Internet activities showing that howtechnologies are used is more important in predicting outcomesthan time spent on the technology (Cotten, 2008; Ellison et al.,2011; Gordon et al., 2007; Junco & Cotten, 2010; Junco et al.,2011; Morgan & Cotten, 2003; Pempek et al., 2009). This is alsocongruent with research on educational technology which demon-strates that how these technologies are used in educational set-tings makes a difference in whether academic outcomes arepositive or negative (Aypay et al., 2007; Bliuc et al., 2010; DiGreg-orio & Sobel-Lojeski, 2010; Suhr et al., 2010; Rizzuto et al., 2009;Sapp & Simon, 2005; Shapley et al., 2010; Tienken & Wilson,2007; Waight & Abd-El-Khalick, 2007; Weatherly et al., 2003).Clearly, certain uses of Facebook result in negative academic out-comes, while others result in positive ones.
Specifically, posting status updates and chatting on Facebookchat were negatively predictive of GPA, while checking to see whatfriends are up to and sharing links were positively predictive. Inter-estingly, posting status updates was only the fourth most commonFacebook activity, yet it would seem an integral part of the Face-book experience, as updates have been one of the highlights ofthe site’s features since the launch of the platform. Later in this pa-per, posting status updates is explored as one of several activitiesthat points to social Facebook behaviors that negatively predictacademic outcomes. As discussed previously, chatting on Facebookchat may involve multitasking and may have had a direct effect onschoolwork because of learning impairments due to cognitiveoverload (Junco & Cotten, 2010). Sharing links on Facebook seemsas close to an academic activity as any others because links usuallyrefer to blog posts or news stories, while checking to see whatfriends are up to may be related to the construct of student engage-ment leading to greater academic gains (Junco et al., 2011; Kuh,2009). Posting status updates, on the other hand, is an activity thatis more focused on broadcasting personal information than it is onsharing knowledge (like posting links) or engaging with friends(like checking to see what they are up to). Future research willwant to further examine how and why students engage in theseFacebook activities in order to better understand their relationshipto academic outcomes.
While there was a negative relationship between time spent onFacebook and grades, it is important to look at the real-worldimplications of these findings. First, while time spent on Facebookwas strongly negatively predictive of GPA, the amount of addi-tional time on Facebook needed to produce a substantial decreasein GPA was enormous. For instance, to effect a change of .37 gradepoints on GPA, a student would have to score three standard devi-ations from the mean on FBTime. Furthermore, the model usingFBTime predicted 20.8% of the variance in overall GPA. This modelincluded high school GPA, the single strongest predictor of college
Please cite this article in press as: Junco, R. Too much face and not enough bookperformance. Computers in Human Behavior (2011), doi:10.1016/j.chb.2011.08.
GPA (DeBerard et al., 2004; Geiser & Santelices, 2007; Williford,2009). And while predicting 20.8% of the variance suggests goodpredictive power as compared to other studies predicting collegeGPA, almost 80% of the variance in overall GPA is left to be pre-dicted using other variables (DeBerard et al., 2004; Geiser & Sante-lices, 2007; Williford, 2009). These other variables may includethings like student personality characteristics, motivation, andengagement.
The real-world implications of Facebook use on academicsuccess can be further understood by evaluating the modelsusing Facebook checking as predictors. Facebook checking wasweakly associated to GPA and was not associated to time spentpreparing for class. This suggests that using Facebook in and ofitself is not detrimental to an academic outcome such as GPAor a time on task outcome, like time spent studying. Indeed, itseems that only large amounts of time spent on Facebook pro-duce the greatest effect on outcome measures such as GPA andtime spent studying.
Even with that caveat, it is important to recognize that there arecertain patterns of Facebook use that are related to lower academicperformance. For instance, large amounts of time spent postingstatus updates predicts lower GPAs, while a higher proportion oftime spent chatting on Facebook chat predicts less time spentstudying. Not only is Facebook checking not strongly related toGPA, but also the average time students spend on Facebook eachtime they check is not high. Therefore, faculty, advisors, and otherhigher education staff may be able to use these indices to identifystudents who are at risk of failure due to how they use Facebook.For instance, a student who spends hours on Facebook posting sta-tus updates and chatting on Facebook chat may be more at riskthan a student who checks Facebook a few times a day and shareslinks and checks up on friends. Additionally, when using Facebookin courses or to advertise campus events or services, higher educa-tion professionals have an opportunity to encourage beneficial usesand discourage detrimental uses (for instance, faculty could useFacebook for activities similar to the Twitter activities used by Jun-co et al. (2011) to improve engagement and grades).
4.3. Limitations
The major limitation of this study is that it is cross-sectionaland correlational in nature, and therefore it is impossible to deter-mine the causal mechanisms between Facebook use, overall GPA,and time spent preparing for class. While the data show thatGPA and Facebook use are negatively related, the direction of theeffect is difficult to determine. For instance, it could be that stu-dents who spend more time on Facebook have lower GPAs; how-ever, it is equally likely that students who have lower GPAsspend more time on Facebook. Furthermore, other as-yet-to-be-measured variables may be causally linked to Facebook use, GPAand time spent preparing for class. Certainly, the difference be-tween the models predicting GPA and time spent studying raisethis issue; if time spent on Facebook is negatively related to GPA,why is there only a weak association between time spent on Face-book and time spent preparing for class? Further longitudinal andcontrolled studies are needed in order to determine the mecha-nisms of causation. A related limitation is that, while this samplewas representative of the overall university population on whichit is based, it may not be representative (with respect to racial, eth-nic and income factors) of all institutions in the United States. Fu-ture research will want to replicate this study with more diversesamples in terms of race, ethnicity, income and academicinstitutions.
There are two limitations related to the outcome variable over-all GPA: First, the real-world impact of a .12-point decrease in GPAfor every 93-min increase in time spent on Facebook is negligible
s: The relationship between multiple indices of Facebook use and academic026

R. Junco / Computers in Human Behavior xxx (2011) xxx–xxx 11
at best. That being said, it is important to note that large changes intime spent on Facebook relate to larger changes in GPA. Second, itis unclear if GPA is the best proxy measure of academic success.Certainly, there are other variables related to academic success,such as cognitive development, psychosocial development, self-es-teem, locus of control, moral and ethical development and persis-tence (Kuh, 2009). While this study did not measure these otheroutcome variables, further research on these outcomes is bothencouraged and necessary to obtain a better picture of the relation-ship between Facebook use and academic success. Additionally, assuggested previously, future research may want to include multi-tasking as a predictor variable to attempt to parse out the effectsof divided attention while using Facebook.
A final limitation was related to estimating time spent on Face-book and time spent preparing for class. Specifically, FBTime,FBCheck, Facebook activities and time spent preparing for classwere all assessed via self-report. Investigators conducting furtherresearch on this topic should keep in mind that self-reported timespent on Facebook and checking Facebook yield different estimatesof frequency of use and that asking to estimate average time andtime spent ‘‘yesterday’’ yield subtle differences as well. Therefore,future research will want to combine multiple measures of Face-book frequency of use to arrive at a more complete picture of therelationship between Facebook use and outcome variables. Addi-tionally, future research may want to ask students how much timethey are active on Facebook in addition to how long they are loggedon. Ideally, further research will attempt to make assessments ofactual time spent on Facebook, either through observations orother logging methods.
5. Conclusion
Results from this study show that time spent on Facebook andchecking Facebook were negatively related to overall GPA, whiletime spent on Facebook is slightly negatively related to time spentstudying. These results do not completely align with Astin’s (1984)and Chickering and Gamson’s (1987) models of time on task; thatis, while time spent on Facebook relates negatively to overall GPA,it does not relate in a meaningful way to time spent preparing forclass. Furthermore, while the relationship between time spent onFacebook and grades is negative, the real-world impact of said rela-tionship does not seem to be a major detriment to academic suc-cess. In other words, there may be other variables that are morestrongly related to overall GPA and time spent preparing for classthat should be the focus of examination and intervention, insteadof student use of Facebook. On the other hand, the ability of timespent on Facebook to significantly predict overall GPA indicatesthat there may be some negative academic impacts for studentswho use Facebook in certain ways.
Specific uses of Facebook are related to positive outcomes whileothers are related to negative ones. Sharing links and checking tosee what friends are up to are positively related to GPA, while post-ing status updates is negatively related. Furthermore, using Face-book chat is negatively related to time spent studying. It seemsthat using Facebook for activities that involve collecting and shar-ing information (checking to see what friends are up to and sharinglinks, respectively) is more positively predictive of outcomes thanusing Facebook for socializing (status updates and chatting). Thedistinction is seen offline on college campuses—those studentswho spend more time socializing to the exclusion of engaging inacademic work have poorer academic outcomes (Pascarella &Terenzini, 2005). Further, this distinction is similar to the one re-ported by Junco (2011), who found that using Facebook for com-municative activities (such as commenting and creating orRSVP’ing to events) was positively related to engagement, while
Please cite this article in press as: Junco, R. Too much face and not enough bookperformance. Computers in Human Behavior (2011), doi:10.1016/j.chb.2011.08.
using Facebook for non-communicative activities (playing gamesand checking to see what friends are up to) was negatively relatedto engagement.
The connection between Facebook use, student engagement,and academic outcomes is worthy of further exploration. The re-search on student engagement is clear—a more engaged studentis a more successful student (Kuh, 2009; Pascarella & Terenzini,2005). Therefore, it is important for future research to evaluatehow Facebook use influences student engagement and how, inturn, that engagement influences academic performance. The cur-rent study shows that certain uses of Facebook that mimic educa-tional behaviors—primarily, gathering information (checking to seewhat friends are up to) and sharing information (sharing links)—re-late to positive academic outcomes. While considering Junco’s(2011) finding that communicative uses of Facebook relate to posi-tive outcomes, and in tandem with the assessment of extraneousvariables like student personality characteristics and motivation,we can hope to furnish more accurate predictive models to helphigher educators generate interventions where appropriate. Thecategories of ‘‘communicative’’ and ‘‘collecting and sharing infor-mation’’ do not seem to be mutually exclusive (for instance, check-ing to see what friends are up to is included in both). There may beextraneous variables, like student personality characteristics andmotivation that relate to these important outcomes. Assessingthese variables more fully can help lead to predictive models thatcan suggest interventions for higher educators. For example, giventhe results of the current study, educators may want to targetinterventions at not just students who spend a great deal of timesocializing offline, but also those who spend a great deal of timesocializing online as well.
As the interest in using social media, like Facebook, in educa-tional settings increases, educators must be aware of how to inte-grate these sites and services in educationally relevant ways (Juncoet al., 2011). The results from the current study will help informnot only interventions for students who exhibit problem behaviors,but also interventions to support student learning and engage-ment. As Junco et al.’s (2011) research has shown, having studentscommunicate (and therefore socialize) about course content leadsto greater gains in academic performance. With Facebook, a facultymember might create a Facebook group for a course and ask stu-dents to socialize about course content and share course-relatedinformation from news sources. Information presented via such afamiliar platform—and one with generally contemporary and socialimplications—might seem more accessible or relevant to students;further research should explore the outcomes of academic infor-mation delivered in this way compared to traditional means ofinformation dissemination (e.g., paper handouts, emails, coursemanagement systems). Facebook technology should be manipu-lated by higher education professionals in a way that leveragesthe site’s ubiquity and popularity toward positive academic out-comes; by identifying and exploring the relationship between indi-vidual Facebook activities and student learning behaviors,educators might transform activities currently related to pooreroutcomes into beneficial academic experiences.
Acknowledgments
The author thanks the blind reviewers of this paper for theirvaluable and insightful feedback. He is also grateful for helpful in-put on the survey instrument from Shelia Cotten, Eszter Hargittai,and Chris Offutt. The author is grateful for help provided by MikeAbplanalp, Stephen Lee, Gerry Eisley, and Jill Mitchley in collectingand interpreting institutional-level data. Additionally, he thanksRebecca Grossman for input on the results and Chris Offut for helpwith the title. He is grateful for funding from the Lock Haven Uni-versity Faculty Professional Development Committee.
s: The relationship between multiple indices of Facebook use and academic026

12 R. Junco / Computers in Human Behavior xxx (2011) xxx–xxx
Appendix A. Facebook activities
� Playing games (FarmVille, MafiaWars, etc.).� Posting status updates.� Sharing links.� Sending private messages.� Commenting (on statuses, wall posts, pictures, etc.).� Chatting on Facebook chat.� Checking to see what someone is up to.� Creating or RSVPing to events.� Posting photos.� Tagging photos.� Viewing photos.� Posting videos.� Tagging videos.� Viewing videos.
References
Abramson, L. (February 9, 2011). Can social networking keep students in school?NPR: Morning edition. <http://www.npr.org/2011/02/09/133598049/can-social-networking-keep-students-in-school> Retrieved 14.01.10.
Astin, A. (1984). Student involvement: A developmental theory for highereducation. Journal of College Student Personnel, 25(4), 297–308.
Aypay, A., Erdogan, M., & Sozer, M. A. (2007). Variation among schools on classroompractices in science based on TIMSS-1999 in Turkey. Journal of Research inScience Teaching, 44(10), 1417–1435.
Bliuc, A. M., Ellis, R., Goodyear, P., & Piggott, L. (2010). Learning through face-to-faceand online discussions: Associations between students’ conceptions,approaches and academic performance in political science. British Journal ofEducational Technology, 41(3), 512–524.
Chickering, A. W., & Gamson, Z. F. (1987). Seven principles for good practice inundergraduate education. AAHE Bulletin, 3–7.
Cooper, J., & Weaver, K. D. (2003). Gender and computers: Understanding the digitaldivide. Mahwah, NJ: Lawrence Erlbaum.
Cotten, S. R. (2008). Students’ technology use and the impacts on well-being. In R.Junco & D. M. Timm (Eds.), Using emerging technologies to enhance studentengagement. New directions for student services, issue #124 (pp. 55–70). SanFrancisco, CA: Jossey-Bass.
DeBerard, M. S., Speilmans, G. I., & Julka, D. L. (2004). Predictors of academicachievement and retention among college freshmen: A longitudinal study.College Student Journal, 38(1), 66–80.
DiGregorio, P., & Sobel-Lojeski, K. (2010). The effects of interactive whiteboards(IWBs) on student performance and learning: A literature review. Journal ofEducational Technology Systems, 38(3), 255–312.
DiMaggio, P., Hargittai, E., Celeste, C., & Shafer, S. (2004). Digital inequality: Fromunequal access to differentiated use. In K. Neckerman (Ed.), Social inequality(pp. 355–400). New York: Russell Sage Foundation.
Ellison, N. B., Steinfield, C., & Lampe, C. (2007). The benefits of Facebook ‘‘friends:’’Social capital and college students’ use of online social network sites. Journal ofComputer-Mediated Communication, 12(4), 1143–1168.
Ellison, N. B., Steinfield, C., & Lampe, C. (2011). Connection strategies: Social capitalimplications of Facebook-enabled communication practices. New Media &Society. doi:10.1177/1461444810385389.
Geiser, S., & Santelices, M. (2007). Validity of high-school grades in predictingstudent success beyond the freshman year: High-school record vs. standardizedtests as indicators of four-year college outcomes. University of California,Berkeley Center for Studies in Higher Education Research & Occasional PaperSeries: CSHE.6.07.
Gordon, C. F., Juang, L. P., & Syed, M. (2007). Internet use and well-being amongcollege students: Beyond frequency of use. Journal of College StudentDevelopment, 48(6), 674–688.
Hargittai, E. (2008a). The digital reproduction of inequality. In D. Grusky (Ed.), Socialstratification (pp. 936–944). Boulder, CO: Westview Press.
Hargittai, E. (2008b). Whose space? Differences among users and non-users ofsocial network sites. Journal of Computer-Mediated Communication, 13(1),276–297.
Heiberger, G., & Harper, R. (2008). Have you Facebooked Astin lately? Usingtechnology to increase student involvement. In R. Junco & D. M. Timm (Eds.),Using emerging technologies to enhance student engagement. New directions forstudent services, issue #124 (pp. 19–35). San Francisco, CA: Jossey-Bass.
Higher Education Research Institute (HERI; 2007) College freshmen and onlinesocial networking sites. <http://www.gseis.ucla.edu/heri/PDFs/pubs/briefs/brief-091107-SocialNetworking.pdf> Retrieved 1.03.11.
Jones, S., & Fox, S. (2009). Generations online in 2009. Data memo. Washington, DC:Pew Internet and American Life Project. <http://www.pewinternet.org/’/media//Files/Reports/2009/PIP_Generations_2009.pdf> Retrieved 7.03.10.
Please cite this article in press as: Junco, R. Too much face and not enough bookperformance. Computers in Human Behavior (2011), doi:10.1016/j.chb.2011.08.
Junco, R. (2009). Teaching teens to Twitter: Supporting engagement in the collegeclassroom. Presented at Harvard University’s Berkman Center for Internetand Society. <http://cyber.law.harvard.edu/events/luncheon/2009/12/junco>Retrieved 15.09.2011.
Junco, R. (2011). The relationship between frequency of Facebook use, participationin Facebook activities, and student engagement. Computers & Education.doi:10.1016/j.compedu.2011.08.004.
Junco, R., & Cotten, S. R. (2010). Perceived academic effects of instant messaging use.Computers & Education, 56, 370–378.
Junco, R., Heiberger, G., & Loken, E. (2011). The effect of Twitter on college studentengagement and grades. Journal of Computer Assisted Learning, 27(2), 119–132.
Junco, R., Merson, D., & Salter, D. W. (2010). The effect of gender, ethnicity, andincome on college students use of communication technologies.Cyberpsychology, Behavior, and Social Networking, 13(6), 37–53.
Kaiser Family Foundation (2004). The digital divide survey snapshot. Menlo Park,CA: Kaiser Family Foundation. <http://www.kff.org/entmedia/loader.cfm?url=/commonspot/security/getfile.cfm&PageID=46366> Retrieved 1.03.11.
Kamenetz, A. (February 9, 2011). Gates Foundation bets on Facebook app to helpkids graduate. Fast Company. <http://www.fastcompany.com/1725665/gates-foundation-bets-on-facebook-app-to-help-kids-graduate> Retrieved 14.02.11.
Kirschner, P. A., & Karpinski, A. C. (2010). Facebook and academic performance.Computers in Human Behavior, 26, 1237–1245.
Kolek, E. A., & Saunders, D. (2008). Online disclosure: An empirical examination ofundergraduate Facebook profiles. NASPA Journal, 45(1), 1–25.
Kuh, G. D. (2009). What student affairs professionals need to know about studentengagement. Journal of College Student Development, 50(6), 683–706.
Lenhart, A. (2009). Adults and social network websites. Washington, DC: PewInternet and American Life Project. <http://www.pewinternet.org/Reports/2009/Adults-and-Social-Network-Websites.aspx> Retrieved 1.03.011.
Lenhart, A., Purcell, K., Smith, A., & Zickuhr, K. (2010). Social media and youngadults. Washington, DC: Pew Internet and American Life Project. <http://pewinternet.org/Reports/2010/Social-Media-and-Young-Adults.aspx>Retrieved 12.02.11.
Morgan, C., & Cotten, S. R. (2003). The relationship between internet activities anddepressive symptoms in a sample of college freshmen. Cyberpsychology &Behavior, 6(2), 133–142.
Morrin, D. (August 29, 2007). A shift to engagement. Facebook Developer’s Blog.<https://developers.facebook.com/blog/post/30> Retrieved 17.04.11.
Pascarella, E. T., & Terenzini, P. T. (2005). How college affects students: A third decadeof research. San Francisco, CA: Jossey-Bass.
Pasek, J., More, E., & Hargittai, E. (2009). Facebook and academic performance:Reconciling a media sensation with data. First Monday, 14(5).
Pempek, T., Yermolayeva, Y., & Calvert, S. L. (2009). College students socialnetworking experiences on Facebook. Journal of Applied DevelopmentalPsychology, 30(3), 227–238.
Pychl, T. A. (2008). Facebook—A whole new world of wasting time. PsychologyToday, April 3, 2008. <http://www.psychologytoday.com/blog/dont-delay/200804/facebook-whole-new-world-wasting-time> Retrieved 16.04.10.
Rizzuto, T. E., LeDoux, J., & Hatala, J. P. (2009). It’s not just what you know, it’s whoyou know: Testing a model of the relative importance of social networks toacademic performance. Social Psychology of Education, 12(2), 175–189.
Sapp, D., & Simon, J. (2005). Comparing grades in online and face-to-face writingcourses: Interpersonal accountability and institutional commitment. Computersand Composition, 22(4), 471–489.
Shapley, K. S., Sheehan, D., Maloney, C., & Caranikas-Walker, F. (2010). Evaluatingthe implementation fidelity of technology immersion and its relationship withstudent achievement. Journal of Technology, Learning, and Assessment, 9(4).<http://ejournals.bc.edu/ojs/index.php/jtla/article/view/1609/>. Retrieved19.08.11.
Smith, S. D., & Caruso, J. B. (2010). ECAR study of undergraduate students andinformation technology. (Research Study, Vol. 6). Boulder, CO: EDUCAUSECenter for Applied Research. <http://www.educause.edu/Resources/ECARStudyofUndergraduateStuden/217333> Retrieved 1.03.11.
Suhr, K. A., Hernandez, D. A., Grimes, D., & Warschauer, M. (2010). Laptops andfourth-grade literacy: Assisting the jump over the fourth-grade slump. Journalof Technology, Learning, and Assessment, 9(5), 1–2. <http://ejournals.bc.edu/ojs/index.php/jtla/article/view/1610/>. Retrieved 19.08.11.
Tienken, C. H., & Wilson, M. J. (2007). The impact of computer assisted instructionon seventh-grade students’ mathematics achievement. Planning and Changing,38(3 and 4), 181–190.
Valenzuela, S., Park, N., & Kee, K. F. (2009). Is there social capital in a social networksite? Facebook use and college students life satisfaction, trust, and participation.Journal of Computer-Mediated Communication, 14(4), 875–901.
Waight, N., & Abd-El-Khalick, F. (2007). The impact of technology on the enactmentof ‘inquiry’ in a technology enthusiast’s sixth grade science classroom. Journal ofResearch in Science Teaching, 44(1), 154–182.
Weatherly, J. N., Grabe, M., & Arthur, E. L. (2003). Providing introductory psychologystudents access to lecture slides via Blackboard 5: A negative impact onperformance. Journal of Educational Technology Systems, 31(4), 463–474.
Williford, A. M. (2009). Secondary school course grades and success in college.College & University, 85(1), 22–33.
s: The relationship between multiple indices of Facebook use and academic026