today’s decisions, tomorrow’s rewards - pwc south africa · today’s decisions, tomorrow’s...
TRANSCRIPT

www.pwc.co.za/industries/retirement-funds
Retirement fund strategic matters and remuneration survey
Third edition
May 2012
Today’s decisions, tomorrow’s rewards

The information contained in this publication is provided for general information purposes only, and does not constitute the provision of legal or professional advice in any way. Before making any decision or taking any action, a professional adviser should be consulted. No responsibility for loss to any person acting or refraining from action as a result of any material in this publication can be accepted by the author, copyright owner or publisher.

Contents
PwC
Retirement fund strategic matters and remuneration survey
Foreword 1
Salient features of the survey 4
Key findings 6
About the survey 8The questions 9Respondents 9Survey population 9Fund statistics 9Fund nature and size 10Fund type 13
Trustee remuneration 15Overview of transactions, balances and membership trustee boards look after 16To remunerate or not to remunerate? 17Who sets remuneration? 21What do respondents believe drives trustee remuneration? 23The way in which fund officials are remunerated 23Level of remuneration 24Other compensation 26Time spent by trustees on funds affairs 26Performance and assessment 27
Trustee education 29Why trustee education is important 30Trustee experience 30Assessment of the training needs of the board of trustees 31Learning and education policies 31Training methods used 32Areas in which trustees have received training 32Level of education of trustees 34Average number of hours per year spent by fund trustees on training and attending industry events 34Other views regarding trustee education 35Training challenges identified 36
PwC
Principal officers 37Experience and qualification of principal officers 38Regulation and employment status 40Remuneration 42Time spent and assessment 44Training 45
Regulatory aspects and risk management 48Protection of members 49Means of keeping up with regulatory changes 51Cost of regulatory changes for members of the fund 52Scope for simplification and/ or cost reduction in operation of the fund 53Application of King III to pension funds 54Annual review of risks faced by the fund 55Top investment risks for the fund 57Other risks for the fund 58Management and monitoring of risk management strategies 59
Appendices 61Appendix 1: Remuneration of chairpersons and trustees 62Appendix 2: Remuneration of principal officers 65Appendix 3: Stratification of the population 66Appendix 4: Summary findings of the PwC’s 2012 UK Pension Scheme Governance Survey 68
PwC’s retirement fund-specific services 70
Contacts 72


Foreword
1PwC
2 Retirement fund strategic matters and remuneration survey
We are pleased to present the findings of our latest South African retirement fund survey. This follows and builds on our groundbreaking survey on trustee remuneration in 2010 and our survey on the effective management of retirement funds in 2007.
In a recent global pension assets study by Towers Watson, total global assets of pension funds were reported as USD27 509 billion in 2011. South Africa’s contribution to this total was reported as USD1 046 billion. The sheer scale of pension fund investments, coupled with the attendant economic, political and administrative risks, places an enormous responsibility on boards of trustees to govern these arrangements wisely. Clearly, trustees need to equip themselves with the required skills and knowledge to enable them to discharge their obligations towards fund members in the best possible manner.
Since 2010, there have been some significant regulatory changes. Perhaps the most far-reaching has been the introduction of the long-awaited revised Regulation 28. This imposes a much higher standard of governance on trustees in relation to investments, which now need to be monitored on a ‘look-through’ basis, and compliance is required not only at fund level but also at member level. For the first time, trustees are expressly obliged to take into account the members needs in deciding how to invest the assets to meet those needs.
Many funds have moved to increase their exposures to overseas investments in line with increased limits. The global financial system and the investment markets remain nervous and volatile, as does the rand. Thus, trustees face a rapidly evolving and challenging landscape on the investment front.
Over the last 12 years, South African inflation and interest rates moved from higher levels to much lower levels. Defined contribution retirement fund members’ net replacement ratios have sagged accordingly. This is because the cost of annuities that insure against longevity increased sharply in line with the drop in yields in long government bonds from around 14% in 2000 to around 8% now. This unheralded funding gap has only recently started to receive attention.
The factors mentioned above prompted us to include some new questions in this survey on trustee education, on aspects of regulation and risk management and on the opportunities for streamlining and simplification of operations with a view to achieving cost reductions that can be passed on to fund members.
This survey covers four focus areas:
• Trustee remuneration;
• Trustee education (new);
• Principal officers and their remuneration, and
• Aspects of regulation and risk management (new).
The sheer scale of pension fund investments places an enormous responsibility on trustee boards.
3PwC
The survey was conducted by PwC’s retirement fund industry specialist group. Our aim was to identify trends in the roles and remuneration of trustees and principal officers and shed light on the stance retirement funds currently take on trustee education and on aspects of governance and risk management. Where relevant, we have compared the results of this survey with those of previous surveys. A high-level summary of findings from the 2012 PwC UK Survey on Pension Scheme Governance is also included.
With 228 respondents representing a total asset base of R708 billion and a wide spread of funds from large to small, and across all fund types, we believe that this survey is representative of existing practices. It offers a benchmark against which trustees can compare various aspects of their fund’s workings and strategies with those of their peers.
We wish to thank all the participants for their time and responses. Individual responses will remain confidential. Our particular thanks go to the Principal Officers Association of South Africa for their support in encouraging participation in the survey. As ever, we would welcome feedback on the survey and suggestions as to additional topics to cover in future.
Gert Kapp National Retirement Fund Leader PwC South Africa
11 May 2012

Salient features of the survey
4 Trustee Remuneration and Governance Survey

5PwC
Funds that participated
2012 2010
Private funds (which we define as standalone non-specialist funds)
153 143
Specialist funds (preservation funds, retirement annuity funds and umbrella funds)
75 100
Total funds 228 243
Asset base of respondents
2012 2010
Private funds R338 billion R166 billion
Specialist funds R370 billion R141 billion
Total funds R708 billion R307 billion
Trustee representation among respondents
Total trustees
Professional trustees
Proportion of professional
trustees to total trustees
Average number of trustees per
board
Private funds 1 266 29 2.3% 8
Specialist funds 505 172 34.0% 7
Proportion of funds that remunerated some or all trustees
2012 2010
Private funds 23% 23%
Specialist funds 91% 78%
Proportion of funds that used professional principal officers
2012 2010
Private funds 48% 34%
Specialist funds 79% 72%
Median range of annual remuneration for fund officials
Chairpersons R50 000 – R100 000
Professional trustees R10 000 – R 50 000
Other remunerated trustees R10 000 – R50 000
Principal officers R250 000 – R400 000

Key findings
6 Trustee Remuneration and Governance Survey
7PwC
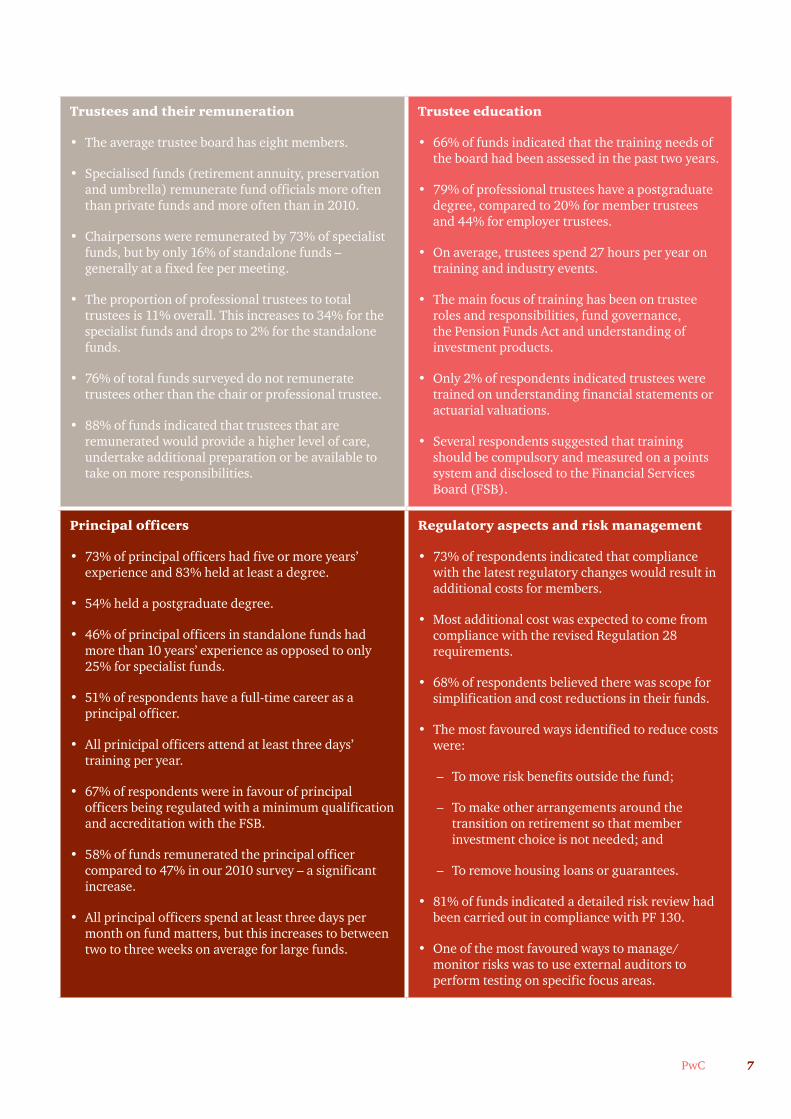
Trustees and their remuneration
• The average trustee board has eight members.
• Specialised funds (retirement annuity, preservation and umbrella) remunerate fund officials more often than private funds and more often than in 2010.
• Chairpersons were remunerated by 73% of specialist funds, but by only 16% of standalone funds – generally at a fixed fee per meeting.
• The proportion of professional trustees to total trustees is 11% overall. This increases to 34% for the specialist funds and drops to 2% for the standalone funds.
• 76% of total funds surveyed do not remunerate trustees other than the chair or professional trustee.
• 88% of funds indicated that trustees that are remunerated would provide a higher level of care, undertake additional preparation or be available to take on more responsibilities.
Trustee education
• 66% of funds indicated that the training needs of the board had been assessed in the past two years.
• 79% of professional trustees have a postgraduate degree, compared to 20% for member trustees and 44% for employer trustees.
• On average, trustees spend 27 hours per year on training and industry events.
• The main focus of training has been on trustee roles and responsibilities, fund governance, the Pension Funds Act and understanding of investment products.
• Only 2% of respondents indicated trustees were trained on understanding financial statements or actuarial valuations.
• Several respondents suggested that training should be compulsory and measured on a points system and disclosed to the Financial Services Board (FSB).
Principal officers
• 73% of principal officers had five or more years’ experience and 83% held at least a degree.
• 54% held a postgraduate degree.
• 46% of principal officers in standalone funds had more than 10 years’ experience as opposed to only 25% for specialist funds.
• 51% of respondents have a full-time career as a principal officer.
• All prinicipal officers attend at least three days’ training per year.
• 67% of respondents were in favour of principal officers being regulated with a minimum qualification and accreditation with the FSB.
• 58% of funds remunerated the principal officer compared to 47% in our 2010 survey – a significant increase.
• All principal officers spend at least three days per month on fund matters, but this increases to between two to three weeks on average for large funds.
Regulatory aspects and risk management
• 73% of respondents indicated that compliance with the latest regulatory changes would result in additional costs for members.
• Most additional cost was expected to come from compliance with the revised Regulation 28 requirements.
• 68% of respondents believed there was scope for simplification and cost reductions in their funds.
• The most favoured ways identified to reduce costs were:
– To move risk benefits outside the fund;
– To make other arrangements around the transition on retirement so that member investment choice is not needed; and
– To remove housing loans or guarantees.
• 81% of funds indicated a detailed risk review had been carried out in compliance with PF 130.
• One of the most favoured ways to manage/monitor risks was to use external auditors to perform testing on specific focus areas.

About the survey
8 Trustee Remuneration and Governance Survey
9PwC
The questions
The survey consisted of 58 questions covering the key aspects of remuneration, with special focus on four main areas:
• Trustee remuneration;
• Trustee education;
• Principal officers; and
• Regulation and risk management.
We also collected fund data, including fund type, asset size, the number of pensioners and active members. Where specific characteristics of the fund resulted in distinct differences in responses, we have endeavoured to highlight the major differences.
Respondents
The survey was undertaken across all types of funds in the South African retirement fund industry. In general, the principal officers of the funds completed the responses, but in some cases, the chairperson or another trustee board member did so on behalf of the fund.
In this report, we provide an overview of the survey findings and key themes that emerged. We also provide our own commentary and interpretation of the results.
Given the high number of respondents in this survey and the wide range of fund sizes and types covered, we believe that the trends and conclusions identified are likely to be representative of the industry as a whole.
Survey population
The survey was completed by 228 retirement funds of varying size during January and February 2012, with total assets of R708 billion. Responses were spread across small, medium and large funds (measured by total asset value as reported) as follows:
• Large: 37% >R1 000 million
• Medium: 49% R50million – R1,000 million; and
• Small: 14% <R50 million.
We also distinguished between specialist funds, namely preservation funds, retirement annuity funds and umbrella funds as opposed to standalone private funds. The standalone funds were analysed by type of fund: defined contribution (DC), defined benefit (DB) or hybrid. A hybrid fund is one that features both DC and DB elements.
Fund statistics
Please refer to Appendix 3 for details of the stratification of the fund population and the related statistics. As there are substantial differences between the membership profiles and asset bases of the standalone funds and the various types of specialist funds, we are of the view that it is not particularly meaningful to aggregate these.
228 funds with
total assets
of R708 billion took part in the survey.
10 Retirement fund strategic matters and remuneration survey
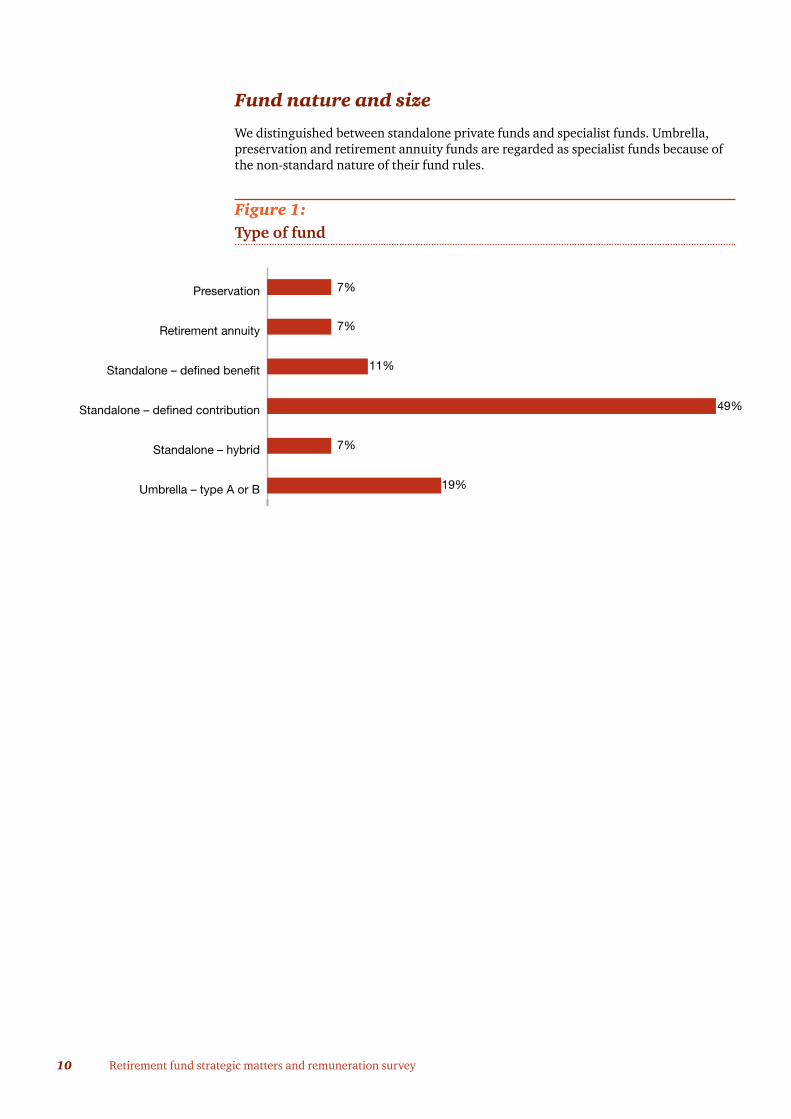
Fund nature and size
We distinguished between standalone private funds and specialist funds. Umbrella, preservation and retirement annuity funds are regarded as specialist funds because of the non-standard nature of their fund rules.
Figure 1:Type of fund
Figure 1: Type of fund
Umbrella – type A or B
Standalone – hybrid
Standalone – defined contribution
Standalone – defined benefit
Retirement annuity
Preservation 7%
7%
11%
49%
7%
19%
11PwC
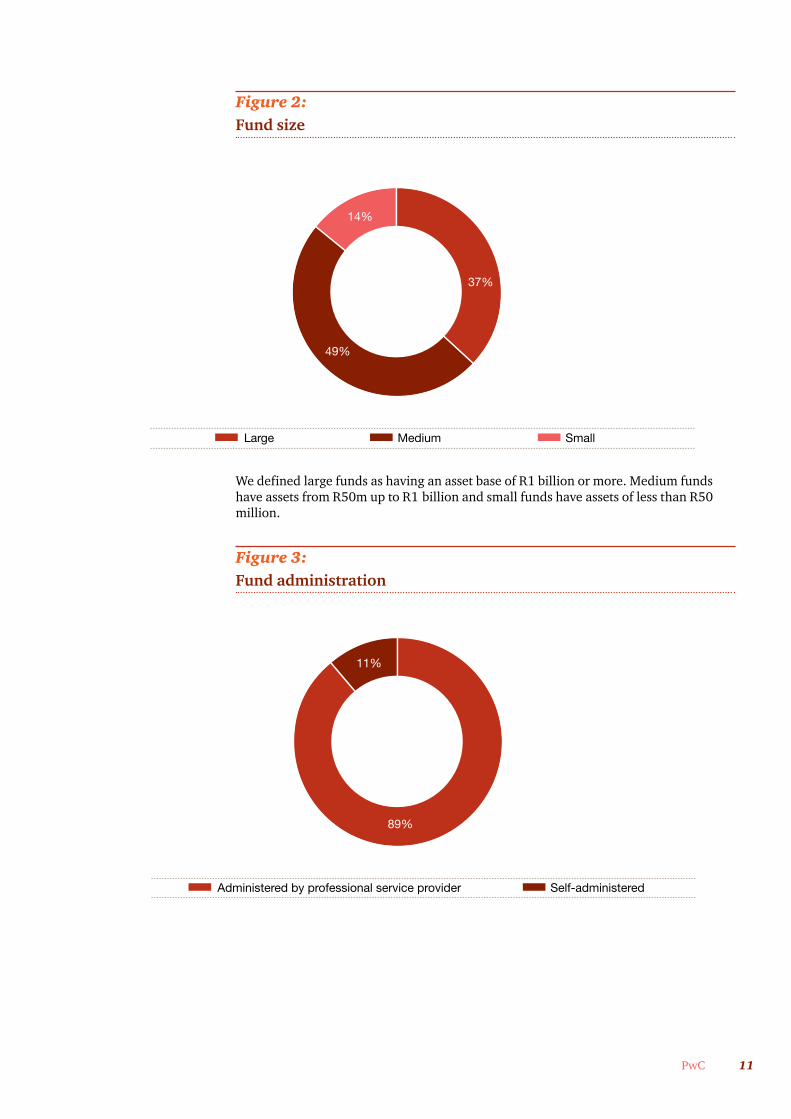
Figure 2:Fund size
We defined large funds as having an asset base of R1 billion or more. Medium funds have assets from R50m up to R1 billion and small funds have assets of less than R50 million.
Figure 3:Fund administration
Figure 2: Fund size
14%
Large Medium
49%
37%
Small
Figure 3: Fund administration
11%
89%
Administered by professional service provider Self-administered
12 Retirement fund strategic matters and remuneration survey
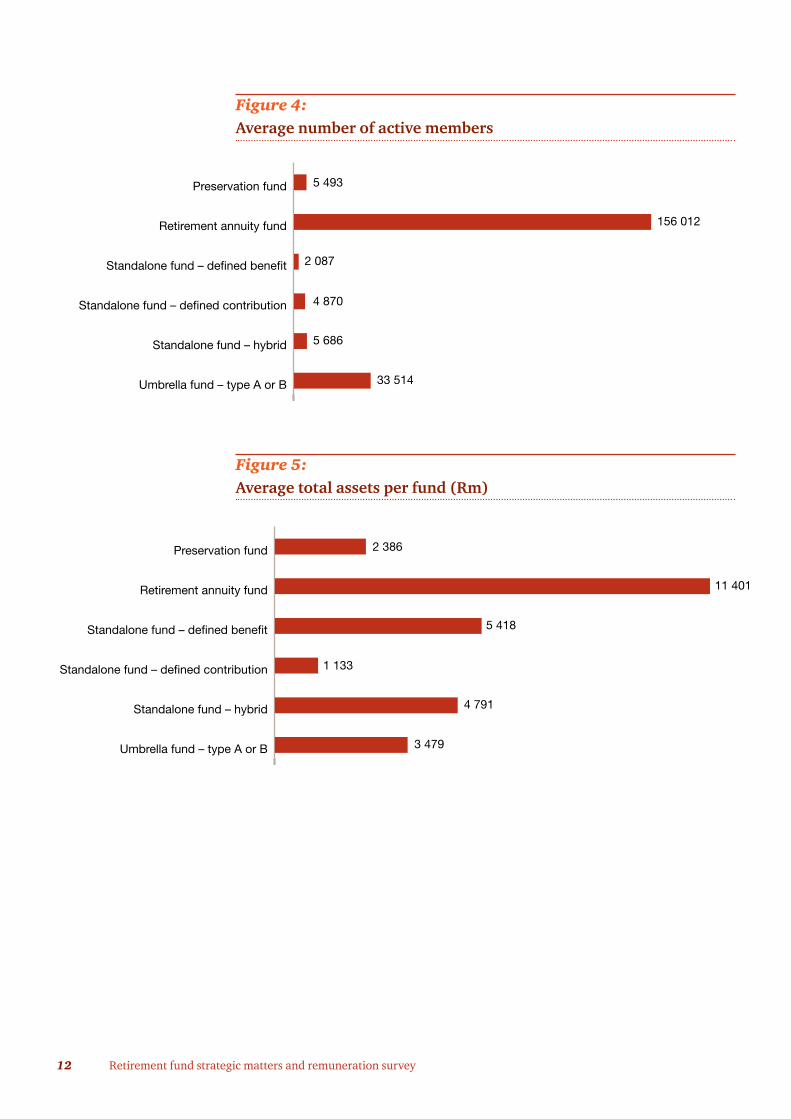
Figure 4: Average number of active members
Figure 5:Average total assets per fund (Rm)
Figure 4: Average number of active members
Umbrella fund – type A or B
Standalone fund – hybrid
Standalone fund – defined contribution
Standalone fund – defined benefit
Retirement annuity fund
Preservation fund 5 493
156 012
2 087
4 870
5 686
33 514
Figure 5: Average total assets per fund (Rm)
Umbrella fund – type A or B
Standalone fund – hybrid
Standalone fund – defined contribution
Standalone fund – defined benefit
Retirement annuity fund
Preservation fund 2 386
11 401
5 418
1 133
4 791
3 479

13PwC
Average fund credit per member per type of fund
Type of fund Average assets per fund
Average members per fund
Average fund credit per member/
pensioner
2012 2010 2012 2010 2012 2010
Rbn Rbn R’000 R’000
Private – standalone
2.211 1.145 5 434 2 480 407 462
Preservation 2.386 1.079 5 493 3 497 434 309
Retirement annuity
11.401 3.200 156 012 53 739 73 60
Umbrella 3.479 1.140 33 514 17 290 104 66
Institutional umbrella and retirement annuity funds have large member numbers, reflecting the marketing efforts of life insurance companies over the years. However, these funds have a relatively low average fund credit per member. Thus, the private sector funds (and preservation funds, which are arguably indirectly linked to them) still house the majority of individuals’ retirement wealth.
Fund type
Defined contribution funds continue to dominate. The 7% drop in the proportion of defined contribution funds from 80% to 73% is partly due to a shift in the population that happened to be included in the survey, but it may also reflect some consolidation of small and medium-sized defined contribution funds into umbrella funds.
Figure 6:Fund type
Figure 6: Fund type
Defined benefit
Defined contribution
Hybrid
16%9%
11%
68%80%
73%
17%11%
16%
20102007 2012
14 Retirement fund strategic matters and remuneration survey
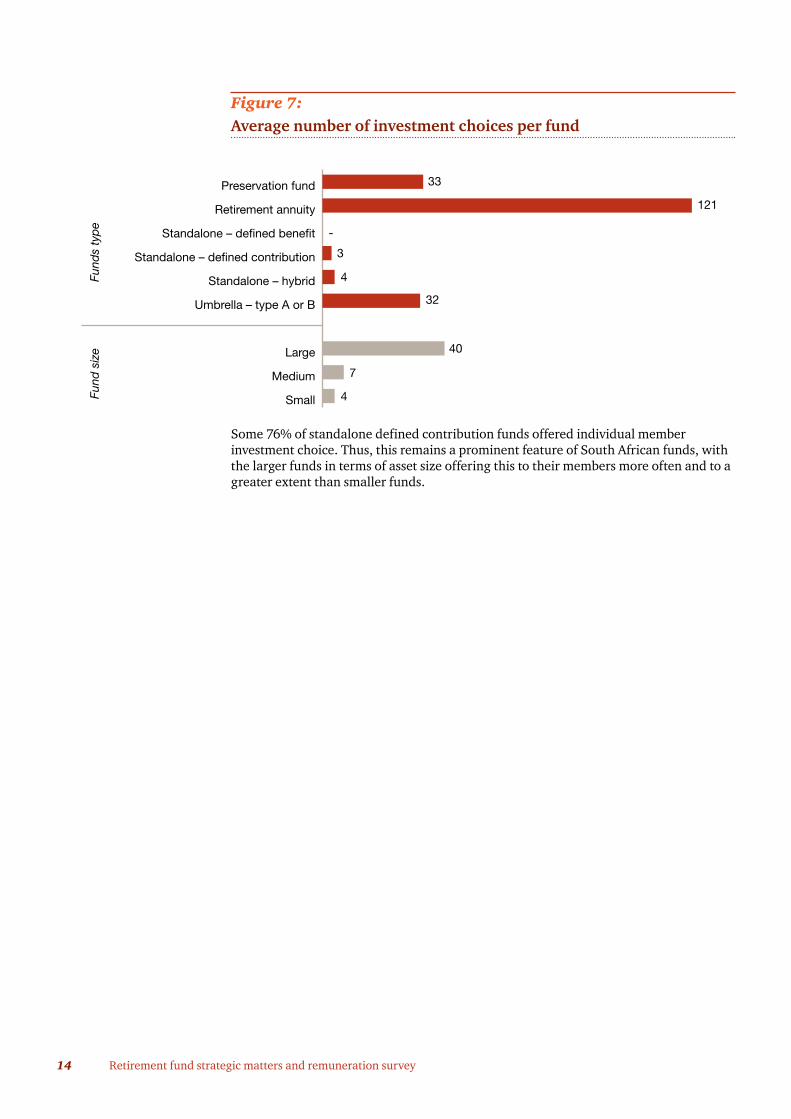
Figure 7:Average number of investment choices per fund
Some 76% of standalone defined contribution funds offered individual member investment choice. Thus, this remains a prominent feature of South African funds, with the larger funds in terms of asset size offering this to their members more often and to a greater extent than smaller funds.
Figure 7: Average number of investment choices per fund
Small
Medium
Large
Umbrella – type A or B
Standalone – hybrid
Standalone – defined contribution
Standalone – defined benefit
Retirement annuity
Preservation fund 33
121
3
4
40
7
4
-
32
Fund
s ty
pe
Fund
siz
e

Trustee remuneration
15PwC
16 Retirement fund strategic matters and remuneration survey
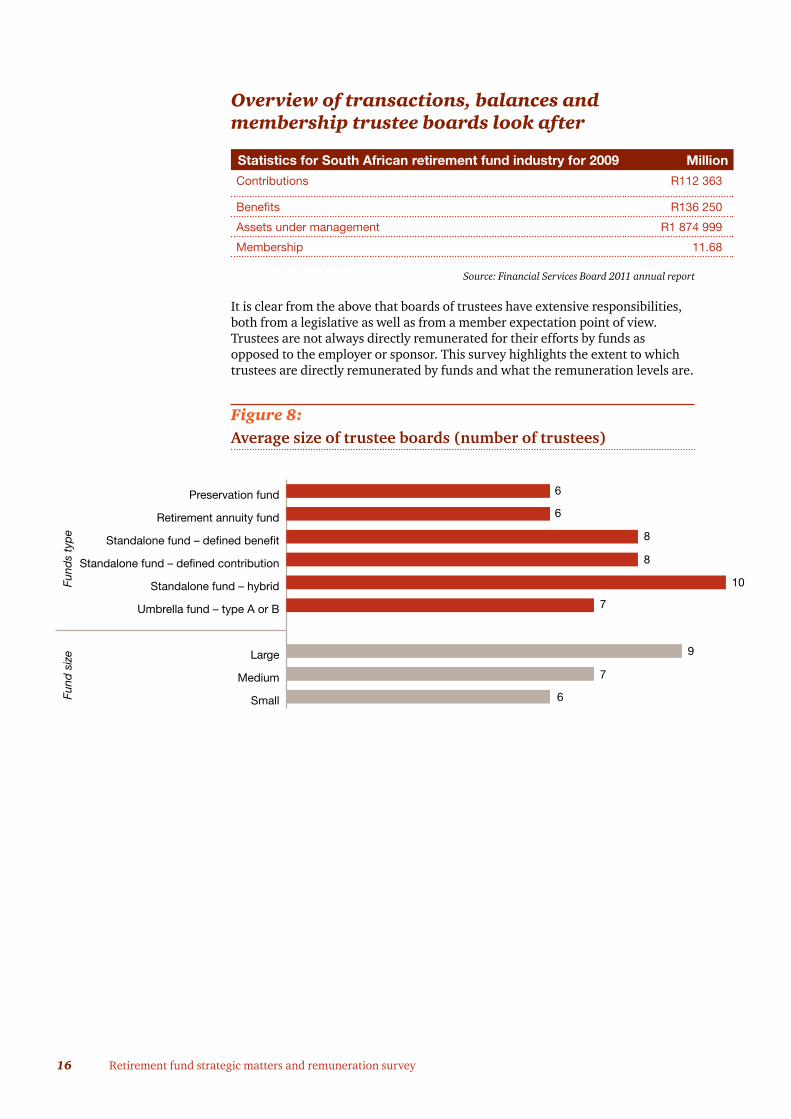
Overview of transactions, balances and membership trustee boards look after
Statistics for South African retirement fund industry for 2009 Million
Contributions R112 363
Benefits R136 250
Assets under management R1 874 999
Membership 11.68
Source: Financial Services Board 2011 annual report
It is clear from the above that boards of trustees have extensive responsibilities, both from a legislative as well as from a member expectation point of view. Trustees are not always directly remunerated for their efforts by funds as opposed to the employer or sponsor. This survey highlights the extent to which trustees are directly remunerated by funds and what the remuneration levels are.
Figure 8:Average size of trustee boards (number of trustees)
Figure 8: Average number of trustee boards (Number of trustees)
Small
Medium
Large
Umbrella fund – type A or B
Standalone fund – hybrid
Standalone fund – defined contribution
Standalone fund – defined benefit
Retirement annuity fund
Preservation fund 6
6
8
10
9
7
6
8
7
Fund
s ty
pe
Fund
siz
e
17PwC
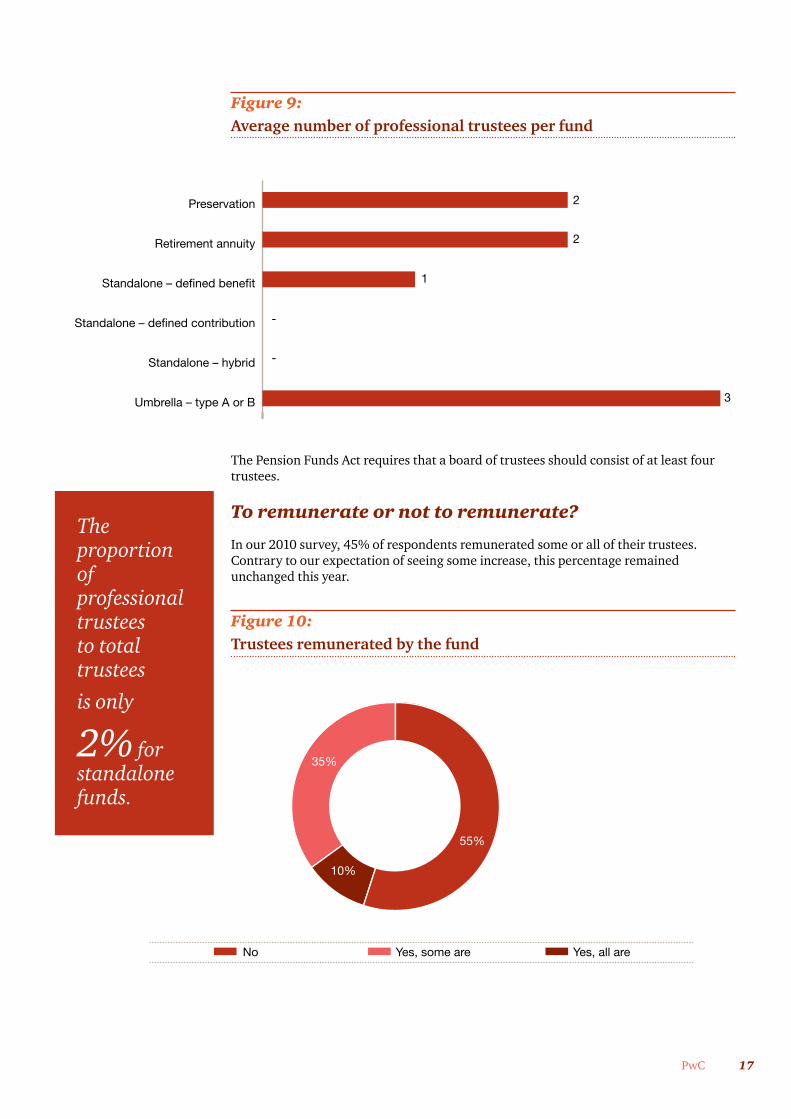
Figure 9:Average number of professional trustees per fund
The Pension Funds Act requires that a board of trustees should consist of at least four trustees.
To remunerate or not to remunerate?
In our 2010 survey, 45% of respondents remunerated some or all of their trustees. Contrary to our expectation of seeing some increase, this percentage remained unchanged this year.
Figure 10:Trustees remunerated by the fund
Figure 10: Average number of professional trustees per fund
Umbrella – type A or B
Standalone – hybrid
Standalone – defined contribution
Standalone – defined benefit
Retirement annuity
Preservation 2
2
1
-
-
3
Figure 9: Are trustees remunerated by the fund?
35%
No Yes, all are
10%
55%
Yes, some are
The proportion of professional trustees to total trustees
is only
2% for standalone funds.
18 Retirement fund strategic matters and remuneration survey
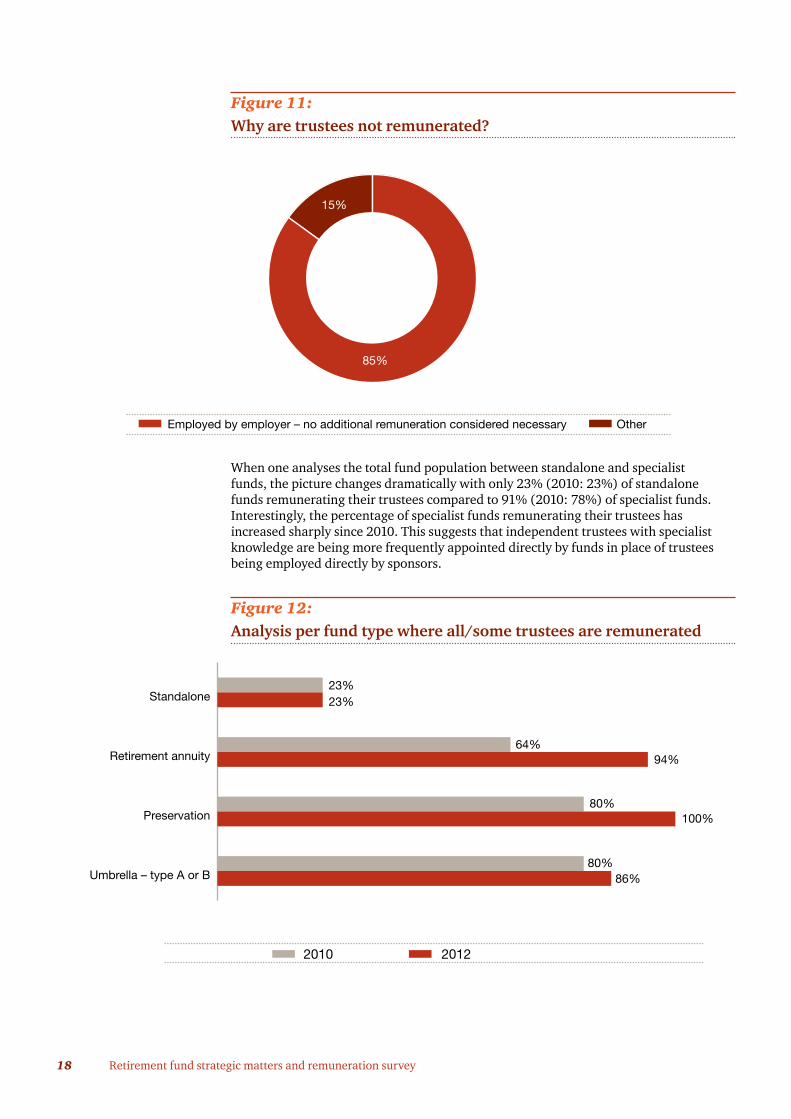
Figure 11:Why are trustees not remunerated?
When one analyses the total fund population between standalone and specialist funds, the picture changes dramatically with only 23% (2010: 23%) of standalone funds remunerating their trustees compared to 91% (2010: 78%) of specialist funds. Interestingly, the percentage of specialist funds remunerating their trustees has increased sharply since 2010. This suggests that independent trustees with specialist knowledge are being more frequently appointed directly by funds in place of trustees being employed directly by sponsors.
Figure 12:Analysis per fund type where all/some trustees are remunerated
Figure 9: Why are trustees not remunerated?
15%
85%
Employed by employer – no additional remuneration considered necessary Other
Figure 11: Analysis per fund type where all/some trustees are remunerated
Umbrella – type A or B
Preservation
Retirement annuity
Standalone23%23%
80%
64%94%
100%
80%86%
2012 2010
19PwC
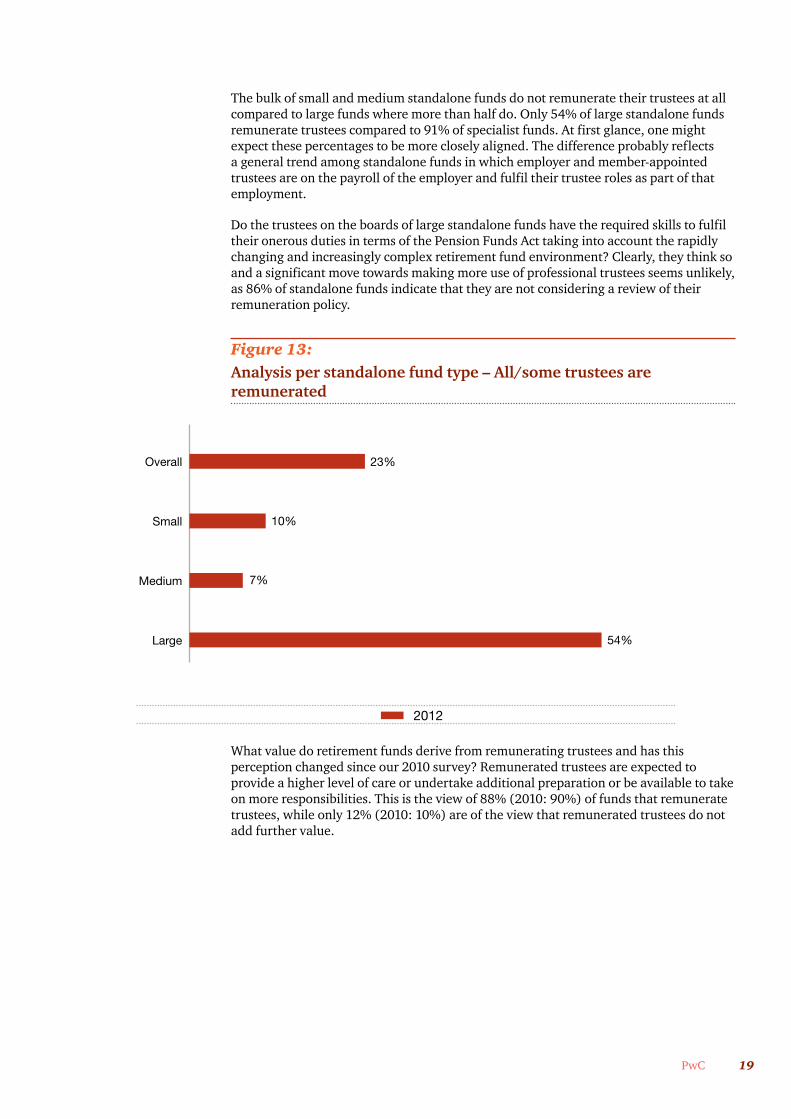
The bulk of small and medium standalone funds do not remunerate their trustees at all compared to large funds where more than half do. Only 54% of large standalone funds remunerate trustees compared to 91% of specialist funds. At first glance, one might expect these percentages to be more closely aligned. The difference probably reflects a general trend among standalone funds in which employer and member-appointed trustees are on the payroll of the employer and fulfil their trustee roles as part of that employment.
Do the trustees on the boards of large standalone funds have the required skills to fulfil their onerous duties in terms of the Pension Funds Act taking into account the rapidly changing and increasingly complex retirement fund environment? Clearly, they think so and a significant move towards making more use of professional trustees seems unlikely, as 86% of standalone funds indicate that they are not considering a review of their remuneration policy.
Figure 13:Analysis per standalone fund type – All/some trustees areremunerated
What value do retirement funds derive from remunerating trustees and has this perception changed since our 2010 survey? Remunerated trustees are expected to provide a higher level of care or undertake additional preparation or be available to take on more responsibilities. This is the view of 88% (2010: 90%) of funds that remunerate trustees, while only 12% (2010: 10%) are of the view that remunerated trustees do not add further value.
Figure 12: Proportion of trustees that are remunerated (standalone funds)
Large
Medium
Small
Overall 23%
10%
7%
54%
2012
20 Retirement fund strategic matters and remuneration survey
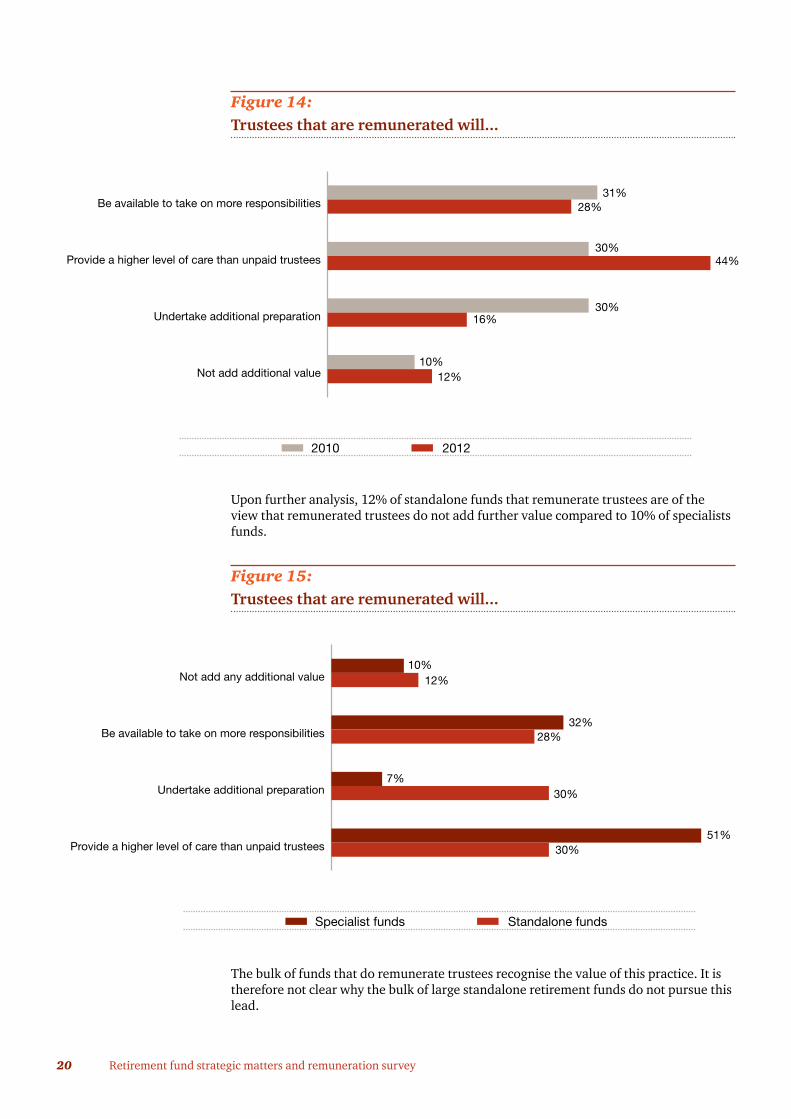
Figure 14:Trustees that are remunerated will...
Upon further analysis, 12% of standalone funds that remunerate trustees are of the view that remunerated trustees do not add further value compared to 10% of specialists funds.
Figure 15:Trustees that are remunerated will...
The bulk of funds that do remunerate trustees recognise the value of this practice. It is therefore not clear why the bulk of large standalone retirement funds do not pursue this lead.
Figure 13: Trustees that are remunerated will
Not add additional value
Undertake additional preparation
Provide a higher level of care than unpaid trustees
Be available to take on more responsibilities31%
28%
30%
30%44%
16%
10%12%
2012 2010
Figure 14: Trustees that are remunerated will
Provide a higher level of care than unpaid trustees
Undertake additional preparation
Be available to take on more responsibilities
Not add any additional value10%
12%
7%
32%28%
30%
51%30%
Standalone funds Specialist funds
21PwC
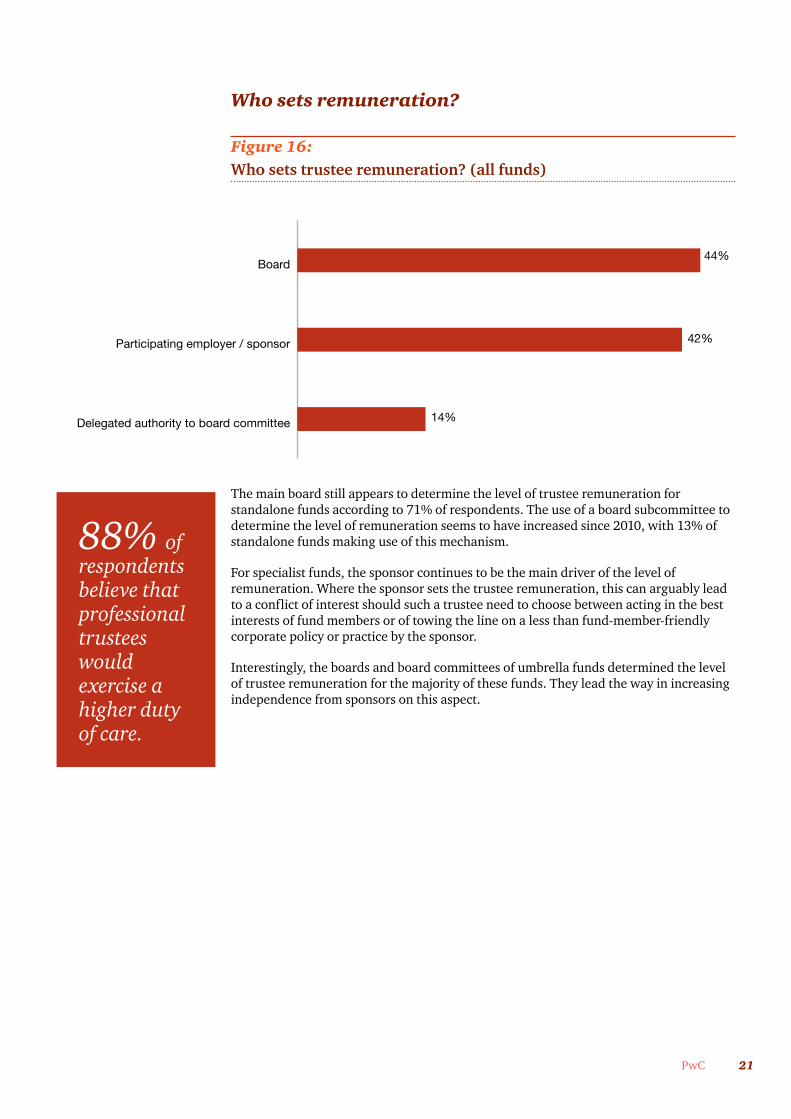
Who sets remuneration?
Figure 16:Who sets trustee remuneration? (all funds)
The main board still appears to determine the level of trustee remuneration for standalone funds according to 71% of respondents. The use of a board subcommittee to determine the level of remuneration seems to have increased since 2010, with 13% of standalone funds making use of this mechanism.
For specialist funds, the sponsor continues to be the main driver of the level of remuneration. Where the sponsor sets the trustee remuneration, this can arguably lead to a conflict of interest should such a trustee need to choose between acting in the best interests of fund members or of towing the line on a less than fund-member-friendly corporate policy or practice by the sponsor.
Interestingly, the boards and board committees of umbrella funds determined the level of trustee remuneration for the majority of these funds. They lead the way in increasing independence from sponsors on this aspect.
Figure 15: Who sets trustee remuneration? (all funds)
Delegated authority to board committee
Participating employer / sponsor
Board44%
42%
14%
88% of respondents believe that professional trustees would exercise a higher duty of care.

22 Retirement fund strategic matters and remuneration survey
Figure 17:Who sets trustee remuneration? (specialist funds)
We see a significant improvement in how often the level of remuneration is reviewed, with 83% of funds saying that they review their level of remuneration annually. In our 2010 survey, 30% of funds had never reviewed the level of their trustee remuneration, compared to only 5% of funds currently.
Figure 18:How often is the level of remuneration reviewed/benchmarked?
Figure 16: Who sets trustee remuneration? (specialist funds)
Preservation funds
Retirement annuity funds
Umbrella funds
48%33%
19%
71%23%
6%
56%30%
14%
Board Authority delegated to board committeeSponsor
Figure 17: How often is the level of remuneration reviewed / benchmarked?
Biannually
This has never been done before
Ad hoc
Annually83%83%
3%
11%9%
8%
3%0%
Standalone funds Specialist funds
23PwC
What do respondents believe drives trustee remuneration?
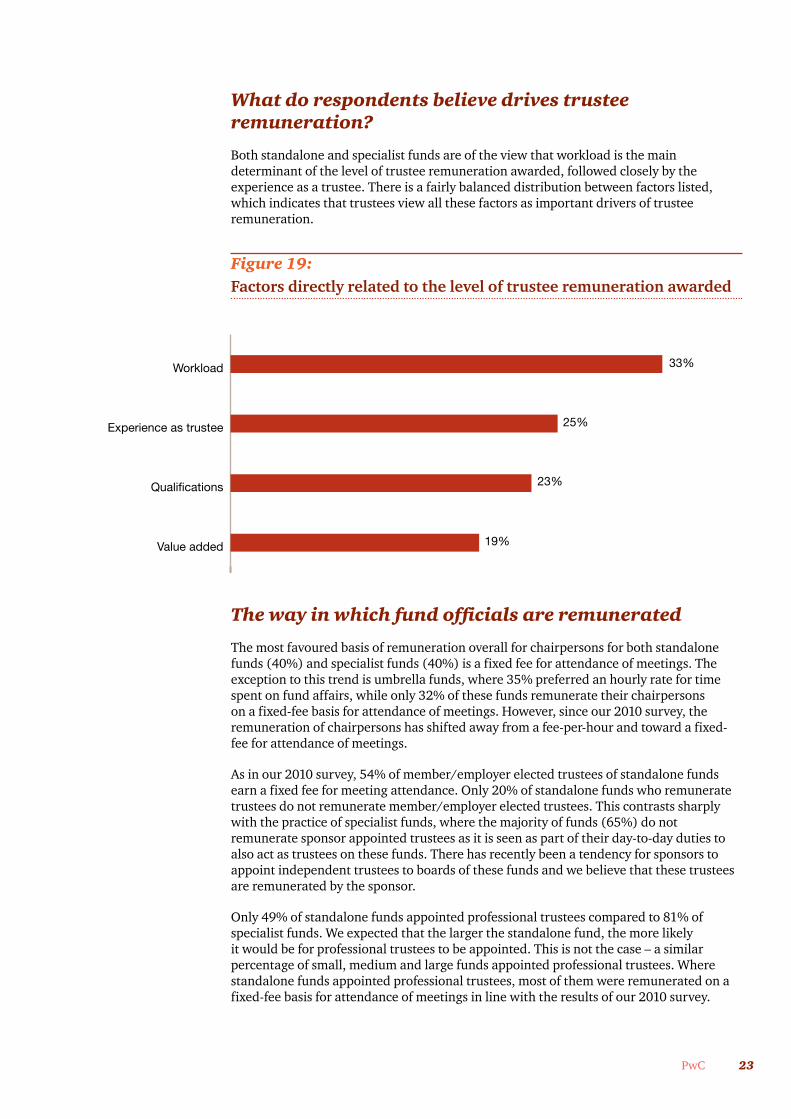
Both standalone and specialist funds are of the view that workload is the main determinant of the level of trustee remuneration awarded, followed closely by the experience as a trustee. There is a fairly balanced distribution between factors listed, which indicates that trustees view all these factors as important drivers of trustee remuneration.
Figure 19:Factors directly related to the level of trustee remuneration awarded
The way in which fund officials are remunerated
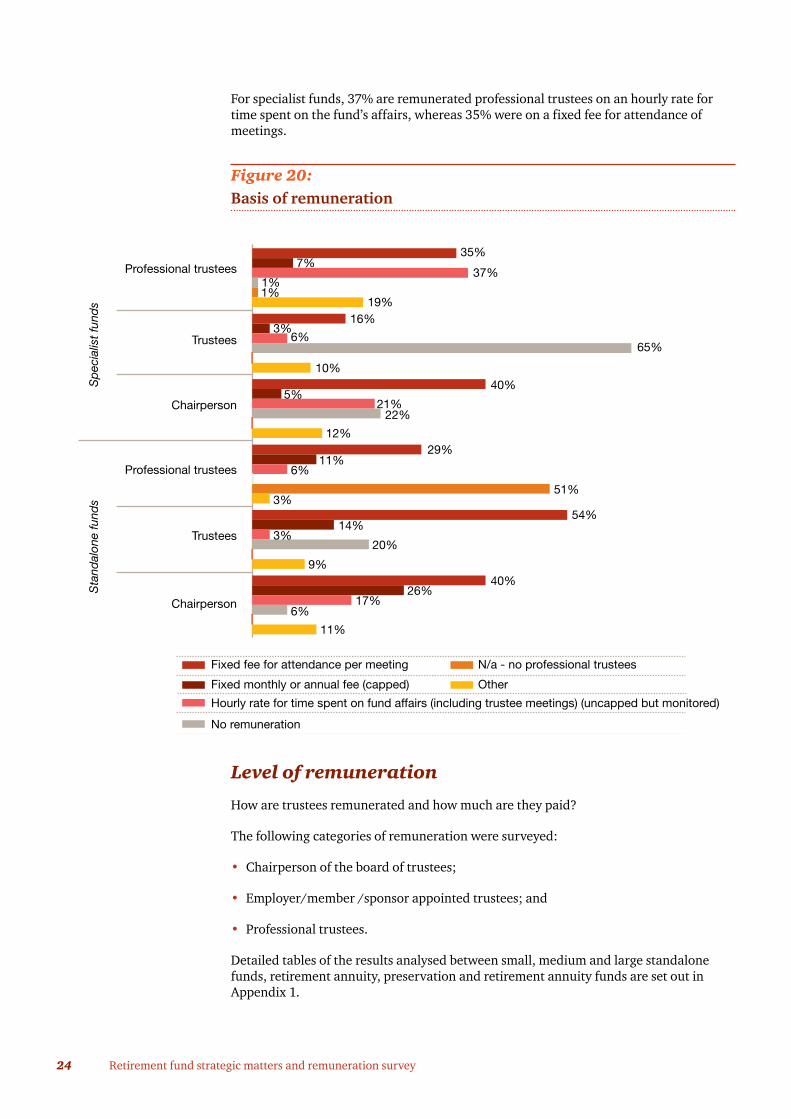
The most favoured basis of remuneration overall for chairpersons for both standalone funds (40%) and specialist funds (40%) is a fixed fee for attendance of meetings. The exception to this trend is umbrella funds, where 35% preferred an hourly rate for time spent on fund affairs, while only 32% of these funds remunerate their chairpersons on a fixed-fee basis for attendance of meetings. However, since our 2010 survey, the remuneration of chairpersons has shifted away from a fee-per-hour and toward a fixed-fee for attendance of meetings.
As in our 2010 survey, 54% of member/employer elected trustees of standalone funds earn a fixed fee for meeting attendance. Only 20% of standalone funds who remunerate trustees do not remunerate member/employer elected trustees. This contrasts sharply with the practice of specialist funds, where the majority of funds (65%) do not remunerate sponsor appointed trustees as it is seen as part of their day-to-day duties to also act as trustees on these funds. There has recently been a tendency for sponsors to appoint independent trustees to boards of these funds and we believe that these trustees are remunerated by the sponsor.
Only 49% of standalone funds appointed professional trustees compared to 81% of specialist funds. We expected that the larger the standalone fund, the more likely it would be for professional trustees to be appointed. This is not the case – a similar percentage of small, medium and large funds appointed professional trustees. Where standalone funds appointed professional trustees, most of them were remunerated on a fixed-fee basis for attendance of meetings in line with the results of our 2010 survey.
Figure 18: Factors directly related to the level of trustee remuneration awarded
Value added
Qualifications
Experience as trustee
Workload 33%
25%
23%
19%
24 Retirement fund strategic matters and remuneration survey
For specialist funds, 37% are remunerated professional trustees on an hourly rate for time spent on the fund’s affairs, whereas 35% were on a fixed fee for attendance of meetings.
Figure 20:Basis of remuneration
Level of remuneration
How are trustees remunerated and how much are they paid?
The following categories of remuneration were surveyed:
• Chairperson of the board of trustees;
• Employer/member /sponsor appointed trustees; and
• Professional trustees.
Detailed tables of the results analysed between small, medium and large standalone funds, retirement annuity, preservation and retirement annuity funds are set out in Appendix 1.
Figure 19: Basis of remuneration
35%Professional trustees
Trustees
Chairperson
Professional trustees
Trustees
Chairperson
Fixed fee for attendance per meeting N/a - no professional trustees
Fixed monthly or annual fee (capped)
Hourly rate for time spent on fund affairs (including trustee meetings) (uncapped but monitored)
Other
7%37%
1%1%
19%16%
3%6%
65%
10%40%
No remuneration
5%21%
22%
12%29%
11%6%
51%3%
54%14%
3%20%
9%40%
26%17%
6%
11%
Sta
ndal
one
fund
sS
pec
ialis
t fu
nds
25PwC
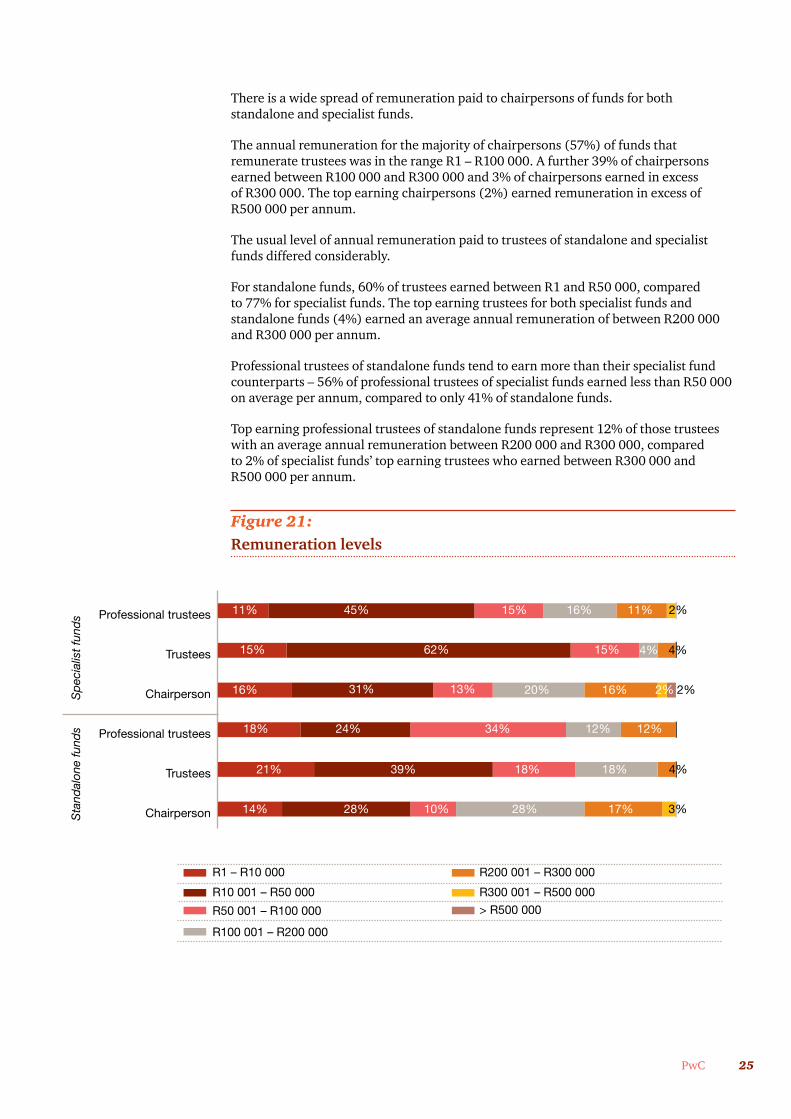
There is a wide spread of remuneration paid to chairpersons of funds for both standalone and specialist funds.
The annual remuneration for the majority of chairpersons (57%) of funds that remunerate trustees was in the range R1 – R100 000. A further 39% of chairpersons earned between R100 000 and R300 000 and 3% of chairpersons earned in excess of R300 000. The top earning chairpersons (2%) earned remuneration in excess of R500 000 per annum.
The usual level of annual remuneration paid to trustees of standalone and specialist funds differed considerably.
For standalone funds, 60% of trustees earned between R1 and R50 000, compared to 77% for specialist funds. The top earning trustees for both specialist funds and standalone funds (4%) earned an average annual remuneration of between R200 000 and R300 000 per annum.
Professional trustees of standalone funds tend to earn more than their specialist fund counterparts – 56% of professional trustees of specialist funds earned less than R50 000 on average per annum, compared to only 41% of standalone funds.
Top earning professional trustees of standalone funds represent 12% of those trustees with an average annual remuneration between R200 000 and R300 000, compared to 2% of specialist funds’ top earning trustees who earned between R300 000 and R500 000 per annum.
Figure 21:Remuneration levels
Chairperson
Trustees
Professional trustees
Chairperson
Trustees
Professional trustees 11% 15% 16% 11% 2%
15% 62% 4% 4%
16% 31% 13% 20% 16%
18% 12%24% 34% 12%
21% 39% 18% 18% 4%
14% 28% 10% 28% 3%
< R100 000 R400 001 – R800 000
R100 001 – R250 000
R250 001 – R400 000
> R800 000
R1 – R10 000 R200 001 – R300 000
R10 001 – R50 000
R50 001 – R100 000
R300 001 – R500 000
R100 001 – R200 000
> R500 000
45%
15%
2%
17%
Figure 20: Remuneration levels
Sta
ndal
one
fund
sS
pec
ialis
t fu
nds
2%
26 Retirement fund strategic matters and remuneration survey
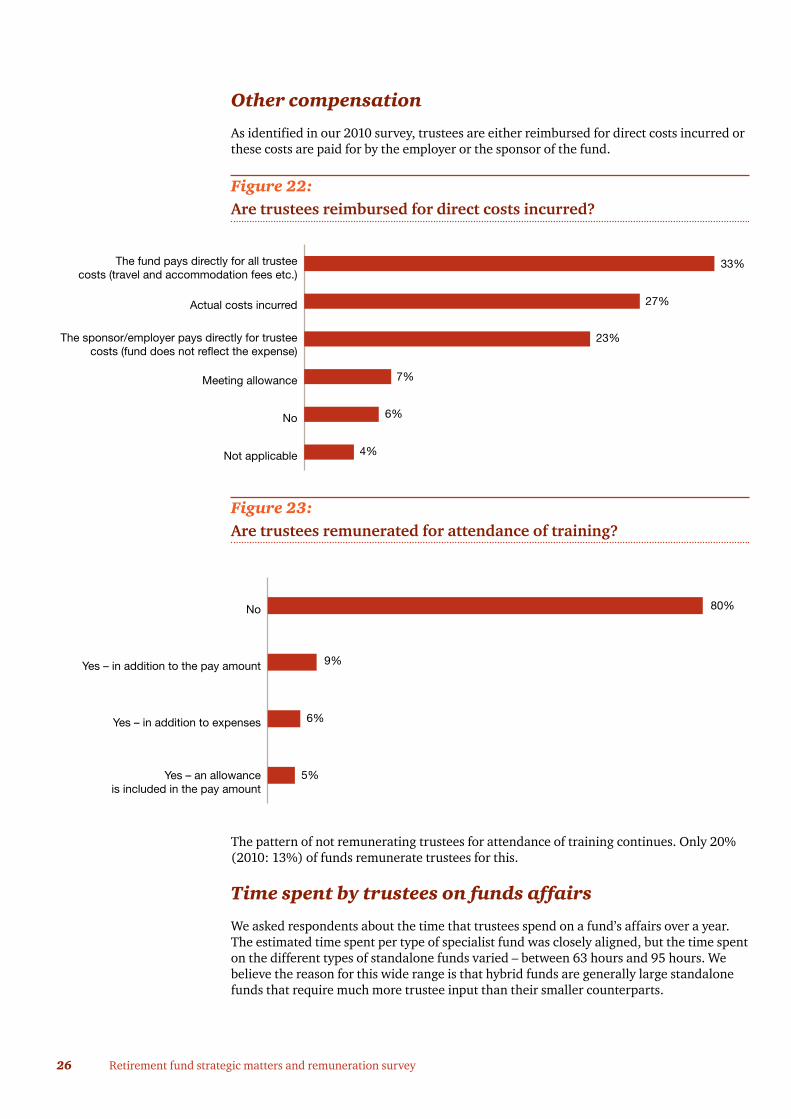
Other compensation
As identified in our 2010 survey, trustees are either reimbursed for direct costs incurred or these costs are paid for by the employer or the sponsor of the fund.
Figure 22:Are trustees reimbursed for direct costs incurred?
Figure 23:Are trustees remunerated for attendance of training?
The pattern of not remunerating trustees for attendance of training continues. Only 20% (2010: 13%) of funds remunerate trustees for this.
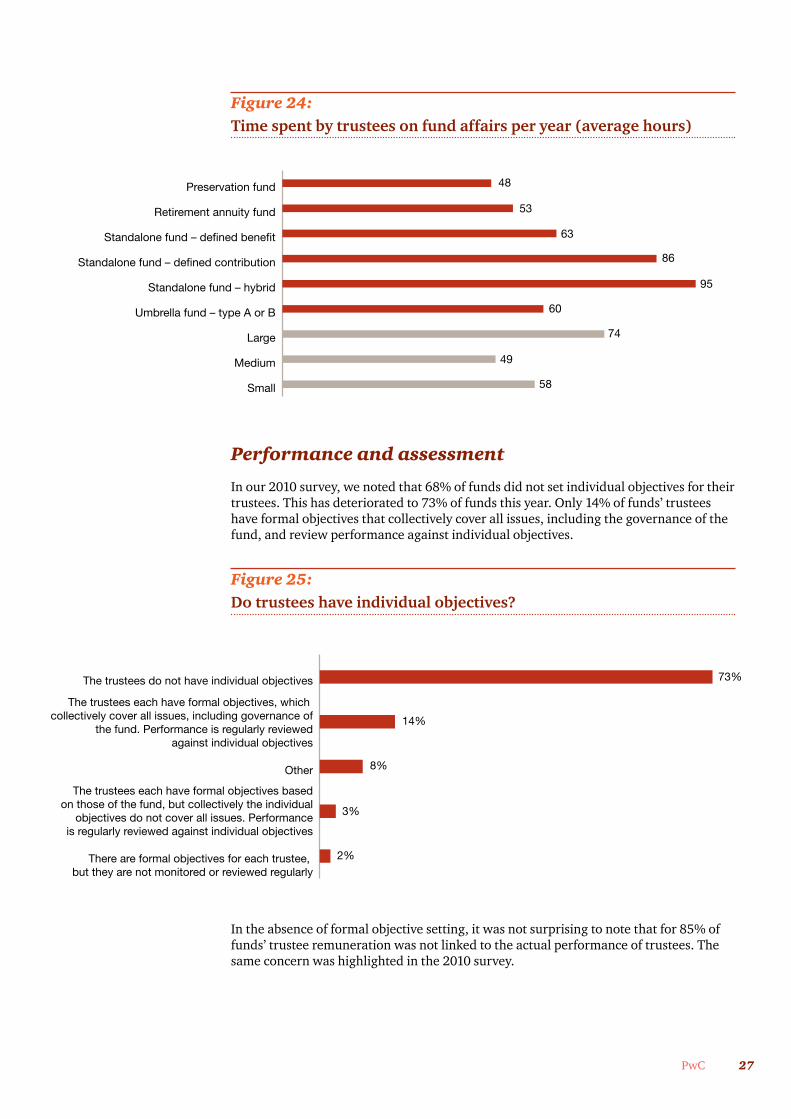
Time spent by trustees on funds affairs
We asked respondents about the time that trustees spend on a fund’s affairs over a year. The estimated time spent per type of specialist fund was closely aligned, but the time spent on the different types of standalone funds varied – between 63 hours and 95 hours. We believe the reason for this wide range is that hybrid funds are generally large standalone funds that require much more trustee input than their smaller counterparts.
Figure 21: Are trustees reimbursed for direct costs incurred?
Not applicable
No
Meeting allowance
The sponsor/employer pays directly for trusteecosts (fund does not reflect the expense)
Actual costs incurred
The fund pays directly for all trusteecosts (travel and accommodation fees etc.)
33%
27%
23%
7%
6%
4%
Figure 22: Are trustees remunerated for attendance of training?
Yes – an allowanceis included in the pay amount
Yes – in addition to expenses
Yes – in addition to the pay amount
No 80%
9%
6%
5%
27PwC
Figure 24:Time spent by trustees on fund affairs per year (average hours)
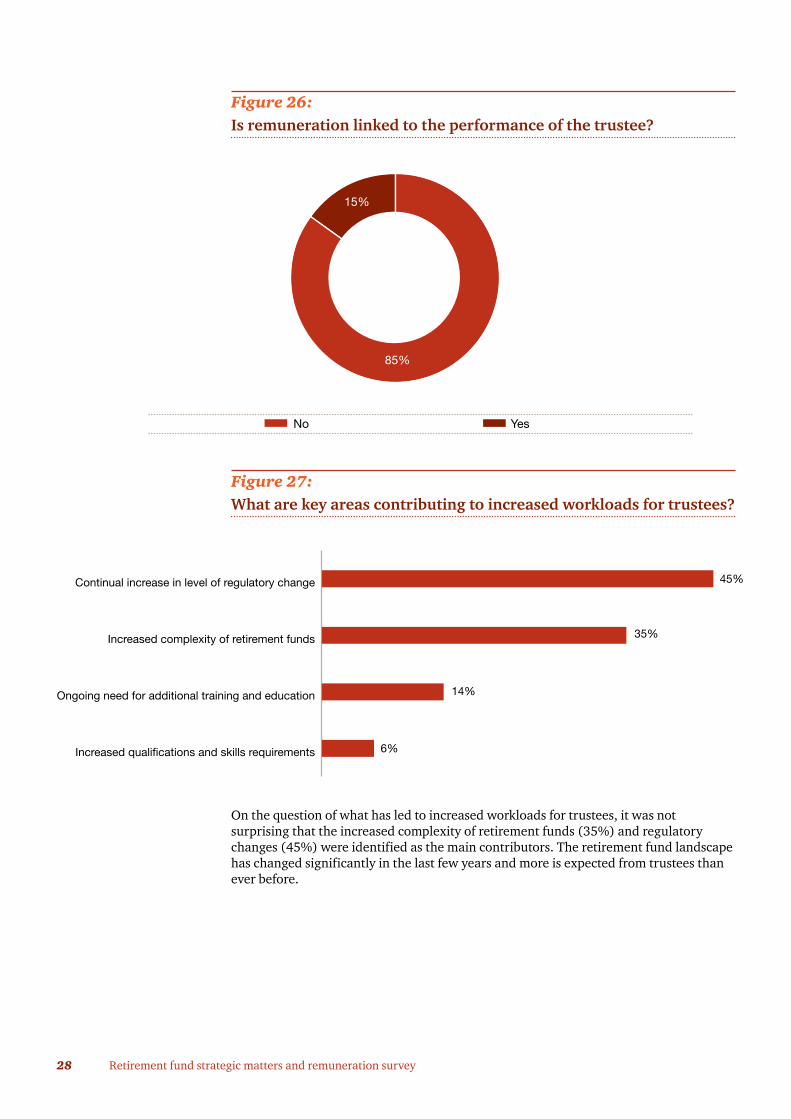
Performance and assessment
In our 2010 survey, we noted that 68% of funds did not set individual objectives for their trustees. This has deteriorated to 73% of funds this year. Only 14% of funds’ trustees have formal objectives that collectively cover all issues, including the governance of the fund, and review performance against individual objectives.
Figure 25:Do trustees have individual objectives?
In the absence of formal objective setting, it was not surprising to note that for 85% of funds’ trustee remuneration was not linked to the actual performance of trustees. The same concern was highlighted in the 2010 survey.
Figure 23: Time spent by trustees on fund affairs per year (average hours)
Small
Medium
Large
Umbrella fund – type A or B
Standalone fund – hybrid
Standalone fund – defined contribution
Standalone fund – defined benefit
Retirement annuity fund
Preservation fund
63
48
53
58
86
95
60
74
49
Figure 24: Do the trustees have individual objectives?
There are formal objectives for each trustee, but they are not monitored or reviewed regularly
The trustees each have formal objectives basedon those of the fund, but collectively the individual
objectives do not cover all issues. Performanceis regularly reviewed against individual objectives
Other
The trustees each have formal objectives, which collectively cover all issues, including governance of
the fund. Performance is regularly reviewedagainst individual objectives
The trustees do not have individual objectives 73%
14%
8%
3%
2%
28 Retirement fund strategic matters and remuneration survey
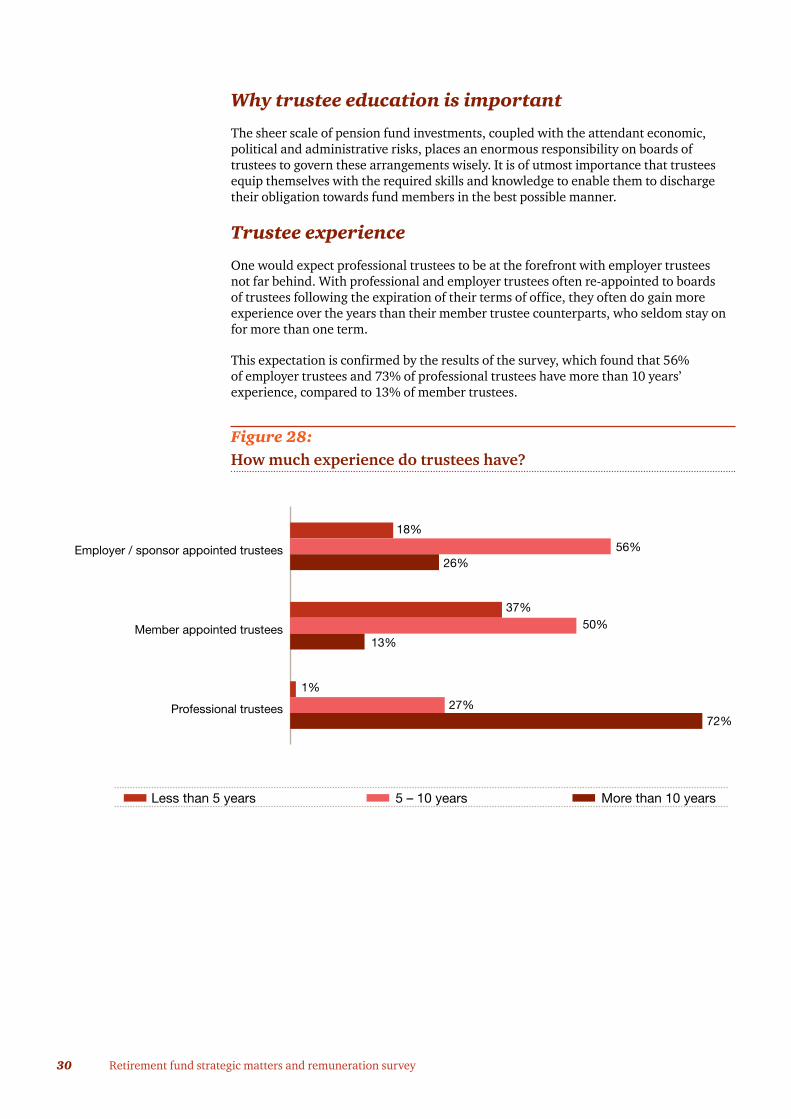
Figure 26:Is remuneration linked to the performance of the trustee?
Figure 27:What are key areas contributing to increased workloads for trustees?
On the question of what has led to increased workloads for trustees, it was not surprising that the increased complexity of retirement funds (35%) and regulatory changes (45%) were identified as the main contributors. The retirement fund landscape has changed significantly in the last few years and more is expected from trustees than ever before.
Figure 25: Is remuneration linked to the performance of trustee?
15%
85%
No Yes
Figure 26: What are key areas contributing to increased workloadsfor trustees?
Increased qualifications and skills requirements
Ongoing need for additional training and education
Increased complexity of retirement funds
Continual increase in level of regulatory change 45%
35%
14%
6%

Trustee education
29PwC
30 Retirement fund strategic matters and remuneration survey
Why trustee education is important
The sheer scale of pension fund investments, coupled with the attendant economic, political and administrative risks, places an enormous responsibility on boards of trustees to govern these arrangements wisely. It is of utmost importance that trustees equip themselves with the required skills and knowledge to enable them to discharge their obligation towards fund members in the best possible manner.
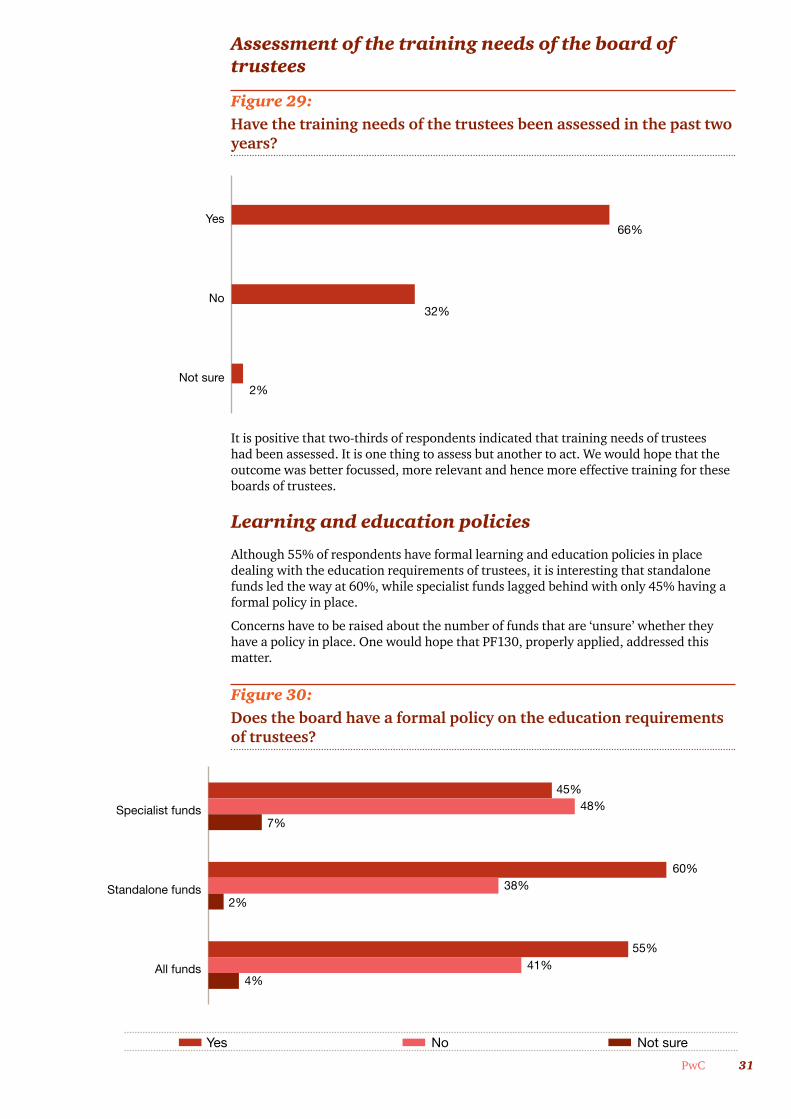
Trustee experience
One would expect professional trustees to be at the forefront with employer trustees not far behind. With professional and employer trustees often re-appointed to boards of trustees following the expiration of their terms of office, they often do gain more experience over the years than their member trustee counterparts, who seldom stay on for more than one term.
This expectation is confirmed by the results of the survey, which found that 56% of employer trustees and 73% of professional trustees have more than 10 years’ experience, compared to 13% of member trustees.
Figure 28:How much experience do trustees have?
Figure 27: How much experience do trustees have?
Professional trustees
Member appointed trustees
Employer / sponsor appointed trustees
18%
56%26%
37%
13%
27%
1%
72%
5 – 10 years More than 10 yearsLess than 5 years
50%
31PwC
Assessment of the training needs of the board of trustees
Figure 29:Have the training needs of the trustees been assessed in the past twoyears?
It is positive that two-thirds of respondents indicated that training needs of trustees had been assessed. It is one thing to assess but another to act. We would hope that the outcome was better focussed, more relevant and hence more effective training for these boards of trustees.
Learning and education policies
Although 55% of respondents have formal learning and education policies in place dealing with the education requirements of trustees, it is interesting that standalone funds led the way at 60%, while specialist funds lagged behind with only 45% having a formal policy in place.
Concerns have to be raised about the number of funds that are ‘unsure’ whether they have a policy in place. One would hope that PF130, properly applied, addressed this matter.
Figure 30:Does the board have a formal policy on the education requirementsof trustees?
Figure 28: Have the training needs of the trustees been assessed in the past two years?
Not sure
No
Yes66%
32%
2%
Figure 29: Does the board have a formal policy on the education of trustees?
All funds
Standalone funds
Specialist funds
45%48%
7%
60%38%
4%
55%41%
No Not sureYes
2%
32 Retirement fund strategic matters and remuneration survey
Training methods used
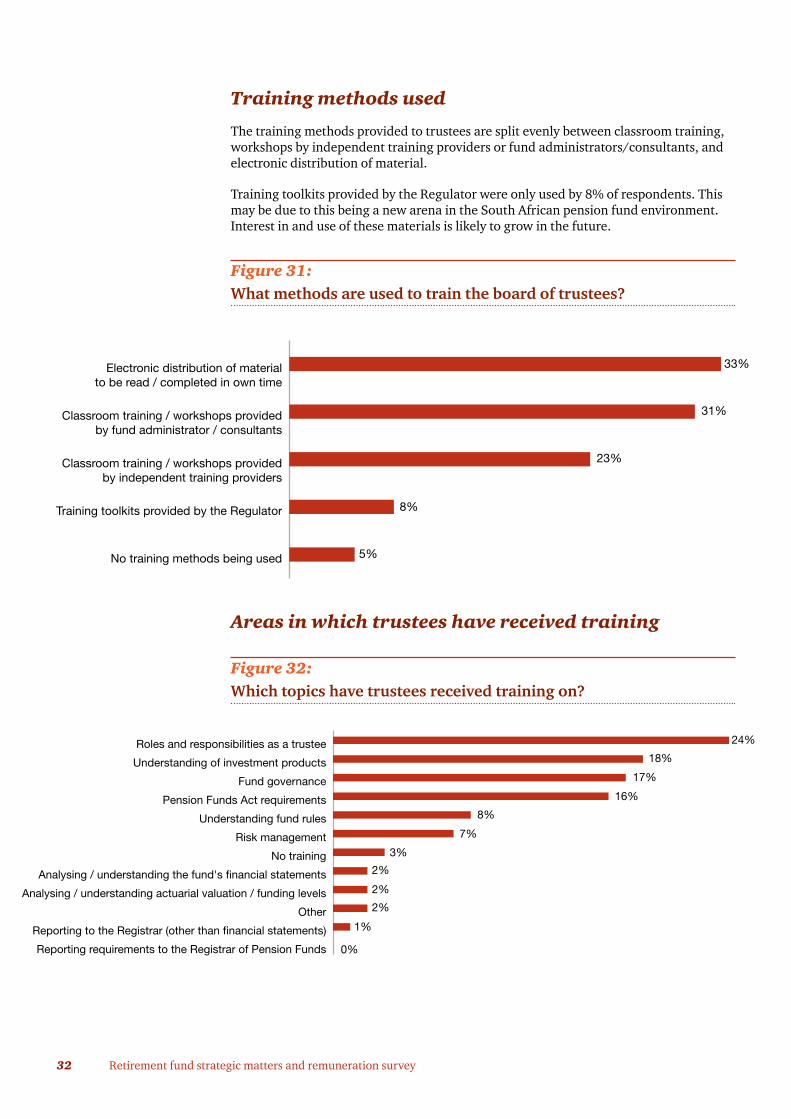
The training methods provided to trustees are split evenly between classroom training, workshops by independent training providers or fund administrators/consultants, and electronic distribution of material.
Training toolkits provided by the Regulator were only used by 8% of respondents. This may be due to this being a new arena in the South African pension fund environment. Interest in and use of these materials is likely to grow in the future.
Figure 31:What methods are used to train the board of trustees?
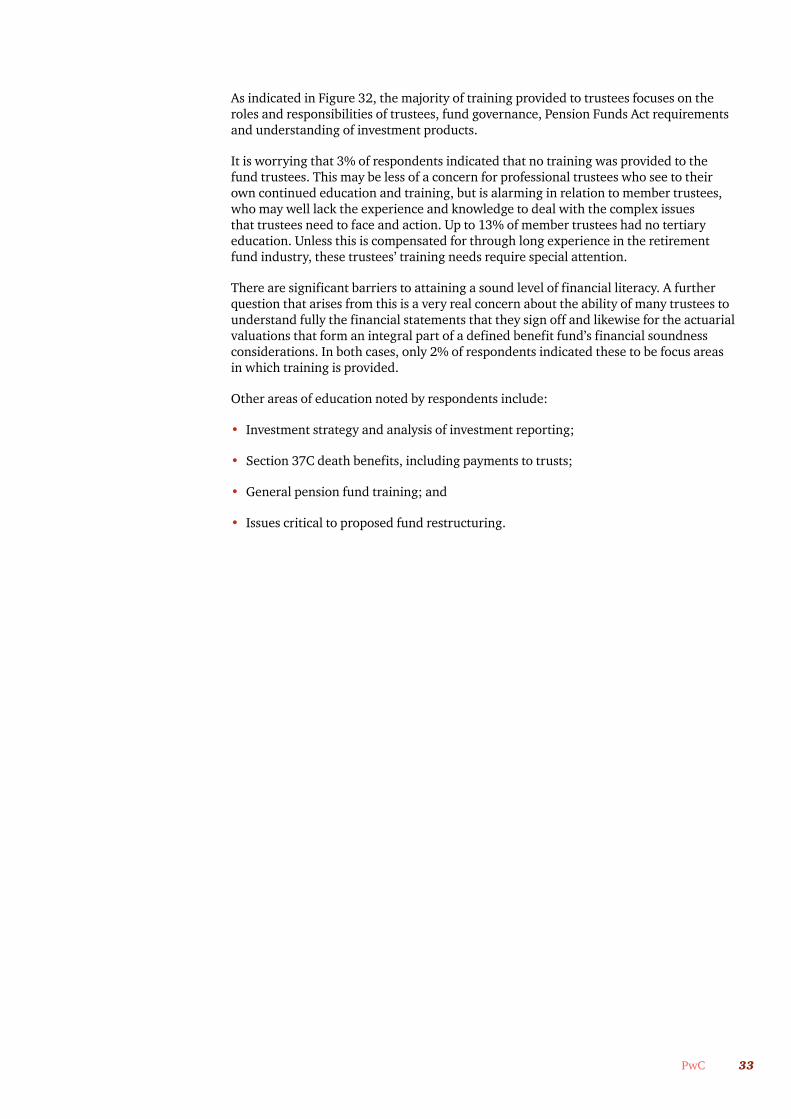
Areas in which trustees have received training
Figure 32:Which topics have trustees received training on?
Figure 30: What methods are used to train the board of trustees?
No training methods being used
Training toolkits provided by the Regulator
Classroom training / workshops providedby independent training providers
Classroom training / workshops providedby fund administrator / consultants
Electronic distribution of materialto be read / completed in own time
33%
31%
23%
8%
5%
Figure 31: Which areas have trustees received training on?
Reporting requirements to the Registrar of Pension Funds
Reporting to the Registrar (other than financial statements)
Other
Analysing / understanding actuarial valuation / funding levels
Analysing / understanding the fund's financial statements
No training
Risk management
Understanding fund rules
Pension Funds Act requirements
Fund governance
Understanding of investment products
Roles and responsibilities as a trustee 24%
18%
17%
16%
0%
8%
7%
3%
2%
2%
2%
1%
33PwC
As indicated in Figure 32, the majority of training provided to trustees focuses on the roles and responsibilities of trustees, fund governance, Pension Funds Act requirements and understanding of investment products.
It is worrying that 3% of respondents indicated that no training was provided to the fund trustees. This may be less of a concern for professional trustees who see to their own continued education and training, but is alarming in relation to member trustees, who may well lack the experience and knowledge to deal with the complex issues that trustees need to face and action. Up to 13% of member trustees had no tertiary education. Unless this is compensated for through long experience in the retirement fund industry, these trustees’ training needs require special attention.
There are significant barriers to attaining a sound level of financial literacy. A further question that arises from this is a very real concern about the ability of many trustees to understand fully the financial statements that they sign off and likewise for the actuarial valuations that form an integral part of a defined benefit fund’s financial soundness considerations. In both cases, only 2% of respondents indicated these to be focus areas in which training is provided.
Other areas of education noted by respondents include:
• Investment strategy and analysis of investment reporting;
• Section 37C death benefits, including payments to trusts;
• General pension fund training; and
• Issues critical to proposed fund restructuring.
34 Retirement fund strategic matters and remuneration survey
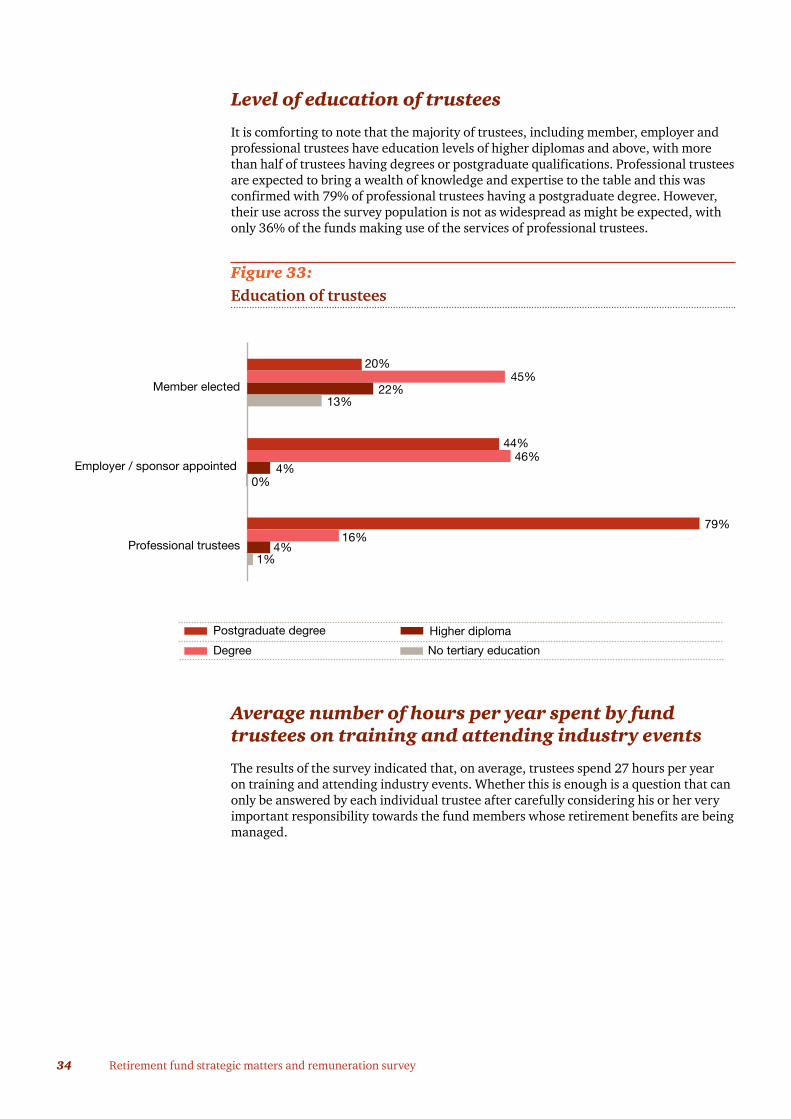
Level of education of trustees
It is comforting to note that the majority of trustees, including member, employer and professional trustees have education levels of higher diplomas and above, with more than half of trustees having degrees or postgraduate qualifications. Professional trustees are expected to bring a wealth of knowledge and expertise to the table and this was confirmed with 79% of professional trustees having a postgraduate degree. However, their use across the survey population is not as widespread as might be expected, with only 36% of the funds making use of the services of professional trustees.
Figure 33:Education of trustees
Average number of hours per year spent by fund trustees on training and attending industry events
The results of the survey indicated that, on average, trustees spend 27 hours per year on training and attending industry events. Whether this is enough is a question that can only be answered by each individual trustee after carefully considering his or her very important responsibility towards the fund members whose retirement benefits are being managed.
Figure 32: Education of trustees
Professional trustees
Employer / sponsor appointed
Member elected
20%45%
13%
46%
22%
44%
4%
79%
0%
16%4%
1%
Postgraduate degree
No tertiary educationDegree
Higher diploma
35PwC
We suggest trustees should take care that enough time is set aside to equip themselves with the knowledge and skills they may well lack.
Factors for trustees to consider:
• What is my current level of experience as a trustee?
• Do I have the knowledge required to make informed decisions regarding financial reporting, investment products, valuation results and regulatory compliance?
• Can I add value to the risk management process of the fund and ensure proper focus is placed on critical areas?
• Do I possess the necessary confidence to deal effectively with service providers and to ask the right questions and ensure that proper responses are obtained?
• Can I provide fund members with the comfort that their retirement benefits are being looked after by a suitably knowledgeable, skilled and experienced board?
With the ever-changing regulatory, investment and financial reporting environments, trustees should ensure that they are at the forefront of these changes and hence well equipped to fulfil their key role.
Other views regarding trustee education
A common view running through respondents’ feedback was that trustees must keep up to date with the regulatory and governance requirements of the retirement funds industry and that ongoing training of all trustees should be compulsory.
Some respondents felt that there should be minimum education levels for trustees. Others felt that the value of trustees’ input could not be determined by academic qualifications. A number of respondents indicated that each trustee, especially professional trustees, should take ownership of their own continued professional development, while many supported the idea that the Registrar of Pension Funds should provide the primary platform for the training of trustees.
Suggestions were made that the Registrar should formally monitor training. Ways to accomplish this include:
• Compulsory annual disclosure to the FSB and fund members of training attended;
• Training should be compulsory for holding an office and monitored by the amount of ‘points’ accumulated for completion of training;
• Compulsory implementation of an induction and development policy by each board of trustees;
• Measuring training annually to determine what individuals have done to educate themselves. This may be accomplished with annual certification by each trustee; and
• Encouraging board members to complete an annual self-assessment to ascertain training requirements.
Several respondents indicated that a minimum level of trustee training should be compulsory.
36 Retirement fund strategic matters and remuneration survey
Training challenges identified
The following challenges were noted by respondents concerning training:
• With the high cost of training seminars/workshops, the Registrar should supply more accessible training and information (web-based) with the focus on providing information and not only training;
• Training should differentiate between retail and occupational funds;
• High staff turnover generally undermines training efforts;
• As most trustees are employed, it is often difficult to have sufficient time away from the office to attend to fund matters/meetings/training;
• It is becoming increasingly onerous to be a trustee (due to legislative requirements, etc.);
• New trustees face a steep learning curve given the ever-increasing complexity of the pension fund industry; and
• Some member trustees seem reluctant to read all applicable and topical material sent to them.
Suggestions from respondents for training events/material included:
• Training must be fund specific and not merely deal with general issues in the industry;
• Training needs to be split into different areas and dealt with intensively;
• It is important to use trainers that are able to communicate effectively to trustees who have different levels of expertise;
• Frequent communication of industry articles and other publications by the principal officer or service providers to the fund provides a good platform for ongoing education and development of trustees;
• It is essential that the employers/administrators give maximum assistance to trustees in understanding the role and responsibilities of a trustee;
• Trustees training should be provided by independent facilitators;
• A standardised set of training materials/checklists/guidelines created and maintained by regulatory bodies may be beneficial to the industry;
• On-the-job training during trustee meetings adds value;
• Self-education of trustees is essential. Trustees need to keep themselves abreast of developments in the industry by reading relevant articles in magazines and newspapers; and
• Continuous development and the relevant taxation legislation should form part of the training curriculum.

Principal officers
37PwC
38 Retirement fund strategic matters and remuneration survey
In our 2010 survey, we looked at the remuneration of principal officers for the first time. The considerable role of professional principal officers in large and specialist funds aligned with almost 70% of respondents for those funds reporting that the principal officer was remunerated.
In view of governance-related developments in recent years directly affecting the role of the principal officer, such as PF 130 and the ‘Fit and Proper Requirements’ set out in Directive PF 5, issued by the Financial Services Board, we thought it appropriate to assess the skills and experience of principal officers in addition to looking at their current remuneration levels.
Experience and qualification of principal officers
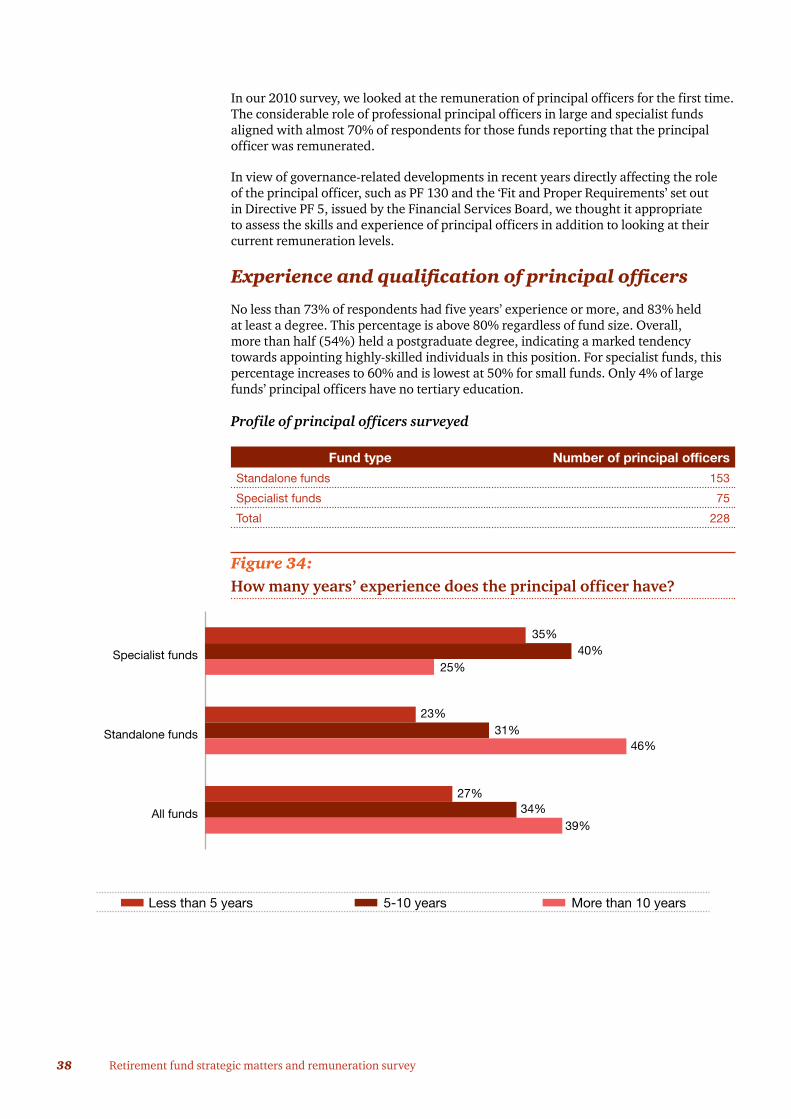
No less than 73% of respondents had five years’ experience or more, and 83% held at least a degree. This percentage is above 80% regardless of fund size. Overall, more than half (54%) held a postgraduate degree, indicating a marked tendency towards appointing highly-skilled individuals in this position. For specialist funds, this percentage increases to 60% and is lowest at 50% for small funds. Only 4% of large funds’ principal officers have no tertiary education.
Profile of principal officers surveyed
Fund type Number of principal officers
Standalone funds 153
Specialist funds 75
Total 228
Figure 34: How many years’ experience does the principal officer have?
Figure 36: How many years' experience does the principal officer have?
All funds
Standalone funds
Specialist funds
35%40%
25%
23%31%
46%
27%34%
39%
5-10 years More than 10 yearsLess than 5 years
39PwC
Principal officers in standalone funds have more years of experience than those in specialist funds. Almost double the proportion of principal officers of standalone funds (46%) have more than 10 years’ experience compared to 25% for specialist funds. Among specialist funds, 35% of principal officers have less than five years’ experience compared to 23% for standalone funds. Principal officers in small and medium funds have more years’ experience than those in large funds. Only 67% of large funds’ principal officers have more than five years’ experience compared to 80% for medium and 65% for small funds.
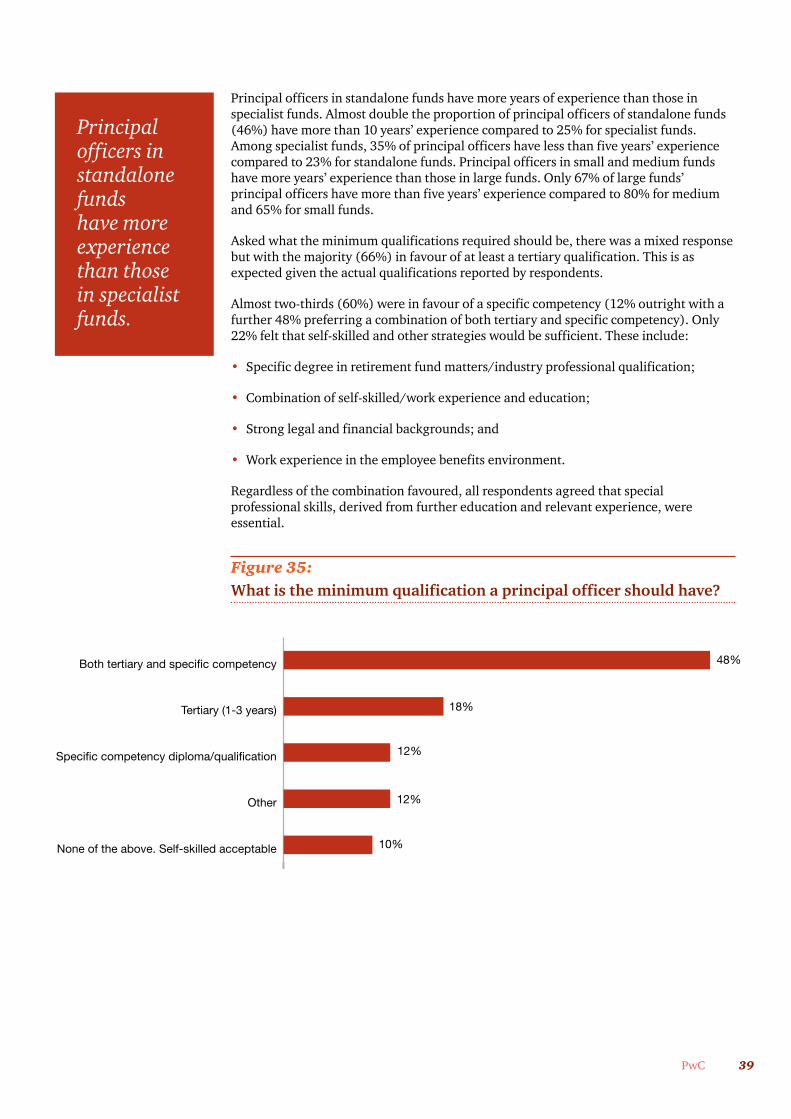
Asked what the minimum qualifications required should be, there was a mixed response but with the majority (66%) in favour of at least a tertiary qualification. This is as expected given the actual qualifications reported by respondents.
Almost two-thirds (60%) were in favour of a specific competency (12% outright with a further 48% preferring a combination of both tertiary and specific competency). Only 22% felt that self-skilled and other strategies would be sufficient. These include:
• Specific degree in retirement fund matters/industry professional qualification;
• Combination of self-skilled/work experience and education;
• Strong legal and financial backgrounds; and
• Work experience in the employee benefits environment.
Regardless of the combination favoured, all respondents agreed that special professional skills, derived from further education and relevant experience, were essential.
Figure 35:What is the minimum qualification a principal officer should have?
Figure 37: What is the minimum qualification a principal officer should have?
None of the above. Self-skilled acceptable
Other
Specific competency diploma/qualification
Tertiary (1-3 years)
Both tertiary and specific competency 48%
18%
12%
12%
10%
Principal officers in standalone funds have more experience than those in specialist funds.
40 Retirement fund strategic matters and remuneration survey
Regulation and employment status
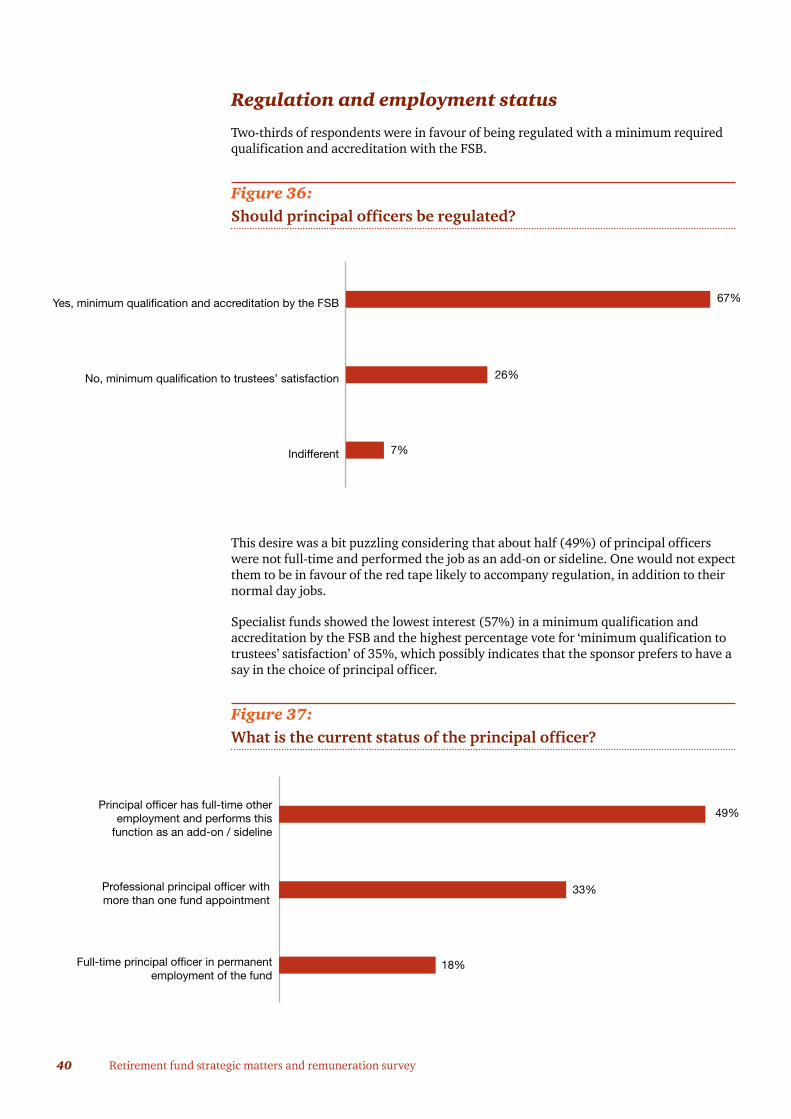
Two-thirds of respondents were in favour of being regulated with a minimum required qualification and accreditation with the FSB.
Figure 36:Should principal officers be regulated?
This desire was a bit puzzling considering that about half (49%) of principal officers were not full-time and performed the job as an add-on or sideline. One would not expect them to be in favour of the red tape likely to accompany regulation, in addition to their normal day jobs.
Specialist funds showed the lowest interest (57%) in a minimum qualification and accreditation by the FSB and the highest percentage vote for ‘minimum qualification to trustees’ satisfaction’ of 35%, which possibly indicates that the sponsor prefers to have a say in the choice of principal officer.
Figure 37:What is the current status of the principal officer?
Figure 38: Should principal officers be regulated?
Indifferent
No, minimum qualification to trustees’ satisfaction
Yes, minimum qualification and accreditation by the FSB 67%
26%
7%
Figure 39: What is the current status of the principal officer?
Full-time principal officer in permanentemployment of the fund
Professional principal officer withmore than one fund appointment
Principal officer has full-time otheremployment and performs this
function as an add-on / sideline
49%
33%
18%

41PwC
The fact that 51 % of respondents have full-time careers as principal officers indicates that the job has evolved into a skilled profession. As expected, for large and specialist funds, there is a preference to employ permanent or professional principal officers.
Small and medium funds tend to have part-time principal officers (in 61% of cases) who have other full-time employment, possibly indicating that they work for the employer and fulfil the principal officer job as sideline.
For large funds, 26% employ a full-time principal officer and 45% employ professional principal officers who have more than one fund appointment.
Specialist funds reflect an even greater tendency to outsource the function with 53% employing professional principal officers and 15% employing full-time officers, meaning that 68% have full-time or professional principal officers.
51% of respondents have a full-time career as a principal officer
42 Retirement fund strategic matters and remuneration survey
Remuneration
In 2010, 53% of funds did not remunerate their principal officers compared with 42% in 2012 – a large shift of 11 percentage points. Those funds that do remunerate prefer a fixed monthly fee or salary (as in 2010), with the large funds paying higher salaries. About half of small (49%) and medium (58%) funds do not remunerate the principal officer as opposed to only 15% of large funds that do not do so.
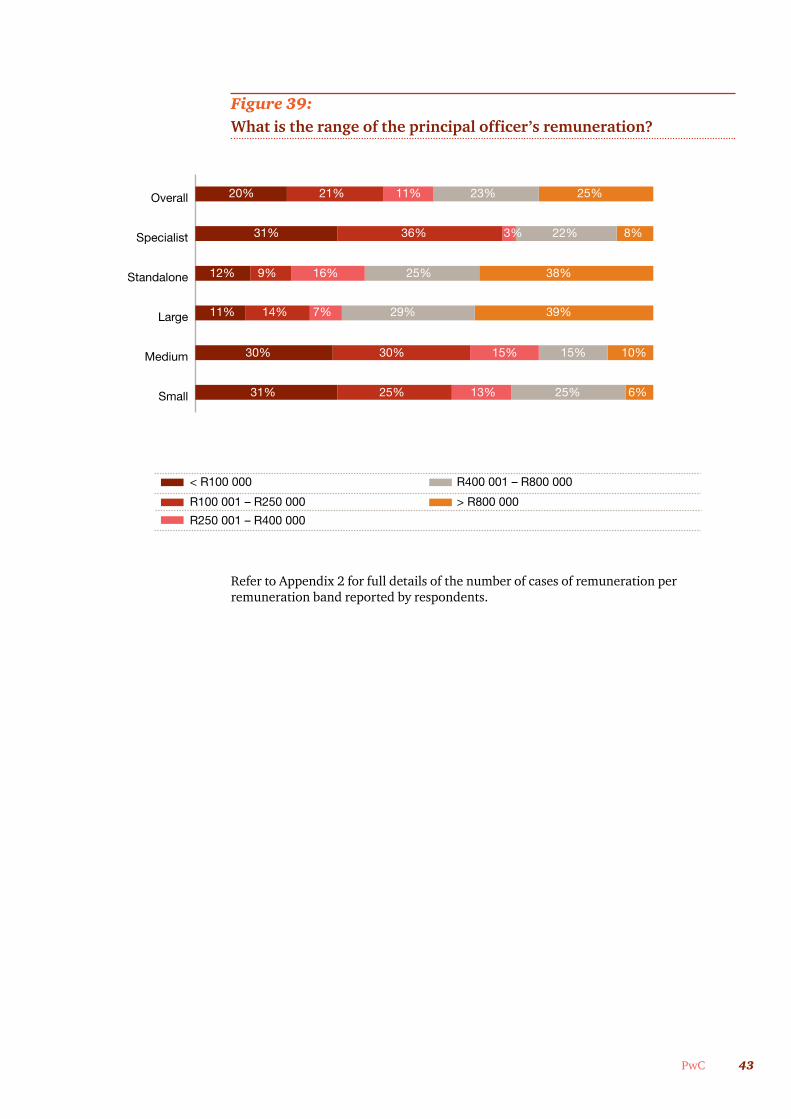
Standalone funds issue bigger pay cheques with 63% of those that do remunerate paying more than R400 000 per annum.
Specialist funds pay less than R250 000 per annum in 67% of cases, possibly indicating that sponsors are picking up the bulk of remuneration.
Of large funds that remunerate, 39% pay more than R800 000 per annum.
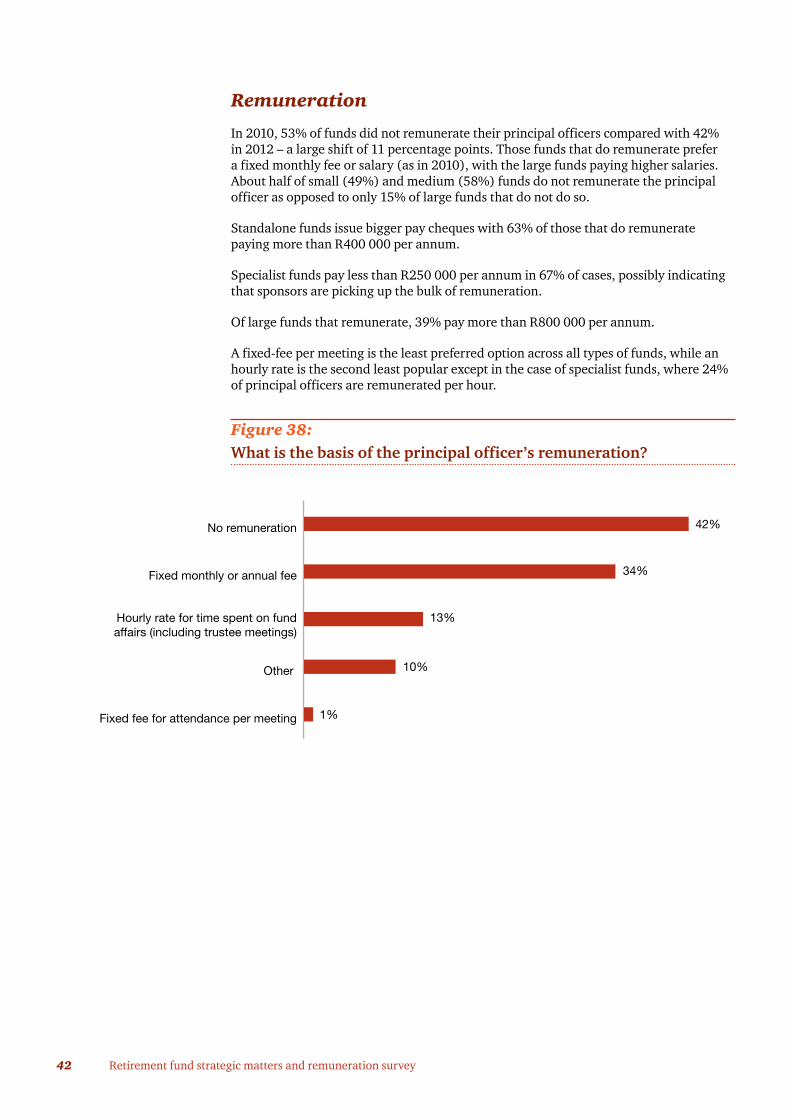
A fixed-fee per meeting is the least preferred option across all types of funds, while an hourly rate is the second least popular except in the case of specialist funds, where 24% of principal officers are remunerated per hour.
Figure 38:What is the basis of the principal officer’s remuneration?
Figure 40: What is the basis of principal officers' remuneration?
Fixed fee for attendance per meeting
Other
Hourly rate for time spent on fundaffairs (including trustee meetings)
Fixed monthly or annual fee
No remuneration 42%
34%
13%
1%
10%
43PwC
Figure 39:What is the range of the principal officer’s remuneration?
Refer to Appendix 2 for full details of the number of cases of remuneration per remuneration band reported by respondents.
Figure 41: What is the range of principal officers' remuneration?
Small
Medium
Large
Standalone
Specialist
Overall 20% 21% 11% 23% 25%
31% 36% 3% 22% 8%
12% 9% 16% 25% 38%
11% 14% 7% 29% 39%
30% 30% 15% 15% 10%
31% 25% 13% 25% 6%
< R100 000 R400 001 – R800 000
R100 001 – R250 000
R250 001 – R400 000
> R800 000
44 Retirement fund strategic matters and remuneration survey
Time spent and assessment
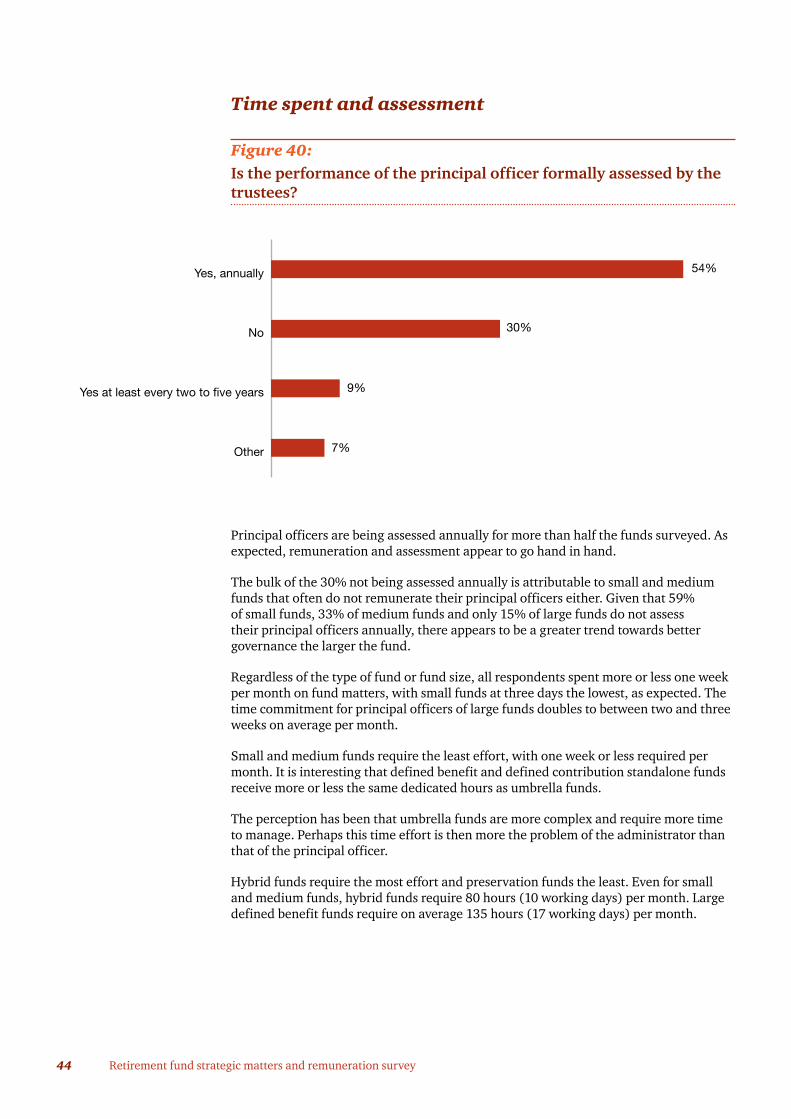
Figure 40:Is the performance of the principal officer formally assessed by thetrustees?
Principal officers are being assessed annually for more than half the funds surveyed. As expected, remuneration and assessment appear to go hand in hand.
The bulk of the 30% not being assessed annually is attributable to small and medium funds that often do not remunerate their principal officers either. Given that 59% of small funds, 33% of medium funds and only 15% of large funds do not assess their principal officers annually, there appears to be a greater trend towards better governance the larger the fund.
Regardless of the type of fund or fund size, all respondents spent more or less one week per month on fund matters, with small funds at three days the lowest, as expected. The time commitment for principal officers of large funds doubles to between two and three weeks on average per month.
Small and medium funds require the least effort, with one week or less required per month. It is interesting that defined benefit and defined contribution standalone funds receive more or less the same dedicated hours as umbrella funds.
The perception has been that umbrella funds are more complex and require more time to manage. Perhaps this time effort is then more the problem of the administrator than that of the principal officer.
Hybrid funds require the most effort and preservation funds the least. Even for small and medium funds, hybrid funds require 80 hours (10 working days) per month. Large defined benefit funds require on average 135 hours (17 working days) per month.
Figure 42: Is the performance of the principal officer formally assessed by the trustees?
Other
Yes at least every two to five years
No
Yes, annually 54%
30%
9%
7%
45PwC
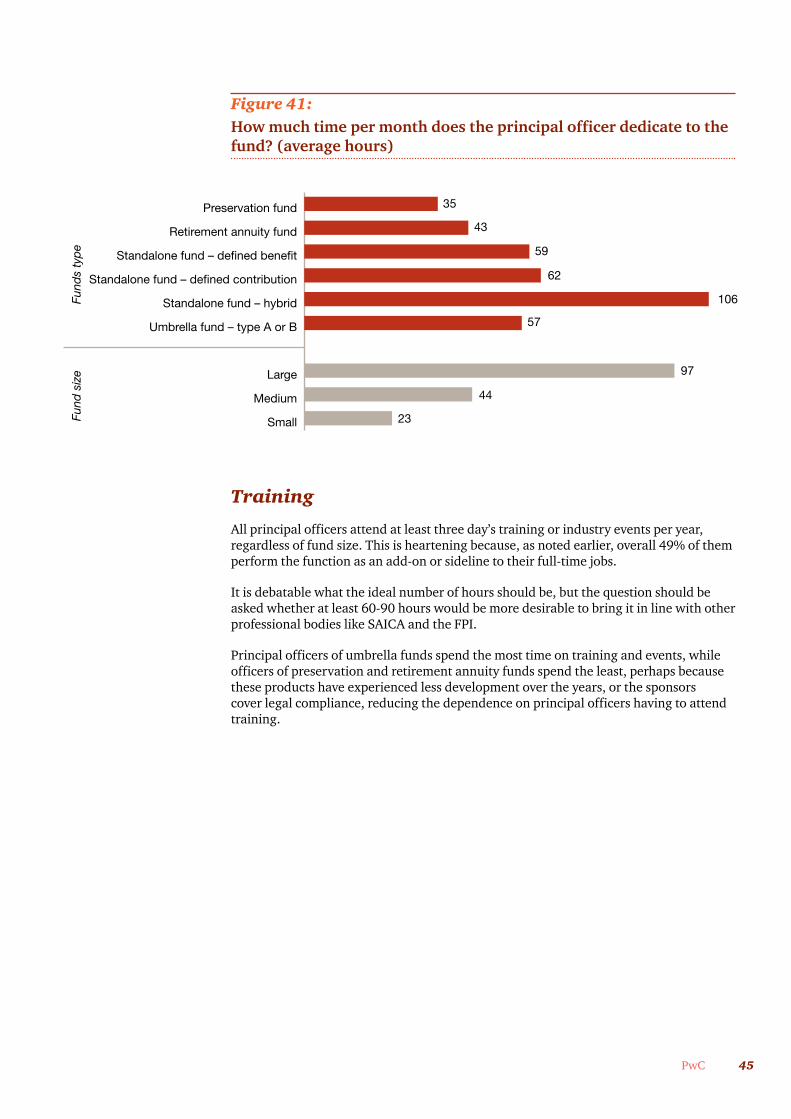
Figure 41: How much time per month does the principal officer dedicate to thefund? (average hours)
Training
All principal officers attend at least three day’s training or industry events per year, regardless of fund size. This is heartening because, as noted earlier, overall 49% of them perform the function as an add-on or sideline to their full-time jobs.
It is debatable what the ideal number of hours should be, but the question should be asked whether at least 60-90 hours would be more desirable to bring it in line with other professional bodies like SAICA and the FPI.
Principal officers of umbrella funds spend the most time on training and events, while officers of preservation and retirement annuity funds spend the least, perhaps because these products have experienced less development over the years, or the sponsors cover legal compliance, reducing the dependence on principal officers having to attend training.
Figure 43: How much time per month does the principal officer dedicate to the fund? (average hours)
Small
Medium
Large
Umbrella fund – type A or B
Standalone fund – hybrid
Standalone fund – defined contribution
Standalone fund – defined benefit
Retirement annuity fund
Preservation fund 35
43
62
106
97
44
23
59
57
Fund
s ty
pe
Fund
siz
e
46 Retirement fund strategic matters and remuneration survey
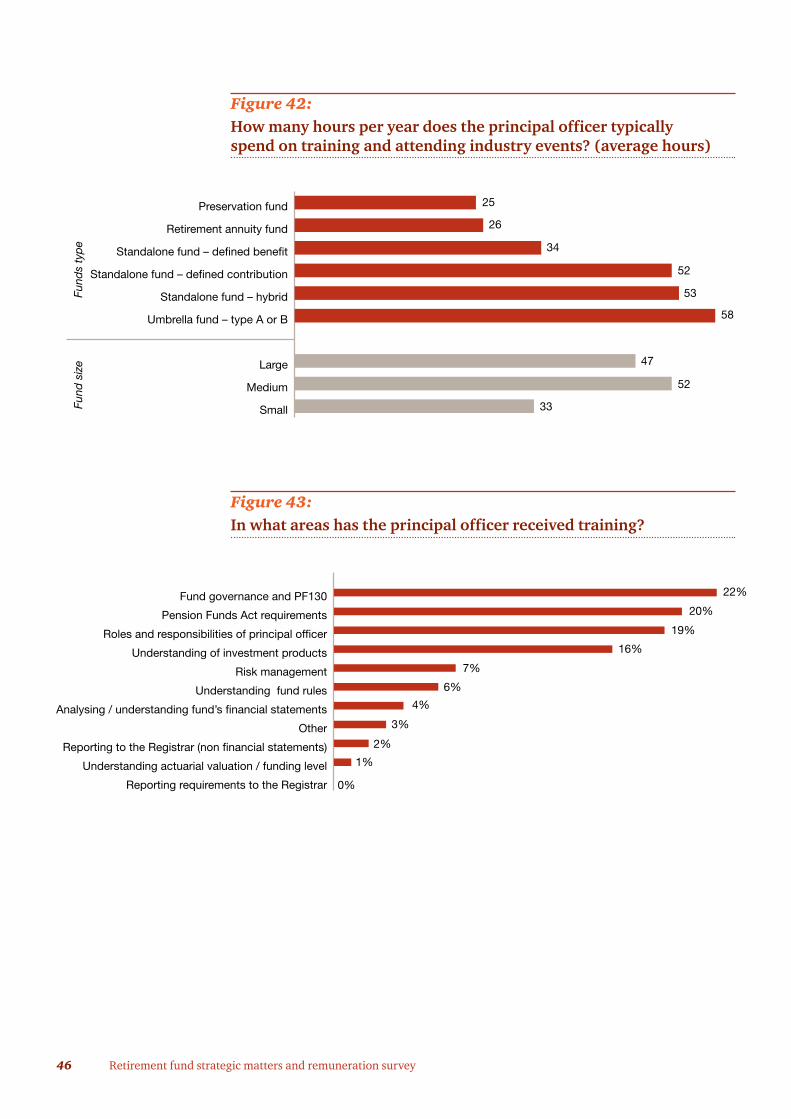
Figure 42:How many hours per year does the principal officer typicallyspend on training and attending industry events? (average hours)
Figure 43:In what areas has the principal officer received training?
Figure 44.1: How many hours per year does the principal officer typically spend on training and attending industry events? (average hours)
Small
Medium
Large
Umbrella fund – type A or B
Standalone fund – hybrid
Standalone fund – defined contribution
Standalone fund – defined benefit
Retirement annuity fund
Preservation fund 25
26
52
53
47
52
33
34
58
Fund
s ty
pe
Fund
siz
e
Figure 44.2: In what areas has the principal officer received training?
Reporting requirements to the Registrar
Understanding actuarial valuation / funding level
Reporting to the Registrar (non financial statements)
Other
Analysing / understanding fund’s financial statements
Understanding fund rules
Risk management
Understanding of investment products
Roles and responsibilities of principal officer
Pension Funds Act requirements
Fund governance and PF130 22%
20%
19%
0%
16%
7%
6%
4%
3%
2%
1%

47PwC
The top three areas of training are governance (PF130), the Pension Funds Act requirements, and roles and responsibilities of principal officers. This is as expected given the statement on compliance that must be signed off annually by each principal officer in the financial statements.
Understanding of investment products is next in line and should probably receive more attention. Investments seem to be regarded as more of a trustee responsibility or that of the outsourced asset consultants or investment managers.
A worrying trend is that little time is spent on understanding the financial statements (4%), the actuarial reports (1%) and risk management (7%). Clearly, principal officers regard these areas as either too complex or covered by the outsourced service providers.
Just 3% of respondents indicated that either no training is provided because they are self responsible, being professional trustees, or that they received training in less than three areas or other specific fields such as Section 37C disposal of death benefits or the fund’s accounting system.

Regulatory aspects and risk management
48 Trustee Remuneration and Governance Survey
49PwC
Protection of members
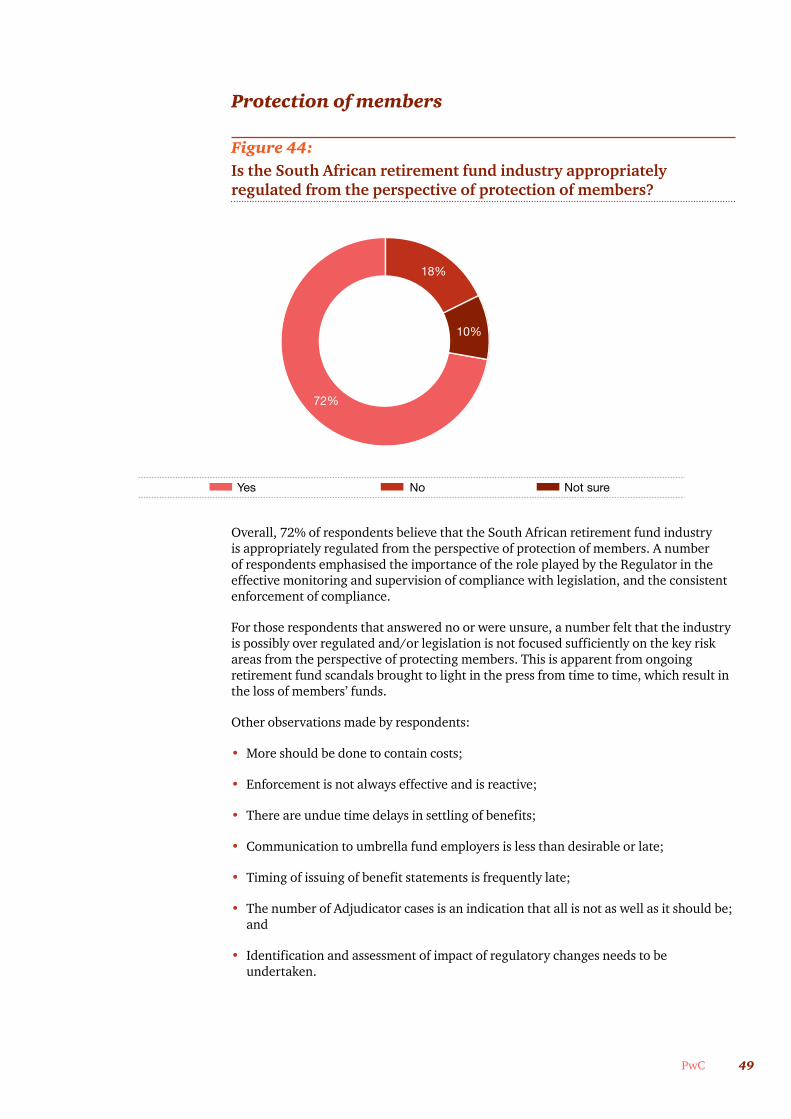
Figure 44:Is the South African retirement fund industry appropriatelyregulated from the perspective of protection of members?
Overall, 72% of respondents believe that the South African retirement fund industry is appropriately regulated from the perspective of protection of members. A number of respondents emphasised the importance of the role played by the Regulator in the effective monitoring and supervision of compliance with legislation, and the consistent enforcement of compliance.
For those respondents that answered no or were unsure, a number felt that the industry is possibly over regulated and/or legislation is not focused sufficiently on the key risk areas from the perspective of protecting members. This is apparent from ongoing retirement fund scandals brought to light in the press from time to time, which result in the loss of members’ funds.
Other observations made by respondents:
• More should be done to contain costs;
• Enforcement is not always effective and is reactive;
• There are undue time delays in settling of benefits;
• Communication to umbrella fund employers is less than desirable or late;
• Timing of issuing of benefit statements is frequently late;
• The number of Adjudicator cases is an indication that all is not as well as it should be; and
• Identification and assessment of impact of regulatory changes needs to be undertaken.
Figure 45: Is the South African retirement fund industry appropriatelyregulated from the perspective of protection of members?
18%
No Not sure
72%
10%
Yes
50 Retirement fund strategic matters and remuneration survey
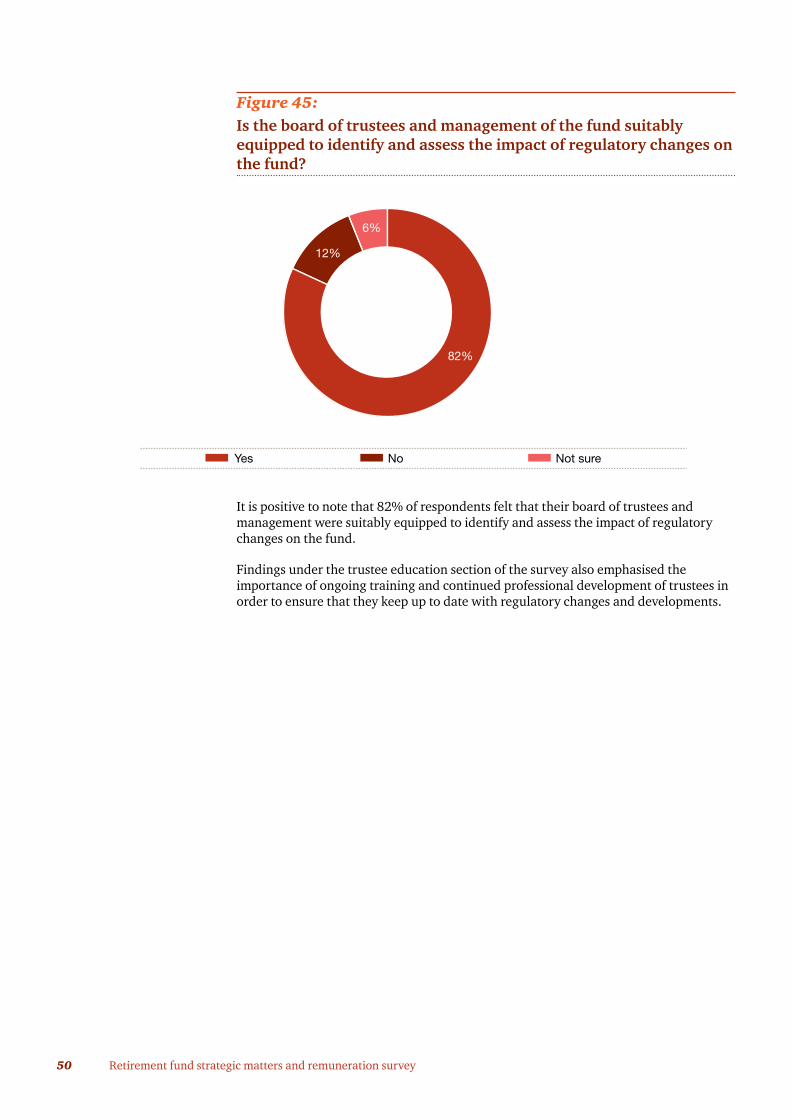
Figure 45:Is the board of trustees and management of the fund suitablyequipped to identify and assess the impact of regulatory changes onthe fund?
It is positive to note that 82% of respondents felt that their board of trustees and management were suitably equipped to identify and assess the impact of regulatory changes on the fund.
Findings under the trustee education section of the survey also emphasised the importance of ongoing training and continued professional development of trustees in order to ensure that they keep up to date with regulatory changes and developments.
Figure 46: Do you believe that the board of trustees and management in respect of the fund are suitably equipped to identify and assess the impact of regulatory changes on the fund?
6%
Yes No
82%
12%
Not sure
51PwC
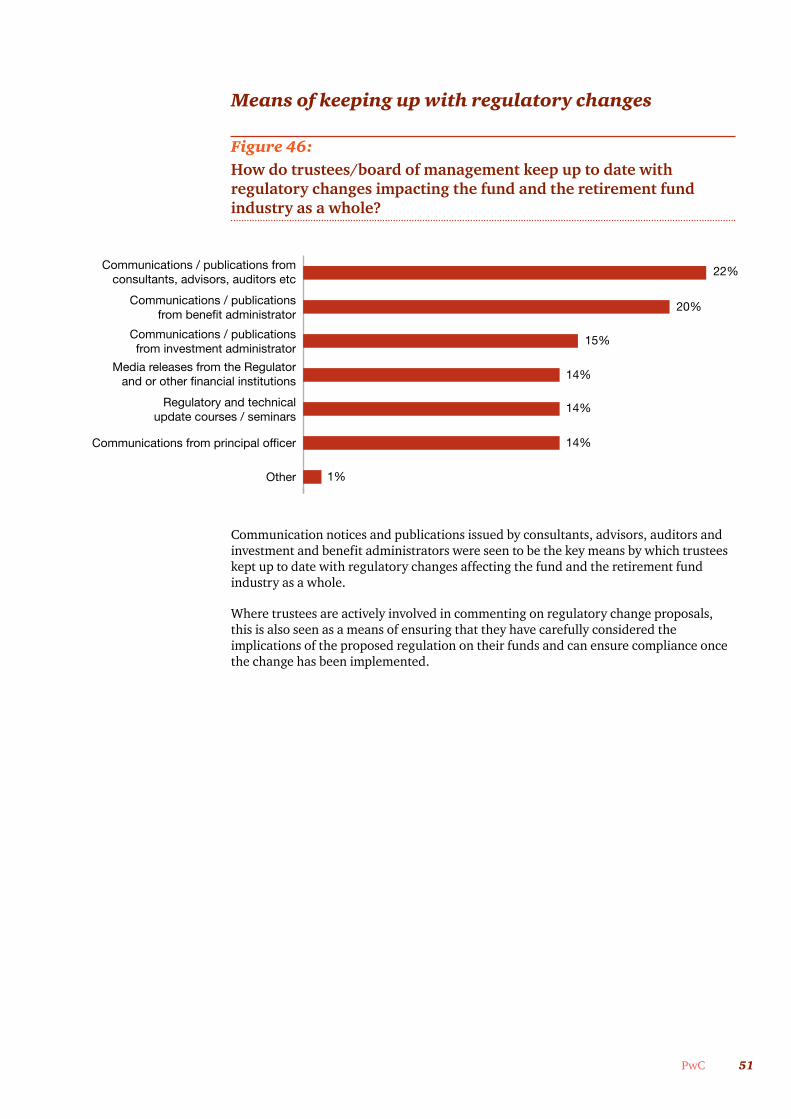
Means of keeping up with regulatory changes
Figure 46:How do trustees/board of management keep up to date withregulatory changes impacting the fund and the retirement fundindustry as a whole?
Communication notices and publications issued by consultants, advisors, auditors and investment and benefit administrators were seen to be the key means by which trustees kept up to date with regulatory changes affecting the fund and the retirement fund industry as a whole.
Where trustees are actively involved in commenting on regulatory change proposals, this is also seen as a means of ensuring that they have carefully considered the implications of the proposed regulation on their funds and can ensure compliance once the change has been implemented.
Figure 47: How do the trustees / board of management keep up to date with regulatory changes impacting the fund and the retirement fund industry as a whole?
Other
Communications from principal officer
Regulatory and technicalupdate courses / seminars
Media releases from the Regulatorand or other financial institutions
Communications / publicationsfrom investment administrator
Communications / publicationsfrom benefit administrator
Communications / publications fromconsultants, advisors, auditors etc
22%
20%
15%
14%
14%
14%
1%
52 Retirement fund strategic matters and remuneration survey
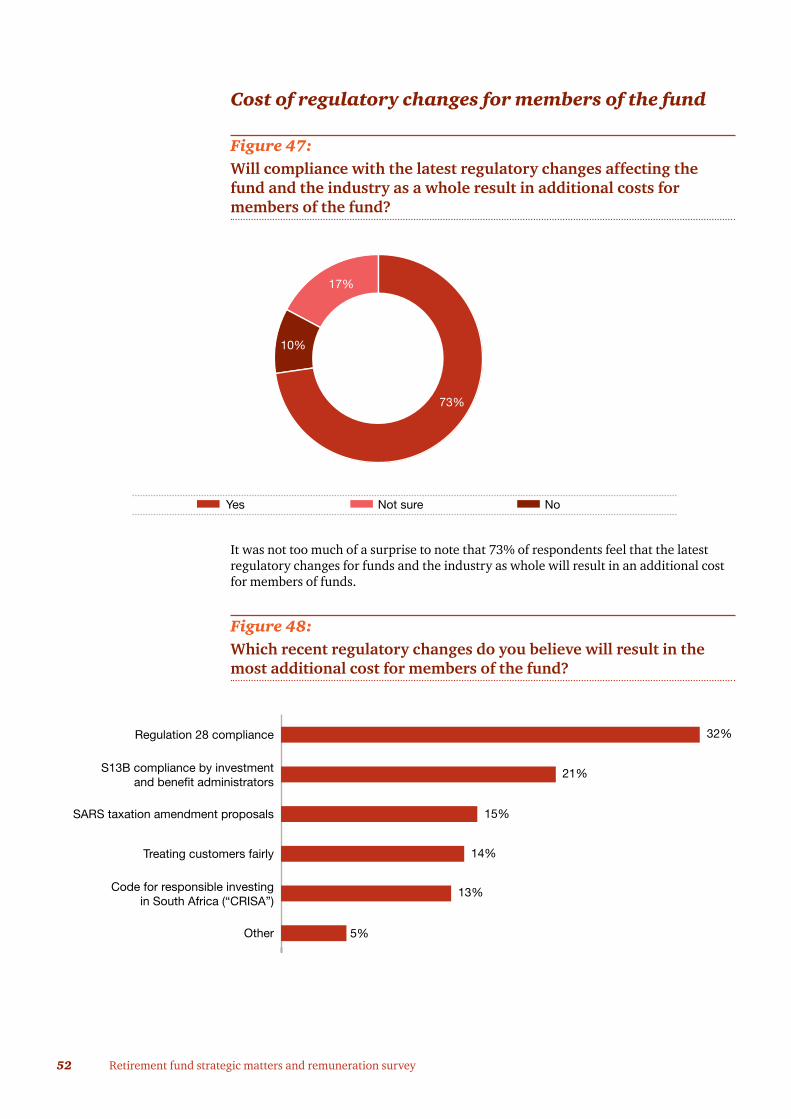
Cost of regulatory changes for members of the fund
Figure 47:Will compliance with the latest regulatory changes affecting the fund and the industry as a whole result in additional costs formembers of the fund?
It was not too much of a surprise to note that 73% of respondents feel that the latest regulatory changes for funds and the industry as whole will result in an additional cost for members of funds.
Figure 48:Which recent regulatory changes do you believe will result in themost additional cost for members of the fund?
Figure 48: Do you believe that compliance with the latest regulatory changes affecting the fund and the industry as a whole will result in additional costs for members of the fund?
10%
Yes No
73%
17%
Not sure
Figure 49: Which recent regulatory changes do you believe will result in the most additional cost for members of the fund?
Other
Code for responsible investingin South Africa (“CRISA”)
Treating customers fairly
SARS taxation amendment proposals
S13B compliance by investmentand benefit administrators
Regulation 28 compliance 32%
21%
15%
14%
13%
5%

53PwC
In line with our expectations and knowledge of the retirement fund industry, the top three areas of regulatory change expected to have the most additional cost impact for members were noted as follows:
• Regulation 28 compliance;
• S13B compliance by investment and benefit administrators; and
• SARS taxation amendment proposals.
Scope for simplification and/ or cost reduction in operation of the fund
Figure 49:Is there scope for simplification and/or cost reduction in theoperation of the fund?
The overwhelming majority of respondents felt there was scope for simplification and/or cost reduction in the operation of their funds. This suggests that respondents believe that fund arrangements and operations are more complex than necessary or desirable and in our experience this is often so.
Those that said ‘no’ offered reasons such as:
• Governance and compliance costs are a given and will always be there;
• Diverse member needs cannot be catered for more cheaply;
• Operations are managed as efficiently as possible and costs are reviewed regularly;
• Tough competition between providers keeps all of them on their toes; and
• Economies of scale are already in place.
Figure 50: Do you believe there is scope for simplification and / or cost reduction in the operation of the fund?
32%
68%
Yes No
Most additional cost is expected to come from compliance with the revised Regulation 28.
54 Retirement fund strategic matters and remuneration survey
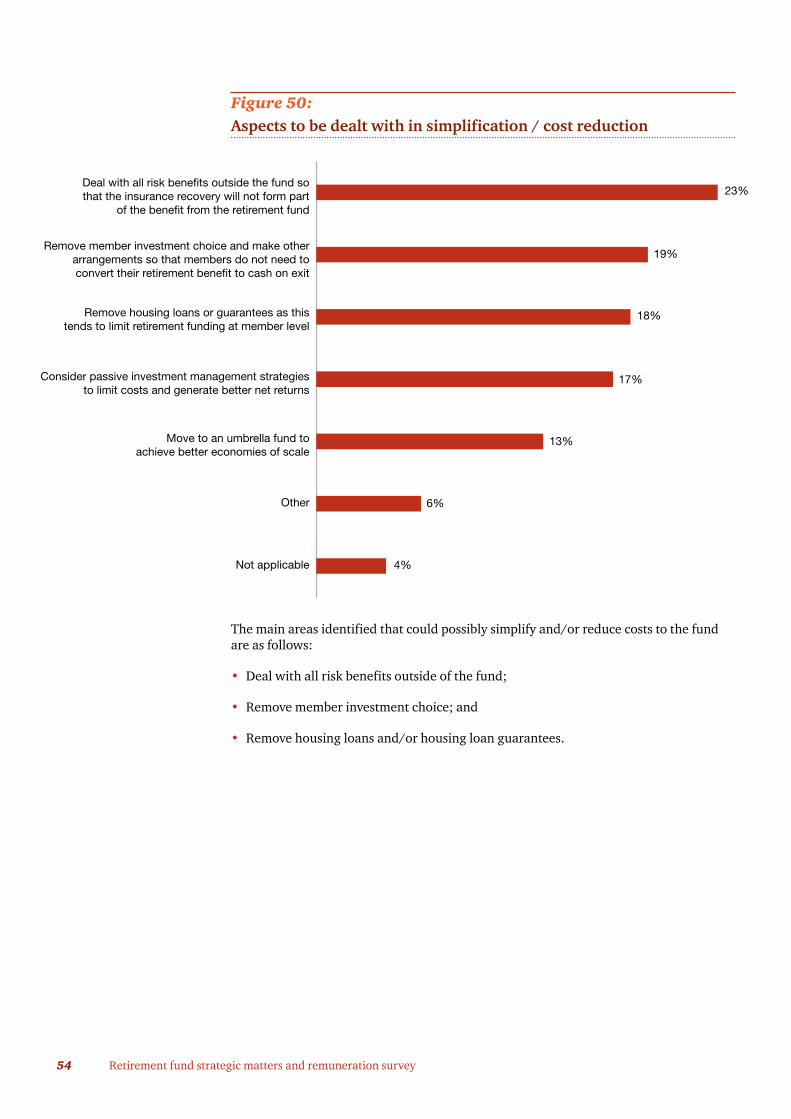
Figure 50:Aspects to be dealt with in simplification / cost reduction
The main areas identified that could possibly simplify and/or reduce costs to the fund are as follows:
• Deal with all risk benefits outside of the fund;
• Remove member investment choice; and
• Remove housing loans and/or housing loan guarantees.
Figure 51: Aspects to be dealt with
23%
19%15%
18%14%
13%
17%
Not applicable
Other
Move to an umbrella fund toachieve better economies of scale
Consider passive investment management strategiesto limit costs and generate better net returns
Remove housing loans or guarantees as thistends to limit retirement funding at member level
Remove member investment choice and make otherarrangements so that members do not need toconvert their retirement benefit to cash on exit
Deal with all risk benefits outside the fund sothat the insurance recovery will not form part
of the benefit from the retirement fund
6%
4%
55PwC
Application of King III to pension funds
Figure 51:Should King III apply to pension funds?
Following on from our previous surveys in 2007 and 2010, adherence to sound principles of governance remains a high priority for trustee boards. Most respondents fell into one of two evenly matched camps: one that saw King III as very valuable for funds and the other that felt PF130 provided sufficient guidance on fund governance.
A number of respondents suggested PF130 should be amended to take into account the relevant aspects of King III not already covered in PF130.
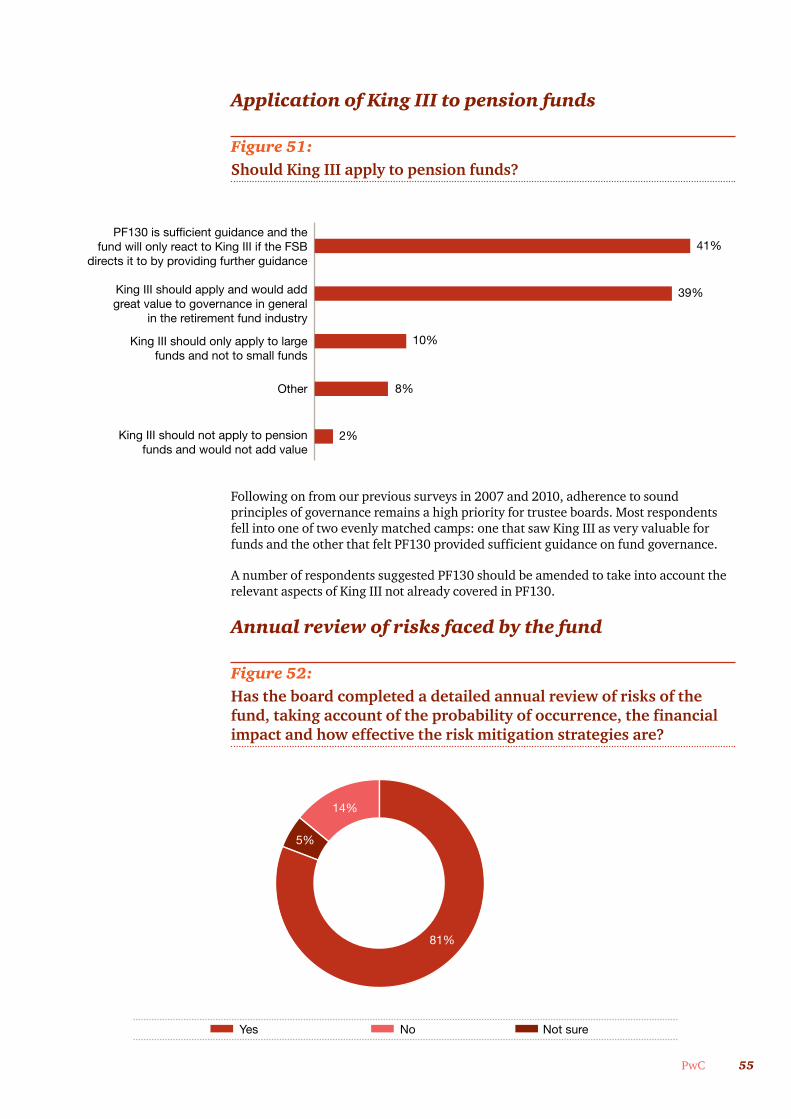
Annual review of risks faced by the fund
Figure 52:Has the board completed a detailed annual review of risks of the fund, taking account of the probability of occurrence, the financialimpact and how effective the risk mitigation strategies are?
Figure 52: Should King III apply to pension funds?
King III should not apply to pensionfunds and would not add value
Other
King III should only apply to largefunds and not to small funds
King III should apply and would addgreat value to governance in general
in the retirement fund industry
PF130 is sufficient guidance and thefund will only react to King III if the FSB
directs it to by providing further guidance41%
39%
10%
8%
2%
Figure 53: Has the board completed a detailed annual review of risks of the fund, taking account of the probability of occurrance, the financial impact and how effective the risk mitigation strategies are?
Yes Not sure
81%
5%
14%
No
56 Retirement fund strategic matters and remuneration survey
It was positive to note that 81% of respondents had completed a detailed annual review of the risks faced by the fund in compliance with PF130.
The risk reviews performed by funds had considered the key elements set out in PF130 of the probability of event occurring, the financial impact and how effective the risk management strategies of the fund are.
This represents a slight improvement on the responses to a similar question in our 2007 survey where 75% of funds had proper risk assessment in place.
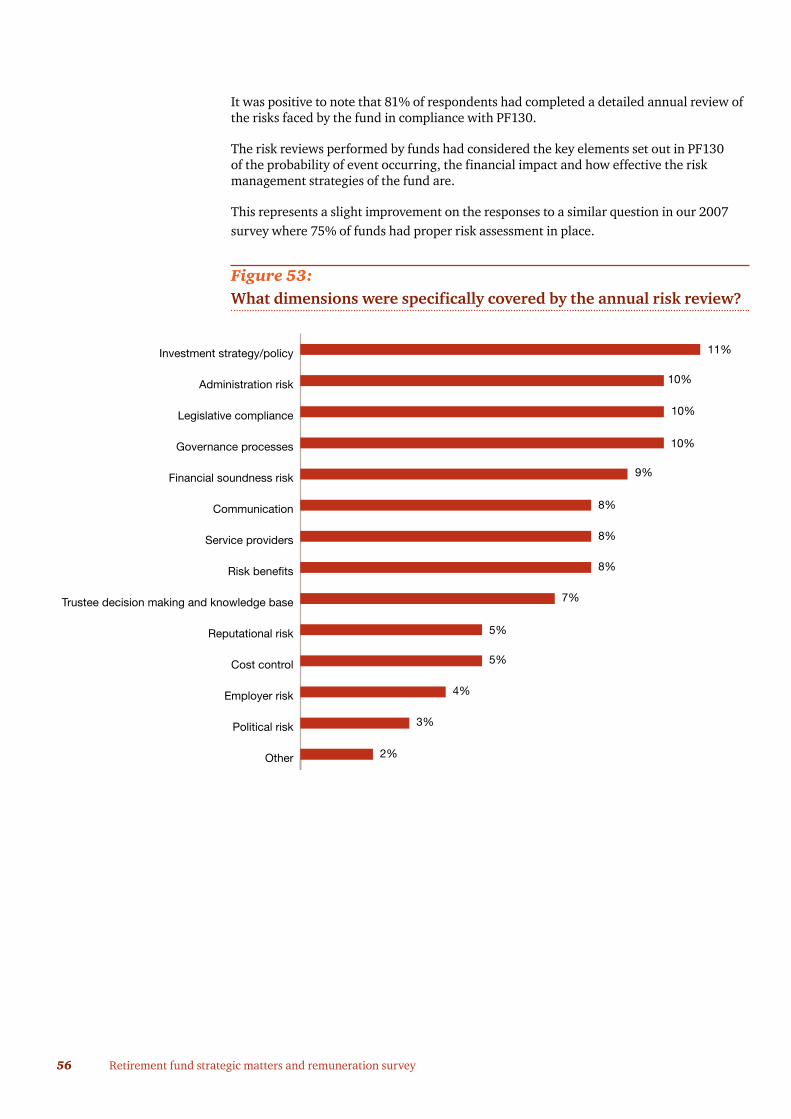
Figure 53:What dimensions were specifically covered by the annual risk review?
Figure 54: What dimensions were specifically covered by the annual risk review?
11%
10%
10%
9%
10%
8%
8%
Other
Political risk
Employer risk
Cost control
Reputational risk
Trustee decision making and knowledge base
Risk benefits
Service providers
Communication
Financial soundness risk
Governance processes
Legislative compliance
Administration risk
Investment strategy/policy
5%
2%
8%
7%
5%
4%
3%

57PwC
Top investment risks for the fund
Figure 54:Which investment risks to the fund are identified or perceived by theboard?
We note that more complex aspects such as offshore investments, unlisted investments and hedge funds were not rated as a significant risk. In those funds that have them, we would hope that this is not due to a lack of understanding.
Figure 55: Which investment risks to the fund are identified or perceived by the board?
29%
19%
12%
14%
2%
8%
6%
7%
3%
7%3%
Opacity of investments in hedge fundsor lack of effective due diligence on
hedge fund managers or lack of effectivemonitoring of hedge fund performance
Confirmation of existence and fair valuesof unlisted investments may be unreliable
Opacity of investments inoffshore funds or lack of effective
due diligence on overseas investmentmanagers or lack of effective monitoring
of overseas investment performance
Reliability of investment certificates forinsurance policies and pooled
funds in the absence of anyeffective audit framework for reporting
on the controls over those systems
Other
Investments do not properly match the relevantliabilities or the monitoring of proper
asset liability matching is not effective?
Lack of adequate monitoring of investmentperformance on a risk adjusted basis
An investment manager incursa large loss for the fund because
of internal failure or very poor strategy
Investment portfolios underperformperformance targets and members
end up with poor retirement benefits
58 Retirement fund strategic matters and remuneration survey
Other risks for the fund
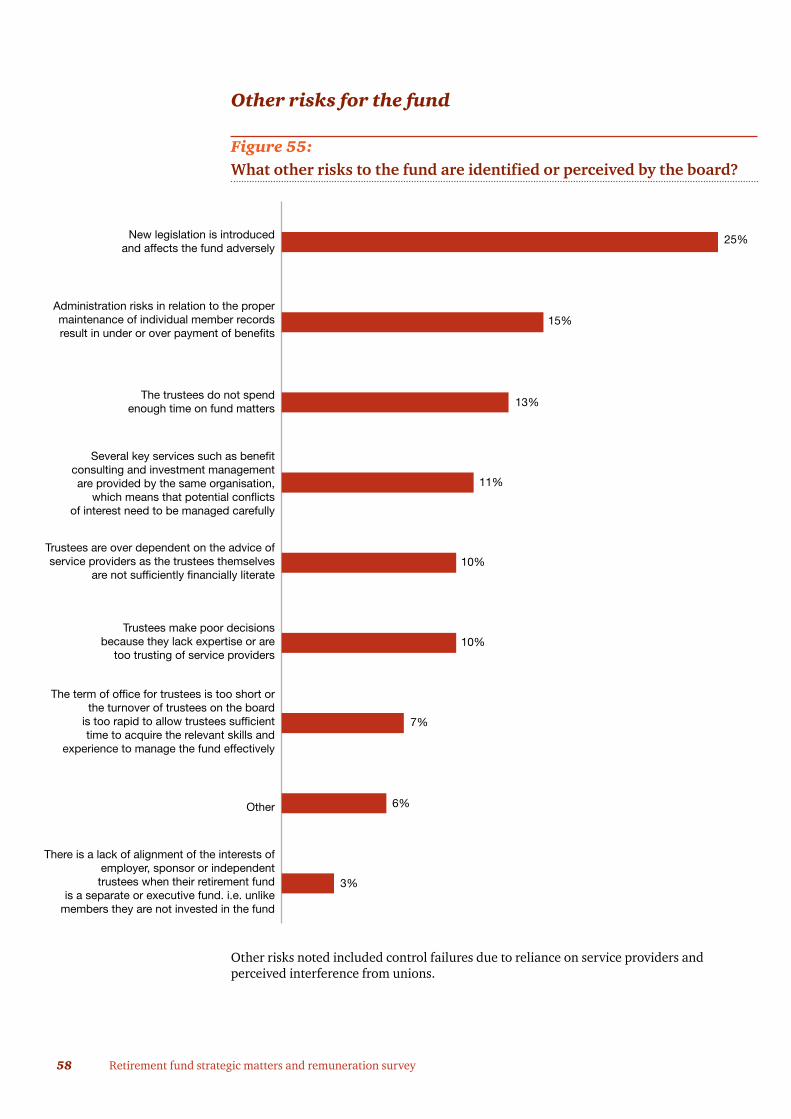
Figure 55:What other risks to the fund are identified or perceived by the board?
Other risks noted included control failures due to reliance on service providers and perceived interference from unions.
Figure 56: What other risks to the fund are identified or perceived by the board?
25%
15%
11%
13%
3%
10%
7%
7%
6%
10%3%
There is a lack of alignment of the interests ofemployer, sponsor or independenttrustees when their retirement fund
is a separate or executive fund. i.e. unlikemembers they are not invested in the fund
Other
The term of office for trustees is too short orthe turnover of trustees on the board
is too rapid to allow trustees sufficienttime to acquire the relevant skills and
experience to manage the fund effectively
Trustees make poor decisionsbecause they lack expertise or are
too trusting of service providers
Trustees are over dependent on the advice ofservice providers as the trustees themselves
are not sufficiently financially literate
Several key services such as benefitconsulting and investment managementare provided by the same organisation,
which means that potential conflictsof interest need to be managed carefully
The trustees do not spendenough time on fund matters
Administration risks in relation to the propermaintenance of individual member recordsresult in under or over payment of benefits
New legislation is introducedand affects the fund adversely
59PwC
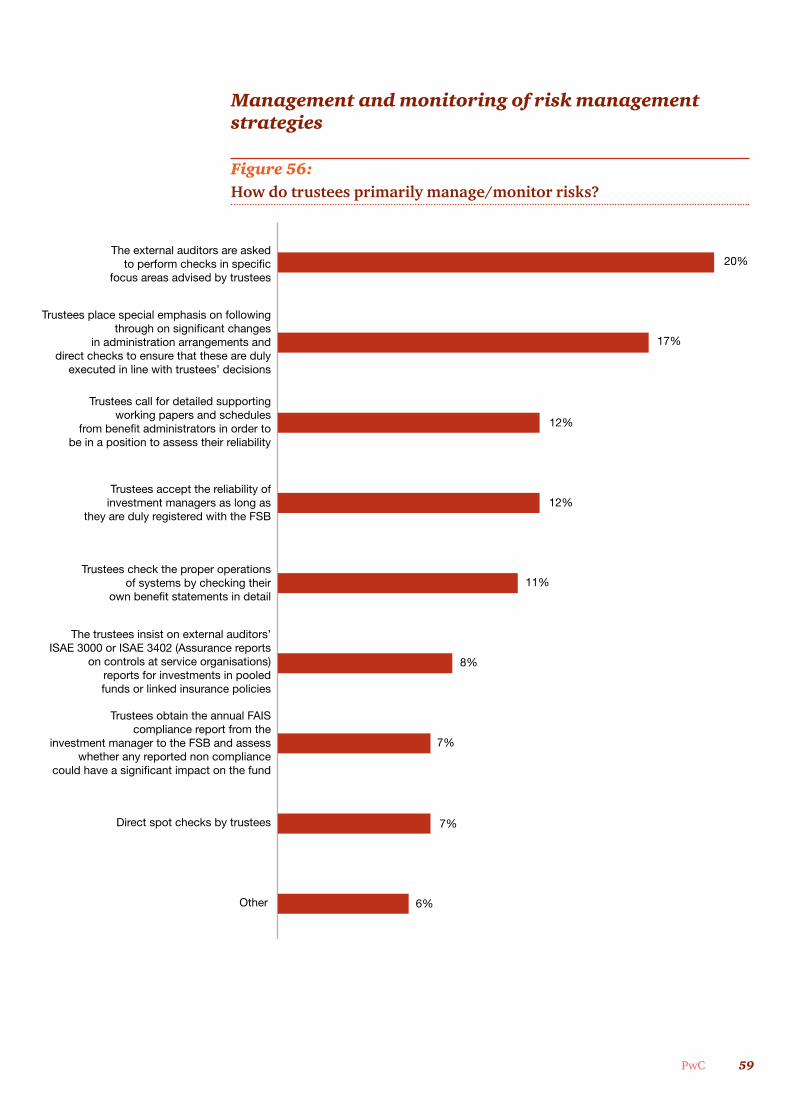
Management and monitoring of risk management strategies
Figure 56:How do trustees primarily manage/monitor risks?
Figure 57: How do the trustees primarily manage / monitor these risks?
20%
17%
12%
12%
6%
11%
7%
7%
8%
Other
Direct spot checks by trustees
Trustees obtain the annual FAIScompliance report from the
investment manager to the FSB and assesswhether any reported non compliance
could have a significant impact on the fund
The trustees insist on external auditors’ISAE 3000 or ISAE 3402 (Assurance reports
on controls at service organisations)reports for investments in pooledfunds or linked insurance policies
Trustees check the proper operationsof systems by checking their
own benefit statements in detail
Trustees accept the reliability ofinvestment managers as long as
they are duly registered with the FSB
Trustees call for detailed supportingworking papers and schedules
from benefit administrators in order tobe in a position to assess their reliability
Trustees place special emphasis on followingthrough on significant changes
in administration arrangements anddirect checks to ensure that these are duly
executed in line with trustees’ decisions
The external auditors are askedto perform checks in specific
focus areas advised by trustees
60 Retirement fund strategic matters and remuneration survey
Over and above the findings shown in Figure 55, the following are some of the other views expressed by respondents in relation to the \ regulatory environment and/or risk management:
• The Regulator should consider prescribing minimum levels of competence and educational training before a person can fulfil the role of a trustee;
• Consideration should be given to the regulation of maximum limits in respect of administration fees for funds to ensure that more money can be invested on behalf of members;
• Uncertainties created by a constantly changing regulatory environment make it difficult for funds to ensure compliance and develop appropriate operational and investment strategies;
• The ‘one-size-fits-all’ approach to regulation does not always address the practical challenges of different types of funds and or different fund sizes; and
• The gradual move from rules-based to more principle-based regulation is seen as a step in the right direction.
Regulation is perceived not only as a safeguard, but also as a threat.

Appendices
61PwC
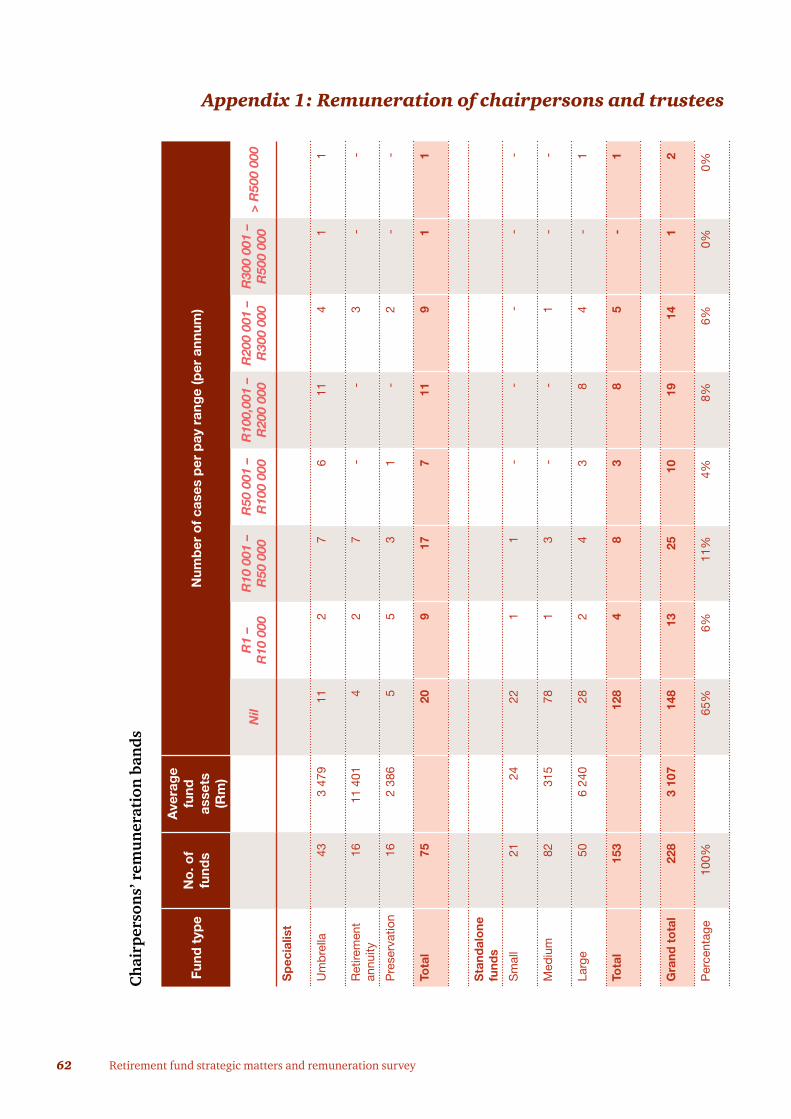
62 Retirement fund strategic matters and remuneration survey
Appendix 1: Remuneration of chairpersons and trustees
Cha
irpe
rson
s’ r
emun
erat
ion
band
s
Fund
typ
eN
o. o
f fu
nds
Ave
rag
e fu
nd
asse
ts
(Rm
)
Num
ber
of
case
s p
er p
ay r
ang
e (p
er a
nnum
)
Nil
R1
– R
10 0
00R
10 0
01 –
R50
000
R50
001
–
R10
0 00
0R
100,
001
– R
200
000
R20
0 00
1 –
R30
0 00
0R
300
001
– R
500
000
> R
500
000
Sp
ecia
list
Um
bre
lla43
3 47
911
27
611
41
1
Ret
irem
ent
annu
ity16
11 4
014
27
--
3-
-
Pre
serv
atio
n16
2 38
65
53
1-
2-
-
Tota
l 75
209
177
119
11
Sta
ndal
one
fu
nds
Sm
all
2124
221
1-
--
--
Med
ium
8231
578
13
--
1-
-
Larg
e50
6 24
028
24
38
4-
1
Tota
l15
312
84
83
85
-1
Gra
nd t
ota
l22
83
107
148
1325
1019
141
2
Per
cent
age
100%
65%
6%11
%4%
8%6%
0%0%
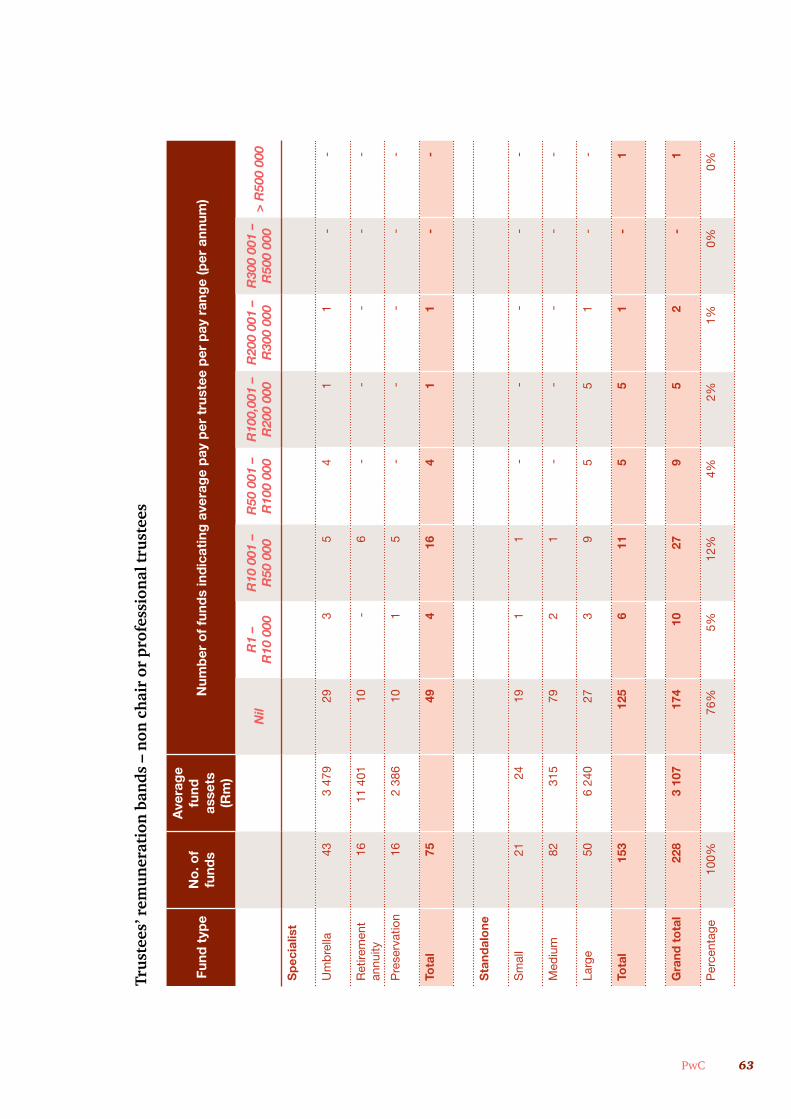
63PwC
Trus
tees
’ rem
uner
atio
n ba
nds
– no
n ch
air
or p
rofe
ssio
nal t
rust
ees
Fund
typ
eN
o. o
f fu
nds
Ave
rag
e fu
nd
asse
ts
(Rm
)
Num
ber
of
fund
s in
dic
atin
g a
vera
ge
pay
per
tru
stee
per
pay
ran
ge
(per
ann
um)
Nil
R1
– R
10 0
00R
10 0
01 –
R50
000
R50
001
–
R10
0 00
0R
100,
001
– R
200
000
R20
0 00
1 –
R30
0 00
0R
300
001
– R
500
000
> R
500
000
Sp
ecia
list
Um
bre
lla43
3 47
929
35
41
1-
-
Ret
irem
ent
annu
ity16
11 4
0110
-6
--
--
-
Pre
serv
atio
n16
2 38
610
15
--
--
-
Tota
l 75
494
164
11
--
Sta
ndal
one
Sm
all
2124
191
1-
--
--
Med
ium
8231
579
21
--
--
-
Larg
e50
6 24
027
39
55
1-
-
Tota
l15
312
56
115
51
-1
Gra
nd t
ota
l22
83
107
174
1027
95
2-
1
Per
cent
age
100%
76%
5%12
%4%
2%1%
0%0%
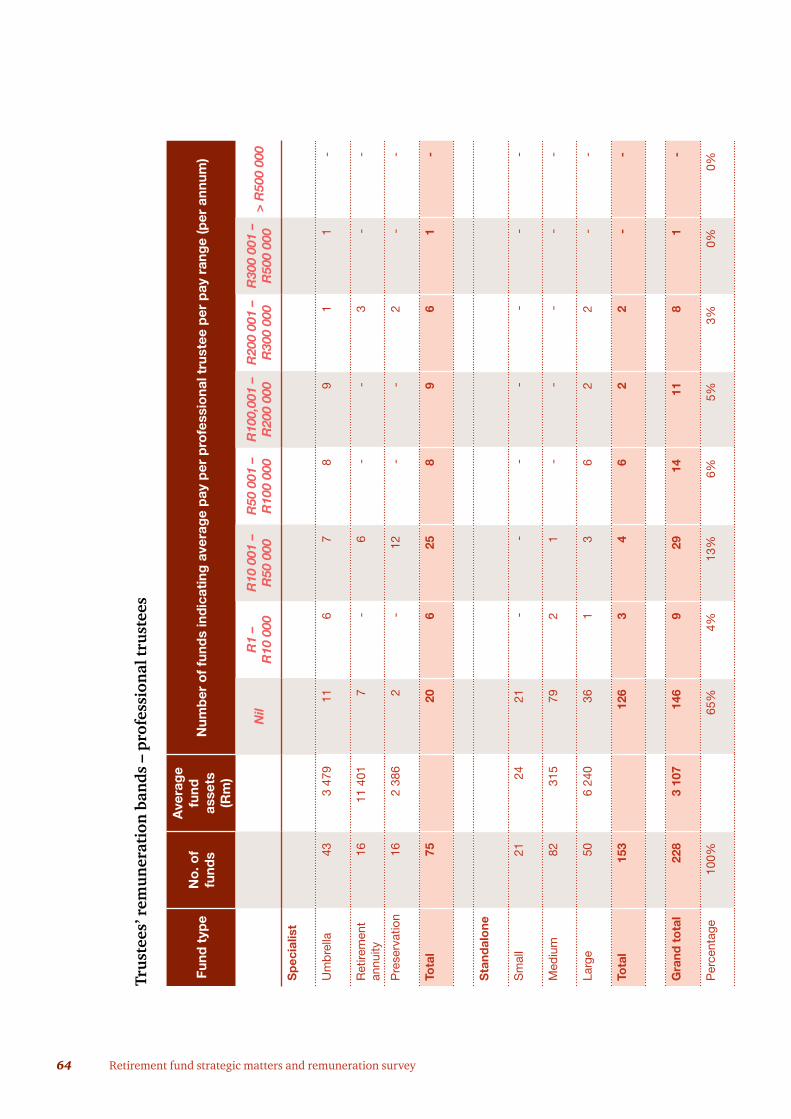
64 Retirement fund strategic matters and remuneration survey
Trus
tees
’ rem
uner
atio
n ba
nds
– pr
ofes
sion
al tr
uste
es
Fund
typ
eN
o. o
f fu
nds
Ave
rag
e fu
nd
asse
ts
(Rm
)
Num
ber
of
fund
s in
dic
atin
g a
vera
ge
pay
per
pro
fess
iona
l tru
stee
per
pay
ran
ge
(per
ann
um)
Nil
R1
– R
10 0
00R
10 0
01 –
R50
000
R50
001
–
R10
0 00
0R
100,
001
– R
200
000
R20
0 00
1 –
R30
0 00
0R
300
001
– R
500
000
> R
500
000
Sp
ecia
list
Um
bre
lla43
3 47
911
67
89
11
-
Ret
irem
ent
annu
ity16
11 4
017
-6
--
3-
-
Pre
serv
atio
n16
2 38
62
-12
--
2-
-
Tota
l 75
206
258
96
1-
Sta
ndal
one
Sm
all
2124
21-
--
--
--
Med
ium
8231
579
21
--
--
-
Larg
e50
6 24
036
13
62
2-
-
Tota
l15
312
63
46
22
--
Gra
nd t
ota
l22
83
107
146
929
1411
81
-
Per
cent
age
100%
65%
4%13
%6%
5%3%
0%0%
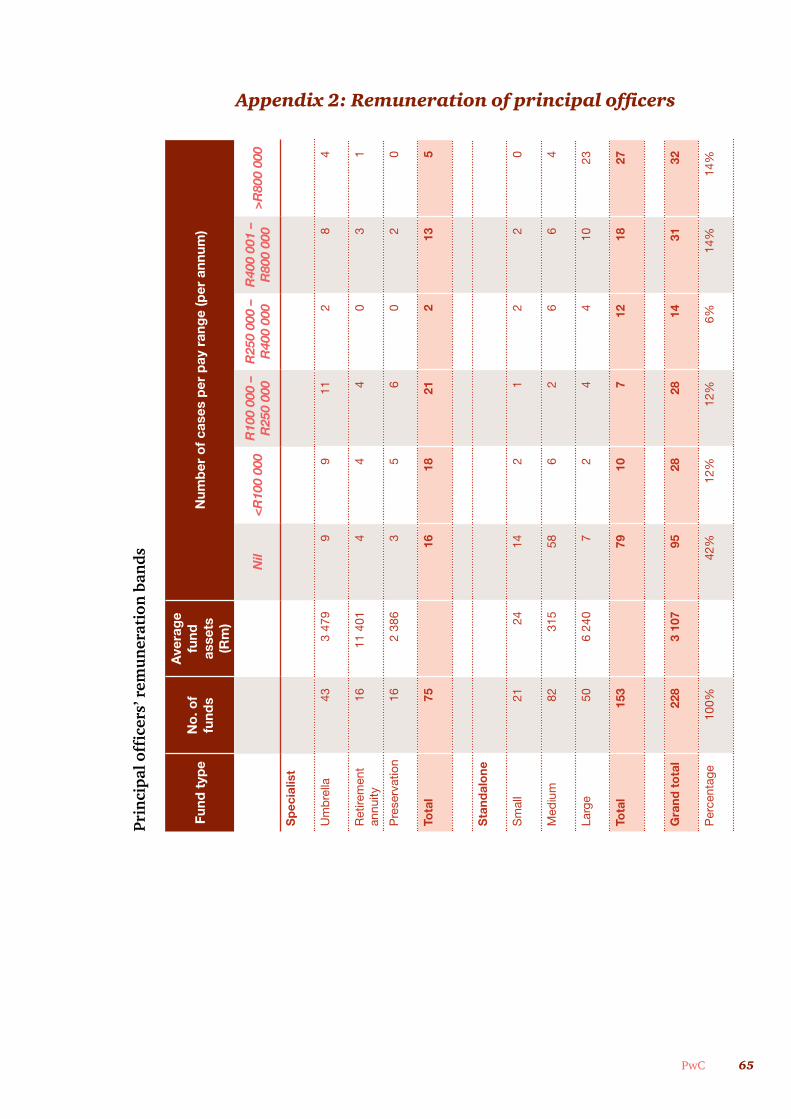
65PwC
Appendix 2: Remuneration of principal officers
Prin
cipa
l off
icer
s’ r
emun
erat
ion
band
s
Fund
typ
eN
o. o
f fu
nds
Ave
rag
e fu
nd
asse
ts
(Rm
)
Num
ber
of
case
s p
er p
ay r
ang
e (p
er a
nnum
)
Nil
<R
100
000
R10
0 00
0 –
R25
0 00
0R
250
000
– R
400
000
R40
0 00
1 –
R80
0 00
0>
R80
0 00
0
Sp
ecia
list
Um
bre
lla43
3 47
99
911
28
4
Ret
irem
ent
annu
ity16
11 4
014
44
03
1
Pre
serv
atio
n16
2 38
63
56
02
0
Tota
l 75
1618
212
135
Sta
ndal
one
Sm
all
2124
142
12
20
Med
ium
8231
558
62
66
4
Larg
e50
6 24
07
24
410
23
Tota
l15
379
107
1218
27
Gra
nd t
ota
l22
83
107
9528
2814
3132
Per
cent
age
100%
42%
12%
12%
6%14
%14
%
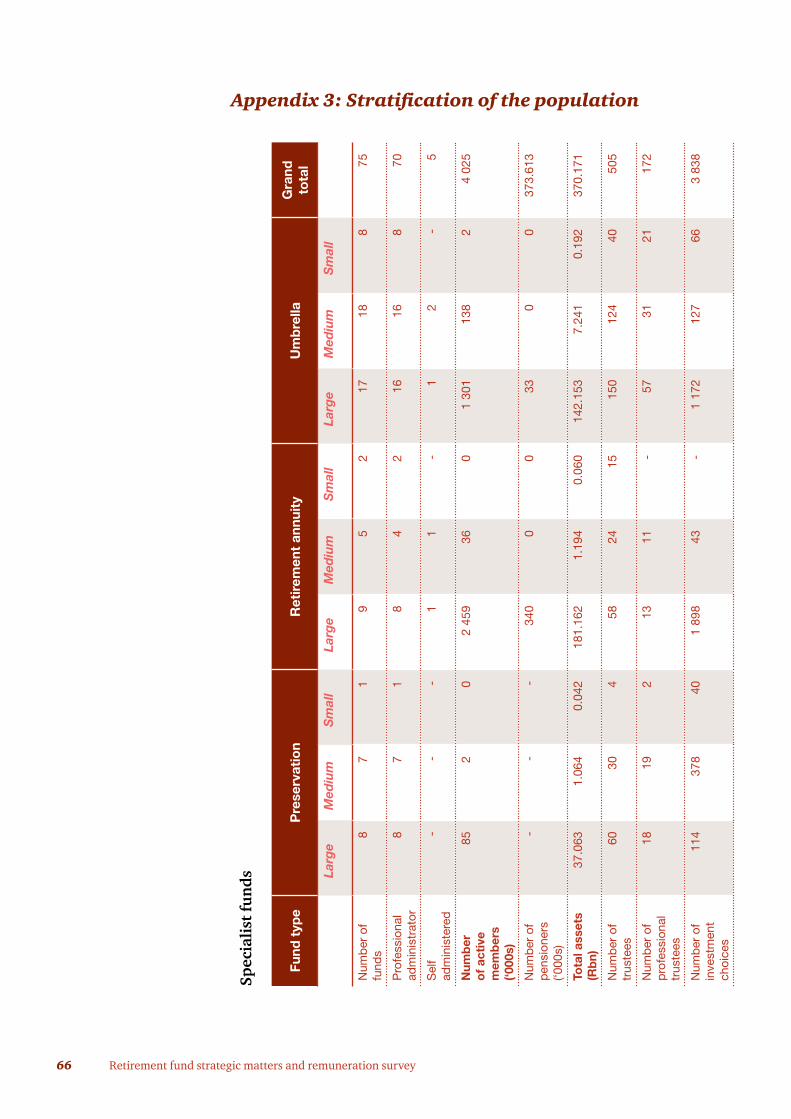
66 Retirement fund strategic matters and remuneration survey
Appendix 3: Stratification of the population
Spec
iali
st fu
nds
Fund
typ
eP
rese
rvat
ion
Ret
irem
ent
annu
ity
Um
bre
llaG
rand
to
tal
Larg
eM
ediu
mS
mal
lLa
rge
Med
ium
Sm
all
Larg
eM
ediu
mS
mal
l
Num
ber
of
fund
s8
71
95
217
188
75
Pro
fess
iona
l ad
min
istr
ator
87
18
42
1616
870
Sel
f ad
min
iste
red
--
-1
1-
12
-5
Num
ber
o
f ac
tive
m
emb
ers
(‘000
s)
852
02
459
360
1 30
113
82
4 02
5
Num
ber
of
pen
sion
ers
(‘000
s)
--
-34
00
033
00
373.
613
Tota
l ass
ets
(Rb
n)37
.063
1.06
40.
042
181.
162
1.19
40.
060
142.
153
7.24
10.
192
370.
171
Num
ber
of
trus
tees
6030
458
2415
150
124
4050
5
Num
ber
of
pro
fess
iona
l tr
uste
es
1819
213
11-
5731
2117
2
Num
ber
of
inve
stm
ent
choi
ces
114
378
401
898
43-
1 17
212
766
3 83
8
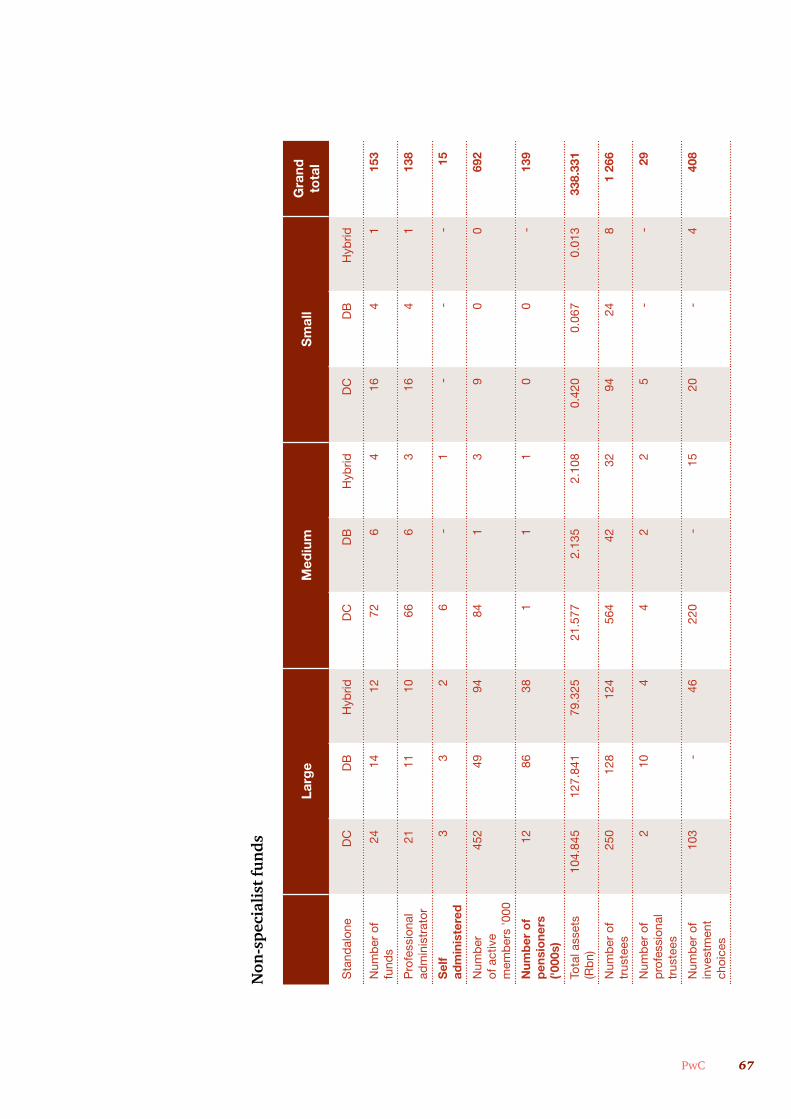
67PwC
Non
-spe
cial
ist f
unds
Larg
eM
ediu
mS
mal
lG
rand
to
tal
Sta
ndal
one
DC
DB
Hyb
ridD
CD
BH
ybrid
DC
DB
Hyb
rid
Num
ber
of
fund
s24
1412
726
416
41
153
Pro
fess
iona
l ad
min
istr
ator
2111
1066
63
164
113
8
Sel
f ad
min
iste
red
33
26
-1
--
-15
Num
ber
of
act
ive
mem
ber
s '0
00
452
4994
841
39
00
692
Num
ber
of
pen
sio
ners
('0
00s)
1286
381
11
00
-13
9
Tota
l ass
ets
(Rb
n)10
4.84
512
7.84
179
.325
21.5
772.
135
2.10
80.
420
0.06
70.
013
338.
331
Num
ber
of
trus
tees
250
128
124
564
4232
9424
81
266
Num
ber
of
pro
fess
iona
l tr
uste
es
210
44
22
5-
-29
Num
ber
of
inve
stm
ent
choi
ces
103
-46
220
-15
20-
440
8
68 Retirement fund strategic matters and remuneration survey
Appendix 4: Summary findings of the PwC’s 2012 UK Pension Scheme Governance Survey
UK Pension Scheme Governance Survey: The Trustee Perspective
Over 80 representatives from a variety of large pension schemes participated in our latest biennial survey, which reveals a unique in-depth picture of schemes today and the challenges facing trustees.
The pace of change and pressure on trustees and their boards over the past two years has been relentless. Not only have they been forced to deal with the continuing challenges of the global economic downturn, but changes in government, pensions strategy and tax legislation have each had an impact on the time trustees have to spend managing their schemes.
Our survey has revealed many areas where trustees have shown a real improvement in their governance over the past two years, such as the quality of their interactions with scheme sponsors and knowledge of alternative investment products. These improvements have led to many trustees feeling they have the best available package of contributions, security and investment.
The coming year will see fresh challenges for trustees as employers deal with issues such as auto-enrolment, increasingly volatile balance sheet positions and the drive to reduce costs. We expect defined contribution arrangements to increase and look with interest to see how trustees face the new challenges awaiting them.
However, significant challenges remain, not least, the quantum of information trustees have to wrestle with and the limited time they have to do so. Trustees are also grappling with how to communicate effectively with members to improve engagement without significantly increasing costs.
Small steps can make a big difference to the quality of scheme governance – the survey highlights six key areas where trustees can, with small steps, make significant improvements.
Data overload, information scarcity
While trustees are meeting more frequently than ever before, there continue to be significant challenges with the amount of information trustees are given to assimilate in advance of meetings. Many trustees use subcommittees to help control their workloads, although they note varying levels of success with this approach. There has been a significant improvement in trustees’ interactions with employers where they are robust at challenging their sponsors’ views.
Despite the ongoing focus from the Pensions Regulator, over a third of trustees are not regularly assessing their own knowledge and understanding, and actively seeking to address gaps.
69PwC
Communicating with members
While 40%of trustees have planned regular communications and communicate major items of pensions news as they arise, over two-thirds are communicating with members without having put a proper communication strategy in place. Feedback is rarely proactively sought from members and is dealt with on an ad-hoc basis.
Significantly, only 22% of trustees for defined contribution arrangements felt they gave members sufficient information to make an informed investment choice. A number of respondents commented that they felt that despite significant investment in communications, they were battling against member apathy.
Risk awareness – are trustees doing enough?
Risk management has clearly moved up trustees’ agendas but half of respondents felt that risk management was not the primary driver of their meetings. For example, over a quarter of trustees have not specifically considered custody risk within their schemes. We find this surprising given the publicised issues as a result of the collapse of Lehman Brothers and MF Global, and the FSA’s focus at a corporate level in this area.
Compliance is increasingly being achieved with a tick-box attitude, which may reflect the underlying trend in the UK to move to a more litigious society. Interestingly, however, there is still significant variance among trustees in assessing their compliance with the Regulator’s Codes of Practice.
Investments: Agility versus short-termism
Very few trustees received real-time information on their investment performance. However, the real question is whether there is a case for receiving this information if structures are not in place to utilise the information received with swift investment responses.
Ten percent of schemes surveyed have turned to fiduciary managers in an effort to improve the speed of response to emerging market conditions. Time will tell whether this approach will actually deliver on its promise of better performance with minimised downside risk.
Key to any investment approach (traditional or fiduciary management) is the regular assessment of the performance of, and the control environment in place, at fund managers. Trustees may delegate the task, but not the ultimate responsibility for their scheme’s investments.
Data: Cleaning up the mess
Clearly, trustees have spent a considerable amount of time over the past couple of years focusing on scheme data given the Pension Regulator’s specific interest in this area. Somewhat surprisingly, 63% of trustees said that they had assessed not only the completeness of data, but also data quality and had made progress to rectify deficiencies identified.
Should the full results of this survey be of particular interest to you, please let us know and we shall gladly arrange to share them with you.

70 Retirement fund strategic matters and remuneration survey
PwC’s retirement fund-specific services
71PwC
PwC’s retirement fund-specific services
The expertise and experience of our people assures clients peace of mind
• We provide industry-focused services to retirement funds and their employers worldwide. We operate in 151 countries through 163 000 people.
• Established in South Africa in 1923, we employ 4 400 people in 21 offices with retirement fund experts in all major centres.
• Our retirement fund audit division is managed by and operates with individuals who make retirement funds their careers and have hands-on involvement on a daily basis.
• We are also statutory auditors and professional advisors to other key players in the industry such as investment/hedge fund managers, asset consultants and retirement fund administrators.
• Using our actuarial, financial, investment and risk management expertise, we provide holistic solutions that enhance stakeholder value, improve employee relations, reduce risk and meet executive needs.
Actuarial services
• Identifying fund risks, assessing fund risk appetite and risk mitigation/risk transfer strategies;• Benefit design and implementation of cost-effective packages that are seen as valuable by
employees;• Checking of complex benefit calculations, such as when part of a defined benefit is commuted
for cash;• Independent assessment of assumptions and methodology in fund actuarial valuations;• Financial reporting on IAS 19 and IFRS 2 valuations;• Merger/acquisition support on risks linked to benefit arrangements, BEE trusts and share
option plans; and• Independent valuation of structured products or derivative overlay structures to hedge market
risk.
Assurance and accounting services
• Statutory audits;• Accounting, regulatory and governance advice;• Detailed checking of the roll up of individual member records;• Checking on completeness and accuracy of migration of member data to a new administration
platform;• Reports to the Registrar of Pension Funds in terms of Section 15 of the Pension Funds Act; and• Valuations of unlisted investments, such as those held to meet socially responsible investment
objectives.
Advisory services
• Forensic investigations, including data mining techniques applied to detect invalid benefit payments;
• Information systems and process assurance;• Trustee and administrator training on retirement fund accounting and governance; and• Strategy development including IT strategy.
Tax services
Although retirement funds do not incur income tax or dividends tax, they are affected by input VAT and there may be scope to ensure that the impact of this cost is not in excess of what is required.

Contacts
PwC72 Trustee Remuneration and Governance Survey

73PwC
Contacts
Tom Winterboer
Financial Services Leader Southern Africa and Africa +27 11 797 5407 [email protected]
Gert Kapp
National Retirement Fund Leader +27 11 797 4425 [email protected]
Verwey Wiese
Western Cape Retirement Fund Leader +27 21 529 2352 [email protected]
Sakhile Masuku
Director +27 11 797 4055 [email protected]
Johannes Grové
Director +27 11 797 4044 [email protected]
Richard Morris
Associate Director +27 21 529 2285 [email protected]
Julanie Basson
Associate Director +27 11 797 5391 [email protected]
Bryan Ingram
Associate Director +27 11 797 5730 [email protected]

© 2012 PricewaterhouseCoopers (“PwC”), the South African firm. All rights reserved. In this document, “PwC” refers to PricewaterhouseCoopers in South Africa, which is a member firm of PricewaterhouseCoopers International Limited (PwCIL), each member firm of which is a separate legal entity and does not act as an agent of PwCIL. (12-11003)