tobacco use among american indian youth … · tobacco use among american indian youth in ......
TRANSCRIPT
JUNE 2017
TOBACCO USE AMONG AMERICAN INDIAN YOUTH IN NEW MEXICO
RESULTS OF THE 2015 NEW MEXICO YOUTH RISK & RESILIENCY SURVEY
RECOMMENDED CITATION: Burleigh I, English K, Espinoza J. Tobacco Use among American Indian Youth in New Mexico: Findings from the 2015 New Mexico Youth Risk and Resiliency Survey (NM YRRS), June 2017.
ACKNOWLEDGEMENTS: The New Mexico Youth Risk and Resiliency Survey (YRRS) is a collaborative project of the New Mexico Department of Health (NMDOH) and the New Mexico Public Education Department (PED) with support and technical assistance from the University of New Mexico Prevention Research Center (UNM PRC), the Albuquerque Area Southwest Tribal Epidemiology Center (AASTEC), and the Division of Adolescent and School Health at the Centers for Disease Control and Prevention (CDC-DASH).
FOR ADDITIONAL INFORMATION CONTACT: Kevin English–Director Albuquerque Area Southwest Tribal Epidemiology Center 5015 Prospect Ave NE Albuquerque, NM 87110 P: 505-962-2602 or (800) 658-6717 [email protected]
1

TABLE OF CONTENTS
EXECUTIVE SUMMARY 3
MIDDLE SCHOOL DATA TABLES 5
Use of Any Tobacco Table 1.1 Current use of any tobacco 5
Ever Smoked Table 2.1 Ever smoked cigarettes 5 Table 2.2 Ever smoked cigarettes before 11 years of age 6
Current Smokers Table 3.1 Current cigarette smoker 6 Table 3.2 Daily cigarette use 7 Table 3.3 Current use of electronic vapor products 7 Table 3.4 Cigar use 8 Table 3.5 Use of spit tobacco 8 Table 3.6 Tried to quit smoking in the past 12 months 9 Table 3.7 Flavored tobacco product use among current smokers 9 Secondhand Smoke Table 4.1 At home with someone who was smoking cigarettes 10
Attitudes and Beliefs about Smoking Table 5.1 Will try smoking in the next year 10 Table 5.2 Would smoke a cigarette if best friend offered 11
HIGH SCHOOL DATA TABALES 12
Use of Any Tobacco Table 6.1 Current use of any tobacco product 12 Ever Smoked Table 7.1 Ever smoked cigarettes 12 Table 7.2 Smoked whole cigarette before 13 years of age 13
Current Smokers Table 8.1 Current cigarette smoker 13 Table 8.2 Daily cigarette Use 14 Table 8.3 Heavy cigarette smoking among current smokers 14 Table 8.4 Ever used an electronic vapor product 15 Table 8.5 Current electronic vapor product use 15 Table 8.6 Flavored tobacco product ues among current smokers 16 Table 8.7 Current use of spit tobacco 16 Table 8.8 Current use of cigar/cigarillo 17 Table 8.9 Current hookah use for tobacco 17 Table 8.10 Tried to quit smoking 18
Secondhand Smoke Table 9.1 In the same room with someone who was smoking cigarettes 18 Table 9.2 In the same home with someone who was smoking 19
2
EXECUTIVE SUMMARY
PURPOSE
This report focuses on tobacco-related risk behaviors among middle and high
school American Indian (AI) youth in New Mexico. The data comes from the
2015 New Mexico Youth Risk and Resiliency Survey (NM YRRS). The purpose of
the NM YRRS is to obtain insight into risk behaviors and protective (resiliency)
factors for both middle and high school students. This statewide survey included
23,941 high school and middle school students. Among students surveyed,
4,795 identified themselves as American Indian.
METHODS
The 2015 NM YRRS was administered in middle and high schools within the New
Mexico public school system and the Bureau of Indian Education. A
representative sample of students was selected using a weighted protocol
developed by the Centers for Disease Control and Prevention. Additional details
on this methodology are accessible at www.YouthRisk.org.
The tables in this report are organized into two sections – middle school and high
school students. In each section, estimates of self-reported tobacco-related
behaviors are compared between American Indians in New Mexico (AI-NM) and
the New Mexico (NM) statewide population. Findings are further stratified by
gender and grade level. It is important to note, that the NM YRRS survey
instrument does not distinguish between commercial and ceremonial uses of
tobacco. Use of e-cigarettes was measured for the first time in 2015 for both
middle and high school students.
3
KEY FINDINGS
Several key tobacco-related findings and trends emerged in this analysis among
American Indian students in New Mexico, including:
Middle School
American Indian middle school students reported a higher prevalence ofsmoking cigarettes during the past 30 days compared to the all-race NMmiddle school student population, 7.7% and 4.5%, respectively.
American Indian middle students reported a higher prevalence of eversmoking cigarettes compared to all NM middle school students, 23.6% and16.3% respectively.
Approximately 1 in 8 American Indian middle school students (13.1%) usedan electronic vapor product, such as an e-cigarette, during the past 30 days.
Almost 3/4 of American Indian middle school students who currently smoke,tried to quit during the past year (72.4%).
High School
More than 1 in 3 American Indian high school students (35.9%) currentlyused at least one type of tobacco product (cigarettes, electronic vaporproduct, hookah, cigars, or spit tobacco) in the past 30 days.
The most commonly used tobacco product among American Indian highschool students was electronic vapor products (22.3%), followed bycigarettes (15.9%) and hookah (15.1%).
American Indian male high school students were approximately three timesmore likely to currently use chewing/spit tobacco than American Indianfemale students (14.0% vs. 5.1%), and about two times more likely to usecigars or cigarillos (15.2% vs. 8.4%).
About one-quarter of American Indian high school students (26.0%) were inthe same room with someone who was smoking cigarettes in the past 7 days,increasing their exposure to second-hand smoke.
More than half of American Indian high school students who currently smoke(57.8%), tried to quit in the past 12 months. Assisting youth in successfullyquitting commercial tobacco use may therefore be an important publichealth intervention.
4
TOBACCO USE - ANY PRODUCT
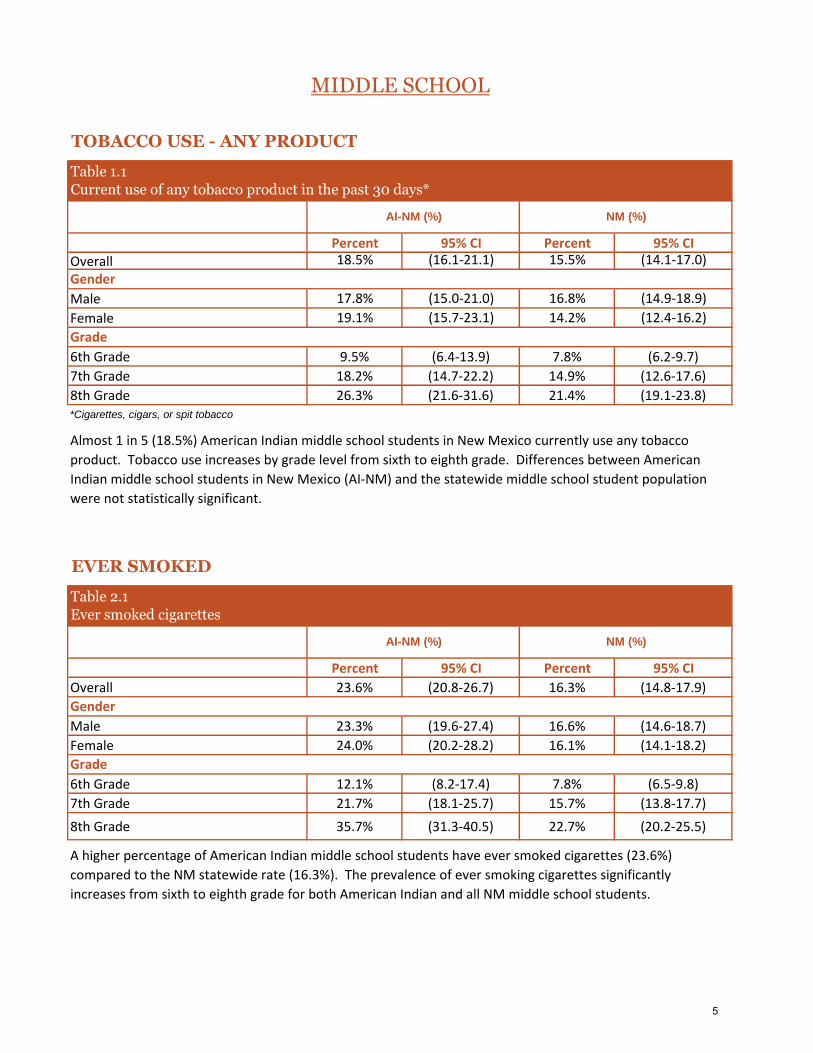
Percent 95% CI Percent 95% CIOverall 18.5% (16.1-21.1) 15.5% (14.1-17.0)
Male 17.8% (15.0-21.0) 16.8% (14.9-18.9)
Female 19.1% (15.7-23.1) 14.2% (12.4-16.2)
6th Grade 9.5% (6.4-13.9) 7.8% (6.2-9.7)
7th Grade 18.2% (14.7-22.2) 14.9% (12.6-17.6)
8th Grade 26.3% (21.6-31.6) 21.4% (19.1-23.8)*Cigarettes, cigars, or spit tobacco
EVER SMOKED
Percent 95% CI Percent 95% CI
Overall 23.6% (20.8-26.7) 16.3% (14.8-17.9)
Male 23.3% (19.6-27.4) 16.6% (14.6-18.7)
Female 24.0% (20.2-28.2) 16.1% (14.1-18.2)
6th Grade 12.1% (8.2-17.4) 7.8% (6.5-9.8)
7th Grade 21.7% (18.1-25.7) 15.7% (13.8-17.7)
8th Grade 35.7% (31.3-40.5) 22.7% (20.2-25.5)
A higher percentage of American Indian middle school students have ever smoked cigarettes (23.6%)
compared to the NM statewide rate (16.3%). The prevalence of ever smoking cigarettes significantly
increases from sixth to eighth grade for both American Indian and all NM middle school students.
Grade
MIDDLE SCHOOL
Table 1.1
Current use of any tobacco product in the past 30 days*
AI-NM (%) NM (%)
Gender
Grade
Almost 1 in 5 (18.5%) American Indian middle school students in New Mexico currently use any tobacco
product. Tobacco use increases by grade level from sixth to eighth grade. Differences between American
Indian middle school students in New Mexico (AI-NM) and the statewide middle school student population
were not statistically significant.
Table 2.1
Ever smoked cigarettes
AI-NM (%) NM (%)
Gender
5
Percent 95% CI Percent 95% CI
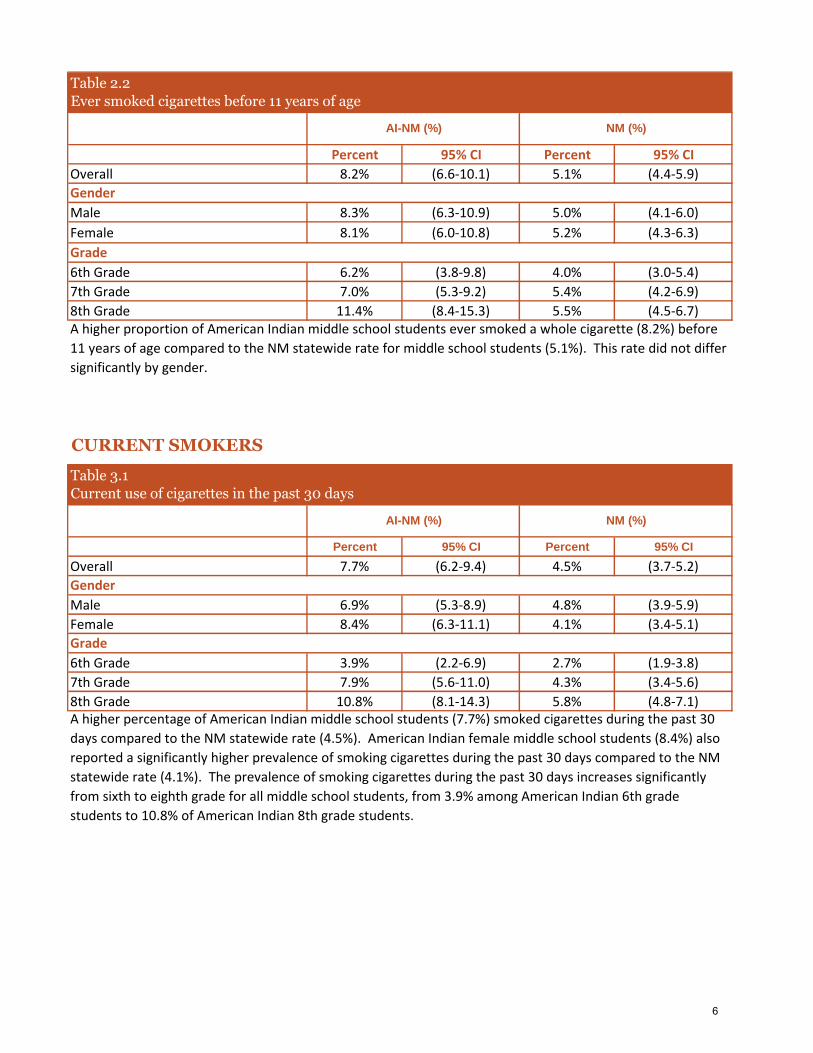
Overall 8.2% (6.6-10.1) 5.1% (4.4-5.9)
Male 8.3% (6.3-10.9) 5.0% (4.1-6.0)
Female 8.1% (6.0-10.8) 5.2% (4.3-6.3)
6th Grade 6.2% (3.8-9.8) 4.0% (3.0-5.4)
7th Grade 7.0% (5.3-9.2) 5.4% (4.2-6.9)
8th Grade 11.4% (8.4-15.3) 5.5% (4.5-6.7)
CURRENT SMOKERS
Percent 95% CI Percent 95% CI
Overall 7.7% (6.2-9.4) 4.5% (3.7-5.2)
Male 6.9% (5.3-8.9) 4.8% (3.9-5.9)
Female 8.4% (6.3-11.1) 4.1% (3.4-5.1)
6th Grade 3.9% (2.2-6.9) 2.7% (1.9-3.8)
7th Grade 7.9% (5.6-11.0) 4.3% (3.4-5.6)
8th Grade 10.8% (8.1-14.3) 5.8% (4.8-7.1)A higher percentage of American Indian middle school students (7.7%) smoked cigarettes during the past 30
days compared to the NM statewide rate (4.5%). American Indian female middle school students (8.4%) also
reported a significantly higher prevalence of smoking cigarettes during the past 30 days compared to the NM
statewide rate (4.1%). The prevalence of smoking cigarettes during the past 30 days increases significantly
from sixth to eighth grade for all middle school students, from 3.9% among American Indian 6th grade
students to 10.8% of American Indian 8th grade students.
Grade
Table 2.2
Ever smoked cigarettes before 11 years of age
AI-NM (%) NM (%)
Gender
Grade
A higher proportion of American Indian middle school students ever smoked a whole cigarette (8.2%) before
11 years of age compared to the NM statewide rate for middle school students (5.1%). This rate did not differ
significantly by gender.
Table 3.1
Current use of cigarettes in the past 30 days
AI-NM (%) NM (%)
Gender
6
Percent 95% CI Percent 95% CI
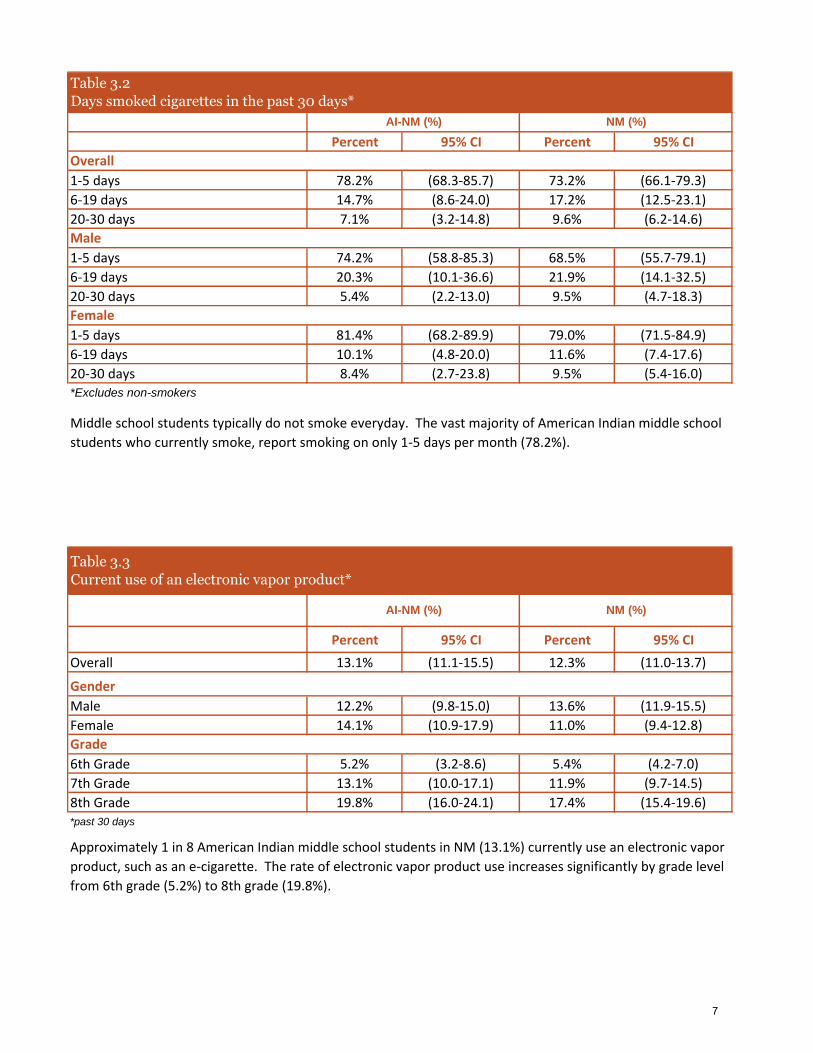
1-5 days 78.2% (68.3-85.7) 73.2% (66.1-79.3)
6-19 days 14.7% (8.6-24.0) 17.2% (12.5-23.1)
20-30 days 7.1% (3.2-14.8) 9.6% (6.2-14.6)
1-5 days 74.2% (58.8-85.3) 68.5% (55.7-79.1)
6-19 days 20.3% (10.1-36.6) 21.9% (14.1-32.5)
20-30 days 5.4% (2.2-13.0) 9.5% (4.7-18.3)
1-5 days 81.4% (68.2-89.9) 79.0% (71.5-84.9)
6-19 days 10.1% (4.8-20.0) 11.6% (7.4-17.6)
20-30 days 8.4% (2.7-23.8) 9.5% (5.4-16.0)*Excludes non-smokers
Percent 95% CI Percent 95% CI
Overall 13.1% (11.1-15.5) 12.3% (11.0-13.7)
Male 12.2% (9.8-15.0) 13.6% (11.9-15.5)
Female 14.1% (10.9-17.9) 11.0% (9.4-12.8)
6th Grade 5.2% (3.2-8.6) 5.4% (4.2-7.0)
7th Grade 13.1% (10.0-17.1) 11.9% (9.7-14.5)
8th Grade 19.8% (16.0-24.1) 17.4% (15.4-19.6)*past 30 days
Female
Middle school students typically do not smoke everyday. The vast majority of American Indian middle school
students who currently smoke, report smoking on only 1-5 days per month (78.2%).
Table 3.2
Days smoked cigarettes in the past 30 days*
AI-NM (%) NM (%)
Overall
Male
Table 3.3
Current use of an electronic vapor product*
AI-NM (%) NM (%)
Grade
Approximately 1 in 8 American Indian middle school students in NM (13.1%) currently use an electronic vapor
product, such as an e-cigarette. The rate of electronic vapor product use increases significantly by grade level
from 6th grade (5.2%) to 8th grade (19.8%).
Gender
7
Percent 95% CI Percent 95% CI
Overall 4.5% (3.6-5.7) 3.4% (2.9-4.0)
Male 4.6% (3.4-6.2) 4.1% (3.4-5.0)
Female 4.5% (3.1-6.3) 2.7% (2.1-3.5)
6th Grade 2.3% (1.1-4.7) 2.0% (1.4-3.0)
7th Grade 3.9% (2.7-5.7) 3.2% (2.4-4.3)
8th Grade 6.8% (4.8-9.4) 4.5% (3.6-5.6)
Percent 95% CI Percent 95% CI
Overall 3.9% (2.9-5.4) 2.9% (2.4-3.5)
Male 4.0% (2.9-5.6) 3.9% (3.1-4.8)
Female 3.8% (2.3-6.3) 1.9% (1.3-2.6)
6th Grade 1.8% (0.9-3.4) 1.2% (0.8-1.9)
7th Grade 3.8% (2.2-6.5) 2.5% (1.7-3.4)
8th Grade 5.9% (3.9-8.8) 4.4% (3.4-5.6)
AI-NM (%) NM (%)
Gender
Grade
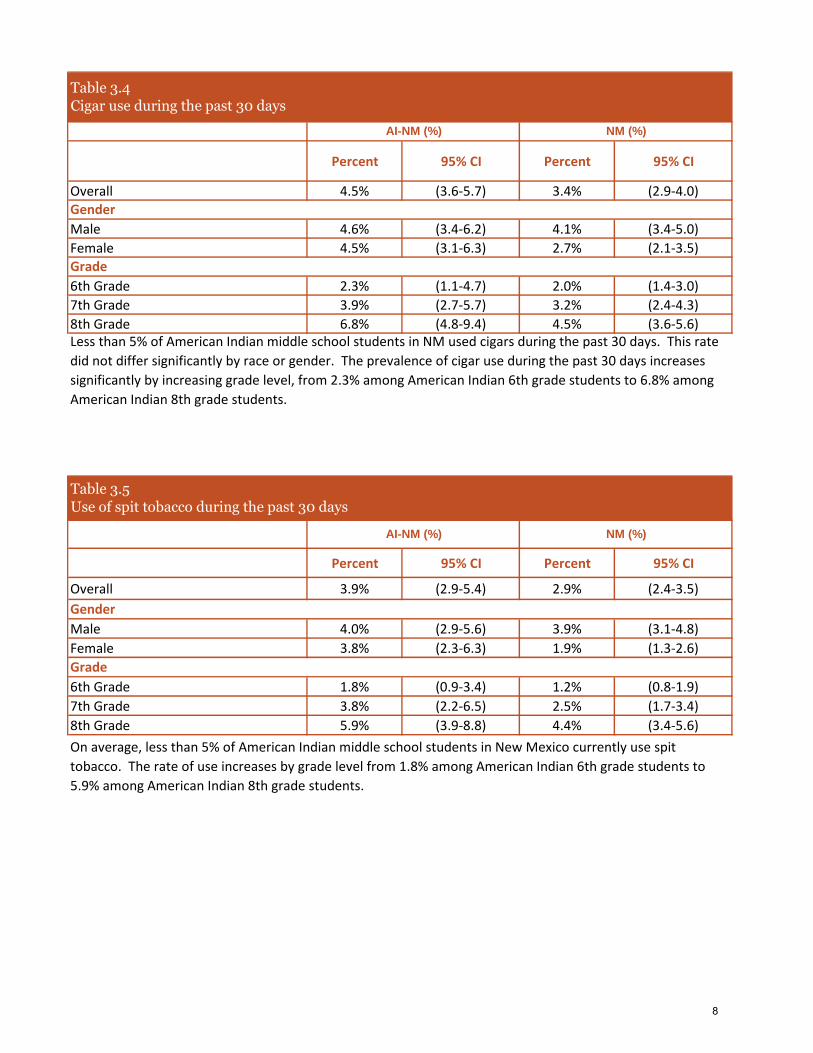
On average, less than 5% of American Indian middle school students in New Mexico currently use spit
tobacco. The rate of use increases by grade level from 1.8% among American Indian 6th grade students to
5.9% among American Indian 8th grade students.
Less than 5% of American Indian middle school students in NM used cigars during the past 30 days. This rate
did not differ significantly by race or gender. The prevalence of cigar use during the past 30 days increases
significantly by increasing grade level, from 2.3% among American Indian 6th grade students to 6.8% among
American Indian 8th grade students.
Table 3.5
Use of spit tobacco during the past 30 days
Table 3.4
Cigar use during the past 30 days
AI-NM (%) NM (%)
Gender
Grade
8
Percent 95% CI Percent 95% CI
Overall 72.4% (61.1-81.5) 54.9% (46.8-62.7)
Male 71.4% (54.6-83.9) 49.9% (37.1-62.7)
Female 74.2% (58.3-85.6) 61.0% (51.7-69.5)
6th Grade 80.0% (not stable ) 84.8% (59.7-95.5)
7th Grade 77.0% (49.3-92.0) 52.9% (39.5-65.9)
8th Grade 68.0% (47.6-83.2) 49.1% (39.1-59.2)
Percent 95% CI Percent 95% CI
Overall 55.1% (41.9-67.7) 64.2% (55.5-72.1)
Male 65.0% (45.3-80.1) 67.5% (56.3-77.0)
Female 45.3% (25.5-66.8) 60.5% (48.1-71.7)
6th Grade 44.3% unstable 53.4% (10.5-91.8)
7th Grade 58.3% (31.5-81.0) 61.0% (46.0-74.2)
8th Grade 54.3% (32.4-74.6) 69.1% (59.2-77.5)*Past 30 days
Table 3.7
Current flavored tobacco product use among current smokers*
AI-NM (%) NM (%)
Gender
Grade
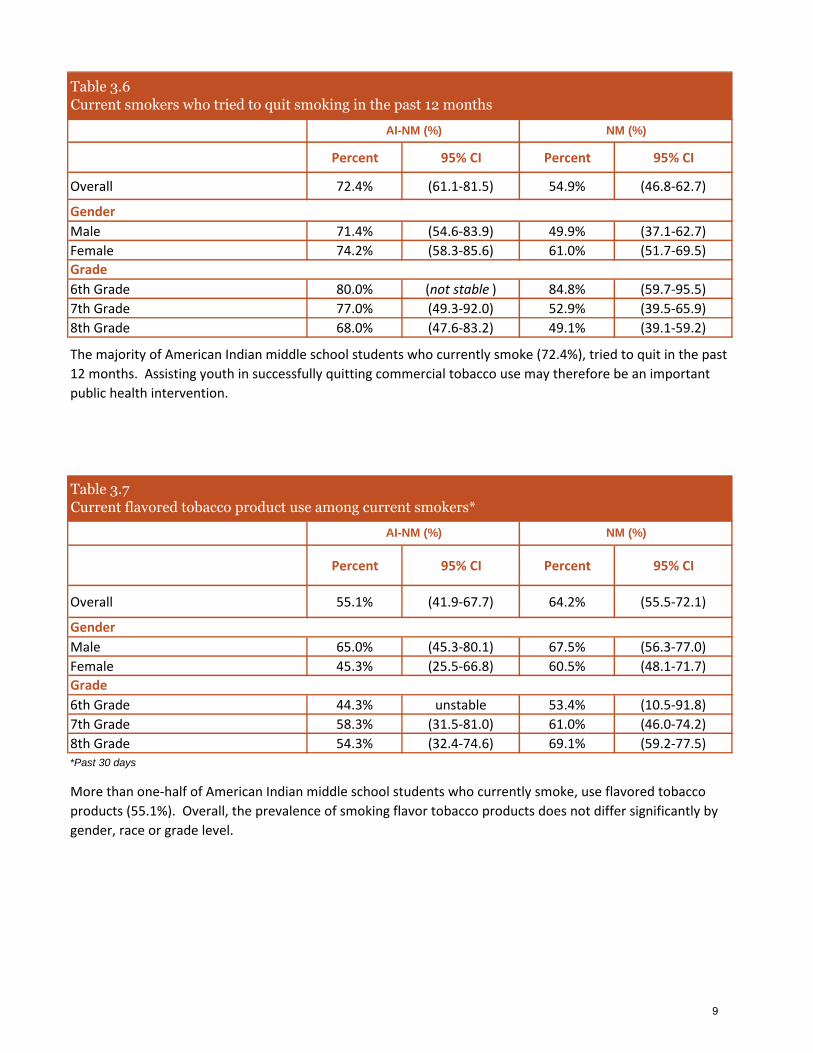
More than one-half of American Indian middle school students who currently smoke, use flavored tobacco
products (55.1%). Overall, the prevalence of smoking flavor tobacco products does not differ significantly by
gender, race or grade level.
Table 3.6
Current smokers who tried to quit smoking in the past 12 months
AI-NM (%) NM (%)
Gender
The majority of American Indian middle school students who currently smoke (72.4%), tried to quit in the past
12 months. Assisting youth in successfully quitting commercial tobacco use may therefore be an important
public health intervention.
Grade
9
SECONDHAND SMOKE EXPOSURE
Percent 95% CI Percent 95% CI
Overall 11.3% (9.4-13.6) 9.0% (8.2-9.9)
Male 11.5% (9.4-14.0) 9.5% (8.3-10.8)
Female 11.1% (8.5-14.4) 8.5% (7.4-9.8)
6th Grade 10.9% (7.6-15.2) 9.4% (7.6-11.5)
7th Grade 11.6% (8.7-15.3) 9.4% (8.0-11.0)
8th Grade 10.4% (7.7-13.9) 8.2% (7.1-9.5)
ATTITUDES & BELIEFS ABOUT SMOKING
Percent 95% CI Percent 95% CI
Overall 12.3% (10.4-14.5) 7.8% (6.9-8.8)
Male 12.9% (10.3-16.0) 8.0% (6.7-9.6)
Female 11.7% (9.2-14.9) 7.6% (6.4-8.9)
6th Grade 6.6% (4.4-9.9) 4.5% (3.5-5.9)
7th Grade 13.0% (10.3-16.4) 8.1% (6.7-9.8)
8th Grade 15.9% (12.5-19.9) 9.6% (8.0-11.5)*Excludes those that already tried smoking
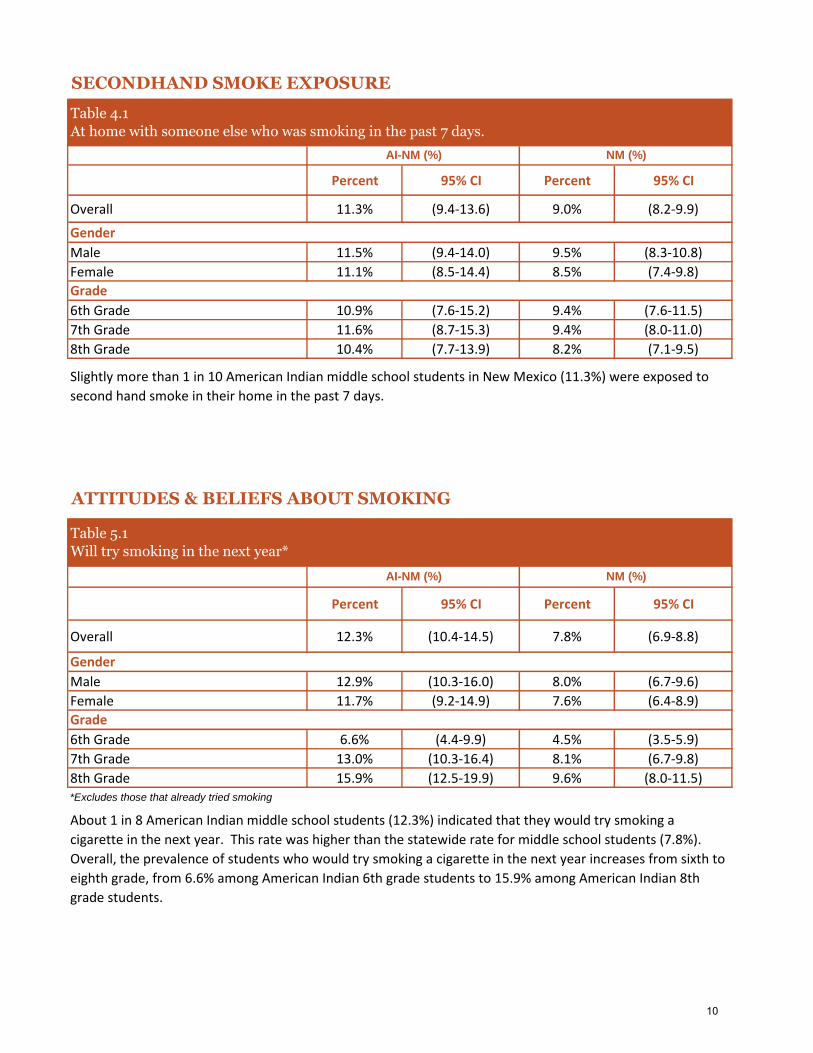
About 1 in 8 American Indian middle school students (12.3%) indicated that they would try smoking a
cigarette in the next year. This rate was higher than the statewide rate for middle school students (7.8%).
Overall, the prevalence of students who would try smoking a cigarette in the next year increases from sixth to
eighth grade, from 6.6% among American Indian 6th grade students to 15.9% among American Indian 8th
grade students.
Grade
Table 4.1
At home with someone else who was smoking in the past 7 days.
AI-NM (%) NM (%)
Gender
Grade
Slightly more than 1 in 10 American Indian middle school students in New Mexico (11.3%) were exposed to
second hand smoke in their home in the past 7 days.
Table 5.1
Will try smoking in the next year*
AI-NM (%) NM (%)
Gender
10
Percent 95% CI Percent 95% CI
Overall 11.9% (10.1-14.0) 8.2% (7.2-9.3)
Male 11.7% (9.4-14.5) 8.5% (7.2-10.1)
Female 12.1% (9.5-15.4) 7.9% (6.7-9.3)
6th Grade 6.3% (4.3-9.4) 4.3% (3.3-5.7)
7th Grade 11.7% (9.3-14.6) 9.6% (7.8-11.6)
8th Grade 17.3% (13.8-21.3) 9.7% (8.0-11.6)*Definitely or probably
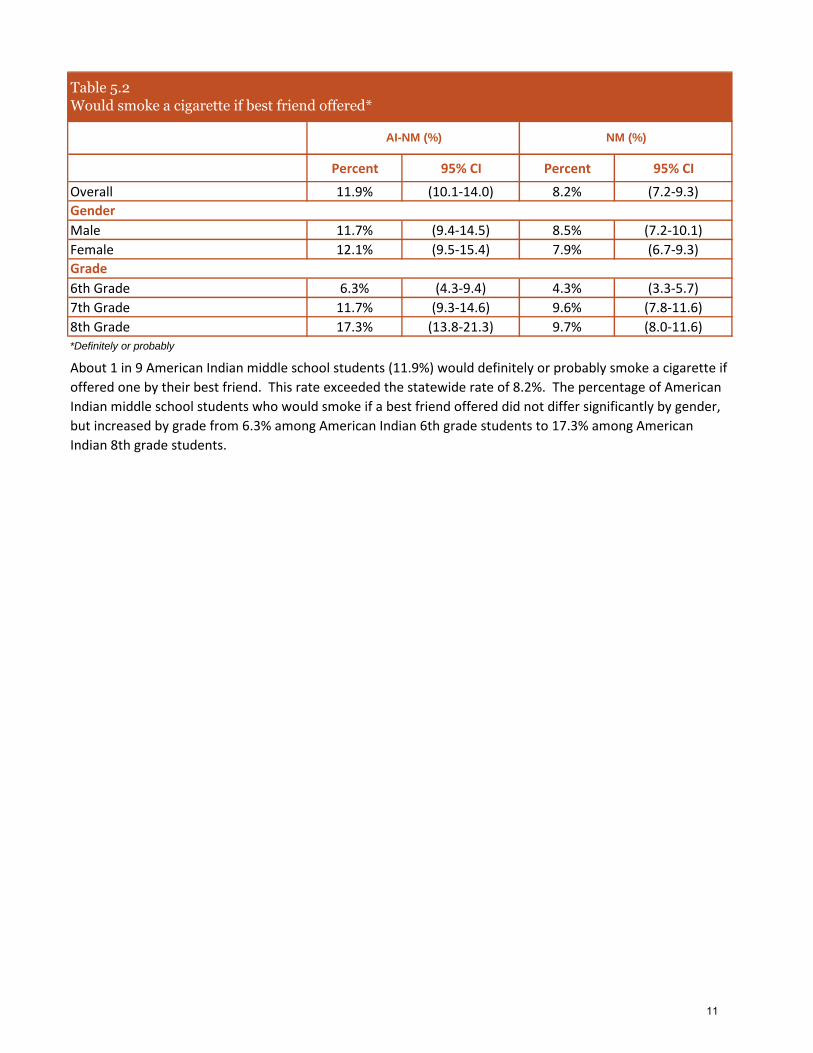
About 1 in 9 American Indian middle school students (11.9%) would definitely or probably smoke a cigarette if
offered one by their best friend. This rate exceeded the statewide rate of 8.2%. The percentage of American
Indian middle school students who would smoke if a best friend offered did not differ significantly by gender,
but increased by grade from 6.3% among American Indian 6th grade students to 17.3% among American
Indian 8th grade students.
Grade
Table 5.2
Would smoke a cigarette if best friend offered*
AI-NM (%) NM (%)
Gender
11
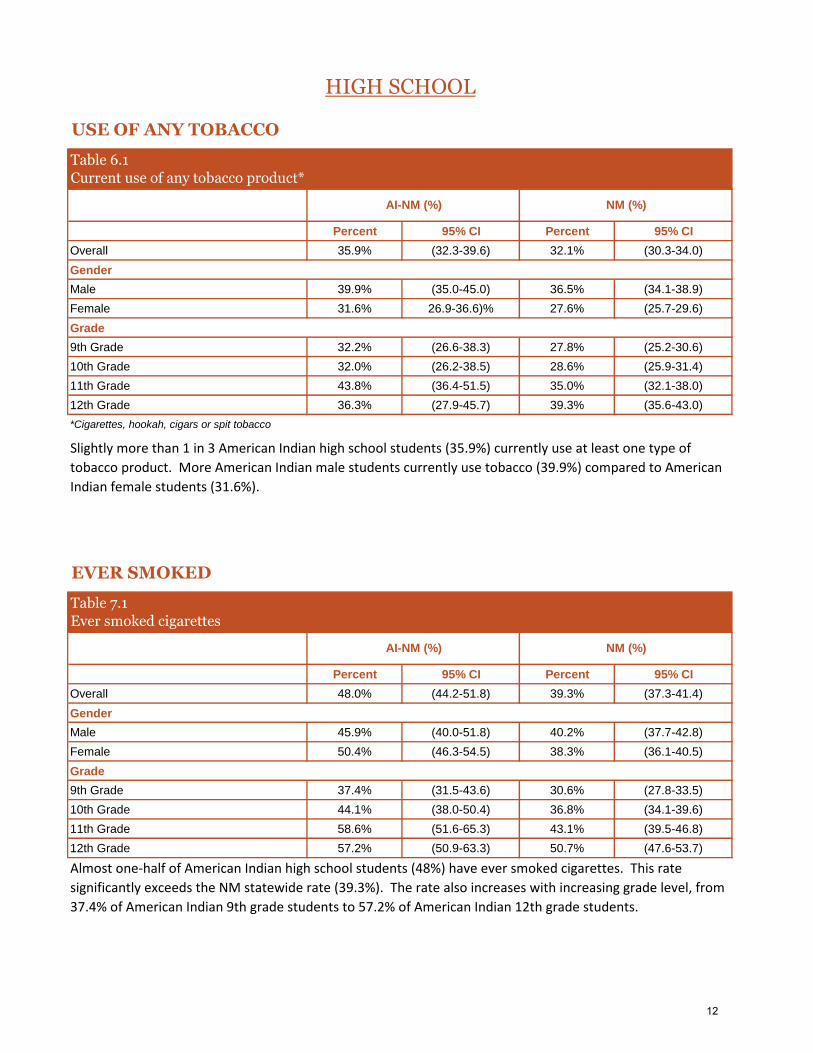
USE OF ANY TOBACCO
Percent 95% CI Percent 95% CI
Overall 35.9% (32.3-39.6) 32.1% (30.3-34.0)
Male 39.9% (35.0-45.0) 36.5% (34.1-38.9)
Female 31.6% 26.9-36.6)% 27.6% (25.7-29.6)
9th Grade 32.2% (26.6-38.3) 27.8% (25.2-30.6)
10th Grade 32.0% (26.2-38.5) 28.6% (25.9-31.4)
11th Grade 43.8% (36.4-51.5) 35.0% (32.1-38.0)
12th Grade 36.3% (27.9-45.7) 39.3% (35.6-43.0)
*Cigarettes, hookah, cigars or spit tobacco
EVER SMOKED
Percent 95% CI Percent 95% CI
Overall 48.0% (44.2-51.8) 39.3% (37.3-41.4)
Male 45.9% (40.0-51.8) 40.2% (37.7-42.8)
Female 50.4% (46.3-54.5) 38.3% (36.1-40.5)
9th Grade 37.4% (31.5-43.6) 30.6% (27.8-33.5)
10th Grade 44.1% (38.0-50.4) 36.8% (34.1-39.6)
11th Grade 58.6% (51.6-65.3) 43.1% (39.5-46.8)
12th Grade 57.2% (50.9-63.3) 50.7% (47.6-53.7)
Grade
HIGH SCHOOL
Table 6.1
Current use of any tobacco product*
AI-NM (%) NM (%)
Gender
Slightly more than 1 in 3 American Indian high school students (35.9%) currently use at least one type of
tobacco product. More American Indian male students currently use tobacco (39.9%) compared to American
Indian female students (31.6%).
Table 7.1
Ever smoked cigarettes
AI-NM (%) NM (%)
Gender
Grade
Almost one-half of American Indian high school students (48%) have ever smoked cigarettes. This rate
significantly exceeds the NM statewide rate (39.3%). The rate also increases with increasing grade level, from
37.4% of American Indian 9th grade students to 57.2% of American Indian 12th grade students.
12
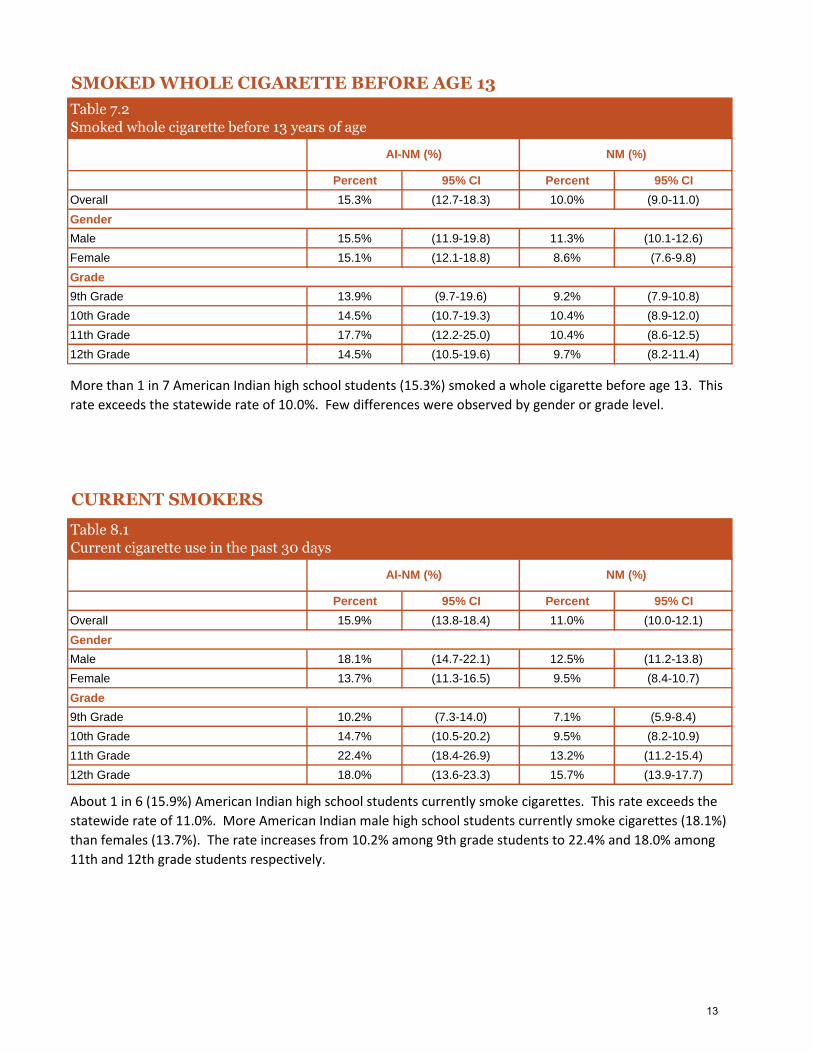
SMOKED WHOLE CIGARETTE BEFORE AGE 13
Percent 95% CI Percent 95% CI
Overall 15.3% (12.7-18.3) 10.0% (9.0-11.0)
Male 15.5% (11.9-19.8) 11.3% (10.1-12.6)
Female 15.1% (12.1-18.8) 8.6% (7.6-9.8)
9th Grade 13.9% (9.7-19.6) 9.2% (7.9-10.8)
10th Grade 14.5% (10.7-19.3) 10.4% (8.9-12.0)
11th Grade 17.7% (12.2-25.0) 10.4% (8.6-12.5)
12th Grade 14.5% (10.5-19.6) 9.7% (8.2-11.4)
CURRENT SMOKERS
Percent 95% CI Percent 95% CI
Overall 15.9% (13.8-18.4) 11.0% (10.0-12.1)
Male 18.1% (14.7-22.1) 12.5% (11.2-13.8)
Female 13.7% (11.3-16.5) 9.5% (8.4-10.7)
9th Grade 10.2% (7.3-14.0) 7.1% (5.9-8.4)
10th Grade 14.7% (10.5-20.2) 9.5% (8.2-10.9)
11th Grade 22.4% (18.4-26.9) 13.2% (11.2-15.4)
12th Grade 18.0% (13.6-23.3) 15.7% (13.9-17.7)
Grade
Table 7.2
Smoked whole cigarette before 13 years of age
AI-NM (%) NM (%)
Gender
More than 1 in 7 American Indian high school students (15.3%) smoked a whole cigarette before age 13. This
rate exceeds the statewide rate of 10.0%. Few differences were observed by gender or grade level.
Table 8.1
Current cigarette use in the past 30 days
AI-NM (%) NM (%)
Gender
Grade
About 1 in 6 (15.9%) American Indian high school students currently smoke cigarettes. This rate exceeds the
statewide rate of 11.0%. More American Indian male high school students currently smoke cigarettes (18.1%)
than females (13.7%). The rate increases from 10.2% among 9th grade students to 22.4% and 18.0% among
11th and 12th grade students respectively.
13
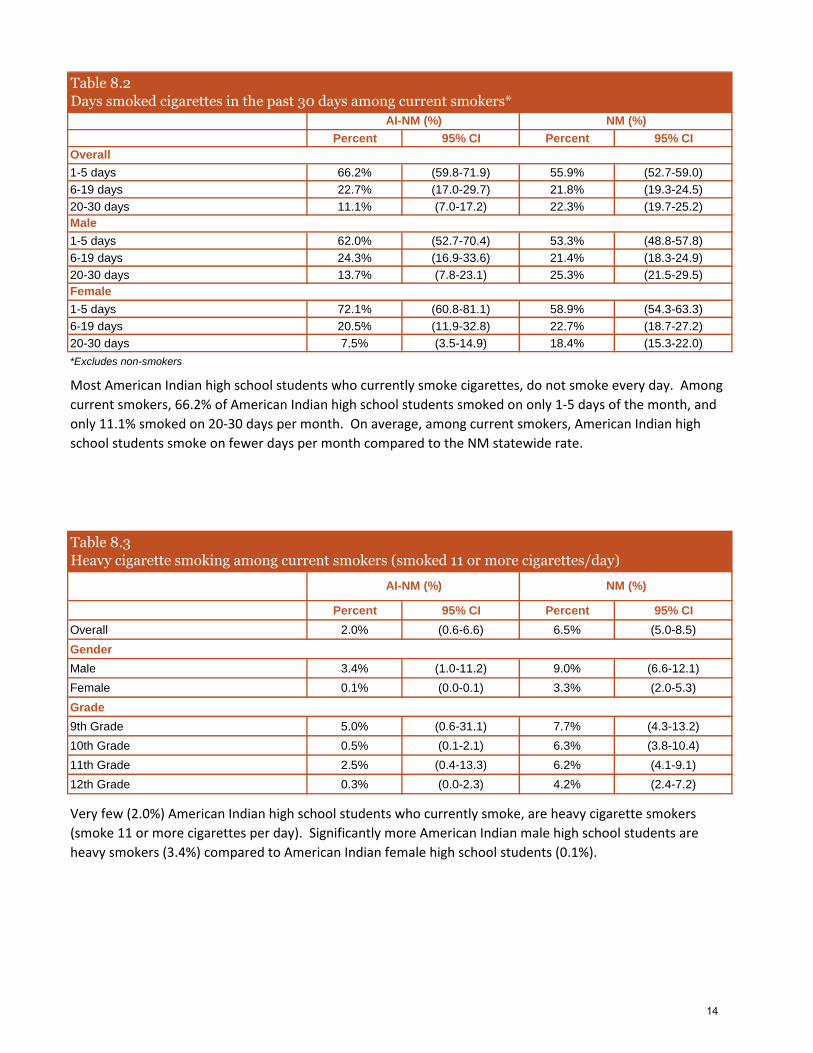
Percent 95% CI Percent 95% CI
1-5 days 66.2% (59.8-71.9) 55.9% (52.7-59.0)
6-19 days 22.7% (17.0-29.7) 21.8% (19.3-24.5)
20-30 days 11.1% (7.0-17.2) 22.3% (19.7-25.2)
1-5 days 62.0% (52.7-70.4) 53.3% (48.8-57.8)
6-19 days 24.3% (16.9-33.6) 21.4% (18.3-24.9)
20-30 days 13.7% (7.8-23.1) 25.3% (21.5-29.5)
1-5 days 72.1% (60.8-81.1) 58.9% (54.3-63.3)
6-19 days 20.5% (11.9-32.8) 22.7% (18.7-27.2)
20-30 days 7.5% (3.5-14.9) 18.4% (15.3-22.0)
*Excludes non-smokers
Percent 95% CI Percent 95% CI
Overall 2.0% (0.6-6.6) 6.5% (5.0-8.5)
Male 3.4% (1.0-11.2) 9.0% (6.6-12.1)
Female 0.1% (0.0-0.1) 3.3% (2.0-5.3)
9th Grade 5.0% (0.6-31.1) 7.7% (4.3-13.2)
10th Grade 0.5% (0.1-2.1) 6.3% (3.8-10.4)
11th Grade 2.5% (0.4-13.3) 6.2% (4.1-9.1)
12th Grade 0.3% (0.0-2.3) 4.2% (2.4-7.2)
Male
Table 8.2
Days smoked cigarettes in the past 30 days among current smokers*
AI-NM (%) NM (%)
Overall
Female
Most American Indian high school students who currently smoke cigarettes, do not smoke every day. Among
current smokers, 66.2% of American Indian high school students smoked on only 1-5 days of the month, and
only 11.1% smoked on 20-30 days per month. On average, among current smokers, American Indian high
school students smoke on fewer days per month compared to the NM statewide rate.
Table 8.3
Heavy cigarette smoking among current smokers (smoked 11 or more cigarettes/day)
AI-NM (%) NM (%)
Gender
Grade
Very few (2.0%) American Indian high school students who currently smoke, are heavy cigarette smokers
(smoke 11 or more cigarettes per day). Significantly more American Indian male high school students are
heavy smokers (3.4%) compared to American Indian female high school students (0.1%).
14
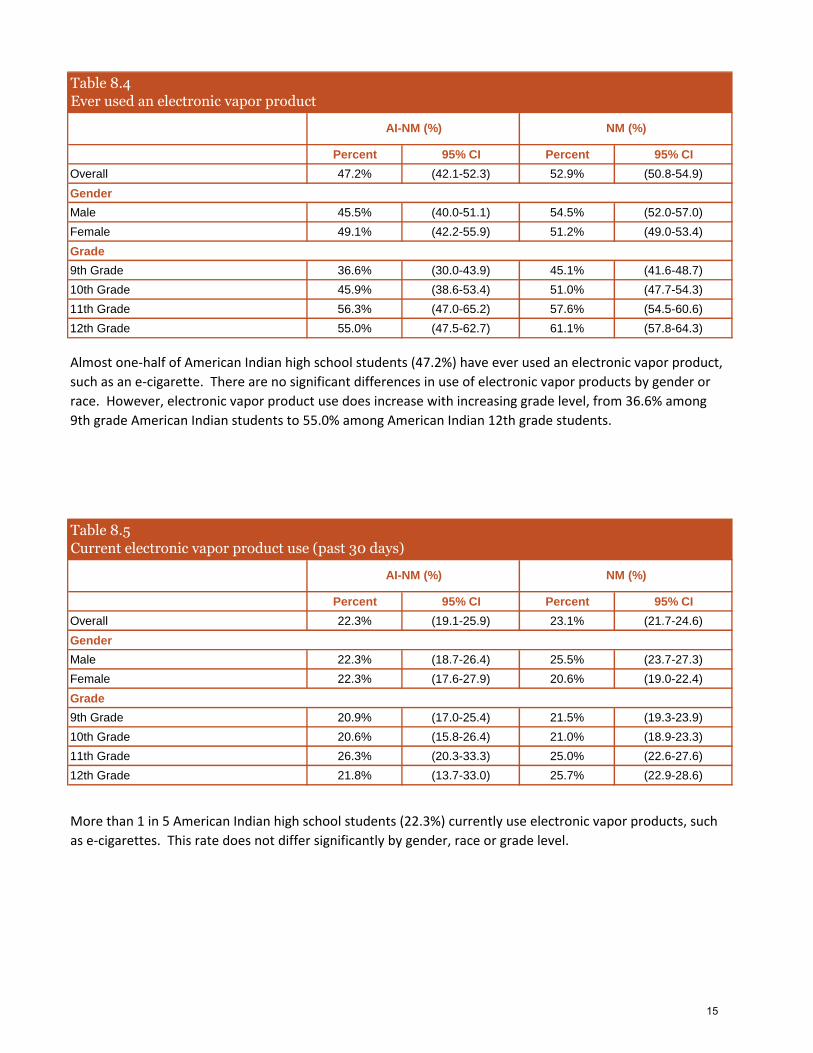
Percent 95% CI Percent 95% CI
Overall 47.2% (42.1-52.3) 52.9% (50.8-54.9)
Male 45.5% (40.0-51.1) 54.5% (52.0-57.0)
Female 49.1% (42.2-55.9) 51.2% (49.0-53.4)
9th Grade 36.6% (30.0-43.9) 45.1% (41.6-48.7)
10th Grade 45.9% (38.6-53.4) 51.0% (47.7-54.3)
11th Grade 56.3% (47.0-65.2) 57.6% (54.5-60.6)
12th Grade 55.0% (47.5-62.7) 61.1% (57.8-64.3)
Percent 95% CI Percent 95% CI
Overall 22.3% (19.1-25.9) 23.1% (21.7-24.6)
Male 22.3% (18.7-26.4) 25.5% (23.7-27.3)
Female 22.3% (17.6-27.9) 20.6% (19.0-22.4)
9th Grade 20.9% (17.0-25.4) 21.5% (19.3-23.9)
10th Grade 20.6% (15.8-26.4) 21.0% (18.9-23.3)
11th Grade 26.3% (20.3-33.3) 25.0% (22.6-27.6)
12th Grade 21.8% (13.7-33.0) 25.7% (22.9-28.6)
Almost one-half of American Indian high school students (47.2%) have ever used an electronic vapor product,
such as an e-cigarette. There are no significant differences in use of electronic vapor products by gender or
race. However, electronic vapor product use does increase with increasing grade level, from 36.6% among
9th grade American Indian students to 55.0% among American Indian 12th grade students.
Table 8.5
Current electronic vapor product use (past 30 days)
AI-NM (%) NM (%)
Gender
Grade
More than 1 in 5 American Indian high school students (22.3%) currently use electronic vapor products, such
as e-cigarettes. This rate does not differ significantly by gender, race or grade level.
Gender
Grade
Table 8.4
Ever used an electronic vapor product
AI-NM (%) NM (%)
15
Percent 95% CI Percent 95% CI
Overall 66.6% (57.7-74.4) 73.0% (69.7-76.0)
Male 64.4% (54.9-72.9) 71.5% (67.3-75.4)
Female 69.5% (55.8-80.5) 74.8% (70.2-79.0)
9th Grade 49.9% (33.0-66.8) 68.0% (60.4-74.8)
10th Grade 79.3% (63.5-89.5) 74.9% (69.0-80.0)
11th Grade 66.8% (46.3-82.5) 75.7% (68.8-81.4)
12th Grade 70.8% (59.6-80.0) 71.7% (66.8-76.2)
Percent 95% CI Percent 95% CI
Overall 9.7% (7.7-12.1) 7.8% (7.0-8.7)
Male 14.0% (10.7-18.0) 12.6% (11.3-13.9)
Female 5.1% (3.5-7.3) 2.8% (2.3-3.4)
9th Grade 9.5% (6.5-13.6) 5.9% (5.0-7.0)
10th Grade 9.3% (6.1-13.9) 6.8% (5.7-8.1)
11th Grade 11.0% (7.1-16.8) 8.3% (7.0-9.8)
12th Grade 8.8% (5.8-12.3) 10.7% (8.7-13.1)
*Chewing tobacco, snuff or dip
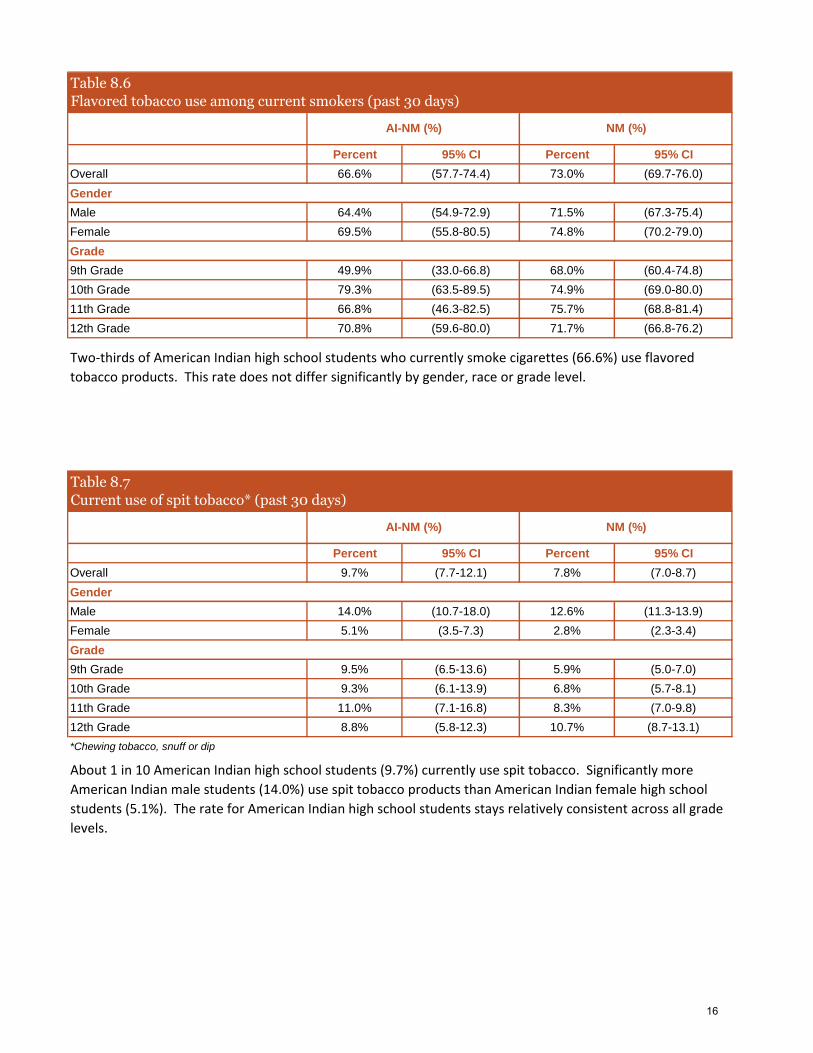
Table 8.6
Flavored tobacco use among current smokers (past 30 days)
AI-NM (%) NM (%)
Gender
Grade
Two-thirds of American Indian high school students who currently smoke cigarettes (66.6%) use flavored
tobacco products. This rate does not differ significantly by gender, race or grade level.
Table 8.7
Current use of spit tobacco* (past 30 days)
AI-NM (%) NM (%)
Gender
Grade
About 1 in 10 American Indian high school students (9.7%) currently use spit tobacco. Significantly more
American Indian male students (14.0%) use spit tobacco products than American Indian female high school
students (5.1%). The rate for American Indian high school students stays relatively consistent across all grade
levels.
16
Percent 95% CI Percent 95% CI
Overall 11.9% (10.1-13.9) 10.1% (9.2-11.1)
Male 15.2% (12.4-18.5) 13.2% (11.9-14.7)
Female 8.4% (6.4-10.8) 6.7% (5.9-7.7)
9th Grade 8.7% (6.2-12.0) 6.6% (5.6-7.7)
10th Grade 10.5% (7.4-14.7) 9.0% (7.5-10.7)
11th Grade 15.2% (11.6-19.6) 10.5% (9.0-12.2)
12th Grade 14.9% (9.9-21.7) 15.3% (13.1-17.8)
Percent 95% CI Percent 95% CI
Overall 15.1% (13.0-17.4) 13.2% (12.3-14.2)
Male 16.6% (13.4-20.3) 14.3% (13.0-15.7)
Female 13.5% (10.7-16.9) 12.0% (10.9-13.1)
9th Grade 13.2% (9.6-17.8) 10.7% (9.5-12.2)
10th Grade 14.4% (10.9-18.8) 12.1% (10.5-14.0)
11th Grade 19.9% (15.3-25.6) 14.4% (12.8-16.2)
12th Grade 11.5% (7.9-16.4) 16.0% (13.9-18.3)
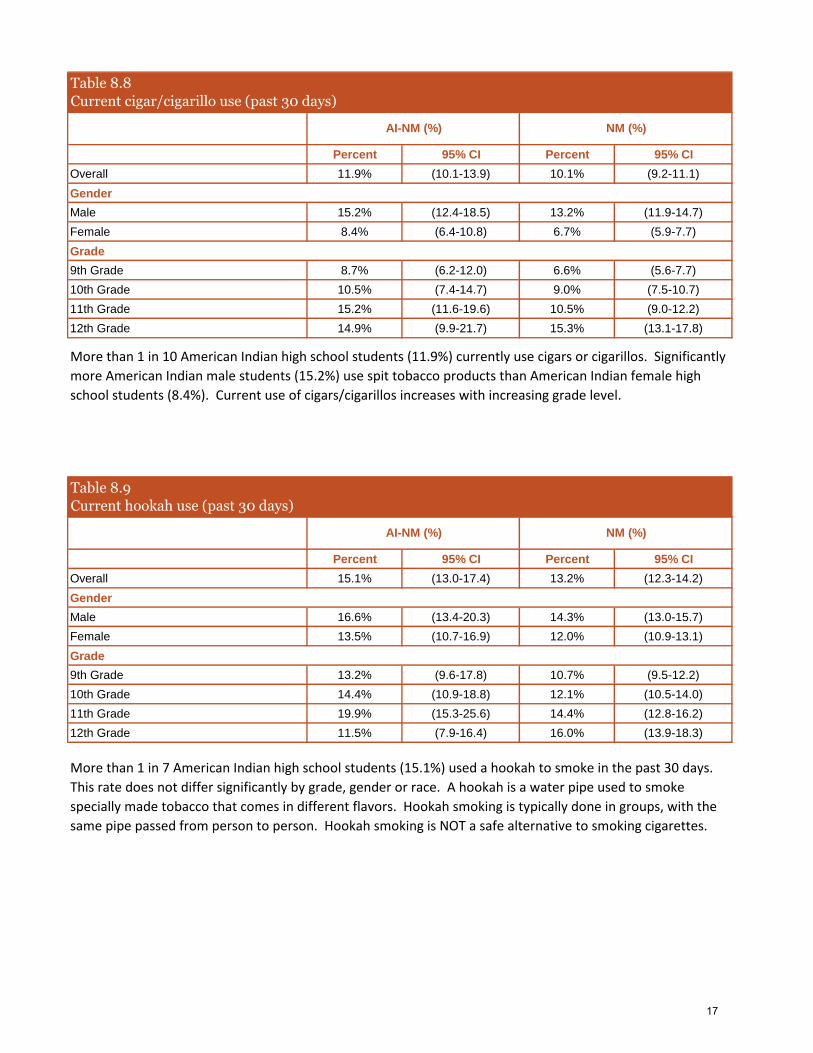
Table 8.8
Current cigar/cigarillo use (past 30 days)
AI-NM (%) NM (%)
Gender
Grade
More than 1 in 10 American Indian high school students (11.9%) currently use cigars or cigarillos. Significantly
more American Indian male students (15.2%) use spit tobacco products than American Indian female high
school students (8.4%). Current use of cigars/cigarillos increases with increasing grade level.
Table 8.9
Current hookah use (past 30 days)
AI-NM (%) NM (%)
Gender
Grade
More than 1 in 7 American Indian high school students (15.1%) used a hookah to smoke in the past 30 days.
This rate does not differ significantly by grade, gender or race. A hookah is a water pipe used to smoke
specially made tobacco that comes in different flavors. Hookah smoking is typically done in groups, with the
same pipe passed from person to person. Hookah smoking is NOT a safe alternative to smoking cigarettes.
17
Percent 95% CI Percent 95% CI
Overall 57.8% (49.8-65.4) 52.5% (49.3-55.6)
Male 54.6% (45.4-63.5) 50.6% (46.2-54.9)
Female 62.5% (50.3-73.3) 55.6% (50.6-60.4)
9th Grade 59.2% (38.7-76.8) 49.9% (43.0-56.8)
10th Grade 54.4% (36.2-71.5) 51.9% (44.4-59.4)
11th Grade 57.3% (43.0-70.4) 54.2% (47.8-60.5)
12th Grade 58.7% (44.9-71.2) 53.5% (48.1-58.9)
*In the past 12 months
SECONDHAND SMOKE
Percent 95% CI Percent 95% CI
Overall 26.0% (23.3-28.8) 34.5% (33.1-35.9)
Male 25.2% (21.5-29.3) 32.7% (31.0-34.3)
Female 26.8% (23.4-30.6) 36.3% (34.5-38.2)
9th Grade 25.3% (20.7-30.6) 33.1% (30.9-35.3)
10th Grade 24.1% (19.2-29.7) 33.1% (30.9-35.5)
11th Grade 27.8% (21.4-35.3) 34.0% (31.3-36-9)
12th Grade 27.6% (20.9-35.4) 38.5% (36.0-41.1)
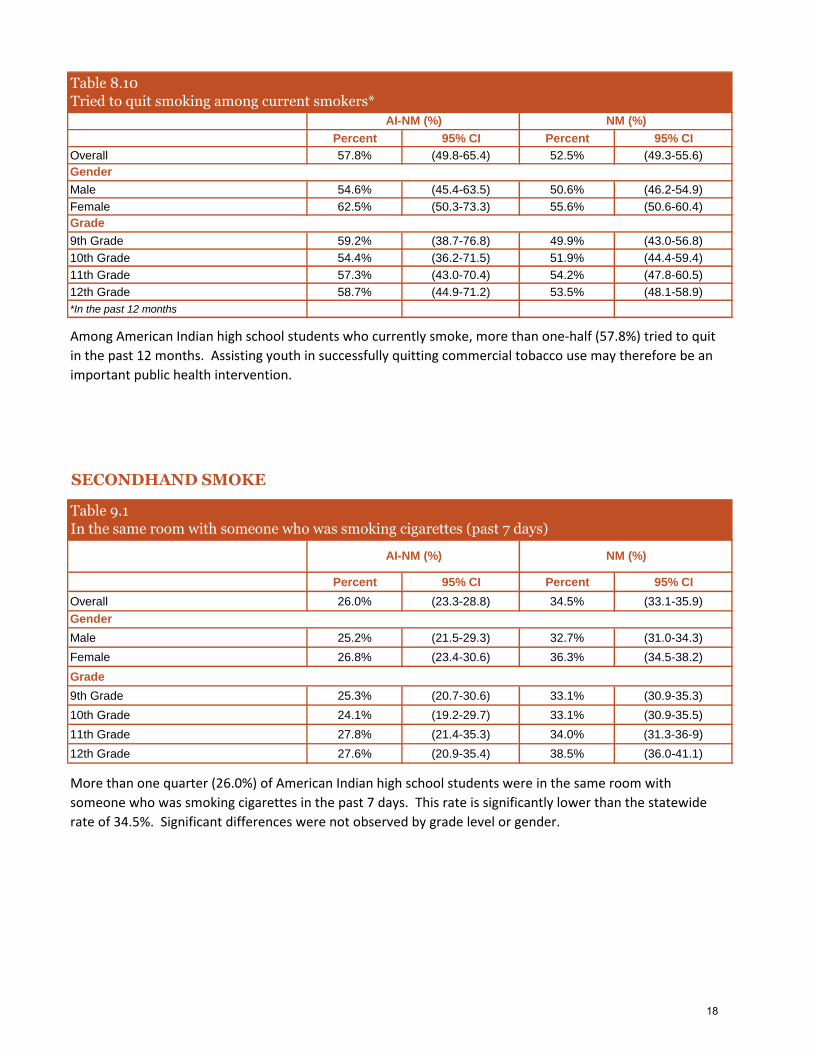
Table 8.10
Tried to quit smoking among current smokers*
AI-NM (%) NM (%)
Gender
Grade
More than one quarter (26.0%) of American Indian high school students were in the same room with
someone who was smoking cigarettes in the past 7 days. This rate is significantly lower than the statewide
rate of 34.5%. Significant differences were not observed by grade level or gender.
Gender
Grade
Among American Indian high school students who currently smoke, more than one-half (57.8%) tried to quit
in the past 12 months. Assisting youth in successfully quitting commercial tobacco use may therefore be an
important public health intervention.
Table 9.1
In the same room with someone who was smoking cigarettes (past 7 days)
AI-NM (%) NM (%)
18
Percent 95% CI Percent 95% CI
Overall 15.4% (13.3-17.7) 19.2% (18.1-20.2)
Male 14.9% (12.3-17.9) 19.0% (17.7-20.3)
Female 16.0% (12.7-19.9) 19.2% (17.7-20.8)
9th Grade 16.1% (12.4-20.5) 18.9% (17.2-20.7)
10th Grade 13.6% (11.0-16.8) 19.6% (17.8-21.5)
11th Grade 17.4% (14.0-21.4) 19.0% (17.3-20.8)
12th Grade 14.1% (9.7-20.0) 18.6% (16.9-20.4)
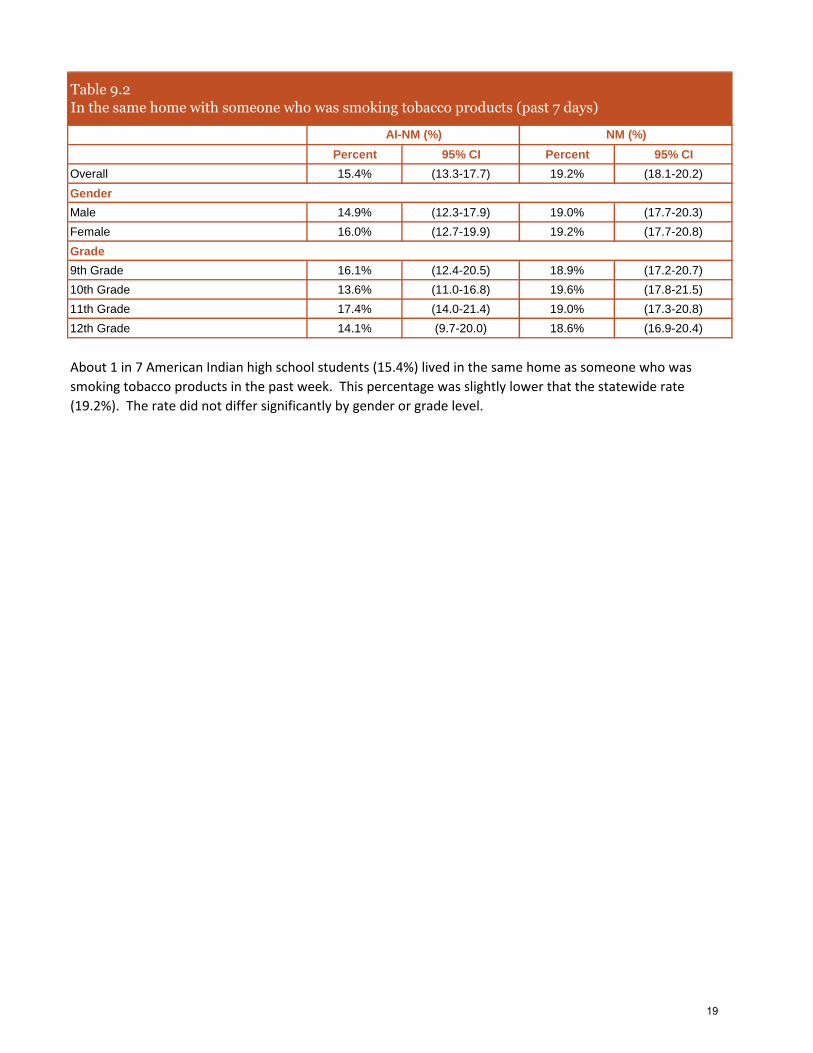
About 1 in 7 American Indian high school students (15.4%) lived in the same home as someone who was
smoking tobacco products in the past week. This percentage was slightly lower that the statewide rate
(19.2%). The rate did not differ significantly by gender or grade level.
Table 9.2
In the same home with someone who was smoking tobacco products (past 7 days)
AI-NM (%) NM (%)
Gender
Grade
19