to - apps.dtic.mil · defense of the united ste,tes within the meaning of the espionage laws, title...
TRANSCRIPT
UNCLASSIFIED
AD NUMBER
CLASSIFICATION CHANGESTO:FROM:
LIMITATION CHANGESTO:
FROM:
AUTHORITY
THIS PAGE IS UNCLASSIFIED
AD038780
unclassified
confidential
Approved for public release; distribution isunlimited.
Distribution: Further dissemination only asdirected by Office of Naval Research,Washington, DC, AUG 1954, or higher DoDauthority.
30 sep 1966, DoDD 5200.10; ntis onr ltr, 26 oct1977
UNCLASSIFIED
AD NUMBER
CLASSIFICATION CHANGESTO:
FROM:
AUTHORITY
THIS PAGE IS UNCLASSIFIED
AD038780
confidential
secret
30 sep 1957, DoDD 5200.10
THIS REPORT HAS BEEN DELIMITED
AND CLEARED FOR PUBLIC RELEASE
UNDER DOD DIRECTIVE 5200,20 AND
NO RESTRICTIONS ARE IMPOSED UPON
ITS USE AND DISCLOSURE,
DISTRIBUTION STATEMENT A
APPROVED FOR PUBLIC RELEASE;
DISTRIBUTION UNLIMITED,
ervices Technical Information Agency
N GOVERNMENT OR OTHER DRAWINGS, SPECIFICATIONS OR OTHER DATA » ANY PURPOSE OTHER THAN IN CONNECTION WITH A DEFINITELY RELATED
'ROCUREMENT OPERATION, THE U. S. GOVERNMENT THEREBY INCURS .ITY, NOR ANY OBLIGATION WHATSOEVER; AND THE FACT THAT THE 1AY HAVE FORMULATED, FURNISHED, OR IN ANY WAY SUPPLIED THE
SPECIFICATIONS, OR OTHER DATA IS NOT TO BE REGARDED BY i OTHERWISE A3 IN ANY MANNEH LICENSING THE HOLDER OR ANY OTHER .PORATION, OR CONVEYING ANY RIGHTS OR PERMISSION TO MANUFACTURE, Ft PATENTED INVENTION THAT MAY IN AN*" WAY BE RELATED THERETO.
Reproduced by
GCUMEKT SERVICE CENTER KNOT! SUILOING, DAYTON, 2, OHIO
SRHEI &*lm ffar «« ii *1 •» • - .
JLf«
'Jti*9b mmmnitf
HUDSON LABORATORIES
DQBSS -FERRY, N. YV
*" $****/?m2 ?
ij
C/2
a*H5a »*. a ;»'# ^m
,;V RBpHgUtCH SPONSORED BY
OFFICE €*F NAVAL RESEARCH
. CONTRACT N©-ONFM>7135
;-«t^%»iflfeStivo apft^ned hereto is cornet.
ktt t %yEE&s ~Js£2&Lea£dakmmsa&*sL By *'-**«tiou ' f
54AA 5 Q 1 yf n
CU-3Q-54~0NR-2?l-Phys
COLUMBIA UNIVERSITY
Hudson Laboratories
Dobba Perry, N. Y.
PROJECT MICHAEL
Contract N6-ONR-27135
Technical Report No. 23 Transmission of Sound from
Deep to Shallow Water
A. N. G-uthrie
W. A. Nierenberg Director
Research Sponsored by Office of Naval Research
Further distribution of this report, or of an abstract or reproductions, may be made only with the approval of Chief of Naval Research. (Code 466^.
Copy No. 010 SECRET
of 60 Copies August, 1954
This report consists of 20 pages
This document contains information affecting the national defense of the United Ste,tes within the meaning of the Espionage Laws, Title 18, U.S.C., Sections 793 and 794. The transmission or the revelation of its contents in anv manner to am unauthorized P©£eon is prohibited b;
55 A A '5 814 9 - 1 -
'•i
- 2 -
TABLE OF CONTENTS
Page
I. The Experiment 3
II, Analysis of Recordings 5
III. Qualitative Results 6
IV, Comparison of Listening Stations 7
V. Frequency Dependence of Transmission 8
VI. Bottom Reflection Losses 10
VII. Summary and Conclusions 10
Acknowledgments 11
References 11
LIST OF FIGURES
Figure Page
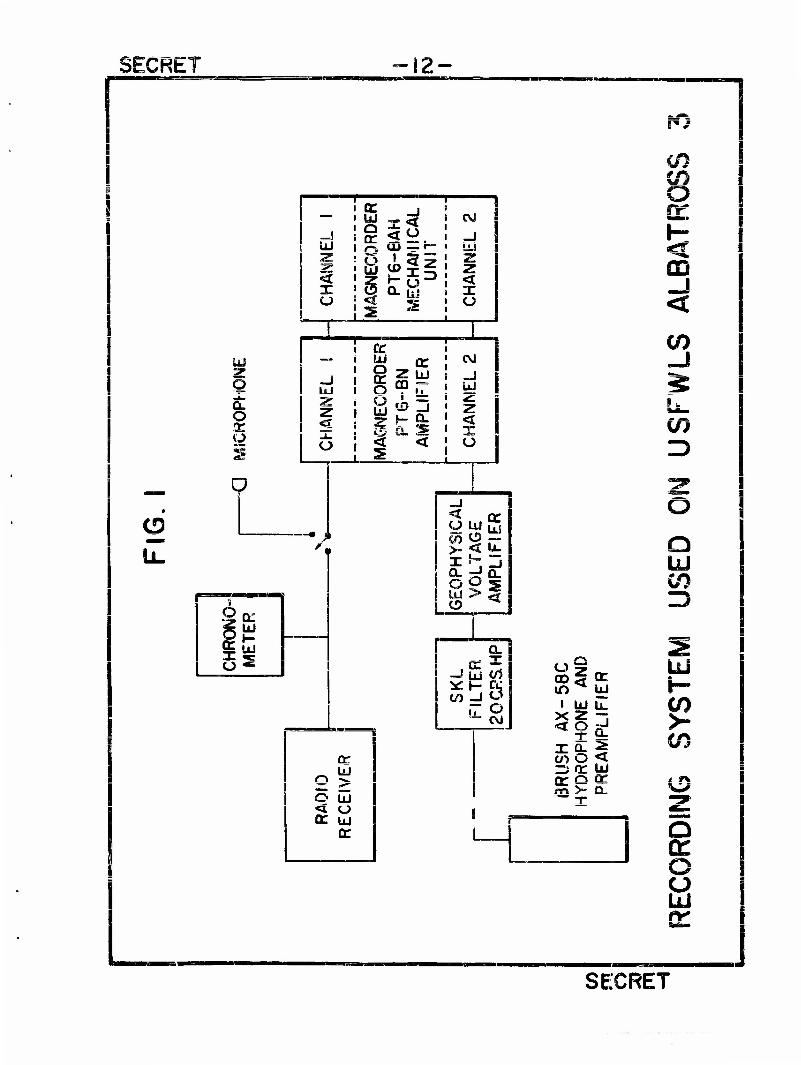
1 Recording System Used on USPWLS ALBATROSS III 12
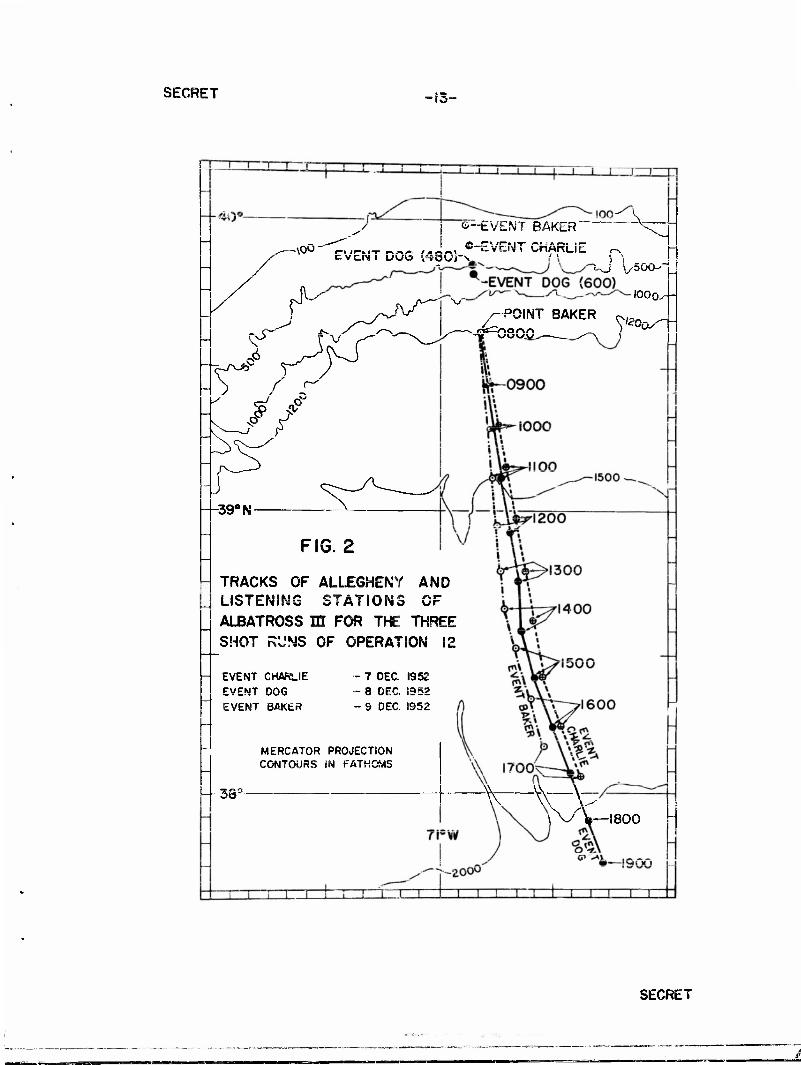
2 Tracks of ALLEGHENY and Listening Stations of 13 ALBATROSS in
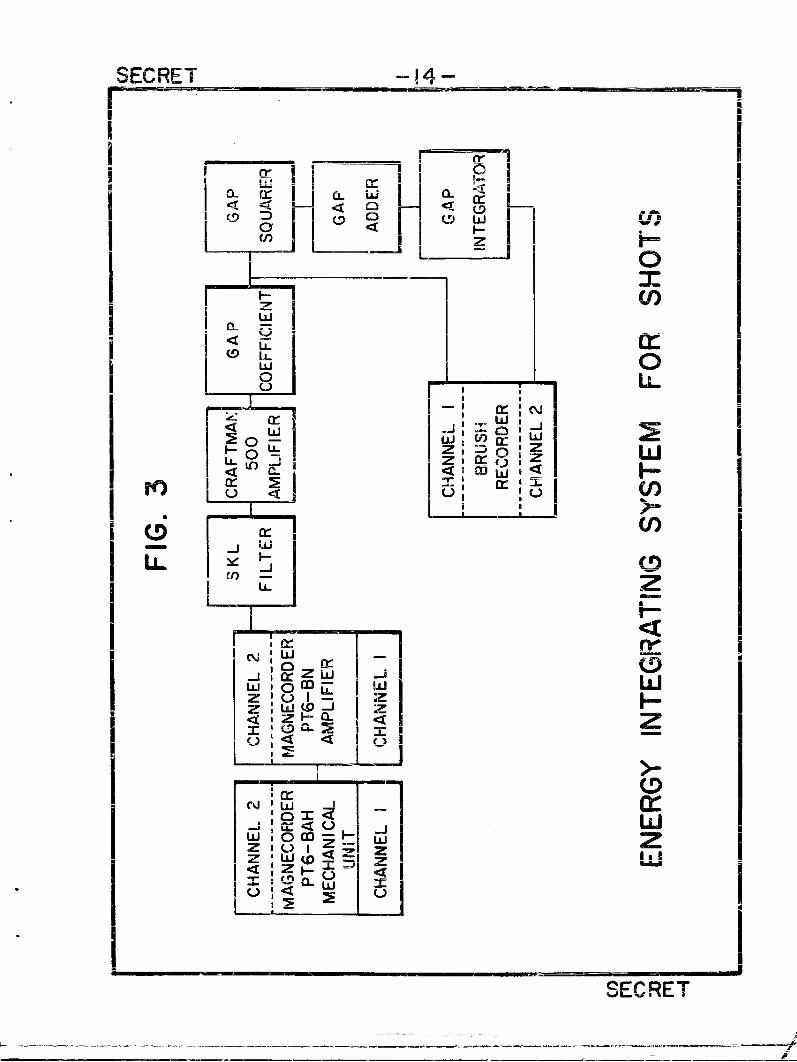
3 Energy Integrating System for Shots 14
4 Typical Shot Signals and Shot Energy Integrations 15
5 Contour of Bottom, and Ray Tracings of Limiting Rays 16
6 Corrected Pressure Levele VB Distance from Point BAKER 1?
7 JPressure Level Difference from 30-60 cps Band vs Range 18
6 Frequency Distribution of Energy in Shot Signal 19
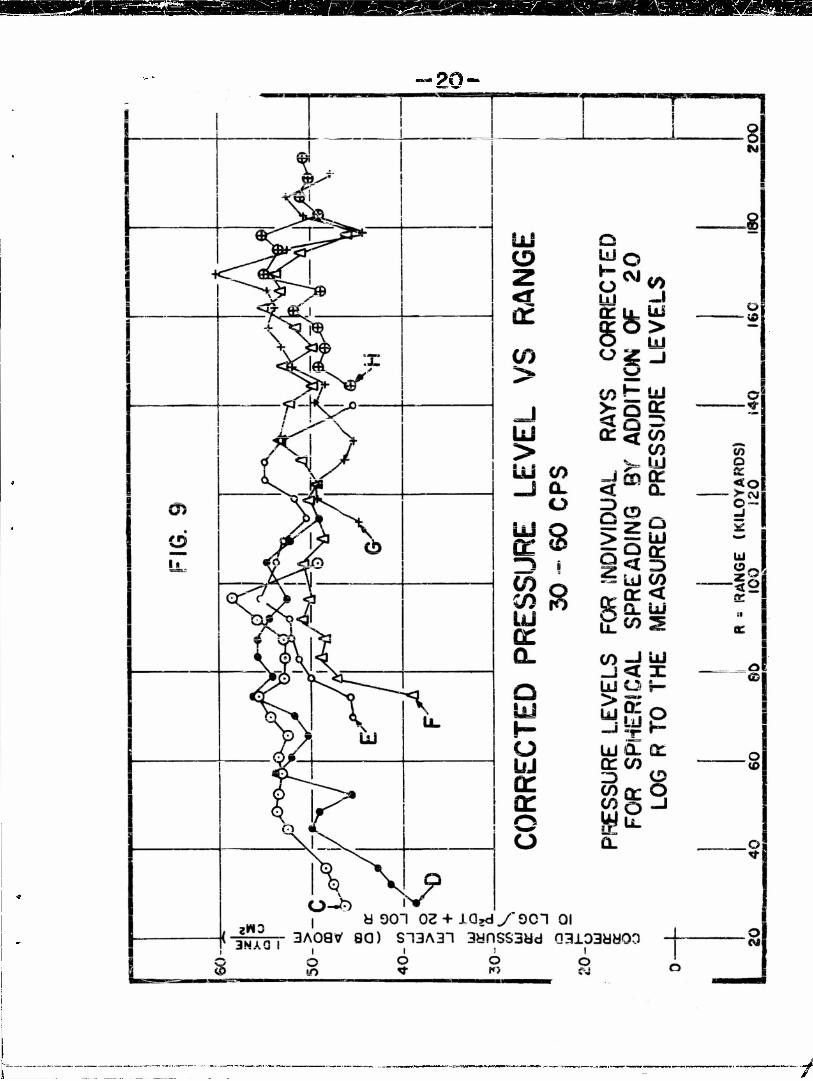
9 Corrected Pressure Level vs Range 20
SECRET 3 -
TRANSMISSION OP SOUND FROM DEEP TO SHALLOW WATER
A. N. Guthrie
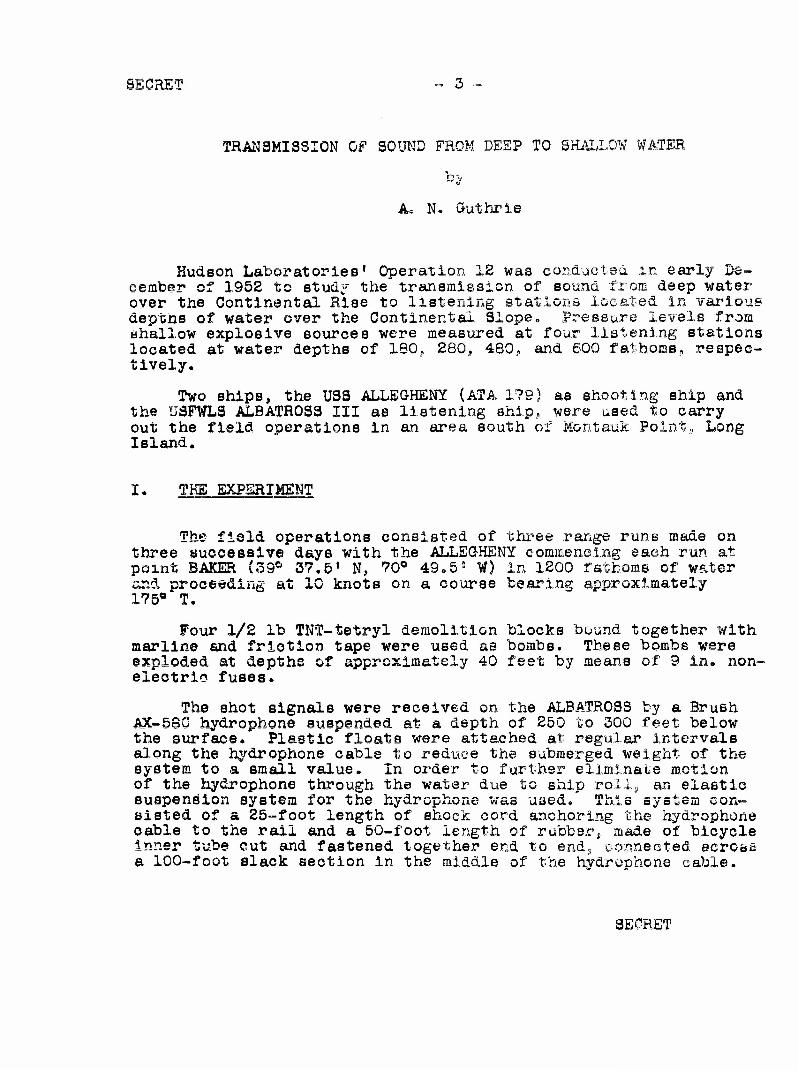
Hudson Laboratories* Operation 12 was conducted in early De- cember of 1952 to study the" transmission of sound from deep water over the Continental Rise to listening stations located in -various deptns of water over the Continental Slope, pressure levels from shallow explosive sources were measured at four listening stations located at water depths of 180, 280, 480, and 600 fathoms, respec- tively.
Two ships, the US3 ALLEGHENY (ATA 179) as shooting ship and the USPWLS ALBATROSS III as listening ship, were used to carry out the field operations in an area south of ii. - taux Island.
Poll Long
I. THE EXPERIMENT
The field operations consisted of three range runs made on three successive days with the ALLEGHENY commencing each run at point BAKER (39e 37.5• N, 70° 49.5s W) in 1200 fathoms of water and proceeding at 10 knots on a course bearing approximately 175° T.
Four 1/2 lb TNT-tetryl demolition blocks bound together with marline and friction tape were used as bombs. These bombs were exploded at depths of approximately 40 feet by means of 9 in. non- electric fuses.
The shot signals were received on the ALBATROSS b AX-580 hydrophone suspended at a depth of 250 to 300 f the surface. Plastic floats were attached at regular along the hydrophone cable to reduce the submerged wei system to a small value. In order to further eliminat of the hydrophone through the water due to ship roll, ouajjvuoiun gjsvsui xui uuc iyux u^uunc vv cvo uncut x IJLA, a a
sisted of a 25-foot length of shock cord anchoring the cable to the rail and a 50-foot length of rubber, made inner tube cut and fastened together end to end, eonne a 100-foot slack section in the middle of the hvdronho
y a Brush eet below Intervals ght of the e motion an elastic ystem con- hydrophone of bicycle
cted across ne cable.
SECRET
SECRET - 4 -
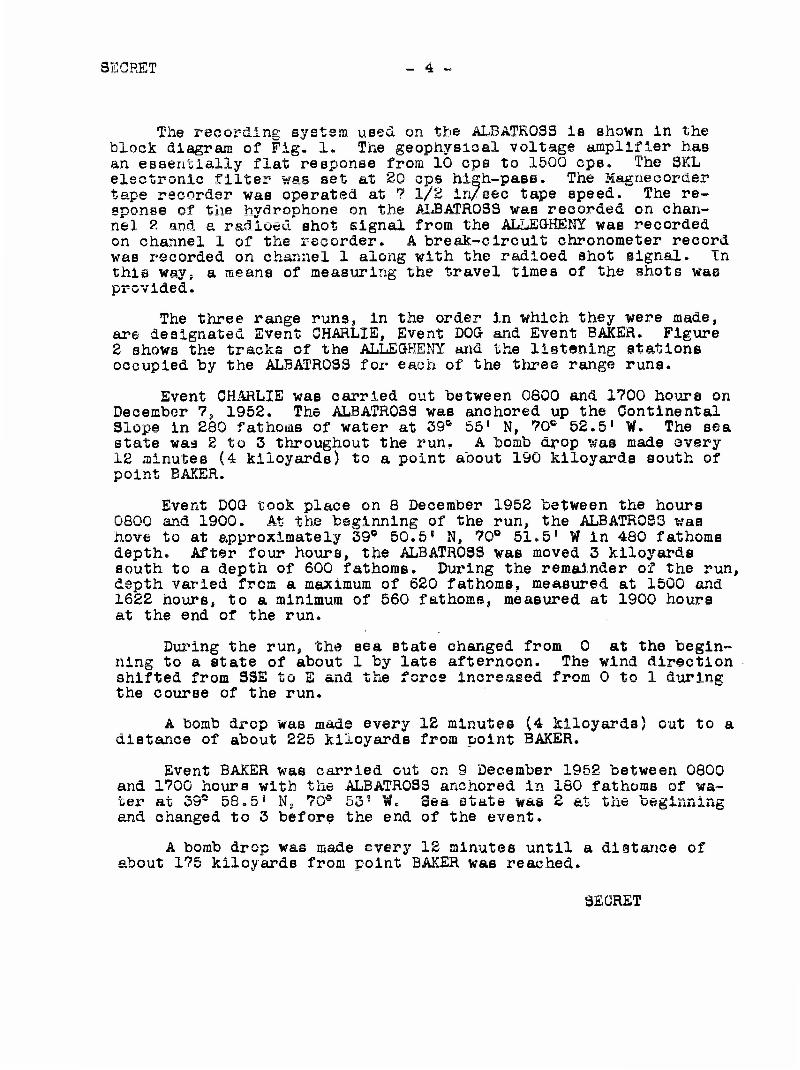
The recording system used on the ALBATROSS Is shown in the block diagram of Fig. 1. The geophysical voltage amplifier has an essentially flat response from 10 cps to 1500 cps. The SKL electronic filter was set at 20 cps high-pass. The Magnecorder tape recorder was operated at ? 1/2 in/sec tape speed. The re- sponse of the hydrophone on the ALBATROSS was recorded on chan- nel 2 and a radioed* shot signal from the ALLEGHENY was recorded on channel l of the recorder. A break-circuit chronometer record was recorded on channel 1 along with the radioed shot signal. in this way. a means of measuring the travel times of the shots was provided.
The three range runs, in the order in which they were made, are designated Event CHARLIE, Event DOG and Event BAKER. Figure 2 shows the tracks of the ALLEGHENY and the listening stations occupied by the ALBATROSS for each of the three range runs.
Event CHARLIE was carried out between 0600 and 1700 hours on December 7, 1952. The ALBATROSS was anchored up the Continental Slope in 280 fathoms of water at 39° 55' N, 70c 52.5' W. The sea state was 2 to 3 throughout the run. A bomb drop was made every 12 minutes (4 kiloyards) to a point about 190 kiloyards south of point BAKER.
Event DOG took place on 8 December 1952 between the hours 0800 and 1900. At the beginning of the run, the ALBATROSS was hove to at approximately 39° 50.5• N, 70° 51.5' W In 480 fathoms depth. After four hours, the ALBATROSS was moved 3 kiloyards south to a depth of 600 fathoms. During the remainder of the run, depth varied from a maximum of 620 fathoms, measured at 1500 and 1622 hours, to a minimum of 560 fathoms, measured at 1900 hours at the end of the run.
During the run, the sea state changed from 0 at the begin- ning to a state of about 1 by late afternoon. The wind direction shifted from SSE to E and the force increased from 0 to 1 during the course of the run.
A bomb drop was made every 12 minutes (4 kiloyards) out to a distance of about 225 kiloyards from point BAKER.
Event BAKER was carried out on 9 December 1952 between 0800 and 1700 hours with the ALBATROSS anchored In 180 fathoms of wa- oer at o» DO. a* i\s 7u
s DO • ft* sea uuaoe was <& au one weginning and changed to 3 before the end of the event.
A bomb drop was made e^rery 12 minutes until a distance of about 175 kiloyards from point BAKER was reached.
SECRET
SECRET
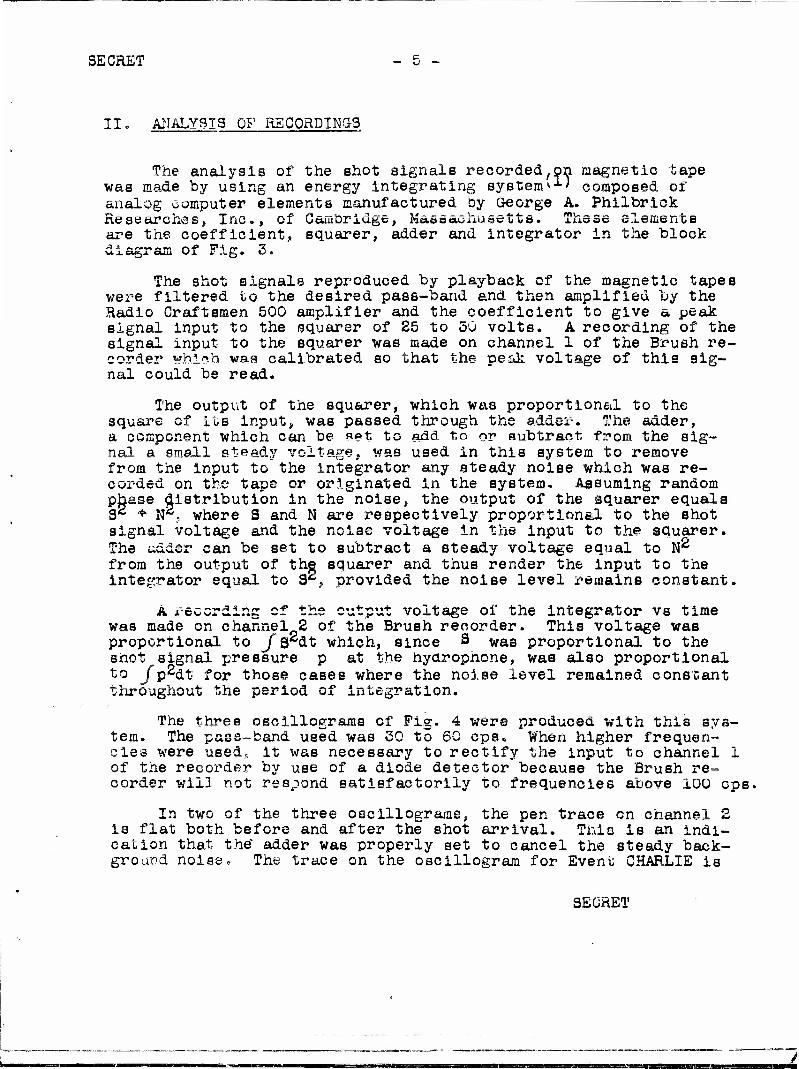
II. ANALYSIS OF RECORDINGS
The analysis of the shot signals recorded,011 magnetic tape was made by using an energy integrating system*1' composed of analog computer elements manufactured by tieorge A. Phllbrick Researches, Inc., of Cambridge, Massachusetts. These elements are the coefficient, squarer, adder and integrator in the block «.Aagram Ox ^ A. g • o«
The shot signals reproduced by playback of the magnetic tapes were filtered to the desired pass-band and then amplified by the Radio Craftsmen 500 amplifier and the coefficient to give a peak signal input to the squarer of 25 to 50 volts. A recording of the signal input to the squarer was made on channel 1 of the Brush re- corder which was calibrated so that the peak voltage of this sig- nal could be read.
The output of the squarer, which was proportional to the square of its input, was passed through the adder. The adder, a component which can be set to add to or subtract from the sig- nal a small steady voltage, was used in this system to remove from the input to the integrator any steady noise which was re- corded on the tape or originated in the system- Assuming random phase distribution in the noise, the output of the squarer equals S2 • N2, where S and N are respectively proportional to the shot signal voltage and the noise voltage in the input to the squarer. The iiddsr can be set to subtract a steady voltage equal to N2
from the output of the squarer and thus render the input to the integrator equal to S2., provided the noise level remains constant.
A recording of the output voltage of the integrator vs time was made on channel 2 of the Brush recorder. This voltage was proportional to J s2dt which, since S was proportional to the shot signal pressure p at the hydrophone, was also proportional to /p^dt for those cases where the noise level remained constant throughout the period of integration.
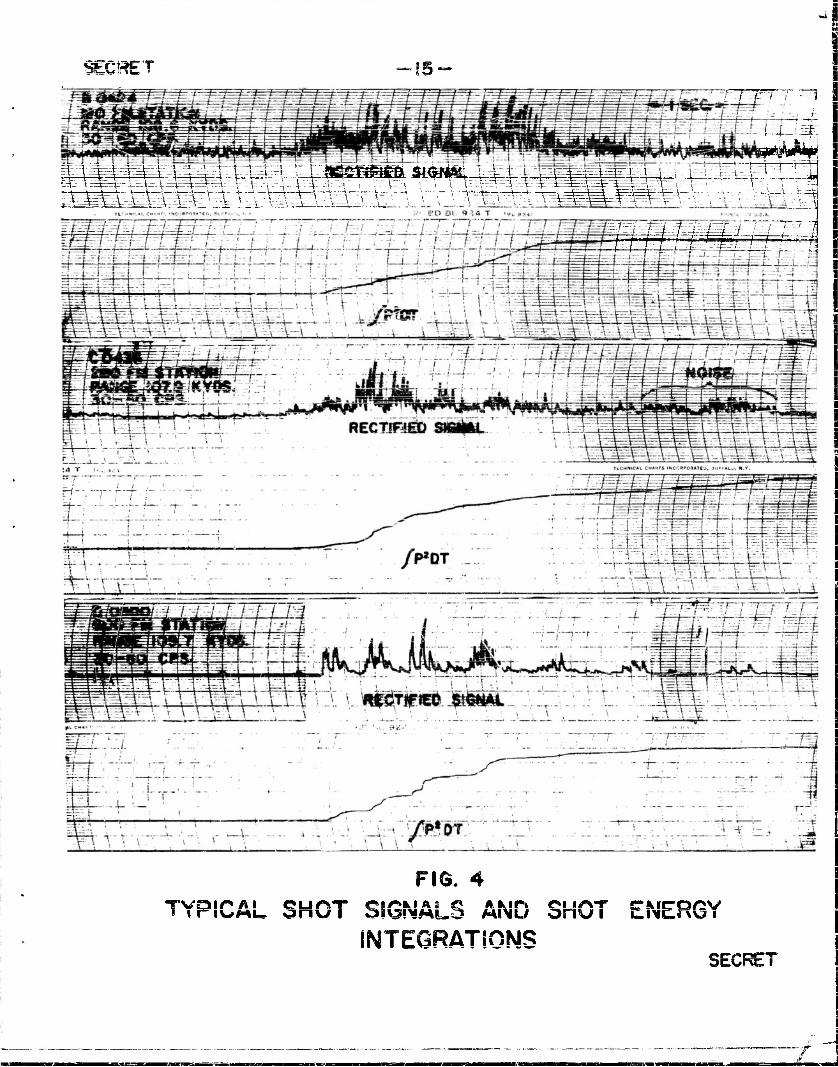
The three oscillograms of Pig. 4 were produced with this sys- tem. The pass-band used was 30 to 60 cps„ When higher frequen- cies were used,, it was necessary to rectify the input to channel 1 of the recorder by use of a diode detector because the Brush re- corder will not respond satisfactorily to frequencies above 100 cps.
In two of the three oscillograms, the pen trace en channel 2 is flat both before and after the shot arrival. This is an indi- cation that the' adder was properly set to cancel the steady back- ground noise. The trace on the oscillogram for Event CHARLIE is
SECRET
SECRET
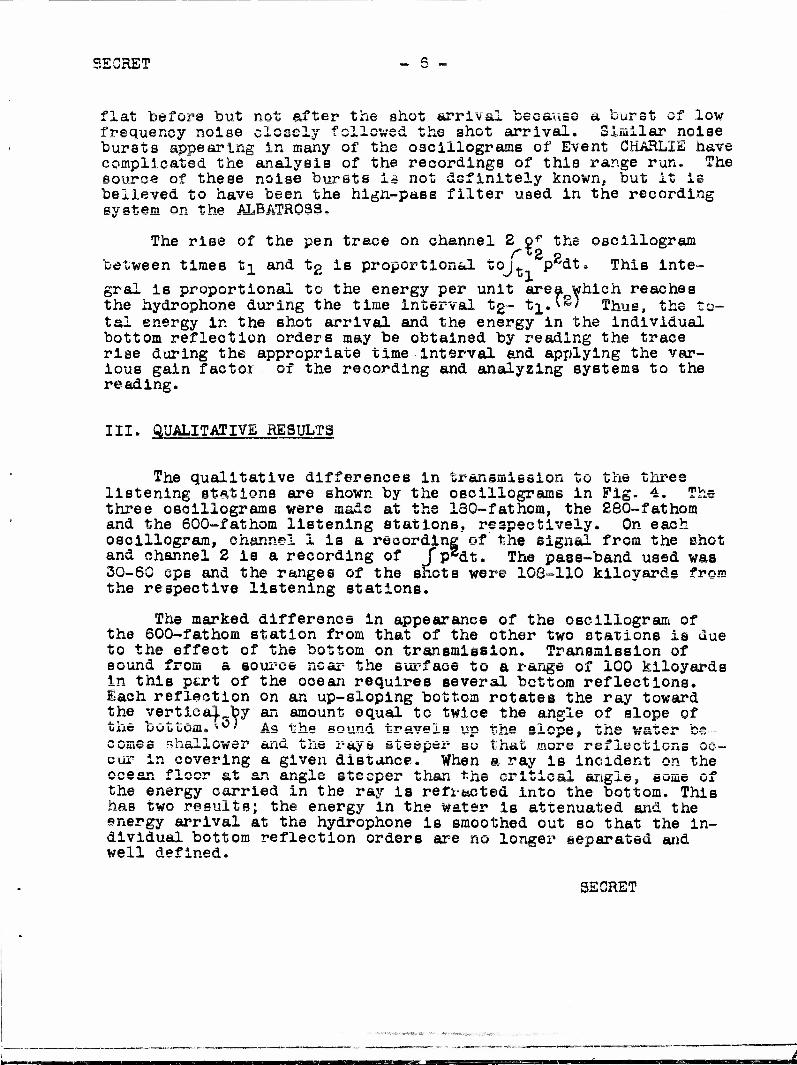
flat before but not after the shot arrival beca-use a burst of low frequency noise closely followed the shot arrival. Similar noise bursts appearing in many of the osclliograms of Event CHARLIE have complicated the analysis of the recordings of this range run. The source of these noise bursts is not definitely known, but it is believed to have been the high-pass filter used in the recording system on the ALBATROSS.
The rise of the pen trace on channel 2 o^ the oscillogram r*2 a
oetween times t^_ and tg is proportional toj^ pfcdt. This inte- gral is proportional to the energy per unit area which reaches the hydrophone during the time interval tg- t^.'^) Thus, the to- tal energy in the shot arrival and the energy in the Individual bottom reflection orders may be obtained by reading the trace rise during the appropriate time Interval and applying the var- ious gain factor of the recording and analyzing systems to the reading.
III. QUALITATIVE RESULTS
The qualitative differences in transmission to the three listening stations are shown by the osclliograms in Fig. 4. The three osclliograms were made at the 130-fathom, the 280-fathom and the 600-fathom listening stations, respectively. On each oscillogram, channel I is a recording of the signal from the shot and channel 2 is a recording of fp2dt. The pass-band used was 30-60 eps and the ranges of the shots were 108-110 kiloyards from the respective listening stations.
The marked difference in appearance of the oscillogram of the 600-fathom station from that of the other two stations is due to the effect of the bottom on transmission. Transmission of sound from a source near the surface to a range of 100 kiloyards in this pert of the ocean requires several bottom reflections. Each reflection on an up-sloping bottom rotates the ray toward the vertically an amount equal to twice the ansrle of slope of OXAB U(J b U QXQU ' ~ ' A3 tnp Hniinn "n-navein isr> f.ina a i n«o tha WDTISVI pie .
— — — — —— -!- '— —• *»»*>*• -»* — — ^^> • •— —: w ^«t jU> V AA'? B* «•• *^ US V S U -J>V T» SA V V A 1** **
cur in covering a given distance. When a ray is incident on the
the energy carried in the ray is refracted into the bottom. This has two results; the energy in the water is attenuated and the energy arrival at the hydrophone is smoothed out so that the in- dividual bottom reflection orders are no longer separated and well defined*
SECRET
SiiGKkT - 7 -
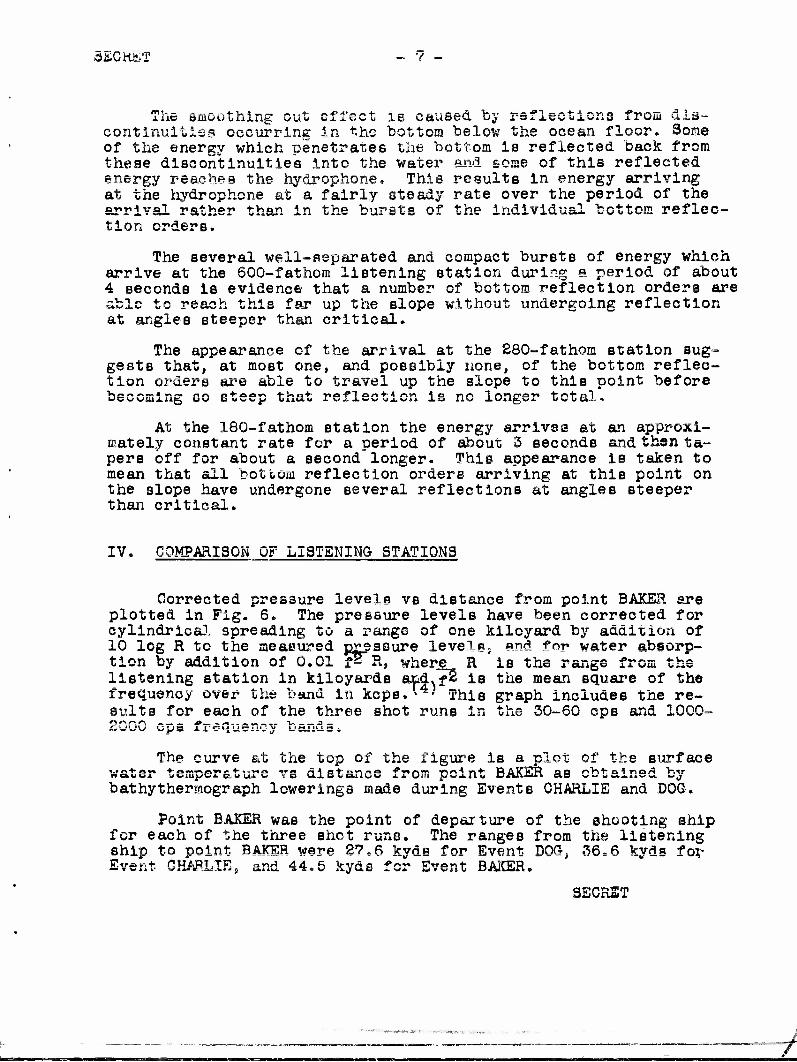
iiic SmOOthxng Ouu ©ifoCu IB 0&US6Q. Uj i'SiicCuiCTi8 continuities occurring in the bottom below the ocean floor. Some of the energy which penetrates the bottom is reflected back from these discontinuities into the water and. some of this reflected energy reaches the hydrophone. This results in energy arriving at the hydrophone at a fairly steady rate over the period of the arrival rather than in the bursts of the individual bottom reflec- tion orders.
The several well-separated and compact bursts of energy which arrive at the 600-fathom listening station during a period of about 4 seconds is evidence that a number of bottom reflection orders are able to reach this far up the slope without undergoing reflection at angles steeper than critical.
The appearance of the arrival at the 280-fathom station sug- gests that, at most one, and possibly none, of the bottom reflec- tion orders are able to travel up the slope to this point before becoming so steep that reflection is no longer total.
At the 180-fathom station the energy arrives at an approxi- mately constant rate for a period of about 3 seconds and then ta- pers off for about a second"longer. This appearance is taken to mean that all bottom reflection orders arriving at this point on the slope have undergone several reflections at angles steeper than critical.
IV. COMPARISON OF LISTENING STATIONS
Corrected pressure levels vs distance from point BAKER are plotted In Fig. 6. The pressure levels have been corrected for cylindrical spreading to a range of one kiloyard by addition of 10 log R to the measured pressure levels; and for water absorp- tion Vw a#ri 1 * 4 r\r> O'f O 0"! VS H «irWsr»<» ® * a *Via ~~~~« f«inm *->-.*» listening etation in klloyards arid.^S is the mean square of the frequency over the band In kcps.«4- This graph includes the re- sults for each of the three shot runs in the 30-60 cps and 1000- r\t*r.r\ _ x>„... -. „ „ „ v. a_
The curve at the top of the figure is a plot of the surface
bathythermograph lowerings made during Events CHARLIE and DOG.
Point BAKER was the point of departure of the shooting ship for each of the three shot runs. The ranges from the listening ship to point BAKER were 2?*6 kyds for Event DOG, 36=6 fcyds for V.tja v\ *• PUiiRT.Tir nn/4 AA C VMO -Pr>~ Pira^f R AirCD
SECRET
SECRET - 8 -
Since the pressure levels have been corrected fox1 spreading and for water absorption, differences in pressure levels between any two listening stations must be attributed to the effects of bottom and surface reflections which occur between the two sta- tions.
On the average, these differences between the 480—fathom and the 280-fathom listening stations amount to no more than 3 db in both the 30-60 ops band and the 100G-200C cps band. The range dif- ference between these two stations is about S ky&e. For a range difference of about 9 kyds, the differences In pressure levels be- tween the 280-fathom and the 180-fathom listening stations are about 6 db in the 30-60 cps band and about 9 db in the 1000-2000 cps band.
This indicated increase in the rate of energy loss as the sound travels further up the slope Is in agreement with the qual- itative conclusions regarding the effect which an upward sloping bottom will have on sound propagation.
The 280-fathom listening station appears to have been at about the limltj °r slightly beyond the limit, of distance up the slope for which there can be a ray path from ** shallow source well out in, deep water which will not undergo at least one bottom reflection at an angle which is steeper than th? critical angle. Certainly the appearance of the arrivals at the 180-fathom listening station gives evidence that sound energy reached this station only after under- going one or more partial reflections from the bottom
V. FREQUENCY DEPENDENCE OF TRANSMISSION
A comparison of the pressure levels in each of the five octave bands between 60 cps and 2000 ops with those for the 30-=60 cps band is made in the graphs of Fig. ? for the shots of Event DOG. The curves of this figure are plots of the pressure level differences between the octave band in question and the 30-60 cps band vs range from the listening station.
The pressure level differences between the 60-120 c^s band and the 30-60 cps band remain approximately constant for the shots in the range interval 30 kyds to 115 kyds and then falls by about 2 db between 115 kyds and 145 kyds. For" the 125-250 cps band, ""the"levels increase relative to those of the 30-60 ops band by about 5 db as the range Increases from 30 to 115 kyde and then drop about 6 db in the next 30 kyds. The three octave bands between 250 and 2000 cps show slowly decreasing pressure levels relative to those for the SO- SO cpa band as the range increases from 30 to 115 kyda and rapidly falling levels between 115 and 145 kyds.
SECRET
SECRET - 9
This dependence of pressure level-range relationship on fre- quency is attributable to the effects of transmission by surface sound channel and leakage paths. In the octave bands above a fre- quency of 125 cps, a significant amount of sound energy will reach the hydrophone by transmission along such paths. Below this fre- quency,, sound energy is rapidly attenuated in the surface sound channel because the wavelengths are large compared to the depth of the channel.
The attenuation of sound energy by reflection from the bottom increases with increasing frequency. Thus, as the frequency rises, the fraction of the energy reaching the hydrophone by direct bottom reflection paths decreases and the fraction by surface sound chan- nel and leakage paths increases.
This effect is shown qualitatively by the oscillograms of Fig. 8, where the signals of the energy arrivals at the hydrophone in the six octave bands between 30 and 2000 cps have been recorded by a Brush recorder. The signals have been rectified for frequen- cies above 50 cps.
The travel time along a path which involves the surface sound channel is shorter than that along any direct bottom reflection path. For all frequencies above i£5 cps, there is a prominent en- ergy arrival which precedes the first energy arrival in the 30-60 cps band by almost one-half second. Certainly this energy has traveled by a path which involves the surface sound channel. In the 1000-2000 cps band, this early arrival constitutes the major part of the total energy.
The levels of the 125-250 cps band rise relative to those for the 30-60 cps band in the range interval 30 to 115 kyds because these frequencies combine relatively good surface sound channel transmission with relatively low attenuation by bottom reflection. Between the ranges 115 and 145 kyds, the shooting ship was enter- ing a body of water associated with the Gulf Stream. 'The temper- ature of the water at the surface rose from 59° F to 67° F and the surface sound channel largely disappeared. The 6 db drop in the levels of the 125-250 cps frequency" band relative to those of the 30-60 cps band between 115 and 145 kyds represents the disappear- ance of the surface sound channel contribution to the energy reach- ing the hydrophone.
The still sharper drop in the relative levels of the higher frequencies shotvs how dependent transmission of these frequencies is on the surface sound channel.
SIP ft T3 IP m
SECRET
VI. BOTTOM REFLECTION LOSSES
In the shot arrivals at the 600-fsthom station, the various bottom reflection orders are well separated and it is possible to measure the energy of each order. Figure 9 is a plot of the cor- rected pressure levels vs range for the individual bottom reflec- tion orders for the 30-60 cps frequency range. These pressure levels have been corrected for spherical spreading by addition of 20 log R to the measured levels, where R is the range in klloyards.
The complicated bottom in this area makes it impossible to identify the bottom reflection orders unless the range run was com- menced at a sufficiently short range that the bottom reflection of order one appeared, i.e., sound could reach the hydrophone after undergoing only one reflection from the bottom The range at which this run started was certainly too large for this to be"possible. Since numbers could not be assigned to the bottom reflection or- ders, they have been designated C, D, E, F, G-, and H in Fig. 9.
The results as plotted in Fig. 9 are consistent with sere loss for bottom reflections at angles more grazing than the crit- ical angle, but are not consistent with a loss of more than 0.25 db/reflection.
_ , __ _.,., llv j 0} have reported values for bottom reflec- tion losses from similar experiments in the same general area. They report losses of 1 db/reflection in the frequency range 50-100 cps, 2 db/reflection for 100-200 cps, 3 db/reflection for 200-400 cps, 4 1/2 db/reflection for 400-800 cps and 6 1/2 db/reflection for 800-1600 cps. The very low value of loss for the 30-60 cps range given by this study is consistent with these V/oods Hole Oceano- graphic Institution values.
Scatter of the data for the 60-120 cps frequency band makes it difficult to determine a reflection loss value for this fre- quency. The data are consistent with a value as low as 0.6 db/ rerieCuion or «.o xixgu »o i«i uD/j'eixeuoion.
For frequencies stove 125 cps, the complicated nature of the propagation mates it impossible to determine a reflection loss value with any assurance from the data of this study.
VII. SUMMARY AND CONCLUSIONS
A study has been made of the transmission of sound up a sloping ocean bottom from explosive sources near the surface to listening stations in shallow water over the Continental Slope at a point south of Montauk Point, Lone: Island.
SECRET
SECRET - 11 -
Measurements of pressure level as a function of range wer-e made at three listening stations located at three different depths of water.
Analysis of these measurements has shown that sound trans- mitted up a sloping bottom is attenuated at a rate wrhich increases as the sound travels further up the slope. This effect is attribu- ted to the progressive steepening of the rays by reflections from the up-sloping bottom and the resulting loss of energy by refrac- tion into the bottom when the sound becomes incident on the bottom at angles steeper than critical*
Data taken at a station in 600 fathoms of water have yielded limiting values of bottom reflection lessee on the Continental Rise for angles of reflection more grazing than critical which are in general agreement with values obtained by WH0l(5^ in the same area=
ACKNOWLEDGMENTS
Members of the Hudson Laboratories staff who participated in the field operations or assisted in analysis of data were A.Berman, R. 0. Carlson, R. A. Frosch, A, N. G-uthrie, H. H. Lo&r, J. E= Nafe, and J. Northrop,
REFERENCES
1. Officer, C. B., Jr., and Dietz, F. T. Total energy computations. In Sonar research conducted during the period January 1, 1953 - March 31, 1953. Woods Hole Oceanographic Institution, Refer- ence no. 53-45. June, 1953. pp 5-6. (0)
2. Frosch, R. A. G-uthrie, A. N. Loar, H. H., ana Poss, H. L. A preliminary report on eound transmission at San Juan, Puerto it.i.vw. guj.uu:Uj.a uiu vci oxoja nuu-jua jjot/ui nuvj. ica, iEwiuixugu i B-
port no. 12. October 1, 1953. (3)
3. Officer,, C. B., Jr., and Hersey, J. B. Sound transmission from deep to shallow water. Woods Hole Oceanographic Institution Q o-P c» »•> e» n ,-> o -r\<-\ R.T-TO iinTtiat lO^S A *w X W X %> * *. w w i A *~> . *-* w— WfM. rf\\\>i F-, n fe< w , .k **/ \s **• o
4. Urick, R. J. Recent results on sound propagation to long ranges in the ocean* U. 3. Navy Journal of Underwater Acoustics. 1(23)5 57-63. April, 1951. (SJ
—•* /
SECRET ~!2-
z < X
u; 2 O
o or o
UJ
2 <
O
1
i SJJ 73
Ir, UJ-r
it a ; s »=
<M
2 2 < X u
9 2 UJ O °P.T id «> :J 2 ^- Q.
'« 1
OflC 5 u Sir. X 5E O *
* *
111
0 -^
O UJ < O CC UJ
tr
Csi
_J UJ
X o
_J
O UJ QJ
> < u. X H• _j Q- ?> Q- UJ > ^ o
u. _ a T-
_J u. UJ </i
*r: h- c3 CO _J 0 CM
0 2 ^ m UJ
1 UJ u. X 2 < O -J
CA> O < DO: su £E O K «•* >- O.
00
GQ
<
CO
Q UJ 00
LJ A
CO
o
o 0^
SECRET
SECRET -o-
^
H) / .
/
—\00
j ©-EVENT BAKER-
rwei!T nrtA /---. °~C.VENT CHARLic
\~
tVLN I LfUU l**OW"\
JV^ \y
UJ \/500-'-|_
roooy
.-POINT BAKER .
(-"
/
39° N A
FIG. 2
TRACKS OF ALLEGHENY AND LISTENING STATIONS OF ALBATROSS HI FOR THE THREE SHOT RUNS OF OPERATION 12
EVENT CHARLIE EVENT DOG EVENT BAKE.R
- 7 DEC. 1952 - 8 DEC. 1952 - 9 DEC. 1952
"--38s
MERCATOR PROJECTION CONTOURS IN FATHOMS
-v-v-\ \X/\—1800
SECRET
!4-
r wm.a cr O g i rv»
k£» «==7 CL QC 0. UJ o_
QC
UJ < < CO 3
O -< Q
O <
to
1 -^
GA
P
)EFF
ICIE
VJ1
o QC ; cvs UJ
CO g i UJ i £! -J UJ •ZL 3 o ! fe < Q3 JjJ 9 <
ro oc S o < !
T"
""I5 i
CD or ««••» _J w LL_
fO — Li.
i QC rvt ! UJ
! Q _ ^ _l iCZuJ _i UJ j o °? H UJ 2 O 1 —, :z Z UJ }X) -J 'Z < ' z t" & < x o Q- 5S X u < < f 1
j *c;
I
! QC CvJ ' UJ _J
! O X < _! QC < O . _J
NIN
E
EC
O
5-B
IN IT
UJ 2 rr < ; z^ £ -»
X ; O Q_ ^ < X o !< £ o
• i^
CO
o X if)
QC O
UJ
c/) if)
CD
<
UJ
>- CD cr UJ
SECRET
*dFf*tae"T —«='** ri lb •
rj ^"-i-: f- 1
~t—*-•*=
•t :t--. t 1. .-i - -i T-H 1 ' 1 1 i
^
Wt^^^^H
FIG. 4
TYPICAL SHOT SIGNALS AND SHOT ENERGY INTEGRATIONS
SECRET
<> rv» m er T -16-
i Q o
isz>
o
?j z
o
Q K
O < •O >• - O
o o z 00 <
<n
.o.
o
2-
•o-
o
CO
o
O m
o u
o
o Q
LU O
O U-
in
UJ
Z>
S33d930 Nl 319NV
SECRET
-y
U4 g
3
Q
< >- O .-I
K Ui
< m
o a.
2 O K
o
(j0) dridl 3DVdUnE ,WD/ 3NAQ I 3A09V 90 I'd i 100 + d 001 01 *• JP <J / Oil
"13A3"! 3«nSS3dd Q3103HU03
Jc awai 83IVM jo sowans 0NV8 3A3T 3anSS3Hd 3A08V 90 SECRET
SECRET -19-
i zoo F£rm*4&
FREQUENCY FIG. 8
DISTRIBUTION OF SHOT SIGNAL
ENERGY IN
SECRET
— 9Cl~
i
DISTRIBUTION Ll.TT
PROJECT MICHAEL REPORTS
Copy Ho. Addresses
'--13 Chief cf Naval research (Cede 486} Navy Department Washington 25, D. ','.
• i DirsKtor Naval Research Laboratory (Dr. H. L. Sarton, Code 5500) Washington 20, U C.
-^ Executive Secretary Committee on Undersea Warfare national Research Council 2101 Constitution Avenue NW Washington 25, D. C.
Via: Contract Administrator Southeastern Area Office of Naval Research 2110 G Street NW Washington, D. C,
& Commanding Officer h Director U, S. Navy Underwaier Souid Laboratory
New London, Conn.
I7 Director Marine t-i.ysical Laboratory rrn'vprslty of California
V i a: Commanding Office* & Director U; 8, Navy Electronics Laboratory Point Loma San Diego 52, California
1" Commanding Officer k Director U. S. Navy Fi.rt.'Or/^T, Laboratory I ftint Urns* San Diego 52, California
1*J Director IT, St Navy Underwater Sound Reference Laboratory P. O, Box 3G29 Orlando, Florida
'•'.0 Commander U. P, Naval Ordnance Laboi-tdorv (Atm: Dr. S, L. SnavelyJ Whtt* Oak Silver Spring, Md.
21 Commander U. S. Naval Air Development Center lohnsvH)**i Ronn.
22-23 Chief oi N&vi*. Operations (Op-316) Navy Department Washington 25, D. C.
M Commanding Officer Office of Naval Research Branch Office 1030 E. Green St. PacatlWS' ', California
25 commanding Officer Office of Naval Research branch Office 1000 Geary St, San Francisco, California
2(~ Commanding Officer Office of Navil Research Branch Office Tenth Floor - johr Crerar Library Building 8(3 t,. Randolph St. Chicago 1. Dlinots
on i-»srrir:,3«/4t«n Officer
Surface Anti-Subm^-'.h-; Development Detachment U. S. Atlantic Fleet U. S, Naval St3tion Key West, Florida
Copy No. Addroi=5es
30 Commander Submarine Force U. S. Pacific Fleet Fleet Post Office San Francisco, California
Copy No,
31 Commanding Officer and Director David Taylor Model 3asin (Attn: Mr. M. Lasxy) Washington 7, D. C.
32 Commanding General Headquarters, Air Force Washington 25, D. C.
33 Commanding Officer Signal Corps Engineering laboratory Squler Signal Laboratory Fort Monmouth N. J.
:\A
Commanding Officer Office of Naval Researcr. Branca Oiiice Navy No. 100 Fieet Post Office New York, New York
Commander Submarine Force U. C. Atlantic Fleet V. S. Naval Submarine Base Bex 27 H '« Lor.jcn, Conn.
U. S. Naval Crdricr.:? Tesl Station Pasadena Annex 3202 E. raeuan BWB. Pasadena e. California
;io-^« Chief, tureay of Ships Navy Department Wa^ijng.on I.!:, D. C.
Code bit Code t20 Code 3"?: Cod. BIB
39 Clef, Bureau of Aeronauii Navy DepBrtmrn' Washington 2L, D. C.
40 Chief, Buzeai; cf OrfsKBC* Nkvy Department W9?r."r1:-" 2f„ O. C.
Addresses
Oiiice vl Naval Research Resident Representative University of Michigan 4008 Administration Building Ana Arbor, Michigan
For transmiUal to: Mr. R. N. Heinme Engineering Research InstltuTft University of Michigan Ann -Arbor, Michigan
Dr. J. R. Frederick Engineering Research taottuUi University of Michigan Ann Arbor, Michigan
Commanding Officer Office of Nr>val Research Branch Ofi'ice 150 Cause*ay Street Boston, Mass.
For transmiUal to: Research Analysis Group Brown University Providence, R. I.
Director Woods Hole Oceanographk: Institution Woods Hole, Mass. {Attn: Dr. J. B. Horsey)
Dr. F. V. Hunt Harvard University
_fi0 Columbia i^ver^i:1/ HuiitrX..-. - ^boraiories Dobbs Ferry, Ne* York
Commander in Chief U. S. Atlantic K^et
42 Commander 0;«?rationa, Ufwt*-i**P*n«aJ ' U. S. Atlantic Fie* Fiee» Post C'f'.'e Branch Norfolk 11, Virginia
Commander in Chief U. B Pacific Fleet Fleet Post Office San Frenclnco. California
JiohmMl flrouD ii Con.manJer Sufc&i&rise D*v \). 3. Naval Submarine Baa< Box 70 Nt* London, Conn.
Office of Naval Pesearcr; Sranch '•'.'.'. >-4b' Broadway New York i3. New York
4 copies foi- tra-TLr,r.':'*t£l tc: Bell Telephone Laboratories Murray Hill, New Jersey (Attn: v&i. L. W. Stengel)
Bell Telephone laboratories Whippany, New jersey (Attn: Mr. ]. F. Han)
Di rector Lamont Geological C\ Torrey Cliff Palisades, New York
servatcry
Director Edwards Street Laboratory Yale University Box 1916 Yale Station New Hav.-.:i, Conn, (Attcr Erof. L. W. McKeehan)