time series prediction of stock market data by … · time series prediction of stock market data...
TRANSCRIPT
International Journal of Scientific & Engineering Research, Volume 7, Issue 3, March-2016 144 ISSN 2229-5518
IJSER © 2016 http://www.ijser.org
Time Series Prediction of Stock market data by using Chaos theory and Neural Network
M.Dhanalaxmi1, CSE Department, Sri Sivani College of Engg, Chilakapalem, Srikakulam
Asst.prof, Department of CSE, [email protected]
B.Chakradhar2 CSE Department, Sri Sivani College of Engg, Chilakapalem, Srikakulam
Asst. Prof., Department of CSE [email protected]
B. Sreedhar3 CSE Department, Sri Venkateswara College of Engg, Northrajupalem, Nellore
Sr.Asst. Prof. , Department of CSE [email protected]
Abstract— Time series analysis is one of important issues in science, engineering, and so on. Up to The present statistical methods such as AR model and Kalman filter have been successfully applied however, those statistical methods may have problems for solving highly non-linear problems. In this paper, an attempt is made to develop practical methods of non-linear time series by introducing such Soft Computing technique as Chaos theory, Neural Network. Using the stock market data input to various models the applicability and accuracy of the proposed methods are discussed with comparison of results. Keywords: Perceptron, Forecasting, Time series
1. INTRODUCTION:
1.1. INTRODUCTION TO FORECASTING:
Investing in stocks is one of the easy money making in short duration. Even though with high risk, every investor wants to make profit by investing a good amount of money in share market. As investors are investing more and more money in the market, they are very much concerned to know the future trends of an assortment of stocks available in the market. The major part of the trends in the market is to know when to buy, hold or sell the stocks. Thus, many models have been illustrated to provide the investors a correct trend of predictions. Researchers are showing a lot of interest towards the stock market forecasting. Traditionally, the
various statistical models have been introduced for forecasting the stock index. Traditional statistical models cannot be used to track the complexity of the market behaviour and economic theory. Investigations done by the researchers on traditional methods suggested that the prediction of financial time series fails because the stock markets are highly non-linear (change with time) and non-stationary (dynamic). Search methods are still on to address these shortcomings. Market analysts and academicians in finance, economics and business have begun to investigate the tools of computational intelligence, including nonlinear methods that incorporate machine learning and other advanced computational technologies. To increase the capability of capturing the non-linear patterns and the accuracy of economic forecasting, ANN is being used in several applications. A major benefit of neural networks is that it incorporates prior knowledge in ANN to improve the performance of stock market prediction. It also allows the adaptive adjustment to the model and nonlinear description of the problems Forecasting is the process of making statements about events whose actual outcomes (typically) have not yet been observed. A commonplace example might be estimation of some variable of interest at some specified future date. Prediction is a similar, but more general term. Both might refer to formal statistical methods employing time series, cross-sectional or longitudinal data, or alternatively to less formal judgmental methods. Usage can differ between areas of application: for example, in hydrology, the terms "forecast" and "forecasting" are sometimes reserved for estimates of values.
IJSER
International Journal of Scientific & Engineering Research, Volume 7, Issue 3, March-2016 145 ISSN 2229-5518
IJSER © 2016 http://www.ijser.org
2. Time Series Prediction by Chaos Theory The prediction of chaotic time series has been used to stock finance, electricity load forecasting, geological environment, weather forecasting. Support Vector Machine (SVM) is new machine learning based on statistical theory. It can solve Small -sample, non-linear and high dimension problems by using structural risk minimization (SRM) instead of empirical risk minimization (ERM). Its stronger generalization ability and very good application potentiality has been shown in classification and regression. The key parameters of support vector machine are very important; the accuracy of classification or regression is determined by a group of appropriate parameters.
The definition of Chaos is done by several researchers, and generally speaking, Chaos is the phenomenon which is “non-periodic vibration governed by a deterministic system”. The deterministic system means the system governed by a definite constant rule. And the non periodic vibration means the movement which entirely acts randomly. Thus, deterministic Chaos is considered as a phenomenon which behaves irregularly at a glance but is governed by a definite deterministic rule. Chaos optimization:
Chaos systems have special characters such as the ergodic property, stochastic property and sensitivity dependence on initial conditions of chaos. One-dimensional Logistic map is usually applied to chaos optimization algorithm. The formula for finding the prediction in chaos theory:
)1(*1 nnn XXrX −=+ Here we supply a X0 value then the formula
gives the X1 value. X1 value gives the X2 value and so on. And this is depends upon the parameter r.
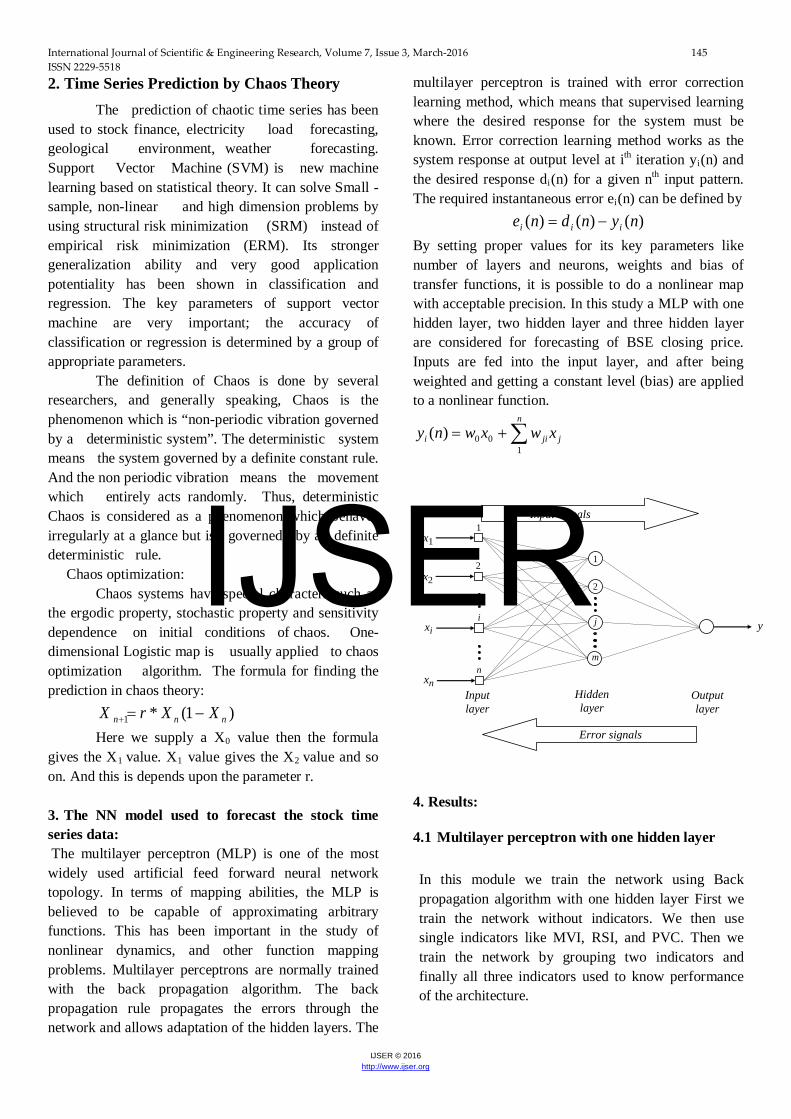
3. The NN model used to forecast the stock time series data: The multilayer perceptron (MLP) is one of the most widely used artificial feed forward neural network topology. In terms of mapping abilities, the MLP is believed to be capable of approximating arbitrary functions. This has been important in the study of nonlinear dynamics, and other function mapping problems. Multilayer perceptrons are normally trained with the back propagation algorithm. The back propagation rule propagates the errors through the network and allows adaptation of the hidden layers. The
multilayer perceptron is trained with error correction learning method, which means that supervised learning where the desired response for the system must be known. Error correction learning method works as the system response at output level at ith iteration yi(n) and the desired response di(n) for a given nth input pattern. The required instantaneous error ei(n) can be defined by
)()()( nyndne iii −= By setting proper values for its key parameters like number of layers and neurons, weights and bias of transfer functions, it is possible to do a nonlinear map with acceptable precision. In this study a MLP with one hidden layer, two hidden layer and three hidden layer are considered for forecasting of BSE closing price. Inputs are fed into the input layer, and after being weighted and getting a constant level (bias) are applied to a nonlinear function.
j
n
jii xwxwny ∑+=1
00)(
Input layer
xi
x1
x2
xn
1
2
i
n
Output layer
y
Input signals
Error signals
Hidden layer
1
2
j
m
4. Results:
4.1 Multilayer perceptron with one hidden layer
In this module we train the network using Back propagation algorithm with one hidden layer First we train the network without indicators. We then use single indicators like MVI, RSI, and PVC. Then we train the network by grouping two indicators and finally all three indicators used to know performance of the architecture.
IJSER
International Journal of Scientific & Engineering Research, Volume 7, Issue 3, March-2016 146 ISSN 2229-5518
IJSER © 2016 http://www.ijser.org
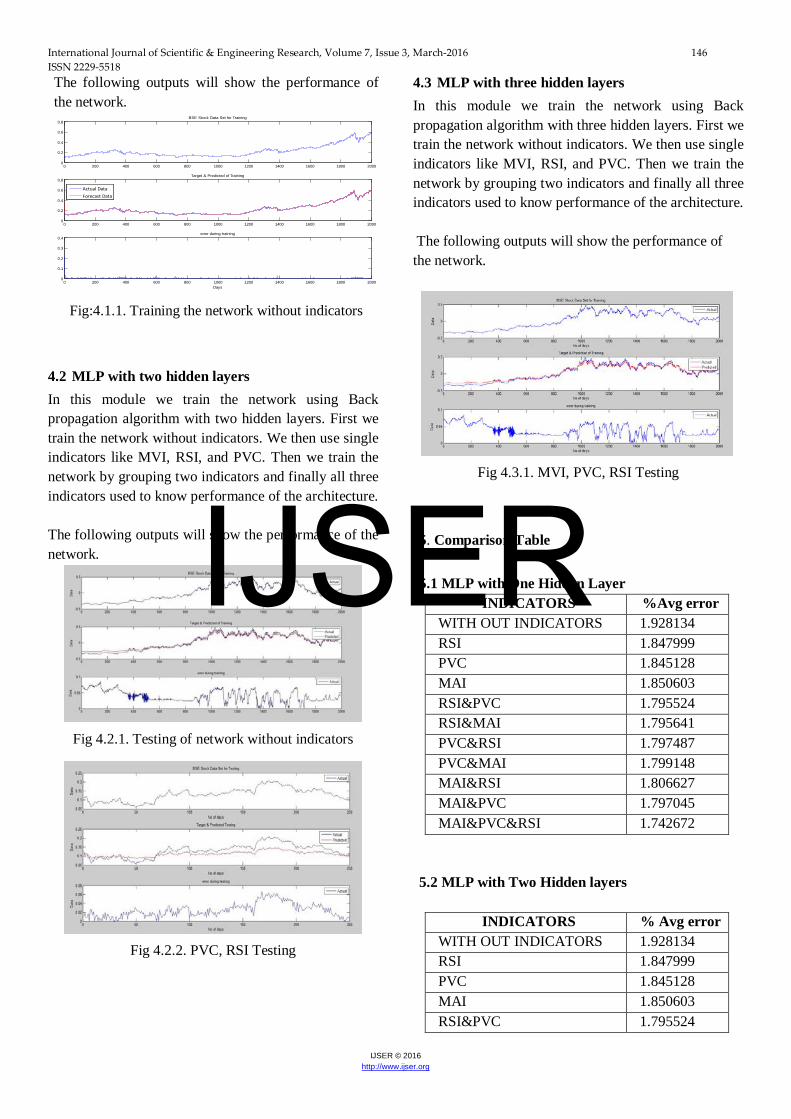
The following outputs will show the performance of the network.
Fig:4.1.1. Training the network without indicators
4.2 MLP with two hidden layers In this module we train the network using Back propagation algorithm with two hidden layers. First we train the network without indicators. We then use single indicators like MVI, RSI, and PVC. Then we train the network by grouping two indicators and finally all three indicators used to know performance of the architecture.
The following outputs will show the performance of the network.
Fig 4.2.1. Testing of network without indicators
Fig 4.2.2. PVC, RSI Testing
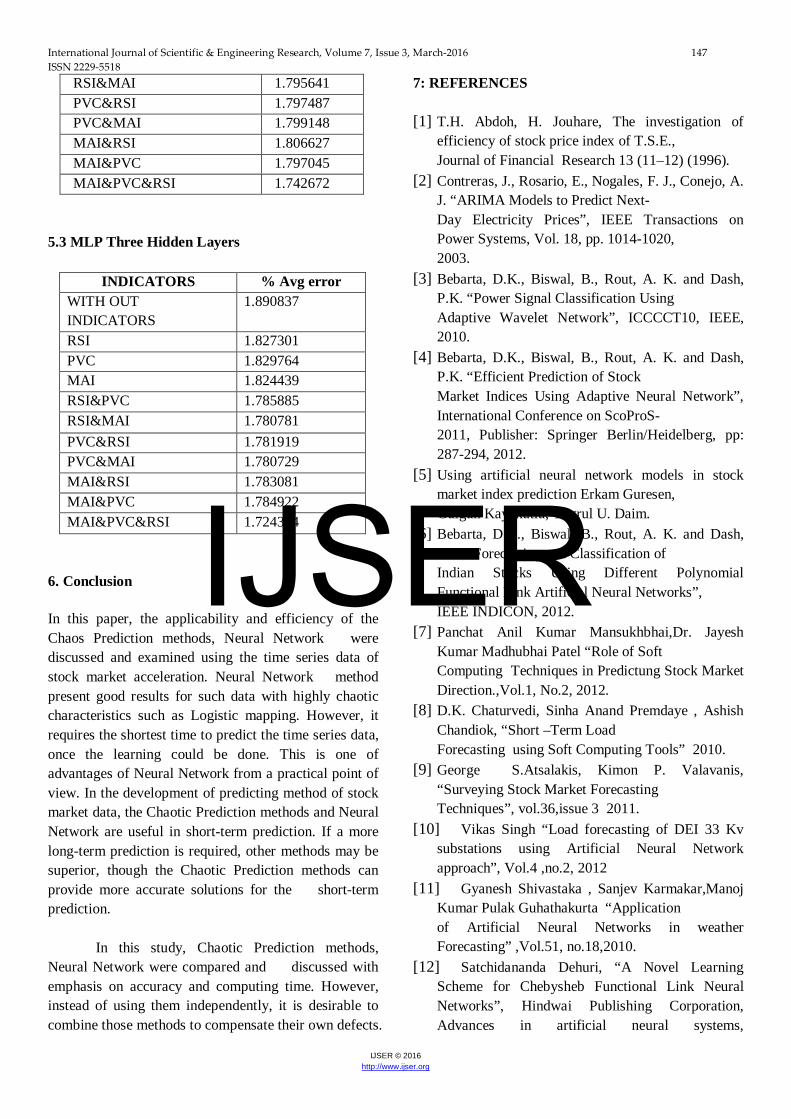
4.3 MLP with three hidden layers In this module we train the network using Back propagation algorithm with three hidden layers. First we train the network without indicators. We then use single indicators like MVI, RSI, and PVC. Then we train the network by grouping two indicators and finally all three indicators used to know performance of the architecture. The following outputs will show the performance of the network.
Fig 4.3.1. MVI, PVC, RSI Testing
5. Comparison Table 5.1 MLP with One Hidden Layer
INDICATORS %Avg error WITH OUT INDICATORS 1.928134 RSI 1.847999 PVC 1.845128 MAI 1.850603 RSI&PVC 1.795524 RSI&MAI 1.795641 PVC&RSI 1.797487 PVC&MAI 1.799148 MAI&RSI 1.806627 MAI&PVC 1.797045 MAI&PVC&RSI 1.742672
5.2 MLP with Two Hidden layers
INDICATORS % Avg error WITH OUT INDICATORS 1.928134 RSI 1.847999 PVC 1.845128 MAI 1.850603 RSI&PVC 1.795524
0 200 400 600 800 1000 1200 1400 1600 1800 20000
0.2
0.4
0.6
0.8BSE Stock Data Set for Training
0 200 400 600 800 1000 1200 1400 1600 1800 20000
0.2
0.4
0.6
0.8Target & Predicted of Training
0 200 400 600 800 1000 1200 1400 1600 1800 20000
0.1
0.2
0.3
0.4error during training
Days
Actual DataForecast Data
IJSER
International Journal of Scientific & Engineering Research, Volume 7, Issue 3, March-2016 147 ISSN 2229-5518
IJSER © 2016 http://www.ijser.org
RSI&MAI 1.795641 PVC&RSI 1.797487 PVC&MAI 1.799148 MAI&RSI 1.806627 MAI&PVC 1.797045 MAI&PVC&RSI 1.742672
5.3 MLP Three Hidden Layers
6. Conclusion
In this paper, the applicability and efficiency of the Chaos Prediction methods, Neural Network were discussed and examined using the time series data of stock market acceleration. Neural Network method present good results for such data with highly chaotic characteristics such as Logistic mapping. However, it requires the shortest time to predict the time series data, once the learning could be done. This is one of advantages of Neural Network from a practical point of view. In the development of predicting method of stock market data, the Chaotic Prediction methods and Neural Network are useful in short-term prediction. If a more long-term prediction is required, other methods may be superior, though the Chaotic Prediction methods can provide more accurate solutions for the short-term prediction.
In this study, Chaotic Prediction methods, Neural Network were compared and discussed with emphasis on accuracy and computing time. However, instead of using them independently, it is desirable to combine those methods to compensate their own defects.
7: REFERENCES
[1] T.H. Abdoh, H. Jouhare, The investigation of efficiency of stock price index of T.S.E., Journal of Financial Research 13 (11–12) (1996).
[2] Contreras, J., Rosario, E., Nogales, F. J., Conejo, A. J. “ARIMA Models to Predict Next- Day Electricity Prices”, IEEE Transactions on Power Systems, Vol. 18, pp. 1014-1020, 2003.
[3] Bebarta, D.K., Biswal, B., Rout, A. K. and Dash, P.K. “Power Signal Classification Using Adaptive Wavelet Network”, ICCCCT10, IEEE, 2010.
[4] Bebarta, D.K., Biswal, B., Rout, A. K. and Dash, P.K. “Efficient Prediction of Stock Market Indices Using Adaptive Neural Network”, International Conference on ScoProS- 2011, Publisher: Springer Berlin/Heidelberg, pp: 287-294, 2012.
[5] Using artificial neural network models in stock market index prediction Erkam Guresen, Gulgun Kayakutlu, Tugrul U. Daim.
[6] Bebarta, D.K., Biswal, B., Rout, A. K. and Dash, P.K. “Forecasting and Classification of Indian Stocks Using Different Polynomial Functional Link Artificial Neural Networks”, IEEE INDICON, 2012.
[7] Panchat Anil Kumar Mansukhbhai,Dr. Jayesh Kumar Madhubhai Patel “Role of Soft Computing Techniques in Predictung Stock Market Direction.,Vol.1, No.2, 2012.
[8] D.K. Chaturvedi, Sinha Anand Premdaye , Ashish Chandiok, “Short –Term Load Forecasting using Soft Computing Tools” 2010.
[9] George S.Atsalakis, Kimon P. Valavanis, “Surveying Stock Market Forecasting Techniques”, vol.36,issue 3 2011.
[10] Vikas Singh “Load forecasting of DEI 33 Kv substations using Artificial Neural Network approach”, Vol.4 ,no.2, 2012
[11] Gyanesh Shivastaka , Sanjev Karmakar,Manoj Kumar Pulak Guhathakurta “Application of Artificial Neural Networks in weather Forecasting” ,Vol.51, no.18,2010.
[12] Satchidananda Dehuri, “A Novel Learning Scheme for Chebysheb Functional Link Neural Networks”, Hindwai Publishing Corporation, Advances in artificial neural systems,
INDICATORS % Avg error WITH OUT INDICATORS
1.890837
RSI 1.827301 PVC 1.829764 MAI 1.824439 RSI&PVC 1.785885 RSI&MAI 1.780781 PVC&RSI 1.781919 PVC&MAI 1.780729 MAI&RSI 1.783081 MAI&PVC 1.784922 MAI&PVC&RSI 1.724364 IJSER

International Journal of Scientific & Engineering Research, Volume 7, Issue 3, March-2016 148 ISSN 2229-5518
IJSER © 2016 http://www.ijser.org
Vol.2011, Article ID 107489, doi:1155/2011/107489, 2011.
[13] Hua-Ning Hao, “Short-term Forecasting of Stock Price Based on Genetic-Neural Network”, 2010 Sixth International Conference on Natural Computation (ICNC 2010), IEEE Conference Publications.
[14] Jagdish Chandra Patra, “Chebysheb Neural Network-Based Model for Dual-Junction Sollar Cells”, in IEEE Transactions on Energy Conversion, Vol. 26 No. 1, March 2011.
IJSER