time series analysis method for assessing engineering ... · pdf filetime series analysis...
TRANSCRIPT
Time Series Analysis Method for Assessing Engineering
Design Processes Using a CAD Tool*
CHARLES XIEThe Concord Consortium, Concord, MA 01742, USA. E-mail: [email protected]
ZHIHUI ZHANG, SAEID NOURIAN, AMY PALLANT and EDMUND HAZZARDThe Concord Consortium, Concord, MA 01742, USA.
This paper proposes a novel computational approach based on time series analysis to assess engineering design processes
using a CAD tool. To collect research data without disrupting a design learning process, design actions and artifacts are
continuously logged as time series by the CAD tool behind the scenes, while students are working on a design challenge.
These fine-grained data can be used to reconstruct and analyze the entire design process of a student with extremely high
resolution. Results of a pilot study in a high school engineering class, in which students solved a solar urban design
challenge, suggest that these data can be used to measure the level of student engagement, reveal the gender differences in
design behaviors, and distinguish the iterative and non-iterative cycles in a design process. From the perspective of
engineering education, this paper contributes to the emerging fields of educational datamining and learning analytics that
aim to expand evidence approaches for learning in a digital world.
Keywords: computer-based assessment; computer-aided design; time series analysis; engineering design; engineering education;educational data mining; learning analytics
1. Motivation
Engineering design has been extensively incorpo-rated in the Next Generation Science Standards for
U.S. precollege science education [1, 2]. The Tech-
nology and Engineering Literacy Framework for
the 2014 U.S. National Assessment of Educational
Progress includes engineering design as one of the
four key skills that need to be assessed at precollege
levels [3]. Researchers have developed several
assessment techniques. For instance, verbal proto-col analysis was used to obtain data from ‘thinking
aloud’ [4, 5]. Latent semantic analysis was used to
parse design documentation to characterize
designer performance [6]. Timeline analysis was
used to monitor students’ time allocation to differ-
ent tasks and their transitions during a design
session [7, 8]. These techniques have limitations.
For example, the verbal protocol method is intru-sive to classroom activities and is weak in capturing
non-verbal processes such as perception and intui-
tion that are so important in design [9]. Researchers
also found that students did not always put their
verbalized knowledge into design practice [10],
leaving considerable ambiguity in their perfor-
mance assessments. The document analysis
method has similar weaknesses to those of theverbal protocol method because it, too, is based
on analyzing student descriptions of their work,
rather than their actual actions. The timeline
method was developed to visualize patterns of
time usage on different phases, but due to the lack
of detailed information about the quality of the
design subprocesses in the allocated time, time on
task does not always reflect designer performance.
A common disadvantage of these existing meth-
ods is that they all require time-consuming data
collection and analysis procedures that limit the
scale of research. These procedures are often exe-cuted manually and the requirement of inter-rater
reliability multiplies the work load. Information
technology provides a cost-effective alternative. As
an important trend in educational research [11],
computer-based assessments have been used to
study inquiry with interactive media and games
[12–16]. But rarely have they been exploited for
assessing engineering design, a process that sharessome similarities with scientific inquiry but is fun-
damentally distinct in many ways [17]. We see an
exciting opportunity to introduce computer-based
assessments into engineering design research. This is
possible because computer-based assessments can
be implemented within computer-aided design
(CAD) tools.
Engineering design is well supported by modernCAD tools capable of digital prototyping—a full-
cycle process to virtually explore a complete pro-
duct before it is actually built. Such CAD tools
allow students to take on a design challenge without
regard to the expense, hazard, and scale of the
challenge. They provide viable platforms for teach-
ing and learning engineering design in the class-
room, because a significant part of design thinking isabstract and generic, can be learned through design-
* Accepted 21 August 2013.218
International Journal of Engineering Education Vol. 30, No. 1, pp. 218–230, 2014 0949-149X/91 $3.00+0.00Printed in Great Britain # 2014 TEMPUS Publications.
ing computermodels thatwork in cyberspace, and is
transferable to real-world situations. In cases when
closing the gap between the virtual world and the
real world is required and feasible, a CAD tool can
integrate with digital fabrication technologies, such
as 3D printers, to allow students to translate theircomputer designs into physical objects for further
learning [18].
For engineering education research, the advan-
tage of moving a design project to an online CAD
platform is that learner data can be logged con-
tinuously and sorted automatically behind the
scenes, while students are solving design challenges.
This datamining technique is promising because thelogged human-computer interactions and inter-
mediate design artifacts encompass rich informa-
tion about the quality of learning processes and the
evidence of learning outcomes. In a sense, these
logged data reflect students’ design thinking and
decision making processes, which are not only
regulated by the affordances of the CAD tool such
as its user interface and visualization but are alsodriven by interventions outside the CAD tool such
as brainstorming and instruction. To understand
the latter, imagine a simple scenario in which
students first carry out their design work without
any guidance, then stop for an orientation of the
project by the teacher, and then carry on their design
tasks. It is highly possible that in this case the CAD
tool would record a measurable difference beforeand after the teacher’s intervention. This difference
in the data logged by the CAD tool can be used to
quantitatively study the effect of the intervention.
These logged data include non-verbal, non-tex-
tual data that augment other assessment data to
provide amore comprehensive andobjective picture
of learning. For example, to determine if and how
students practice iterative designing and systemsthinking to search for optimal solutions, we can
examine in the design logs the exact types, scopes,
time, and frequencies of data-driven inquiry actions
students have taken, the numerical results of their
investigations through simulated tests, the design
rationales students have generated based on their
interpretations of the results, the subsequent design
actions they have taken as a result of prior inquiry,and the following system performance changes
calculated by the CAD software (which can be
displayed like game scores to students to guide
their design work, too). These kinds of process
data with a time dimension can provide evidence
of engineering design learning from the perspective
of learning progressions [19–21].
This paper is the first of a series of reports aboutour work on developing, refining, and applying a
rigorous computational method for process analy-
sis with the goal to provide reliable analytics and
useful visualization for probing into engineering
design learning processes on a scale and at a depth
unimaginable before. Although this concept-prov-
ing research study involved only a small number of
high school students, this computational approach
is highly scalable and generalizable.
2. Process analytics: Theory andmethodology
In this section, we will present a theoretical frame-
work on which our research methodology will be
based. This framework considers the dynamic,
multifaceted nature of engineering design and
aims to define the assessment structures underlying
a learning progress from a beginning designer to an
informed designer [22] using a CAD tool as both anintervention and assessment system.
2.1 A data mining mechanism based on time series
analysis
A complex engineering design process involves
many types of tasks and consists of numerous
actions that occur sporadically, progressively, itera-
tively, or even concurrently within the problem
space. A CAD tool provides deep design space
that is scaffolded by its user interface through
which students take actions to shape and test their
ideas and designs. Along with the properties andattributes of the designed artifacts that can be
calculated dynamically by the CAD tool based on
the underlying scientific and engineering principles,
the types, timestamps, orders, frequencies, and
durations of student actions within the CAD tool
provide invaluable insights into the process of
engineering design as they accurately reflect the
learning trajectories of each student. These long-itudinal data can be monitored and collected in the
form of time series—sequences of data points mea-
sured and stored periodically to record the states of
an ever-changing designer-design system. In this
way, an intervention will leave a measurable trace
to its full extent. Assessments can then be viewed as
the analysis of a comprehensive set of time series,
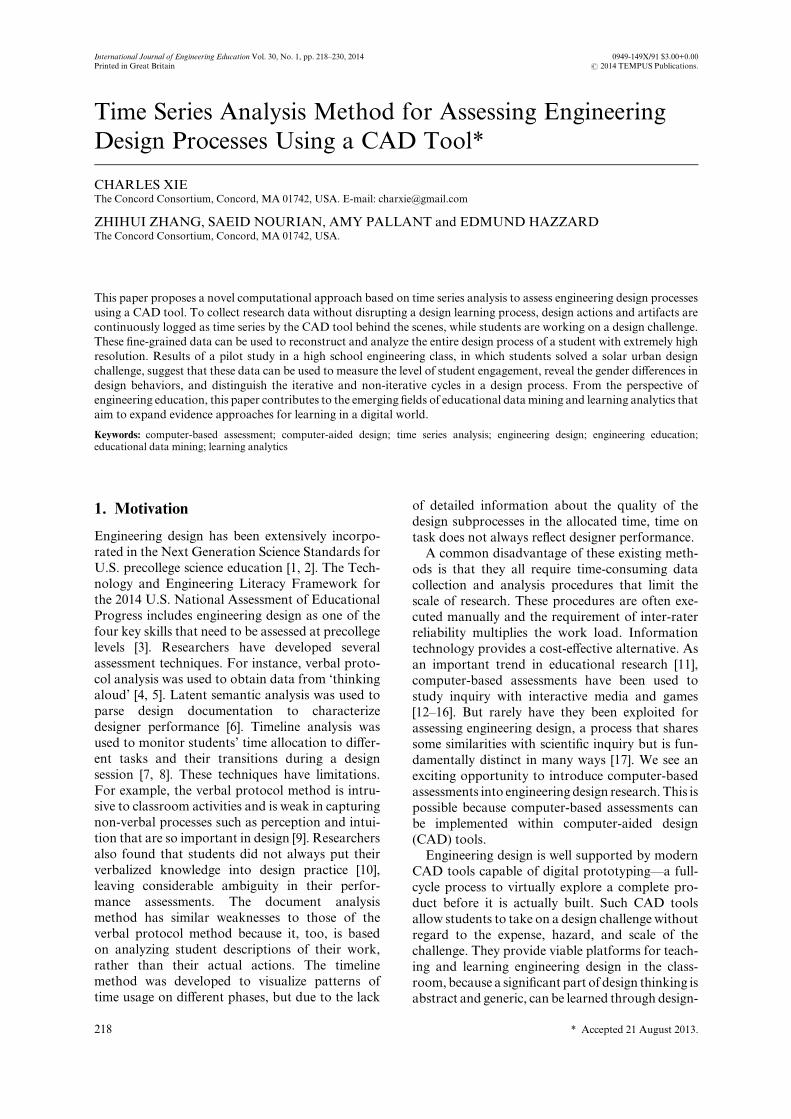
each representing an aspect of learning or perfor-mance over a period of time (Fig. 1).
At first glance, these data may appear to be fairly
stochastic. But buried in the noisy data are students’
design cognition processes. Time series analysis,
which has been widely used in signal processing
and pattern recognition [23, 24], can be used to
detect meaningful patterns of learner behaviors
from seemingly random data. For example, auto-correlation analysis can be used to find repeating
patterns in a subprocess. Cross-correlation analysis
can be used to examine if an intervention in one
subprocess has resulted in changes in another and
Assessing Engineering Design Processes Using a CAD Tool 219
estimate how long it has taken for an intervention to
regulate a design behavior. Of particular interest is
whether cross-correlation analysis can discern and
characterize the interplay between an inquiry pro-
cess about concept B and a design process about
feature A, both of which are responsible for the
improvement of product performance C (Fig. 1).
2.2 Evidence of design learning from big data
The emerging fields of educational data mining andlearning analytics [25] aim to expand evidence
approaches for learning and teaching in a digital
world [26]. Research in these fields should not be
limited to analyzing onlyWeb traffic data generated
in online courses such as when the student logs in,
which link is clicked, or for how long a video is
played. Tracking these generic traffic data is useful
for profiling learners, but they provide little directevidence of deep learning specific to content knowl-
edge or problem-solving skills. This paper repre-
sents an effort to broaden the scope of data mining
to measure students’ abilities to learn inquiry and
design in a project-based setting. It presents an
example of how evidence of learningmay be derived
from tracking student exploration directlywithin the
problem space. This type of learner data may allowfor more meaningful assessments as they are more
specifically linked to the content and skill learning
goals.
The time series process data can be as fine-grained
as the ‘atomic’ design steps (meaning that they
cannot be logically divided further) learners under-
take in the problem space, such as an action stored
in the undo/redo manager of a CAD tool, or thechanges of the individual building blocks of a
designed system, including the evolution of a phy-
sical property calculated by an analytic module of a
CAD tool. Such data can be used to reconstruct and
analyze the entire design process of every student
with extremely high resolution. Data at this level of
granularity possess all the four characteristics of
‘big data’ [27]:
� High volume: A class of highly engaged students
can generate a large amount of process data in a
complex open-ended project that involves many
building blocks and variables.
� High velocity: The data can be collected, pro-cessed, and visualized in real time to instanta-
neously provide students with metacognitive
guidance and teachers with corrective strategies.
� High variety: The data encompass any type of
information provided by a rich CAD system such
as all the learner actions and artifact properties.
� High veracity: The data must be accurate and
comprehensive to ensure fair and trustworthyassessments of student performance.
These big data contain a lot of information about
the quality of design processes that can yield direct,measurable evidence of learning at a statistically
significant scale. Automation of data acquisition
and analysis will make this research approach
highly cost-effective and scalable.
3. Technology
3.1 Learning and teaching engineering design with
Energy3D
This research used a special CAD program, Ener-
gy3D (available at http://energy.concord.org/ener-
gy3d), which is a free, open-source computer-aided
design and fabrication tool that we have developed
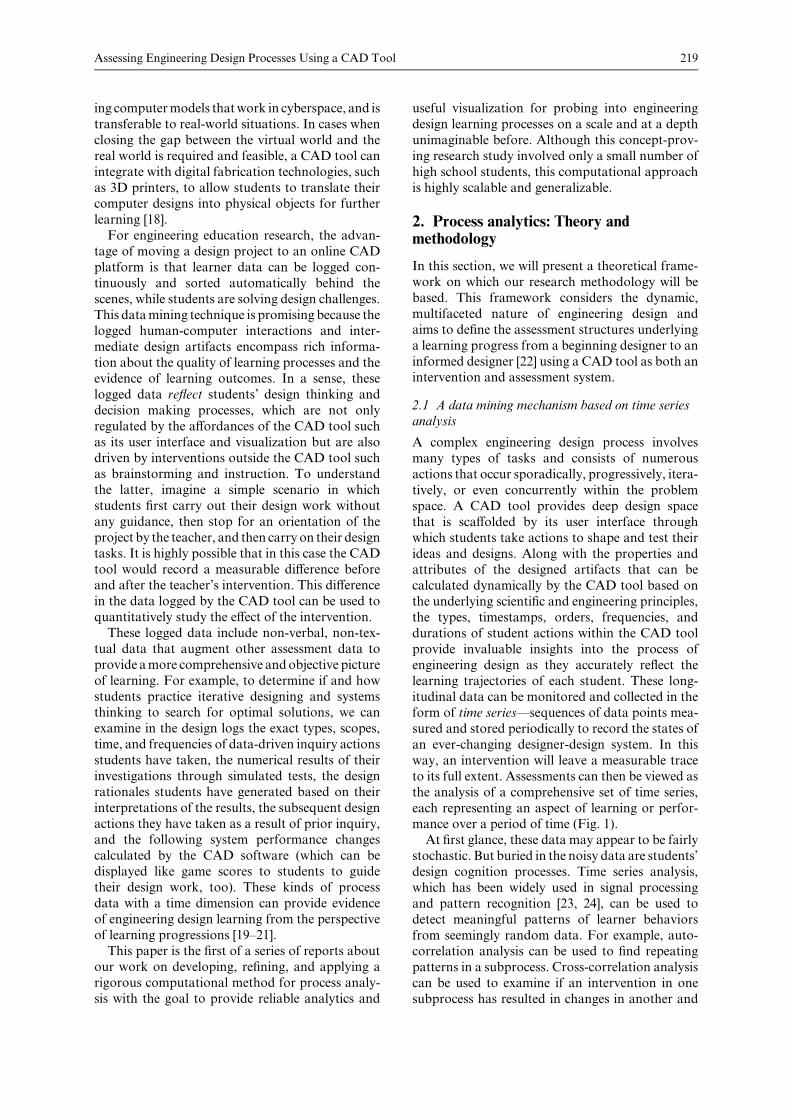
for children of age 6–18 to make small model
buildings (Fig. 2). The program was written in theJava programming language from scratch with the
goal to support the teaching and learning of engi-
neering design in the context of sustainable civil
engineering. Energy3D provides an easy-to-use 3D
graphical user interface for designing model green
buildings and assessing their solar energy perfor-
mances using a virtual heliodon that simulates solar
radiation at any given time in any given location.With a What-You-See-Is-What-You-Get (WYSI-
WYG) user interface that is even more simplified
than that of SketchUp, most students are able to
master the tool in a short time (15 minutes or so)
after watching a tutorial video or a live demo and
can quickly design a simple house, a complex
building, or even a village. In addition, Energy3D
also allows students to ‘print out’ a design, cut outthe pieces, and use them to assemble a physical
model to extend learning to the real world. To
support this fabrication process, Energy3D auto-
matically deconstructs a 3D structure into 2Dpieces
and generates a layout of all the pieces on a number
Charles Xie et al.220
Fig. 1. Engineering design using a CAD tool consists of manyhuman and computing subprocesses that can be monitored astime series.Analyzing these time serieswould reveal how studentslearn engineering design frommultiple aspects and how differentsubprocesses are correlated.
of pages. The entire deconstruction process is ani-
mated in the Print Preview so that the user can see
the correspondence between the 3D structure on the
computer screen and the 2D pieces on the printed
paper.
3.2 Logging and analyzing engineering design
processes with Energy3D
Unlike other CAD tools developed mostly forengineering applications, Energy3D was developed
with a vision to provide an open experimental plat-
form that supports a wide range of engineering
education research and practices. With this vision
in mind, we have accommodated data collection in
the software architecture throughout the develop-
ment process. As a result, Energy3D is capable of
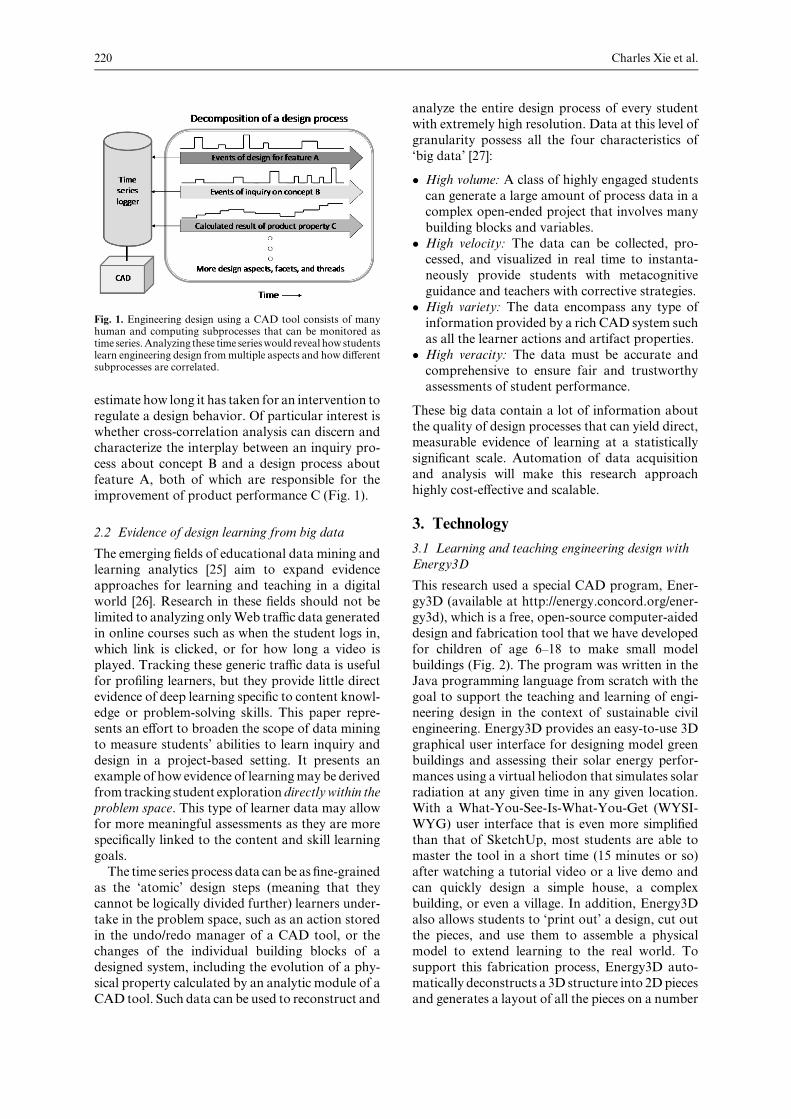
recording the full history of designer actions and a
complete sequence of product snapshots with an
unobtrusive logger that runs in the background.
These actions and snapshots can be used to recon-
struct the entire design process with all the impor-
tant details restored for analysis (Fig. 3). The
snapshots also store the zoom extent and rotationangle, which preserve the designer’s navigation path
in the 3D design space, and can be replayed con-
tinuously just like running a slide show. Compared
with the screencast technology that records student
activities in a video format, which requires analysis
so labor-intensive that sophisticated computer
vision and image analysis software has been pro-
posed to assist the recognition of student actions[28], the reconstructed process is native to Ener-
gy3D and can be arbitrarily and closely examined
using all the designing functionalities and learning
analytics built in Energy3D. This ability to post-
process a recorded design process to extract infor-
mation gives researchers considerable flexibility in
data mining. Special data visualization tools have
also been developed to render the complicatedanalysis results from Energy3D’s logs, as will be
shown in later sections when we present our results.
4. Implementation
4.1 A solar urban design challenge
In sustainable architecture, passive solar design
refers to searching for optimal strategies to max-
imize solar heating on a building in the winter and
minimize solar heating in the summer in order to
reduce heating and cooling costs of the building. A
Assessing Engineering Design Processes Using a CAD Tool 221
Fig. 2. Energy3D: A special CAD tool for teaching and learningengineering design in the context of building design. Energy3Dfeatures a virtual heliodon that simulates the sunpath andpassivesolar heating.
Fig. 3. A schematic illustration of two hypothetical design scenarios in which events andintermediates can be recorded to provide fine-grained details of the design processes. It isshown that the designer in process B goes throughmore iterations than the designer in processA.
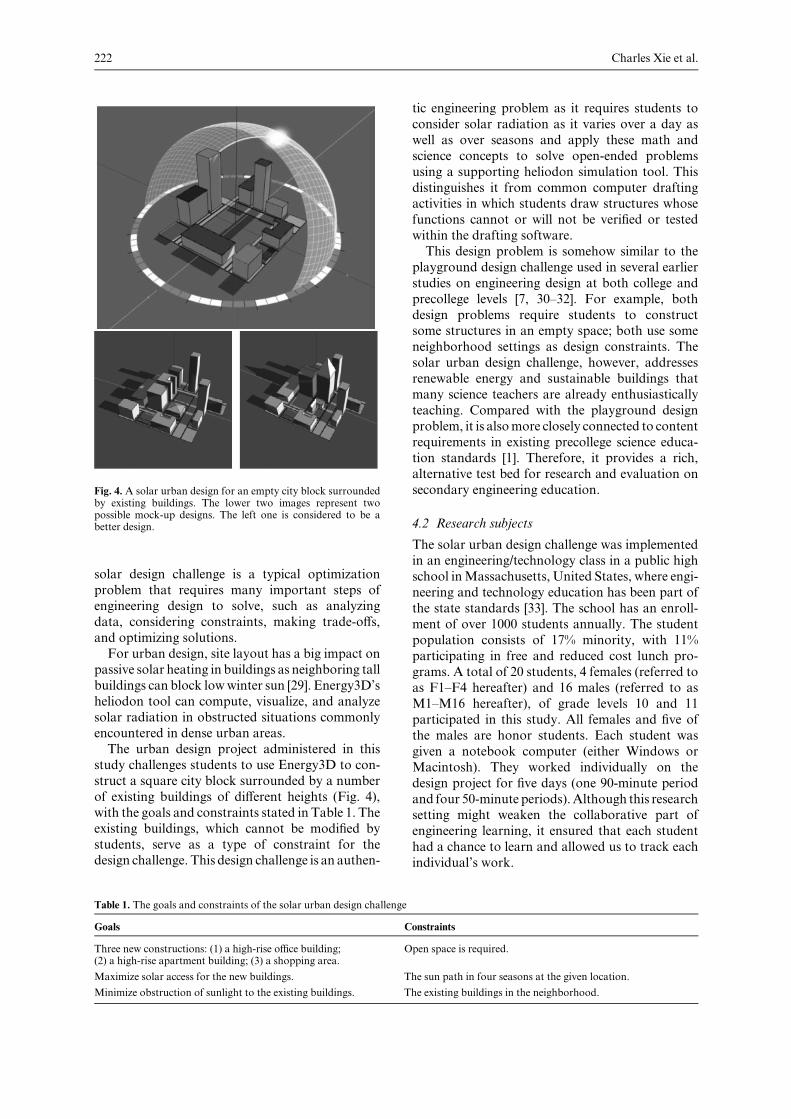
solar design challenge is a typical optimization
problem that requires many important steps ofengineering design to solve, such as analyzing
data, considering constraints, making trade-offs,
and optimizing solutions.
For urban design, site layout has a big impact on
passive solar heating in buildings as neighboring tall
buildings can block lowwinter sun [29]. Energy3D’s
heliodon tool can compute, visualize, and analyze
solar radiation in obstructed situations commonlyencountered in dense urban areas.
The urban design project administered in this
study challenges students to use Energy3D to con-
struct a square city block surrounded by a number
of existing buildings of different heights (Fig. 4),
with the goals and constraints stated in Table 1. The
existing buildings, which cannot be modified by
students, serve as a type of constraint for thedesign challenge. This design challenge is an authen-
tic engineering problem as it requires students to
consider solar radiation as it varies over a day as
well as over seasons and apply these math and
science concepts to solve open-ended problems
using a supporting heliodon simulation tool. This
distinguishes it from common computer draftingactivities in which students draw structures whose
functions cannot or will not be verified or tested
within the drafting software.
This design problem is somehow similar to the
playground design challenge used in several earlier
studies on engineering design at both college and
precollege levels [7, 30–32]. For example, both
design problems require students to constructsome structures in an empty space; both use some
neighborhood settings as design constraints. The
solar urban design challenge, however, addresses
renewable energy and sustainable buildings that
many science teachers are already enthusiastically
teaching. Compared with the playground design
problem, it is alsomore closely connected to content
requirements in existing precollege science educa-tion standards [1]. Therefore, it provides a rich,
alternative test bed for research and evaluation on
secondary engineering education.
4.2 Research subjects
The solar urban design challenge was implementedin an engineering/technology class in a public high
school inMassachusetts, United States, where engi-
neering and technology education has been part of
the state standards [33]. The school has an enroll-
ment of over 1000 students annually. The student
population consists of 17% minority, with 11%
participating in free and reduced cost lunch pro-
grams. A total of 20 students, 4 females (referred toas F1–F4 hereafter) and 16 males (referred to as
M1–M16 hereafter), of grade levels 10 and 11
participated in this study. All females and five of
the males are honor students. Each student was
given a notebook computer (either Windows or
Macintosh). They worked individually on the
design project for five days (one 90-minute period
and four 50-minute periods).Although this researchsetting might weaken the collaborative part of
engineering learning, it ensured that each student
had a chance to learn and allowed us to track each
individual’s work.
Charles Xie et al.222
Fig. 4. A solar urban design for an empty city block surroundedby existing buildings. The lower two images represent twopossible mock-up designs. The left one is considered to be abetter design.
Table 1. The goals and constraints of the solar urban design challenge
Goals Constraints
Three new constructions: (1) a high-rise office building;(2) a high-rise apartment building; (3) a shopping area.
Open space is required.
Maximize solar access for the new buildings. The sun path in four seasons at the given location.
Minimize obstruction of sunlight to the existing buildings. The existing buildings in the neighborhood.
4.3 Instructional effects
OnDay One, the teacher introduced students to the
project and handed out instruction sheets that
explained the design project and emphasized the
specifications. The researchers gave students a brief
demo of Energy3D. Students spent about 20 min-
utes trying various features and tools of Energy3D
and getting familiar with the software. Then theresearchers briefly introduced the template with
existing neighborhood buildings that students
were expected to work on (Fig. 4). Starting from
Day Two, students worked independently on the
project. Each student was required to complete at
least three different alternative designs. At the end
of the project, they chose their best designs and
wrote a final report to explain the rationale. Theywere told that they would be graded based on their
final reports. In addition, at the end of each class
period, they were required to answer a short survey
summarizing what they had achieved during the
period and what they planned to do for the next
day.
4.4 Data sources and analyses
The data sources included CAD logs, student
designs, self-reports, classroom observation notes,
and post-project interviews. Our research focused
on the time series data logged byEnergy3D, because
only this part of the data can be automatically
collected and analyzed. All the other data sources
were used in our study to contextualize and validatethe time series analysis results.
The CAD actions needed to solve the design
challenge are coded in Table 2. The building actions
include those steps that are necessary to construct a
building. The revising actions are modifications
such as reshaping a roof. In addition, students
may revisit a previous design. Such actions are
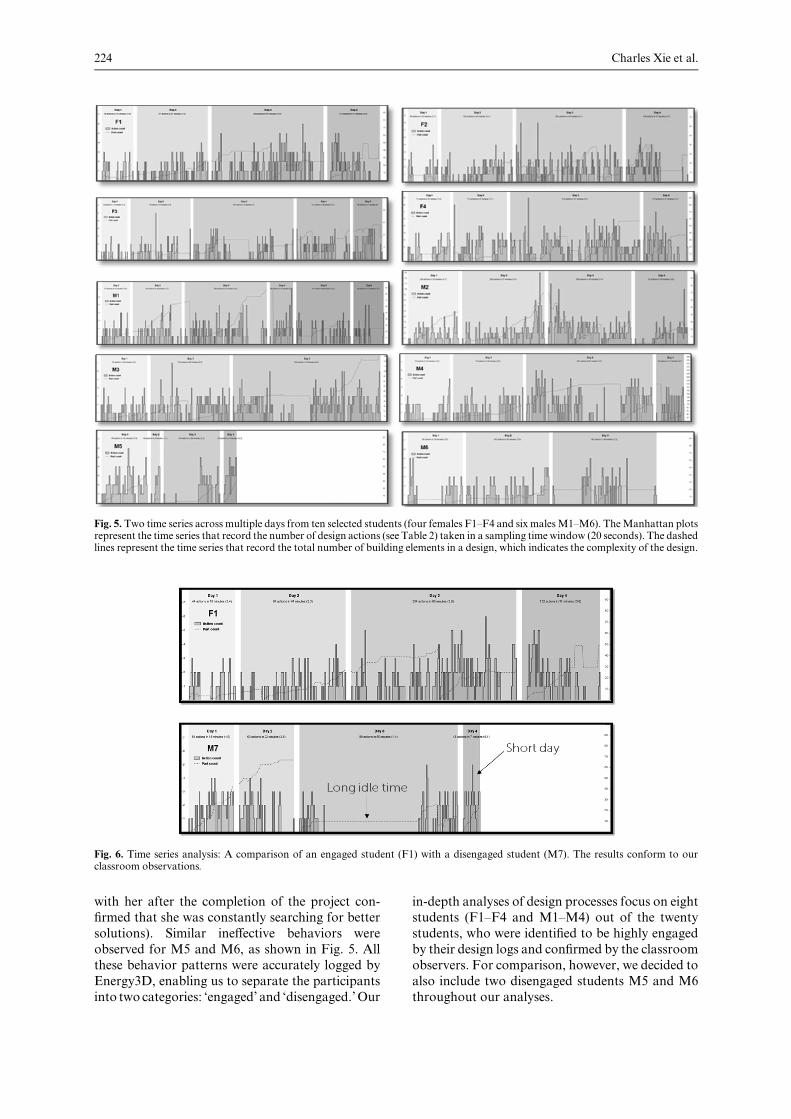
classified as switching actions.Our analyses covered both the design products
and processes. We evaluated the best designs the
students chose based on how well they met the
specifications listed in Table 1. From the time
series, we extracted the ratio of building versus
revising actions, the number of different designs,
and the most frequently performed action for each
student. To visualize design processes, we plotted
the timelines of the design actions performed by
each student throughout the project. As this was an
exploratory study, our time series analysis was
limited to simple statistics of design actions and
artifact properties such as maxima, minima, andaverages. More sophisticated techniques such as
correlation analysis will be used in future studies.
5. Results and findings
This section presents some preliminary results of
our pilot study. These results do not necessarily
reveal the exact degree of student learning resulting
from solving the design challenge. Instead, theresearch focus is how they performed over the
period of time in which their design processes had
been logged. We attempted to identify patterns of
design behaviors and occurrences of iterative cycles.
Since time series analysis is the key technique used in
this research, it may be helpful to get a sense of how
the logged time series data look like before further
discussion. Figure 5 shows two different types oftime series, one for counting student design actions
and the other for counting design elements in
artifacts, from ten students.More data are available
at http://energy.concord.org/research.html.
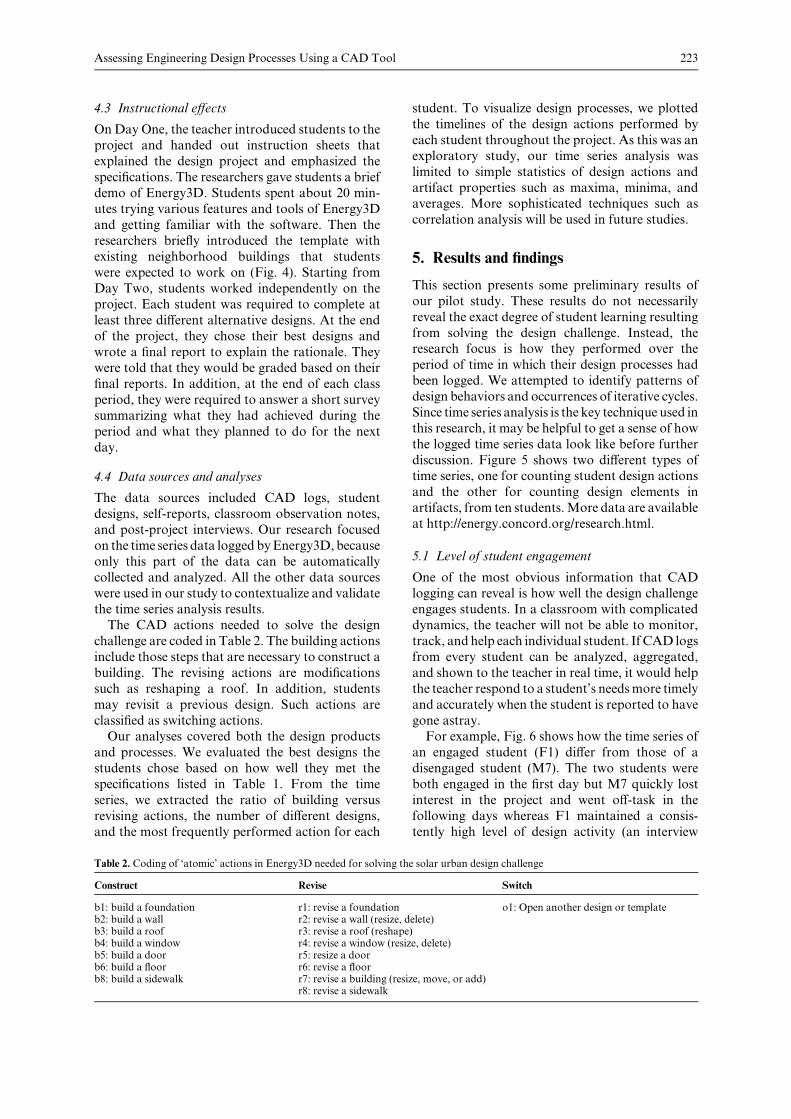
5.1 Level of student engagement
One of the most obvious information that CAD
logging can reveal is how well the design challengeengages students. In a classroom with complicated
dynamics, the teacher will not be able to monitor,
track, and help each individual student. If CAD logs
from every student can be analyzed, aggregated,
and shown to the teacher in real time, it would help
the teacher respond to a student’s needsmore timely
and accurately when the student is reported to have
gone astray.For example, Fig. 6 shows how the time series of
an engaged student (F1) differ from those of a
disengaged student (M7). The two students were
both engaged in the first day but M7 quickly lost
interest in the project and went off-task in the
following days whereas F1 maintained a consis-
tently high level of design activity (an interview
Assessing Engineering Design Processes Using a CAD Tool 223
Table 2. Coding of ‘atomic’ actions in Energy3D needed for solving the solar urban design challenge
Construct Revise Switch
b1: build a foundationb2: build a wallb3: build a roofb4: build a windowb5: build a doorb6: build a floorb8: build a sidewalk
r1: revise a foundationr2: revise a wall (resize, delete)r3: revise a roof (reshape)r4: revise a window (resize, delete)r5: resize a doorr6: revise a floorr7: revise a building (resize, move, or add)r8: revise a sidewalk
o1: Open another design or template
with her after the completion of the project con-firmed that she was constantly searching for better
solutions). Similar ineffective behaviors were
observed for M5 and M6, as shown in Fig. 5. All
these behavior patterns were accurately logged by
Energy3D, enabling us to separate the participants
into two categories: ‘engaged’ and ‘disengaged.’Our
in-depth analyses of design processes focus on eightstudents (F1–F4 and M1–M4) out of the twenty
students, who were identified to be highly engaged
by their design logs and confirmed by the classroom
observers. For comparison, however, we decided to
also include two disengaged students M5 and M6
throughout our analyses.
Charles Xie et al.224
Fig. 5. Two time series across multiple days from ten selected students (four females F1–F4 and six malesM1–M6). TheManhattan plotsrepresent the time series that record the number of design actions (see Table 2) taken in a sampling time window (20 seconds). The dashedlines represent the time series that record the total number of building elements in a design, which indicates the complexity of the design.
Fig. 6. Time series analysis: A comparison of an engaged student (F1) with a disengaged student (M7). The results conform to ourclassroom observations.
5.2 Gender differences in design behaviors
An important thesis for engineering design research
involves finding different learning pathways that
best support male and female students. Therefore,
gender differences in design have been extensively
studied. In a meta-analysis of 150 studies, signifi-
cantly greater intellectual risk-taking was noted inmale participants [34].Notable differences were also
found in the design work of male and female UK
students:Girls outperformed boys in reflective tasks
like investigating and evaluating ideas, whereas
boys were better at ideation and development [35].
Our analysis results of CAD logs agree with these
earlier findings. Our data suggest that there appears
to be a large gender difference in both designproducts and processes. The main differences are:
(1) the male students tended to push the limit of the
software and produced complex designs that looked
‘cool’ but did not necessarily meet the design
specifications; and (2) the female students spent
more time carefully revising their designs than
building new structures and paid more attention
to design specifications. Table 3 shows the results
distilled from the design action time series.
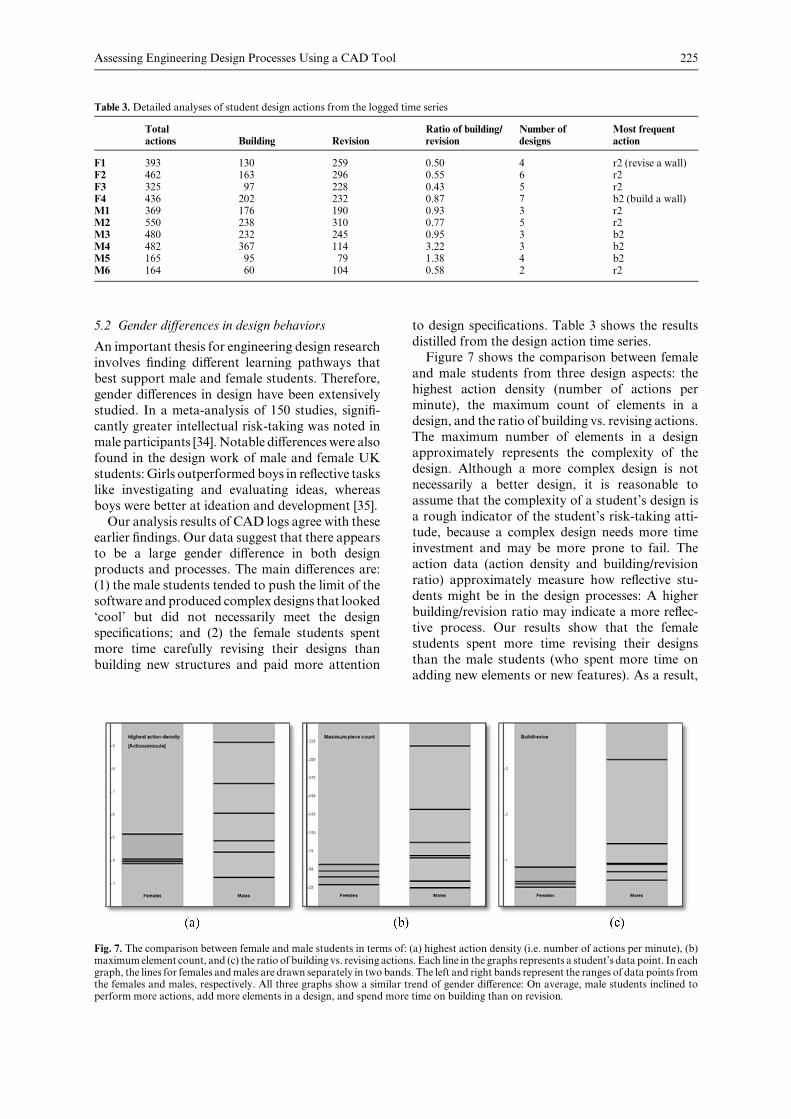
Figure 7 shows the comparison between female
and male students from three design aspects: the
highest action density (number of actions perminute), the maximum count of elements in a
design, and the ratio of building vs. revising actions.
The maximum number of elements in a design
approximately represents the complexity of the
design. Although a more complex design is not
necessarily a better design, it is reasonable to
assume that the complexity of a student’s design is
a rough indicator of the student’s risk-taking atti-tude, because a complex design needs more time
investment and may be more prone to fail. The
action data (action density and building/revision
ratio) approximately measure how reflective stu-
dents might be in the design processes: A higher
building/revision ratio may indicate a more reflec-
tive process. Our results show that the female
students spent more time revising their designsthan the male students (who spent more time on
adding new elements or new features). As a result,
Assessing Engineering Design Processes Using a CAD Tool 225
Table 3. Detailed analyses of student design actions from the logged time series
Totalactions Building Revision
Ratio of building/revision
Number ofdesigns
Most frequentaction
F1 393 130 259 0.50 4 r2 (revise a wall)F2 462 163 296 0.55 6 r2F3 325 97 228 0.43 5 r2F4 436 202 232 0.87 7 b2 (build a wall)M1 369 176 190 0.93 3 r2M2 550 238 310 0.77 5 r2M3 480 232 245 0.95 3 b2M4 482 367 114 3.22 3 b2M5 165 95 79 1.38 4 b2M6 164 60 104 0.58 2 r2
Fig. 7. The comparison between female and male students in terms of: (a) highest action density (i.e. number of actions per minute), (b)maximumelement count, and (c) the ratio of building vs. revising actions. Each line in the graphs represents a student’s data point. In eachgraph, the lines for females andmales are drawn separately in two bands. The left and right bands represent the ranges of data points fromthe females and males, respectively. All three graphs show a similar trend of gender difference: On average, male students inclined toperform more actions, add more elements in a design, and spend more time on building than on revision.
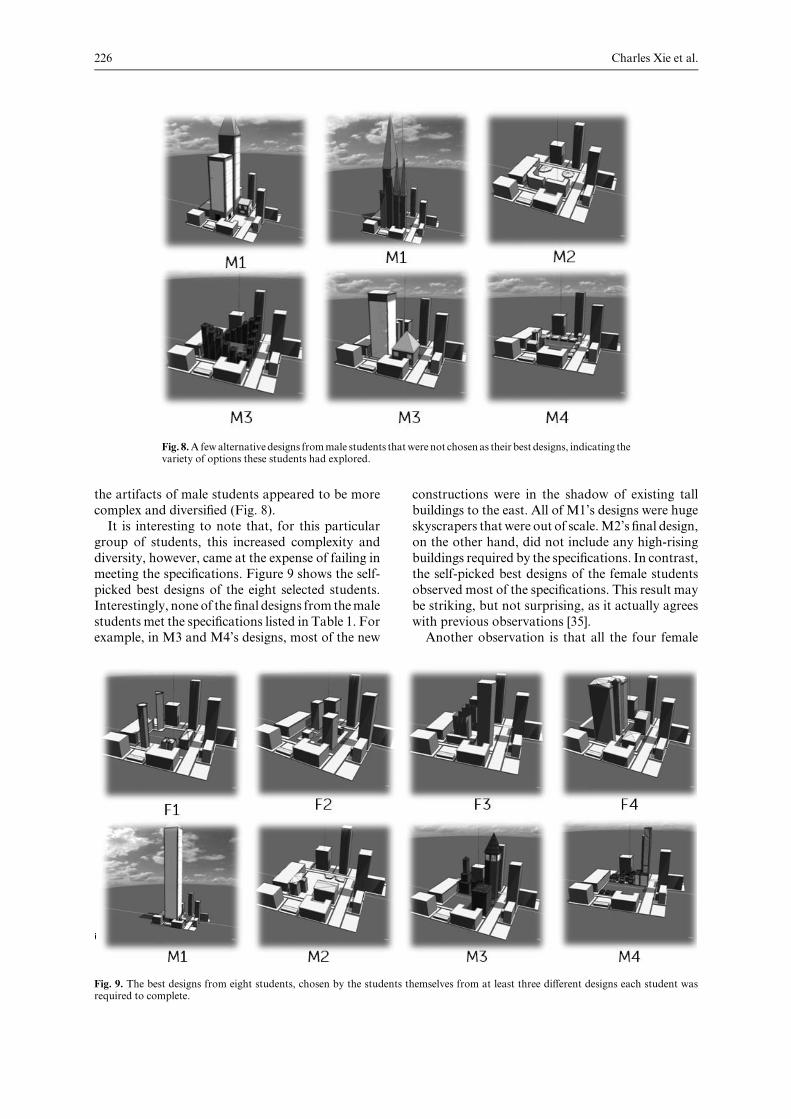
the artifacts of male students appeared to be morecomplex and diversified (Fig. 8).
It is interesting to note that, for this particular
group of students, this increased complexity and
diversity, however, came at the expense of failing in
meeting the specifications. Figure 9 shows the self-
picked best designs of the eight selected students.
Interestingly, none of the final designs from themale
students met the specifications listed in Table 1. Forexample, in M3 and M4’s designs, most of the new
constructions were in the shadow of existing tallbuildings to the east. All of M1’s designs were huge
skyscrapers that were out of scale.M2’s final design,
on the other hand, did not include any high-rising
buildings required by the specifications. In contrast,
the self-picked best designs of the female students
observed most of the specifications. This result may
be striking, but not surprising, as it actually agrees
with previous observations [35].Another observation is that all the four female
Charles Xie et al.226
Fig. 8.Afewalternativedesigns frommale students thatwere not chosenas their best designs, indicating thevariety of options these students had explored.
Fig. 9. The best designs from eight students, chosen by the students themselves from at least three different designs each student wasrequired to complete.
students chose their last complete designs as their
best designs whereas none of the four male students
(M1–M4) did. This means that the design processes
of the female students were somehow convergent
whereas the design processes of the male students
were somehow divergent. One reasonable explana-tion of this difference is that, at the end of the
project, the male students were still exploring the
design possibilities so they were not sure that their
latest designs would be the best ones. The next
subsection about design iteration may provide evi-
dence of this difference from the time series data.
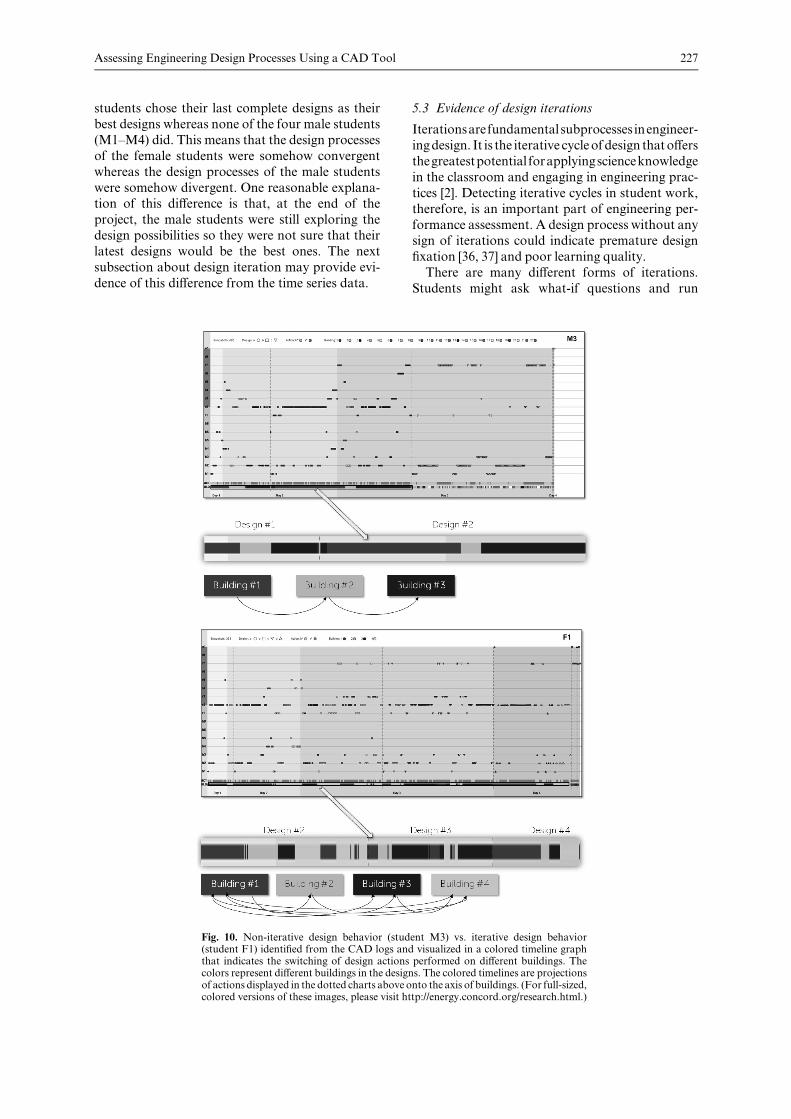
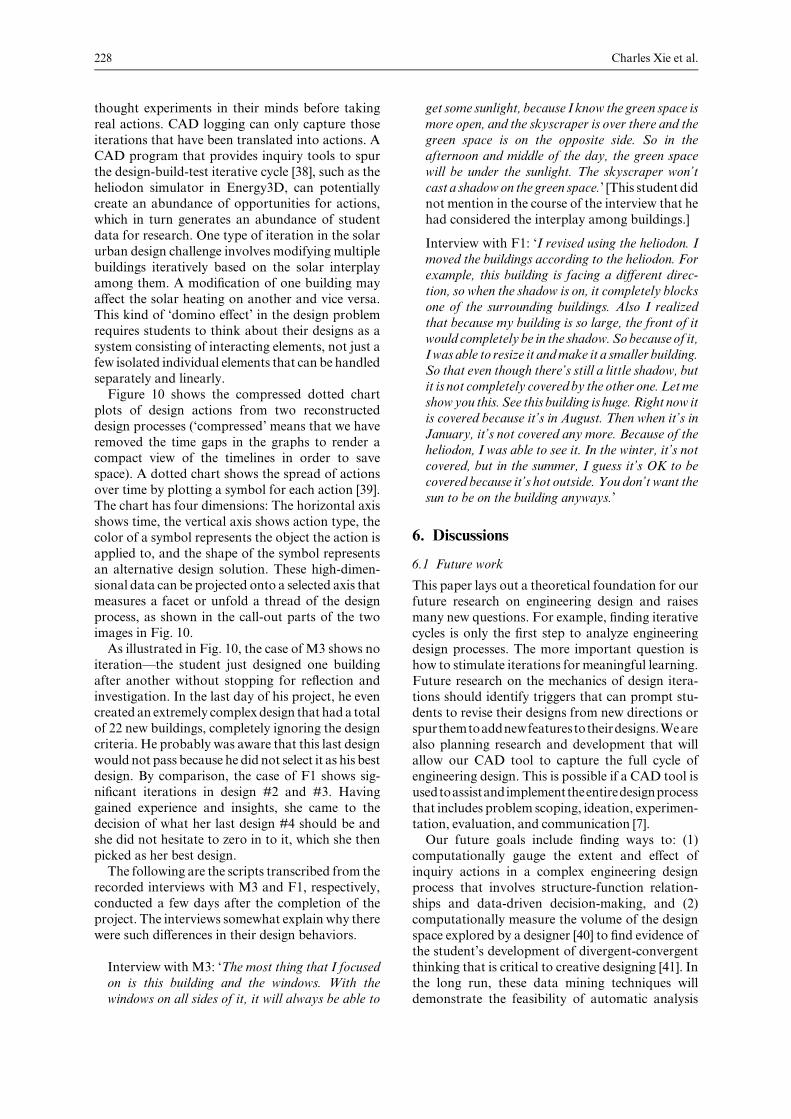
5.3 Evidence of design iterations
Iterationsarefundamentalsubprocesses inengineer-
ingdesign. It is the iterative cycleofdesign thatoffers
thegreatestpotential forapplyingscienceknowledge
in the classroom and engaging in engineering prac-
tices [2]. Detecting iterative cycles in student work,
therefore, is an important part of engineering per-
formance assessment. A design process without anysign of iterations could indicate premature design
fixation [36, 37] and poor learning quality.
There are many different forms of iterations.
Students might ask what-if questions and run
Assessing Engineering Design Processes Using a CAD Tool 227
Fig. 10. Non-iterative design behavior (student M3) vs. iterative design behavior(student F1) identified from the CAD logs and visualized in a colored timeline graphthat indicates the switching of design actions performed on different buildings. Thecolors represent different buildings in the designs. The colored timelines are projectionsof actions displayed in the dotted charts above onto the axis of buildings. (For full-sized,colored versions of these images, please visit http://energy.concord.org/research.html.)
thought experiments in their minds before taking
real actions. CAD logging can only capture those
iterations that have been translated into actions. A
CAD program that provides inquiry tools to spur
the design-build-test iterative cycle [38], such as the
heliodon simulator in Energy3D, can potentiallycreate an abundance of opportunities for actions,
which in turn generates an abundance of student
data for research. One type of iteration in the solar
urban design challenge involves modifying multiple
buildings iteratively based on the solar interplay
among them. A modification of one building may
affect the solar heating on another and vice versa.
This kind of ‘domino effect’ in the design problemrequires students to think about their designs as a
system consisting of interacting elements, not just a
few isolated individual elements that can be handled
separately and linearly.
Figure 10 shows the compressed dotted chart
plots of design actions from two reconstructed
design processes (‘compressed’ means that we have
removed the time gaps in the graphs to render acompact view of the timelines in order to save
space). A dotted chart shows the spread of actions
over time by plotting a symbol for each action [39].
The chart has four dimensions: The horizontal axis
shows time, the vertical axis shows action type, the
color of a symbol represents the object the action is
applied to, and the shape of the symbol represents
an alternative design solution. These high-dimen-sional data can be projected onto a selected axis that
measures a facet or unfold a thread of the design
process, as shown in the call-out parts of the two
images in Fig. 10.
As illustrated in Fig. 10, the case of M3 shows no
iteration—the student just designed one building
after another without stopping for reflection and
investigation. In the last day of his project, he evencreated an extremely complex design that had a total
of 22 new buildings, completely ignoring the design
criteria. He probably was aware that this last design
would not pass because he did not select it as his best
design. By comparison, the case of F1 shows sig-
nificant iterations in design #2 and #3. Having
gained experience and insights, she came to the
decision of what her last design #4 should be andshe did not hesitate to zero in to it, which she then
picked as her best design.
The following are the scripts transcribed from the
recorded interviews with M3 and F1, respectively,
conducted a few days after the completion of the
project. The interviews somewhat explain why there
were such differences in their design behaviors.
Interview with M3: ‘The most thing that I focused
on is this building and the windows. With the
windows on all sides of it, it will always be able to
get some sunlight, because I know the green space is
more open, and the skyscraper is over there and the
green space is on the opposite side. So in the
afternoon and middle of the day, the green space
will be under the sunlight. The skyscraper won’t
cast a shadowon the green space.’ [This student didnot mention in the course of the interview that he
had considered the interplay among buildings.]
Interview with F1: ‘I revised using the heliodon. Imoved the buildings according to the heliodon. For
example, this building is facing a different direc-
tion, so when the shadow is on, it completely blocks
one of the surrounding buildings. Also I realized
that because my building is so large, the front of it
would completely be in the shadow. So because of it,
I was able to resize it andmake it a smaller building.
So that even though there’s still a little shadow, but
it is not completely covered by the other one. Letme
showyou this. See this building is huge.Right now it
is covered because it’s in August. Then when it’s in
January, it’s not covered any more. Because of the
heliodon, I was able to see it. In the winter, it’s not
covered, but in the summer, I guess it’s OK to be
covered because it’s hot outside. You don’t want the
sun to be on the building anyways.’
6. Discussions
6.1 Future work
This paper lays out a theoretical foundation for our
future research on engineering design and raises
many new questions. For example, finding iterative
cycles is only the first step to analyze engineering
design processes. The more important question is
how to stimulate iterations formeaningful learning.
Future research on the mechanics of design itera-tions should identify triggers that can prompt stu-
dents to revise their designs from new directions or
spurthemtoaddnewfeaturestotheirdesigns.Weare
also planning research and development that will
allow our CAD tool to capture the full cycle of
engineering design. This is possible if a CAD tool is
usedtoassistandimplementtheentiredesignprocess
that includes problem scoping, ideation, experimen-tation, evaluation, and communication [7].
Our future goals include finding ways to: (1)
computationally gauge the extent and effect of
inquiry actions in a complex engineering design
process that involves structure-function relation-
ships and data-driven decision-making, and (2)
computationally measure the volume of the design
space explored by a designer [40] to find evidence ofthe student’s development of divergent-convergent
thinking that is critical to creative designing [41]. In
the long run, these data mining techniques will
demonstrate the feasibility of automatic analysis
Charles Xie et al.228

of student design processes in real time, which is
important to the ultimate development of dynamic,
adaptive feedback in intelligent tutoring systems for
scaffolding the learning of engineering design.
6.2 Limitations
Time series analysis of engineering design learning
processes requires that the design challenges bebased on CAD tools. Even though we try to inte-
grate CAD extensively into the full engineering
design process, there may still be certain subpro-
cesses and aspects of engineering design that cannot
be easily supported and captured by a CAD tool,
such as the designer’s knowledge [42, 43]. It is also
legitimate to demand a way to distinguish the
learning of the CAD tool per se (especially whenthe CAD tool is too complicated for students to
master in a short time) from the learning of themore
important and transferable engineering content and
skills that theCADtool is intended to teach.Despite
these limitations, the time series analysis represents
a promising step towards a more rigorous metho-
dology for performance assessments of engineering
design at large scales.Another limitation is that user data logging is
currently not widely supported by CAD tools. This
is understandable because most CAD programs
have been developed for professional engineers to
solve engineering problems, not for educational
researchers to conduct research. This series of
work aims to explore the values of data mining
within CAD tools using our own Energy3D CADprogram as an example. The process analytics we
are spearheading could result in robust designer
modeling [44] that may eventually spur other
CAD developers to consider incorporating data
mining into their programs to increase the system
intelligence for improving user experience, boosting
user productivity, and stimulating user creativity.
7. Conclusions
This paper demonstrates that the time series analy-
sis of CAD logs can reveal student patterns andgender differences in engineering design that have
been observed in earlier studies using traditional
assessment methods. This research technique pro-
vides potentially more reliable performance assess-
ments because aCADtool offers a highly interactive
learning environment with compelling computer
graphics that can entice students to devote more
time and explore more ramifications. For as long asstudents are engaged, they will likely produce enor-
mous quantities of learning data that can be auto-
matically collected and analyzed to provide
objective evidence of learning and suggest effective
strategies to improve learning. This unique integra-
tion of computer-aided design and computer-based
assessments provides a powerful technology that
serves learning, assessment, and research goals at
the same time with maximal efficiency.
Acknowledgments—This work is supported by the NationalScience Foundation (NSF) under grant numbers 0918449 and1348530. Any opinions, findings, and conclusions or recommen-dations expressed in this paper, however, are those of the authorsand do not necessarily reflect the views of the NSF. The authorsare indebted to Ted Fuist and Larry Weathers for assistance inconducting this research study at their school.
References
1. Achieve, Next Generation Science Standards, Washington,DC, 2013.
2. National Research Council, A Framework for K-12 ScienceEducation: Practices, Crosscutting Concepts, and Core Ideas,The National Academies, Washington, DC, 2011.
3. WestEd, Technology and Engineering Literacy Frameworkfor the 2014 National Assessment of Educational Progress,WestEd2010.
4. C. J. Atman and K. Bursic, Verbal protocol analysis as amethod to document engineering student design processes,Journal of Engineering Education, 87, 1998, pp. 121–132.
5. K. A. Ericsson and H. Simon, Protocol Analysis: VerbalReports as Data, MIT Press, Cambridge, MA, 1993.
6. A. Dong, A. H. Hill and A. M. Agogino, A documentanalysis for characterizing design team performance,ASME Journal of Mechanical Design, 126, 2004, pp. 378–385.
7. C. J. Atman, R. S. Adams, M. E. Cardella, J. Turns, S.Mosborg and J. Saleem, Engineering design processes: acomparison of students and expert practitioners, Journal ofEngineering Education, 96, 2007, pp. 359–379.
8. C. J. Atman, K. Deibel and J. Borgford-Parnell, The processof engineering design: a comparison of three representations,The InternationalConference onEngineeringDesign (ICED),Palo Alto, CA, 2009, pp. 483–494.
9. P. Lloyd, B. Lawson and P. Scott, Can concurrent verbaliza-tion reveal design cognition?, Design Studies, 16, 1995,pp. 237–259.
10. C. J. Atman, D. Kilgore and A. McKenna, Characterizingdesign learning: a mixed-methods study of engineeringdesigners use of language, Journal of Engineering Education,97, 2008, pp. 309–326.
11. U.S. Department of Education, National Educational Tech-nology Plan 2010: Transforming American Education:Learning Powered by Technology, Office of EducationalTechnology, U.S. Department of Education, WashingtonDC, 2010.
12. J. Clarke-Midura, C. Dede and J. Norton, Next generationassessments for measuring complex learning in science,rennie center for education research and policy, 2011.
13. P.Horwitz, Interactive technology for formative assessment:how we got here and what comes next, New Frontiers inFormative Assessment, P. E. Noyce and D. T. Hickey (Eds),Harvard Education Press, Cambridge, Massachusetts, 2011.
14. K. W. McElhaney and M. C. Linn, Investigations of acomplex, realistic task: Intentional, unsystematic, andexhaustive experimenters, Journal of Research in ScienceTeaching, 48, 2011, pp. 745–770.
15. M. A. Sao Pedro, R. Baker, J. Gobert, O. Montalvo and A.Nakama, Using machine-learned detectors of systematicinquiry behavior to predict gains in inquiry skills, UserModeling and User-Adapted Interaction, 2012.
16. J.D.Gobert,M.A. SaoPedro,R. S. J.D.Baker, E.Toto andO. Montalvo, Leveraging educational data mining for real-time performance assessment of scientific inquiry skillswithin microworlds, Journal of Educational Data Mining, 4,2012, pp. 111–143.
17. T. Lewis, Design and inquiry: bases for an accommodation
Assessing Engineering Design Processes Using a CAD Tool 229

between science and technology education in the curricu-lum?, Journal of Research in Science Teaching, 43, 2006,pp. 255–281.
18. G. Bull, J. Chiu, R. Berry, H. Lipson and C. Xie, Advancingchildren’s engineering through desktop manufacturing,Handbook of Research on Educational Communications andTechnology (J. M. Spector et al.), Springer, 2014.
19. C. V. Schwarz, B. J. Reiser, E. A. Davis, L. Kenyon, A.Acher, D. Fortus et al., Developing a learning progressionfor scientificmodeling: making scientificmodeling accessibleand meaningful for learners, Journal of Research in ScienceTeaching, 46, 2009, pp. 632–654.
20. R.G.DuncanandC.E.Hmelo-Silver,Learningprogressions:Aligning curriculum, instruction, and assessment, Journal ofResearch in Science Teaching, 46, pp. 606–609, 2009.
21. M. Wilson, Measuring progressions: Assessment structuresunderlying a learning progression, Journal of Research inScience Teaching, 46, 2009, pp. 716–730.
22. D. P. Crismond and R. S. Adams, The informed designteaching and learning matrix, Journal of Engineering Educa-tion, 101, 2012, pp. 738–797.
23. P. J. Brockwell and R. A. Davis, Time Series: Theory andMethods, Springer, 2009.
24. W. W. S. Wei, Time Series Analysis: Univariate and Multi-variate Methods, 2nd edn, Pearson, 2005.
25. M. Bienkowski,M. Feng andB.Means,Enhancing TeachingandLearningThroughEducationalDataMining andLearningAnalytics: An Issue Brief, Office of Educational Technology,U.S. Department of Education, Washington, DC, 2012.
26. U.S. Department of Education, Expanding EvidenceApproaches for Learning in a Digital World, Washington,DC, 2013.
27. IBM. (2012, May 1st). What is big data? Available: http://www-01.ibm.com/software/data/bigdata/
28. A. Sanna, F. Lamberti, G. Paravati and C. Demartini,Automatic assessment of 3D modeling exams, IEEE Trans-actions on Learning Technologies, 5, 2012, pp. 2–10.
29. P. Littlefair, Passive solar urban design ] ensuring thepenetration of solar energy into the city, Renewable andSustainable Energy Reviews, 2, 1998, pp. 303–326.
30. C. J. Atman, J. R. Chimka, K. M. Bursic and H. N.Nachtmann,A comparison of freshman and senior engineer-ing design processes, Design Studies, 20, 1999, pp. 131–152.
31. J.W.Dally andG.M.Zhang,A freshmanengineering design
course, Journal of Engineering Education, 82, 1993, pp. 83–91.
32. N. Mentzer and K. Park, High School students as novicedesigners,TheAnnual Conference of theAmericanSociety forEngineering Education, San Antonio, Texas, 2011.
33. Massachusetts Department of Education, MassachusettsScience and Technology/Engineering Curriculum Frame-work, 2006.
34. J. P. Byrnes, D. C. Miller and W. D. Schafer, Genderdifferences in risk taking: A meta-analysis, PsychologicalBulletin, 125, 1999, pp. 367–383.
35. R. Kimbell and K. Stables, Researching design learning:Issues and findings from two decades of research and develop-ment, Springer, Lexington, KY, 2007.
36. B.F.RobertsonandD.F.Radcliffe, Impact ofCADtools oncreative problem solving in engineering design, Computer-Aided Design, 41, 2009, pp. 136–146.
37. D. G. Jansson and S. M. Smith, Design fixation, DesignStudies, 12, 1991, pp. 3–11.
38. G. N. Svarovsky and D. W. Shaffer, SodaConstructingKnowledge through Exploratoids, Journal of Research inScience Teaching, 44, 2007, pp. 133–153.
39. N. Trcka, M. Pechenizkiy and W. van der Aalst, Processmining from educational data, Handbook of EducationalData Mining, C. Romero, S. Ventura, M. Pechenizkiy andR. S. J. d. Baker (Eds), Chapman & Hall / CRC, 2010,pp. 123–142.
40. R. F. Woodbury and A. L. Burrow, Whither design space?,Artificial Intelligence for Engineering Design, Analysis andManufacturing, 20, 2006, pp. 63–82.
41. C. L. Dym, A. Agogino, O. Eris, D. Frey and L. Leifer,Engineering design thinking, teaching, and learning, Journalof Engineering Education, 94, 2005, pp. 103–120.
42. R. C. W. Sung, J. M. Ritchie, H. J. Rea and J. R. Corney,Automated design knowledge capture and representation insingle-user cad environments, Journal of EngineeringDesign,22, 2011, pp. 487–503.
43. R. C. W. Sung, G. Robinson, P. N. Day, J. M. Ritchie, J. R.Corney and T. Lim, Automated design process modellingand analysis using immersive virtual reality,Computer-AidedDesign, 41, 2009, pp. 1082–1094.
44. G. Fischer, User modeling in human–computer interaction,User Modeling and User-Adapted Interaction, 11, 2001,pp. 65–86.
Charles Xie is a senior scientist at the Concord Consortium who works at the intersection of computational science and
educational research. His work primarily focuses on two areas: 1) Using computational science to create scientifically
accurate and visually appealing simulation environments that support inquiry and design; and 2) using computational
science to analyze learning process data logged by simulation software while students are engaged in inquiry and design
activities.He holds a Ph.D. inmaterials science from theUniversity of Science andTechnology, Beijing.He is the Principal
Investigator of the NSF project that funded this work (grant numbers 0918449 and 1348530).
Zhihui Zhang is a research scientist at the ConcordConsortium. She holds a Ph.D. in science education fromUniversity of
California, Berkeley. Her research focuses on computer-based curriculum and assessment design, classroom design
studies, and student learning with computational visualizations.
Saeid Nourian is a computer scientist at the Concord Consortium.He is the lead software developer of Energy3D. Prior to
joining the Concord Consortium, he has conducted research in 3D graphics and virtual reality technologies. He holds a
Ph.D. in computer science from the University of Ottawa.
Amy Pallant is a senior research scientist at the Concord Consortium. Her work involves research and curriculum
development around cutting edge earth and environmental science and engineering curriculum. She has been developing
curricula and contributing to research studies focused on the development of effective educational technology at the
Concord Consortium for 14 years.
Edmund Hazzard is a curriculum developer at the Concord Consortium. His work focuses on two areas: (1) The
development of probes and handhelds for inquiry-based learning, especially in physics, and (2) student use of computer
modeling tools to learn about complex systems and emergent phenomena. He has degrees in physics, architecture, and
teaching.
Charles Xie et al.230