time-of-flight neutron spectrometer for dt-plasma diagnostics
TRANSCRIPT
Nuclear Instruments and Methods in Physics Research A238 (1985) 147-152North-Holland, Amsterdam
TIME-OF-FLIGHT NEUTRON SPECTROMETER FOR DT-PLASMA DIAGNOSTICS
Th. ELEVANT
Royal Institute of Technology, Stockholm, Sweden
M. OLSSONChalmers Institute of Technology, Göteborg, Sweden
Received 18 December 1984
A novel technique for energy measurements of fusion neutrons from DT-plasmas has been investigated . The method is based ondouble interaction of neutrons in two scintillators and uses time-of-flight measurement . By using a deuterium based first detector andrecording the backscattered neutrons the resolution is found to be 3.5% for 14 MeV neutrons with a flight path equal to 2 m.
1. Introduction
Neutron energy measurements play an importantrole in diagnostics of fusion plasmas in large tokamaks,e.g. JET. Fusion reactions like D(d,n) 3He and T(d,n) QHeproduce neutrons with energies of 2.5 and 14.1 MeVrespectively . In a Maxwellian plasma the energy distri-bution of neutrons produced in such fusion reactions isa unique function of the ion temperature of the plasma[1]. Therefore, by measuring the neutron energy broad-ening, the plasma ion temperature can be determined.As the neutrons can escape through the walls of thetokamak, the neutron energy spectrum can be measuredby spectrometers located outside the vacuum vessel.This makes neutron spectrometry a promising techniquefor plasma diagnostics, and much efforts have beenmade to develop neutron spectrometers appropriate forthese applications [2-4].A neutron spectrometer suitable for energy measure-
ments of 2.5 MeV neutrons is described in refs . [4,5].The 14 .1 MeV spectrometer presented in this paper isbased on time-of-flight measurements of neutrons inter-acting with two scintillation detectors. In the first scin-tillator, which is deuterium based, incoming neutronsare elastically scattered in the backward direction to-wards the second scintillator, which is hydrogen based.Results are presented from experimental investigationsand spectrum broadenings, and uncertainties are ex-pressed in terms of fwhm (full width at half-maximum)throughout the report.
Experimental geometry and the utilized scintillatorsand electronics are described in sect . 2 together with theused neutron source and shielding arrangements.
Measured neutron time-of-flight spectra are pre-
0168-9002/85/$03.30 © Elsevier Science Publishers B.V .(North-Holland Physics Publishing Division)
sented in sect . 3 and counting rates for the separatedetectors as well as the system counting rate are given.A numerical method, which have been used for anal-
ysis of the timing peaks with regard to their widths, isdescribed in sect . 4. Transformation of the obtainedtiming broadening to energy broadening is made andthe energy broadening as a function of the flight pathlength is presented. Comparisions are made with theo-retical predictions and the experimentally obtained en-ergy resolution is discussed .
2. Experimental method
147
The experimental geometry is shown in fig . 1 . Neu-trons leave the target and are elastically scattered in thefirst detector, Do, which is deuterium based. A smallfraction of the neutrons are elastically scattered bydeutrons in a nearly backward direction and some ofthese are detected by the second detector, Dl, which ishydrogen based. 1 is the flight path length, 0 is thescattering angle, and -~ is the angle of emergence of theused neutrons to the ion beam .
2.1 . Neutron source
The experiments have been performed at the Studs-vik Van de Graaff accelerator . A thick solid tritium-titanium target (5 Ci T in Ti on Cu backing) has beenutilized for T(d,n) °He reaction . In order to minimizethe energy broadening of the utilized neutrons, 4, waschosen to 100° . According to ref . [6] the neutron energyvariation for deutron energies between 0 and 1 MeVreaches a minimum of about 100 keV in this direction .

148
Fig. 1 . The experimental geometry and shielding arrangementsare shown. Different values of the flight path length 1 havebeen obtained by moving the Dl detector.
The uncertainty in 41 due to the finite dimensions of Dowill also contribute to the energy broadening . Thiscontribution can also be estimated from ref . [6] and thetotal source energy broadening is expected to be lessthan 1.5% in the chosen direction. In the experiments adeutron energy of about 1 MeV and a beam current ofabout 10 pA have been used . The average energy of theutilized neutron was 14 .0 MeV.
2.2. Detectors
iron
copper
lead
paraffin
Four different detector systems have been investi-gated.
(1) The first system is shown in fig. 2. The Dodetector is a deuterium rich liquid scintillator (NE 232,thickness = 1", diameter =1.5"), with a photomultipliertube (XP 2020) supported by a high voltage divider(Philips S563). The Dl detector is a fast, plastic, hydro-gen based scintillator (Pilot U, thickness = 1", diameter= 4"), with a photomulitplier tube (XP 2040) supportedby a high voltage divider (Philips S563).
(2) The second system is identical to the first oneexcept for the scintillator thickness in Do and Dl, whichis 0.5" .
(3) The third system, which is shown in fig . 2, usesthe same equipment for the Do detector as the firstsystem. The Dl detector consists of two long, plane,hydrogen based scintillators (Bicron 420, 40 cm X 2" X0.5"), held together, forming a scintillator body of 40cm X 2" X 1" . A photomultiplier tube (XP 2020) islocated at each short end of the scintillators .
(4) The fourth system is identical to the third sys-tem except for the scintillator thickness in Do and Dl
Th . Eleoant, M. Olsson / TOFspectrometer for DT-plasma diagnostics
ion beam
NE232
20
PS5ti3
Do
D,Alt .
system(1),(2)
system(3)) (4)
Anode
CFDD
Delay
Experimental hall
TAC
Start "Stop
MCA
PilotU2040
PhilipsS563
Anode
FC-FD-D-1
Bicron
Meantimer
AnodePhilips5563XP2020
420
X2020
PS5163Anode
CFDD CFDD
Fig . 2 . The detector systems with electronics are shown. Fourdifferent systems have been used as described in sect. 2.2 .
which is 0.5" . In the Dl detector this is obtained byusing only one long, plane scintillator.
When using the detector systems (3) and (4) with along scintillator in the Dl detector, the orientation ofthis scintillator is such that the neutron time-of-flight, isconstant along the scintillator, i.e . T is constant in therelation
[(cost 0+3)1 2
+ cos (P,
where an is the velocity of the incident neutron [7] .
2.3 . Electronics
The utilized electronics are shown in fig. 2. Thenegative anode pulses from the photomultiplier tubesare fed into constant fraction differential discriminators(CFDD Ortec 583) . By setting the lower discriminatorlevel on the Do CFDD at 90% of maximum amplitudeof the pulses from the photomultiplier tube, the number

of uncorrelated events have been suppressed. When
output pulses from the TAC-unit are fed into a multiusing the detector systems with a long scintillator in Dl,
channel analyser (MCA) giving timing spectra .the CFDD pulses originating from the two photomulti-plier tubes in Dl are fed into a meantimer (LeCroy),
2.4. Shieldinggiving negative output pulses similar to those from the
The rate of random coincidences NR in the systemCFDD. Pulses from the Dl detector are fed into a time
can be estimated from the relationto amplitude converter (TAC), where they serve asstarting pulses . Adequately delayed pulses from the
NR = 2NON,A-r,
(2)CFDD of the Do detector serve as stopping pulses . The
50~
Counts$ =1 44m
n
system (1)
Th. Eleuant, M. Olsson / TOF spectrometer for DT-plasma diagnostics
149
50
system (1)
Countst =1 61 m
r Ch nr70 80 90 160 50 60 70
~Pdl~Ch nr
Ch nr100 110 120 130 70 80 90 100
Fig . 3 . (a)-(h) .
200
100
200
100
system (2)
system (3)
70 80 90
Counts
$=191m
__Ch nr
10 20 30
system (3)9)
h)
100
Counts
E=2 20m
Ch nr
80 90 100
150
100
Counts
Q =1 50m
Fig. 3.
3. Experimental results
4. Analysis of results
Th . Elevant, M. Olsson / TOFspectrometer for DT-plasma diagnostics
system (4)
50
CountsE =190m
hLNCh nr
80 90 100
20 30 40
I_ Ch nr]
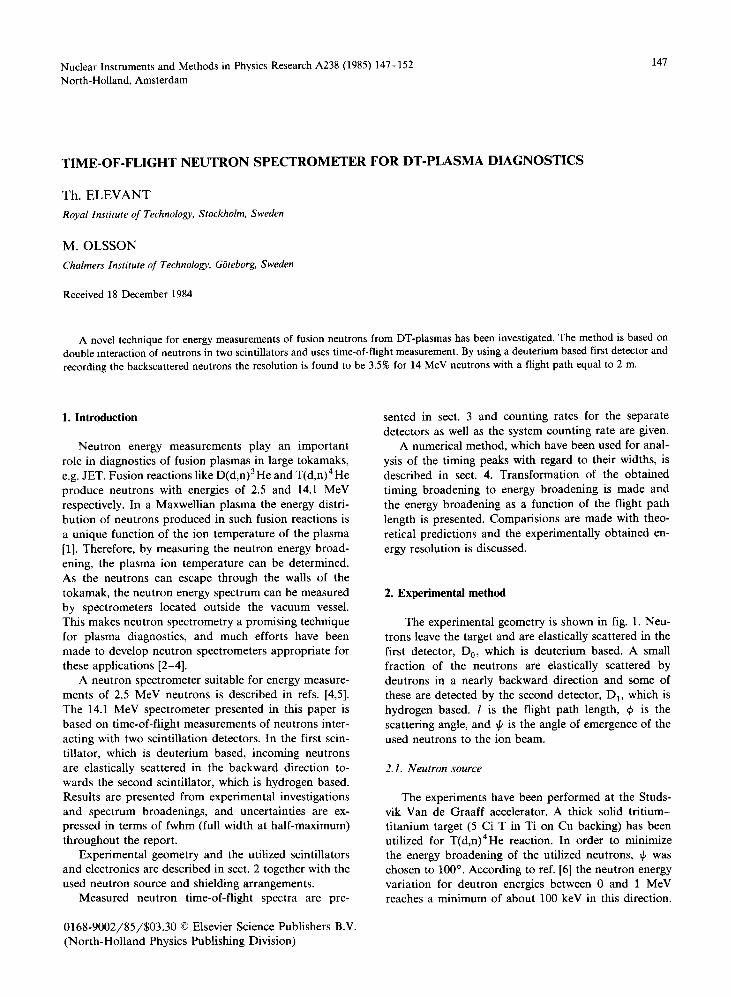
90 100Time-of-flight spectra for different flight path lengths l and detector systems. The channel width is 0.387 ns .
Ch nr
where No and N1 are the counting rates in the detectorsDo and Dl respectively and AT is the time window ofthe coincidence. It is by obvious reasons desirable tokeep No and N1 as small as possible, without losing anytrue coincidences . No have been reduced by amplitudediscrimination in the CFDD of Do . In order to keep N1small, Dl has been shielded from the target by a conicalbody of iron, copper and lead, as indicated in fig . 1.
Fig. 3 shows the timing spectra. The measured quan-tity is the time of flight T for the scattered neutrons .The neutron flight path length and the utilized detectorsystems are indicated in the figures . The counting ratesin the Do and Dl detectors were about 5 x 10 3 cps and4 x 103 cps respectively for the systems (1) and (2) andup to ten times higher for the systems (3) and (4) . Thecorresponding system counting rates were about 5 x10 -Z cps and up to 5 x 10 -1 cps respectively. Thereforea major part of the events in Do and D1 are uncorre-lated and according to eq . (2) these events cause ran-dom coincidences, which appear as background in themeasured spectra .
4.1 . Theoretical energy resolution
The theoretical energy resolution of the spectrometer
50+
system (4)
k)
f Countst=2 20m
70 80
is given by ref . [8], asz
~~4EE ) = 4[(dl)z+(dTv~)z] -F( AE-ES)
z
where dl is the scintillator thickness, v,' is the velocityof the scattered neutron (v; = v�/3), d T is the timinguncertainty of the electronics and 4ES/Es is the relativebroadening of the neutron source .
The contribution to the width due to the uncertaintyin the scattering angle is neglected. That contribution
50
1 Counts
-1
-~ ~-
Ch n r+~70 80 90 100
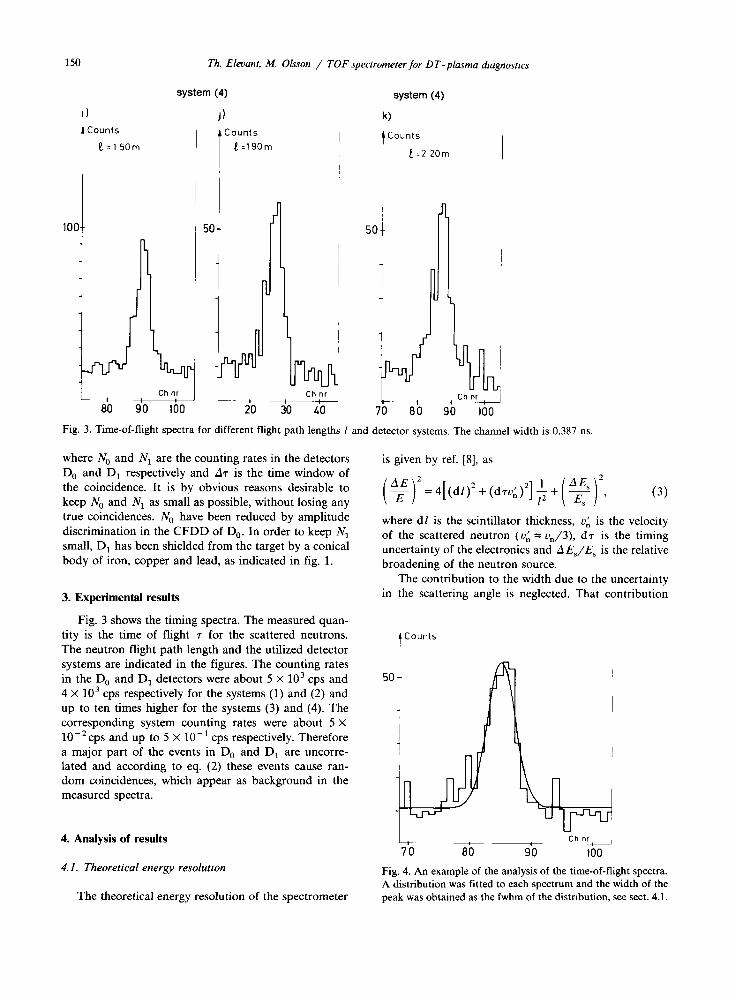
Fig. 4. An example of the analysis of the time-of-flight spectra .A distribution was fitted to each spectrum and the width of thepeak was obtained as the fwhm of the distnbution, see sect . 4.1 .

30 "°-E )
2-104
É) 1042
system (1)
system (3)
system (4)
Th. Devant, M. Olsson
1.2(m2 )
01
0.2
0.3
04
0.5
Fig. 5 . (,1E/E ) 2 is shown vs 1-2 . According to eq. (3) this isexpected to be a linear function . The straight hues in thefigures are least-squares fits to the measured points. For onedetector system (system (2)) only one measurement was madeand this is marked in parentheses in fig. 5c .
/ TOF spectrometer for DT-plasma diagnostics
can be obtained by differentiating the expression for thekinematics given in ref . [7] and for the systems (1) and(2) it is found to be less than 1% . For the systems (3)and (4) the D, scintillator orientation (see eq. (1)) issuch that the contribution should be negligible . Theequation for timing broadening corresponding to eq . (3)for energy broadening is
(aT )2= dl
2+(dT)2,
(4)U n /
provided that the source contribution is negligible . Byassuming that dT is approximately the same for neutronand -y-events and using an annihilation -y-source, dT canbe determined. The other term in eq . (4) is negligible fory-events (vn = co). In this investigation dT was found tobe about 0.8 ns.
4.2 . Experimental energy resolution
In fig . 5, (AE/E)2 is shown versus 1-2 for three ofthe detector systems. Only one measurement was madewith detector system (2) and this measurement is alsoindicated in fig. 5c). According to eq . (3), (4E/E )2should be a linear function of 1-2 . The straight linesindicated in the figures are least-squares fits to themeasured data . By comparing the least-squares fits witheq . (3), the neutron source energy width and the scintil-lator thicknesses can be obtained. dl is found to be 2.2cm, 2.4 cm and 1.7 cm for the systems (1), (3) and (4)respectively . The source energy widths are found to be1 .5%, 2.8% and 2.4% respectively . The values of dl arein good agreement with the real scintillator thicknesses(2 .5 cm, 2.5 cm and 1.25 cm respectively). The sourceenergy width is however expected to be constant andindependent of the used detector system in use. Apossible explanation for the variation in the calculatedsource width is that a small error in the inclination ofthe straight line, from which dl is calculated, wouldcause a relatively large error in the crossing of they-axis, from which the source width is calculated . Thestatistical uncertainties in the measured relative peakwidths is found to be about 4% corresponding to anuncertainty of about 8% in the squares of the relativewidths . This uncertainty could cause a sufficient error inthe inclination of the straight line to cause the uncer-tainty in the estimation of the source energy width.Assuming a source energy width equal to 1.5%, theenergy resolution of the spectrometer is experimentallyfound to be 3.4%, 4.4% and 3.3% for the systems (1), (3)and (4) respectively and a flight path length of 2 m.
5. Conclusions
Results from experimental investigations are inagreement with predicted energy resolutions. One half

152
inch systems (2) and (4) generally provide better resolu-tion than one inch systems (1 and 3) . Furthermore,systems with small scintillators and one large (diameter= 5") photomultiplier tube show better performancethan systems with long scintillator, two photomultipliertubes and a meantimer. Utilization of a half inch smalldetector system and a flight path length around twometers would enable measurements of peak ion temper-atures from approximately 8 keV. Apparently improved
resolution can be obtained by increasing the flight pathlength which, however, will reduce the efficiency accord-ing to 1-z .
References
[1] W.R. Faust and E.G. Harris, Nucl . Fusion 1 (1960) 62 ; G.Lehner and F. Pohl, Z. Physik 207 (1967) 83 ; G. Lehner, Z.Physik 23 (1970) 174; G. Lehner and F. Pohl, IPP 1/107(1970) ; M.M.R. Williams, J. Nucl . Energy 25 (1971) 489;
Th. Elevant, M. Olsson / TOFspectrometerfor DT-plasma diagnostics
S.P. Bogdanov andV.I . Volosov, Recent Advances in PlasmaDiagnostics, vol. 3 (Consultants Bureau, New York, 1971)p. 1; H. Brysk, Plasma Phys. 15 (1973) 611; D.W . Muir,Proc . 1st Top. Meeting Technology of Controlled ThermalFusion, vol. 2, San Diego (1974) p. 166; D.H . Lessor,Batelle BNWL-B-409 (1975) ; H. Liskien, Nucl . Sci. Eng. 71(1979) 57 ; for a recent review see H.W . Hendel, Proc. Conf .on Diagnostics for Fusion Reactor Conditions, Varenna(1982).
[2] O.N . Jarvis, International School of Plasma Physics,Varenna, Italy (Sept. 1982) vol. 1.
[3] H.W . Hendel, ibid.[4] T. Elevant, Nucl . Instr. and Meth. 185 (1981) 313.[5] T. Elevant, J. Lorenzen and B. Trostell, TRITA-PFU-81-O1,
Royal Institute of Technology, Sweden.[6] H. Liskien and A. Paulsen, Nucl. Data Tables 11 (1973)
569.[7] J.B . Marion and J.L . Fowler, Fast Neutron Physics, part 1
(Interscience, New York, 1963) .[8] F.W.K. Firk, Nucl . Instr. and Meth. 162 (1979) 539.