tier two – intervention & progress monitoringidahotc.com/portals/23/docs/training/tier...
TRANSCRIPT

Tier Two – Intervention & Progress Monitoring
Evelyn Johnson, Ed.D.
This training is adapted from Fuchs & Fuchs: Using CBM in an RTI Frameworkhttp://www.rti4success.org
Introduction: RTI Overview
What is Tier 2?
How do we determine response?
2
1
How do we determine response?
Practice4
3
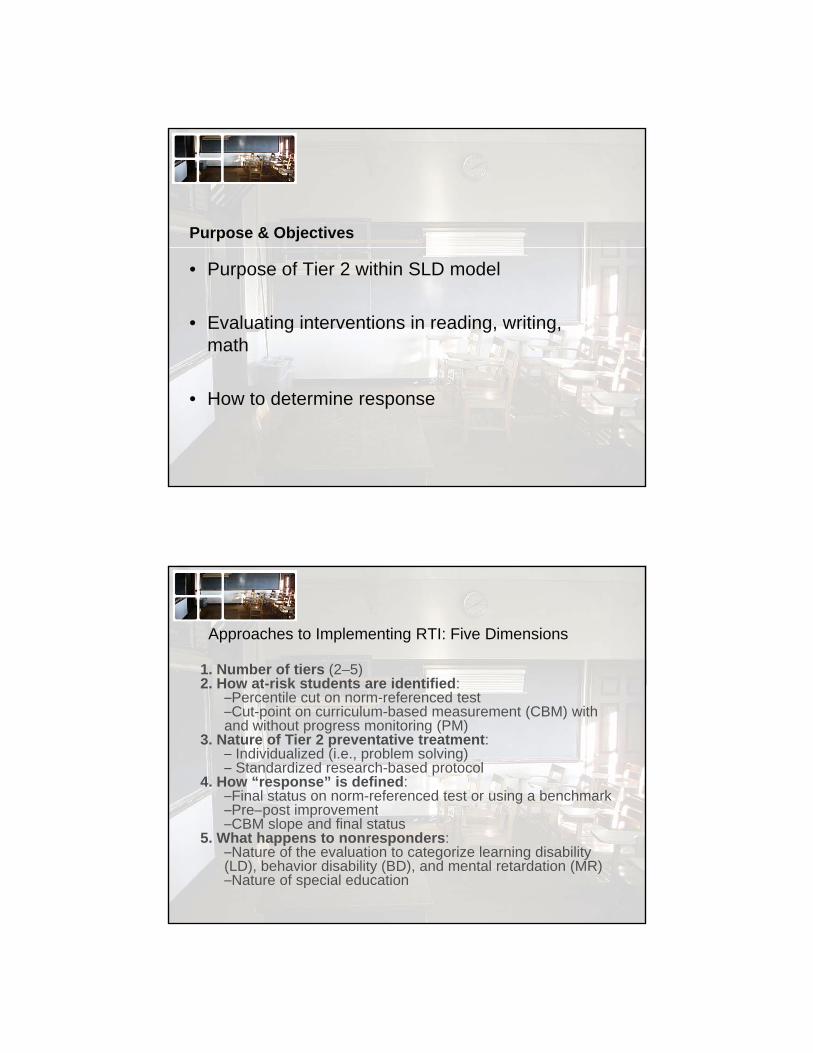
Purpose & Objectives
• Purpose of Tier 2 within SLD model
• Evaluating interventions in reading, writing, math
• How to determine response
Approaches to Implementing RTI: Five Dimensions
1. Number of tiers (2–5)2 How at-risk students are identified:2. How at-risk students are identified:
–Percentile cut on norm-referenced test–Cut-point on curriculum-based measurement (CBM) with and without progress monitoring (PM)
3. Nature of Tier 2 preventative treatment:– Individualized (i.e., problem solving)– Standardized research-based protocol
4. How “response” is defined:–Final status on norm-referenced test or using a benchmarkP t i t–Pre–post improvement–CBM slope and final status
5. What happens to nonresponders:–Nature of the evaluation to categorize learning disability (LD), behavior disability (BD), and mental retardation (MR)–Nature of special education
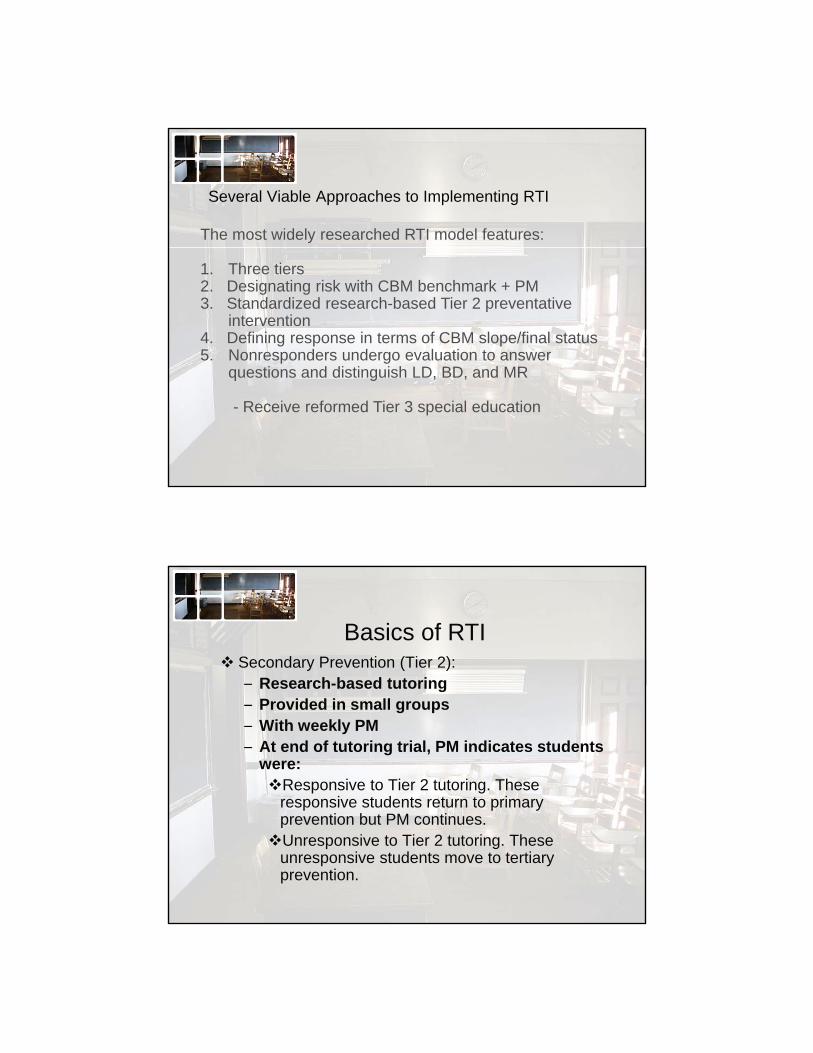
Several Viable Approaches to Implementing RTI
The most widely researched RTI model features:
1. Three tiers2. Designating risk with CBM benchmark + PM3. Standardized research-based Tier 2 preventative
intervention4. Defining response in terms of CBM slope/final status5. Nonresponders undergo evaluation to answer
ti d di ti i h LD BD d MRquestions and distinguish LD, BD, and MR
- Receive reformed Tier 3 special education
Secondary Prevention (Tier 2):– Research-based tutoring
Basics of RTI
Research-based tutoring– Provided in small groups– With weekly PM– At end of tutoring trial, PM indicates students
were:Responsive to Tier 2 tutoring. These
responsive students return to primaryresponsive students return to primary prevention but PM continues.Unresponsive to Tier 2 tutoring. These
unresponsive students move to tertiary prevention.
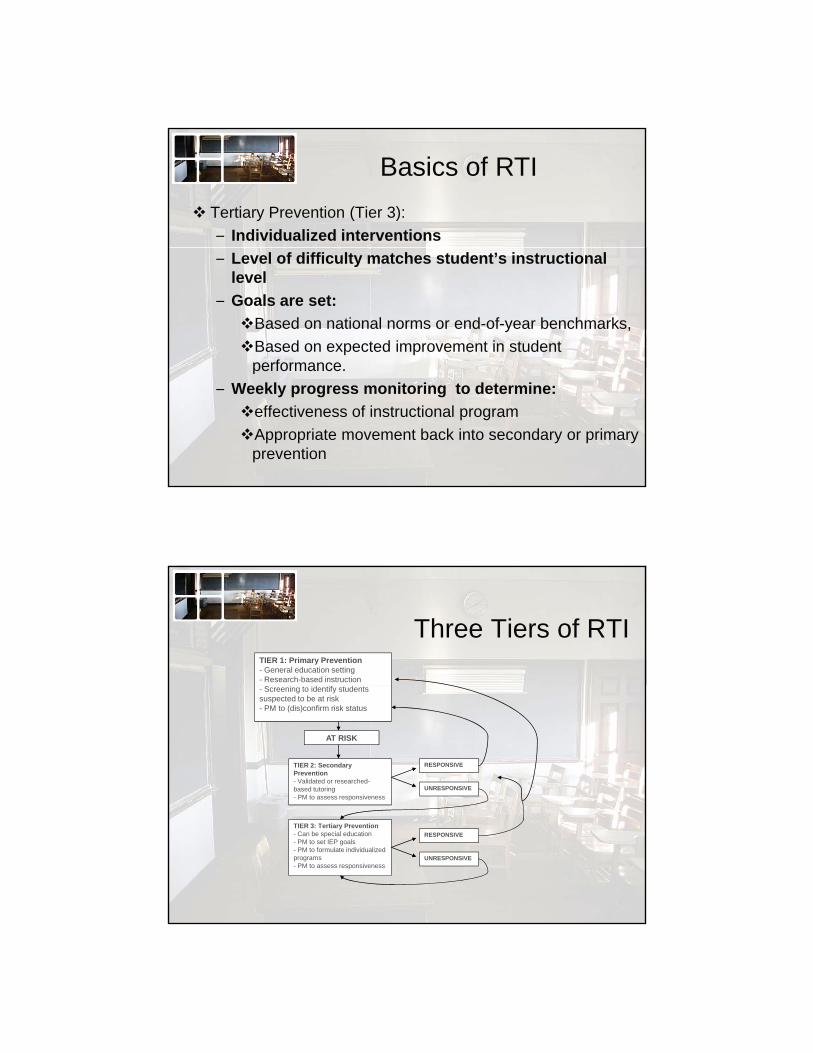
Tertiary Prevention (Tier 3):
– Individualized interventions
Basics of RTI
– Level of difficulty matches student’s instructional level
– Goals are set:
Based on national norms or end-of-year benchmarks,
Based on expected improvement in student performanceperformance.
– Weekly progress monitoring to determine:
effectiveness of instructional program
Appropriate movement back into secondary or primary prevention
Three Tiers of RTITIER 1: Primary Prevention- General education setting- Research-based instruction
TIER 2: Secondary Prevention- Validated or researched-based tutoring- PM to assess responsiveness
RESPONSIVE
UNRESPONSIVE
AT RISK
- Screening to identify students suspected to be at risk- PM to (dis)confirm risk status
TIER 3: Tertiary Prevention- Can be special education- PM to set IEP goals- PM to formulate individualized programs- PM to assess responsiveness
RESPONSIVE
UNRESPONSIVE
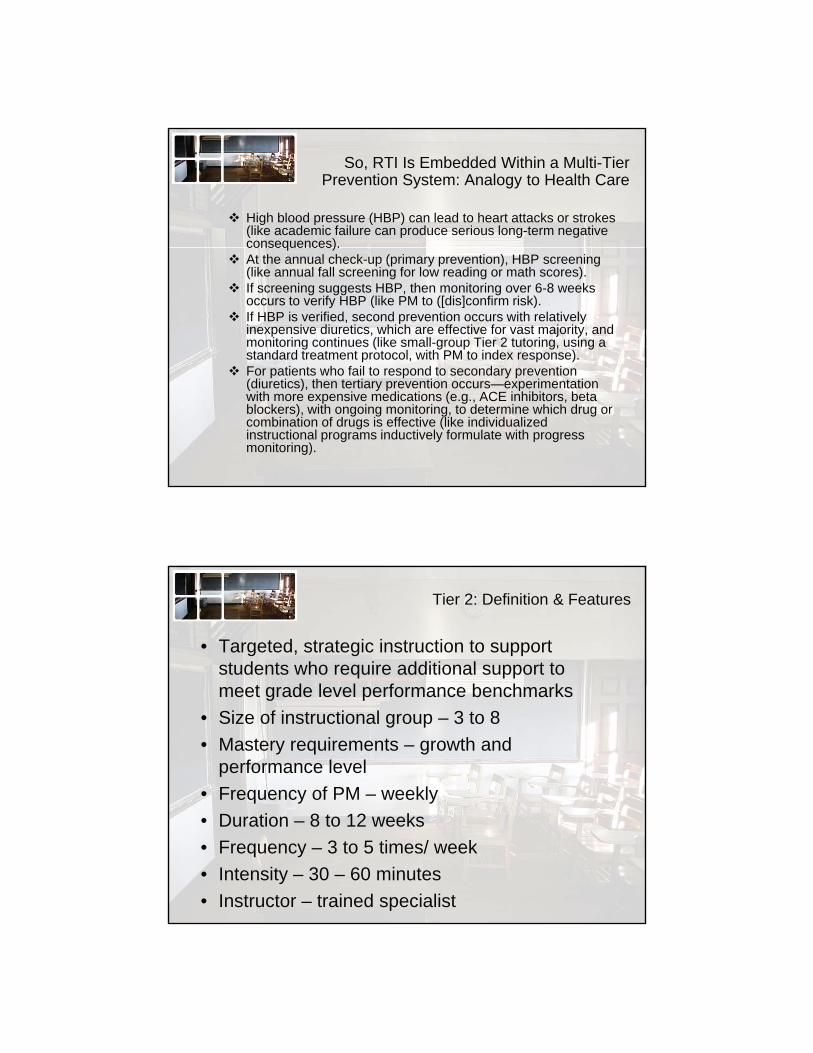
So, RTI Is Embedded Within a Multi-Tier Prevention System: Analogy to Health Care
High blood pressure (HBP) can lead to heart attacks or strokes (like academic failure can produce serious long-term negative consequences).consequences).
At the annual check-up (primary prevention), HBP screening (like annual fall screening for low reading or math scores).
If screening suggests HBP, then monitoring over 6-8 weeks occurs to verify HBP (like PM to ([dis]confirm risk).
If HBP is verified, second prevention occurs with relatively inexpensive diuretics, which are effective for vast majority, and monitoring continues (like small-group Tier 2 tutoring, using a standard treatment protocol, with PM to index response).
F ti t h f il t d t d ti For patients who fail to respond to secondary prevention (diuretics), then tertiary prevention occurs—experimentation with more expensive medications (e.g., ACE inhibitors, beta blockers), with ongoing monitoring, to determine which drug or combination of drugs is effective (like individualized instructional programs inductively formulate with progress monitoring).
Tier 2: Definition & Features
• Targeted, strategic instruction to support students who require additional support to
t d l l f b h kmeet grade level performance benchmarks
• Size of instructional group – 3 to 8
• Mastery requirements – growth and performance level
• Frequency of PM – weekly
• Duration – 8 to 12 weeks
• Frequency – 3 to 5 times/ week
• Intensity – 30 – 60 minutes
• Instructor – trained specialist
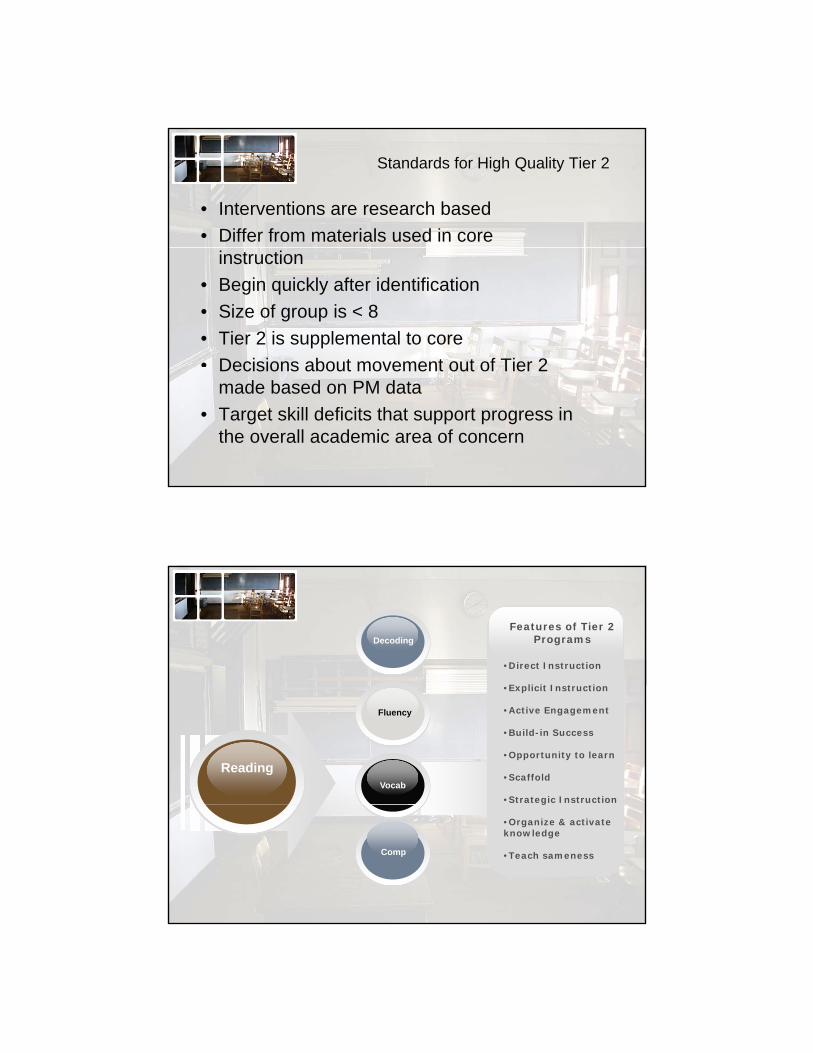
Standards for High Quality Tier 2
• Interventions are research based
• Differ from materials used in core instruction
• Begin quickly after identification
• Size of group is < 8
• Tier 2 is supplemental to core
• Decisions about movement out of Tier 2Decisions about movement out of Tier 2 made based on PM data
• Target skill deficits that support progress in the overall academic area of concern
Features of Tier 2 Programs
•Direct Instruction
E li it I t ti
Decoding
•Explicit Instruction
•Active Engagement
•Build-in Success
•Opportunity to learn
•Scaffold
•Strategic Instruction
ReadingVocab
Fluency
g
•Organize & activate knowledge
•Teach samenessComp
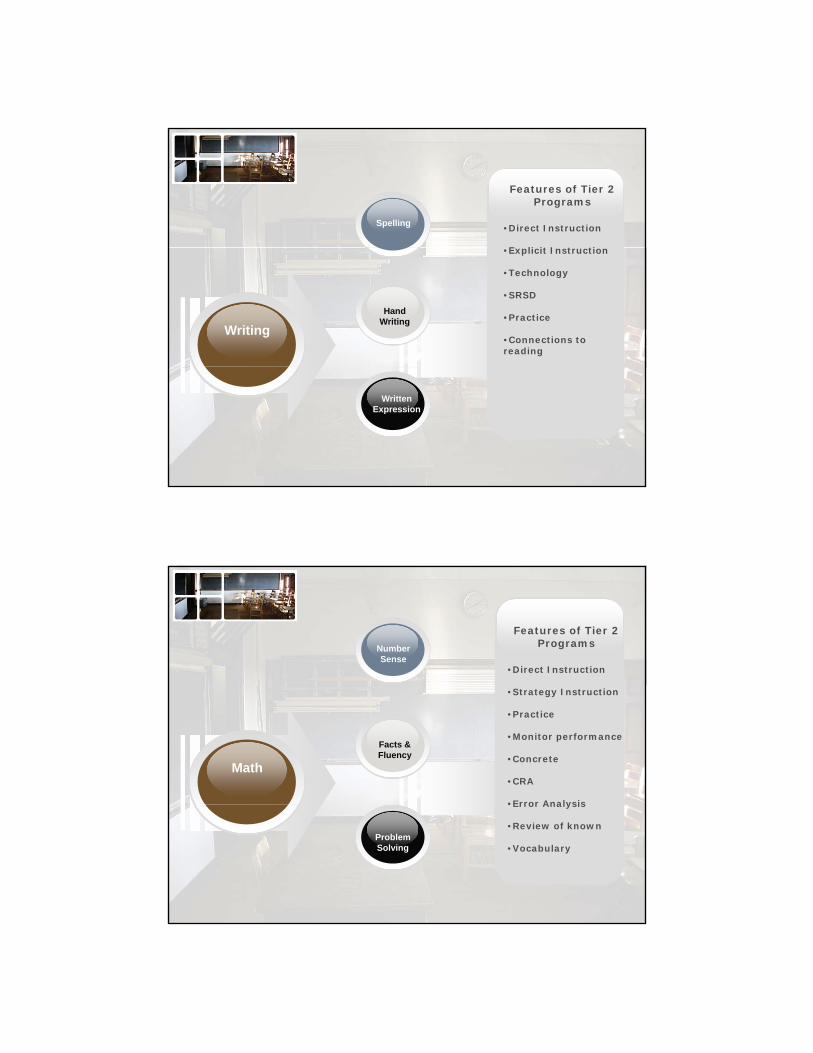
Features of Tier 2 Programs
•Direct Instruction
E li it I t ti
Spelling
•Explicit Instruction
•Technology
•SRSD
•Practice
•Connections to reading
Writing
Hand Writing
Written Expression
Features of Tier 2 Programs
•Direct Instruction
Number Sense
•Strategy Instruction
•Practice
•Monitor performance
•Concrete
•CRA
•Error Analysis
Math
Facts & Fluency
•Error Analysis
•Review of known
•VocabularyProblem Solving
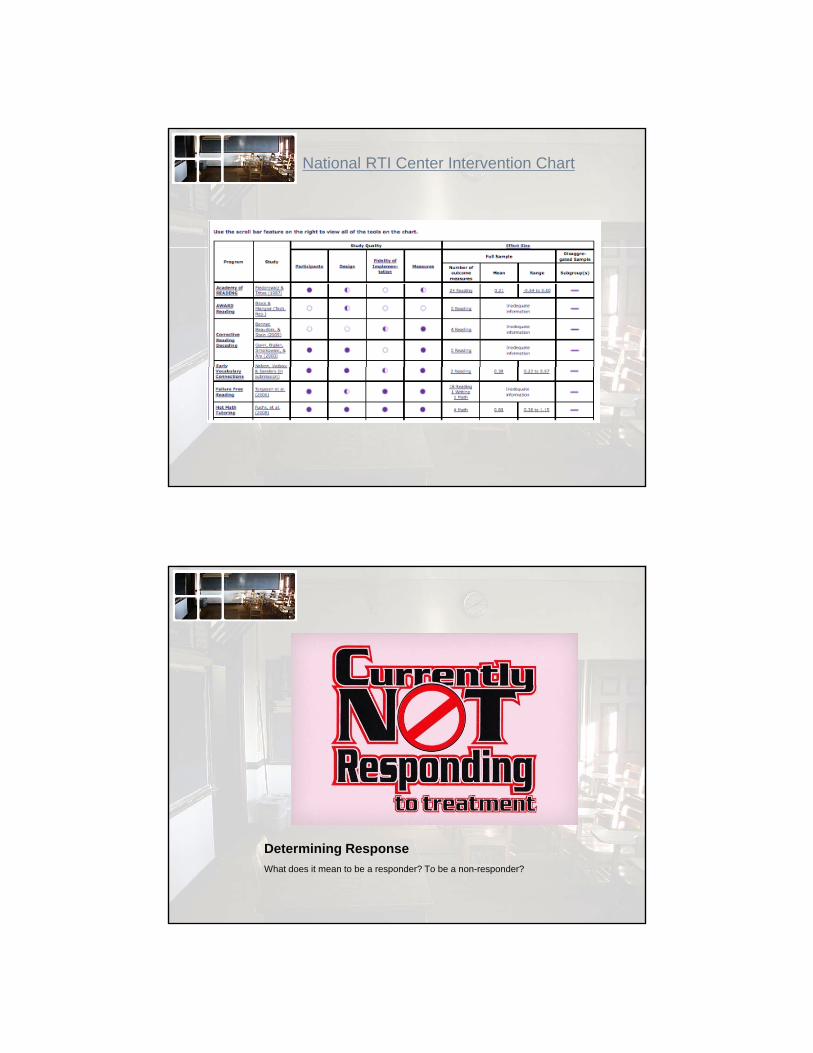
National RTI Center Intervention Chart
Determining Response
What does it mean to be a responder? To be a non-responder?
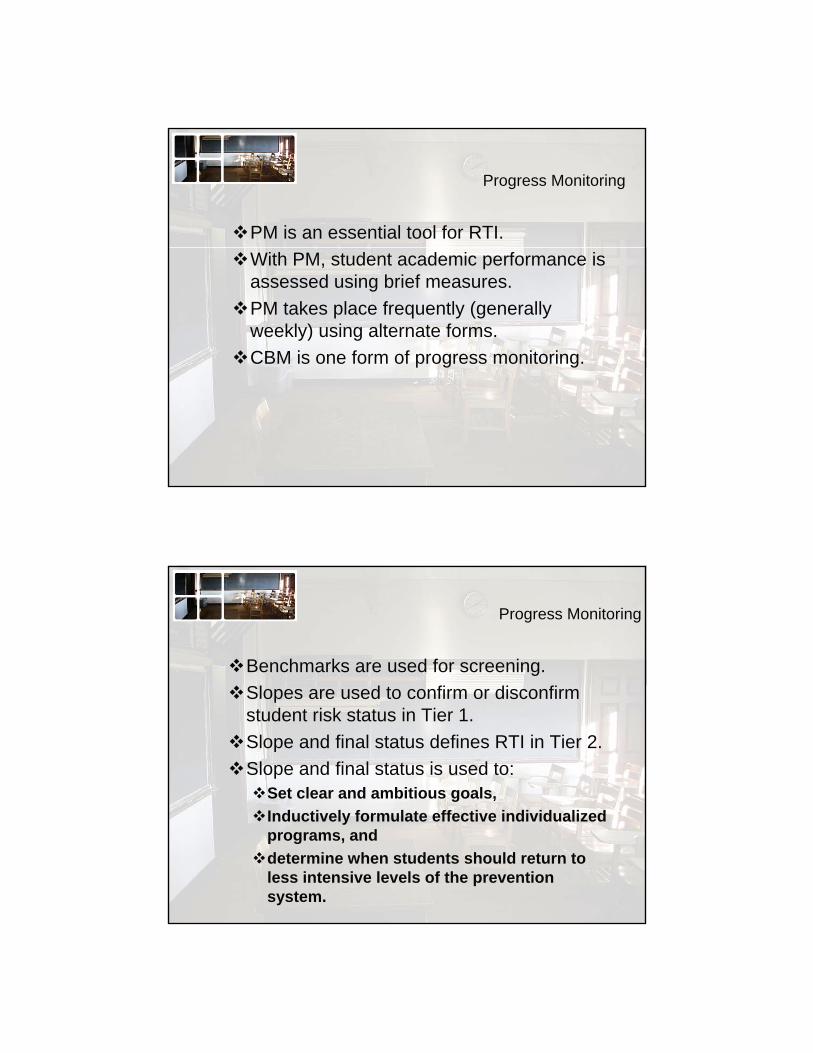
Progress Monitoring
PM is an essential tool for RTI.
With PM, student academic performance is assessed using brief measures.
PM takes place frequently (generally weekly) using alternate forms.
CBM is one form of progress monitoring.p g g
Progress Monitoring
Benchmarks are used for screening.
Slopes are used to confirm or disconfirm student risk status in Tier 1.
Slope and final status defines RTI in Tier 2.
Slope and final status is used to:Set clear and ambitious goals,
Inductively formulate effective individualized programs, and
determine when students should return to less intensive levels of the prevention system.
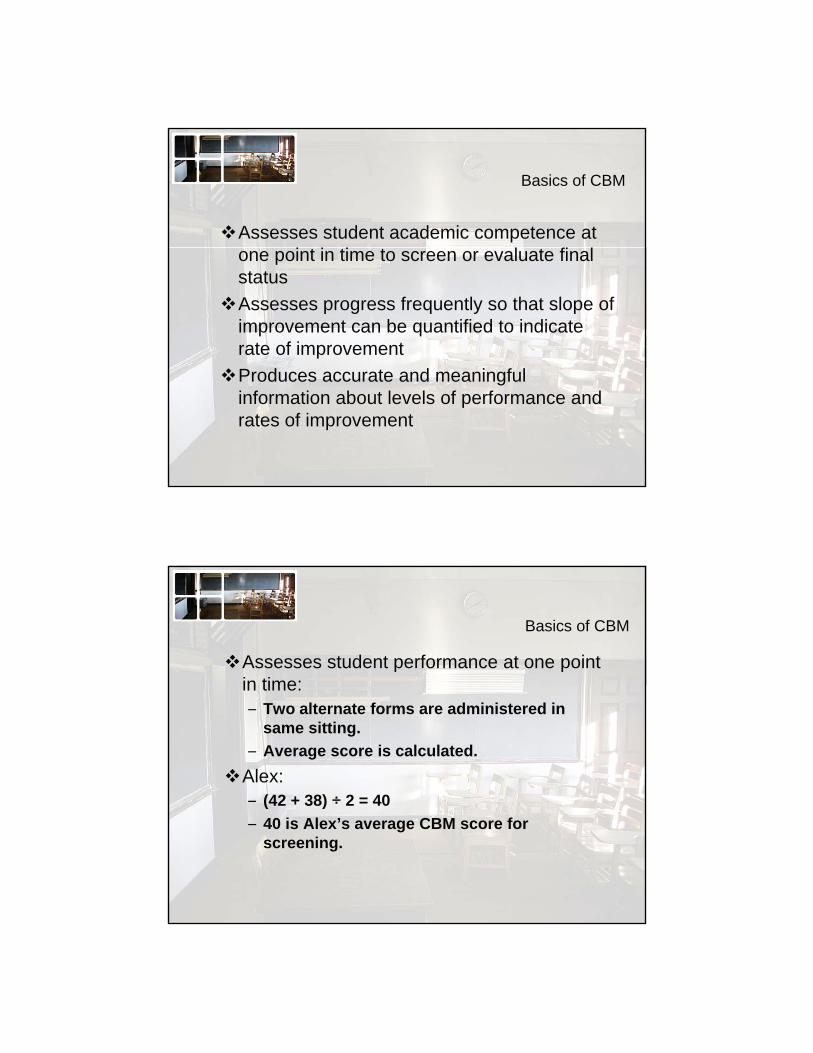
Basics of CBM
Assesses student academic competence at fone point in time to screen or evaluate final
status
Assesses progress frequently so that slope of improvement can be quantified to indicate rate of improvement
Produces accurate and meaningful information about levels of performance and rates of improvement
Basics of CBM
Assesses student performance at one point in time:in time:– Two alternate forms are administered in
same sitting.
– Average score is calculated.
Alex:– (42 + 38) ÷ 2 = 40(42 38) 2 40
– 40 is Alex’s average CBM score for screening.
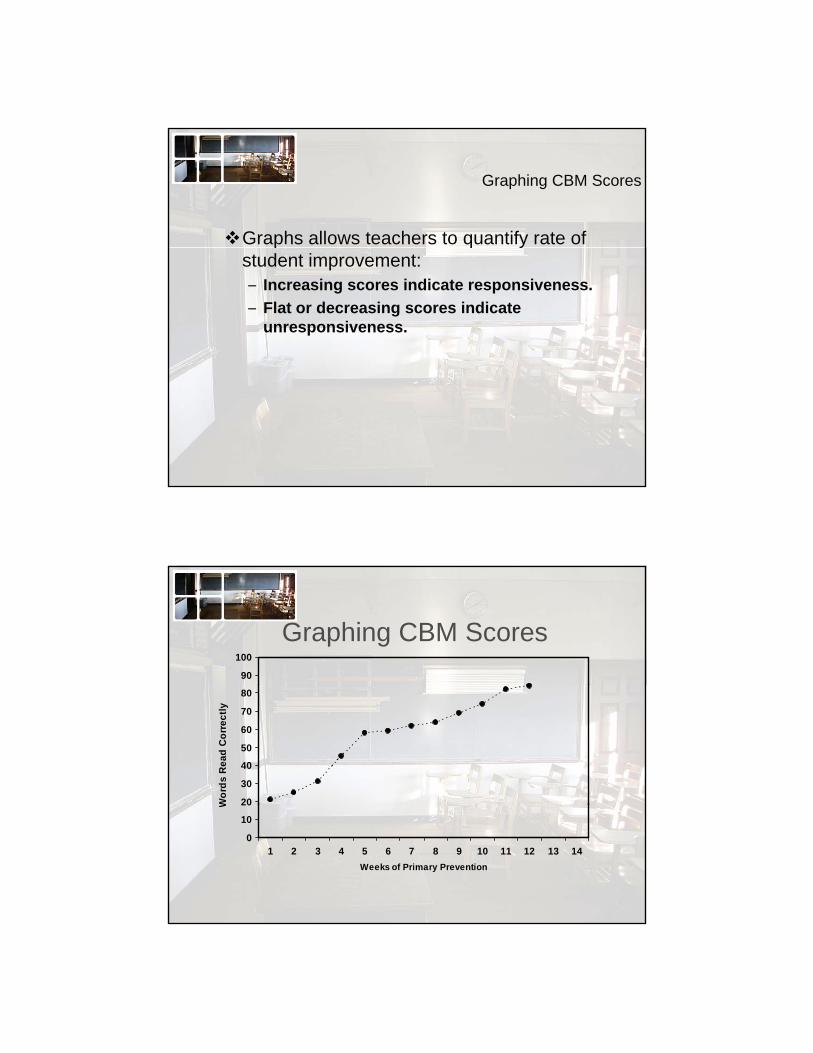
Graphing CBM Scores
Graphs allows teachers to quantify rate of p q ystudent improvement:– Increasing scores indicate responsiveness.
– Flat or decreasing scores indicate unresponsiveness.
90
100
Graphing CBM Scores
20
30
40
50
60
70
80
Wo
rds
Re
ad
Co
rre
ctl
y
0
10
20
1 2 3 4 5 6 7 8 9 10 11 12 13 14
Weeks of Primary Prevention
W
90
100
Graphing CBM Scores
20
30
40
50
60
70
80
Wo
rds
Re
ad
Co
rre
ctl
y
0
10
20
1 2 3 4 5 6 7 8 9 10 11 12 13 14
Weeks of Primary Prevention
W
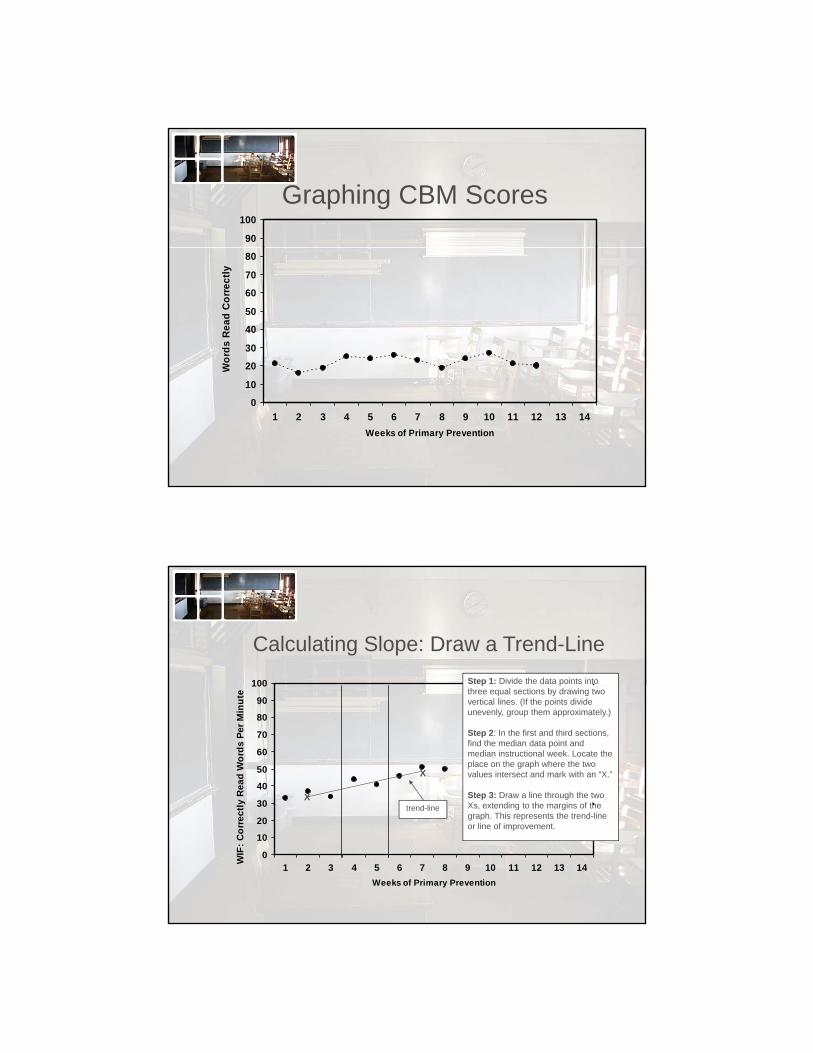
100 Step 1: Divide the data points into
Calculating Slope: Draw a Trend-Line
30
40
50
60
70
80
90
100
y R
ea
d W
ord
s P
er
Min
ute
X
X
p pthree equal sections by drawing two vertical lines. (If the points divide unevenly, group them approximately.)
Step 2: In the first and third sections, find the median data point and median instructional week. Locate the place on the graph where the two values intersect and mark with an “X.”
Step 3: Draw a line through the two Xs extending to the margins of the
0
10
20
30
1 2 3 4 5 6 7 8 9 10 11 12 13 14
Weeks of Primary Prevention
WIF
: C
orr
ec
tl trend-line Xs, extending to the margins of the graph. This represents the trend-line or line of improvement.
90
100n
ute
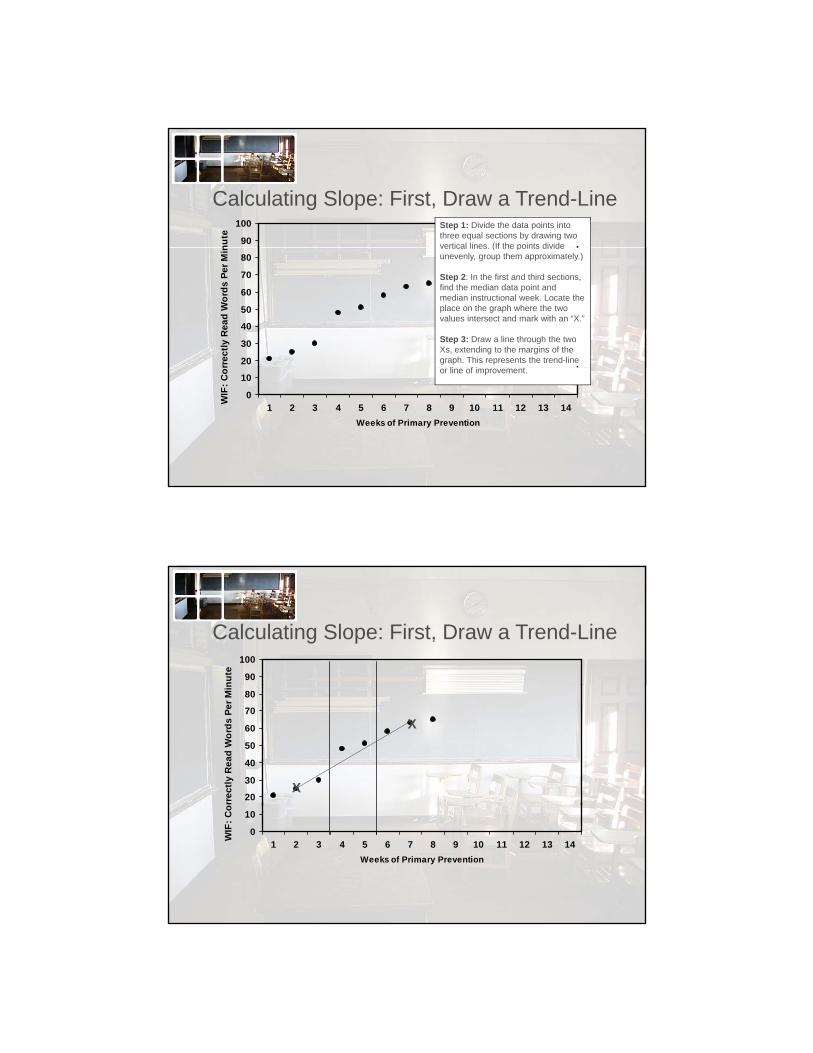
Step 1: Divide the data points into three equal sections by drawing two vertical lines (If the points divide
Calculating Slope: First, Draw a Trend-Line
20
30
40
50
60
70
80
rre
ctl
y R
ea
d W
ord
s P
er
Min vertical lines. (If the points divide
unevenly, group them approximately.)
Step 2: In the first and third sections, find the median data point and median instructional week. Locate the place on the graph where the two values intersect and mark with an “X.”
Step 3: Draw a line through the two Xs, extending to the margins of the graph. This represents the trend-line
li f i t
0
10
1 2 3 4 5 6 7 8 9 10 11 12 13 14
Weeks of Primary Prevention
WIF
: C
or
or line of improvement.
90
100
nu
te
Calculating Slope: First, Draw a Trend-Line
20
30
40
50
60
70
80
rre
ctl
y R
ea
d W
ord
s P
er
Min
X
X
0
10
1 2 3 4 5 6 7 8 9 10 11 12 13 14
Weeks of Primary Prevention
WIF
: C
o
80
90
100
Min
ute
3rd median point – 1st median point
# of data points 1
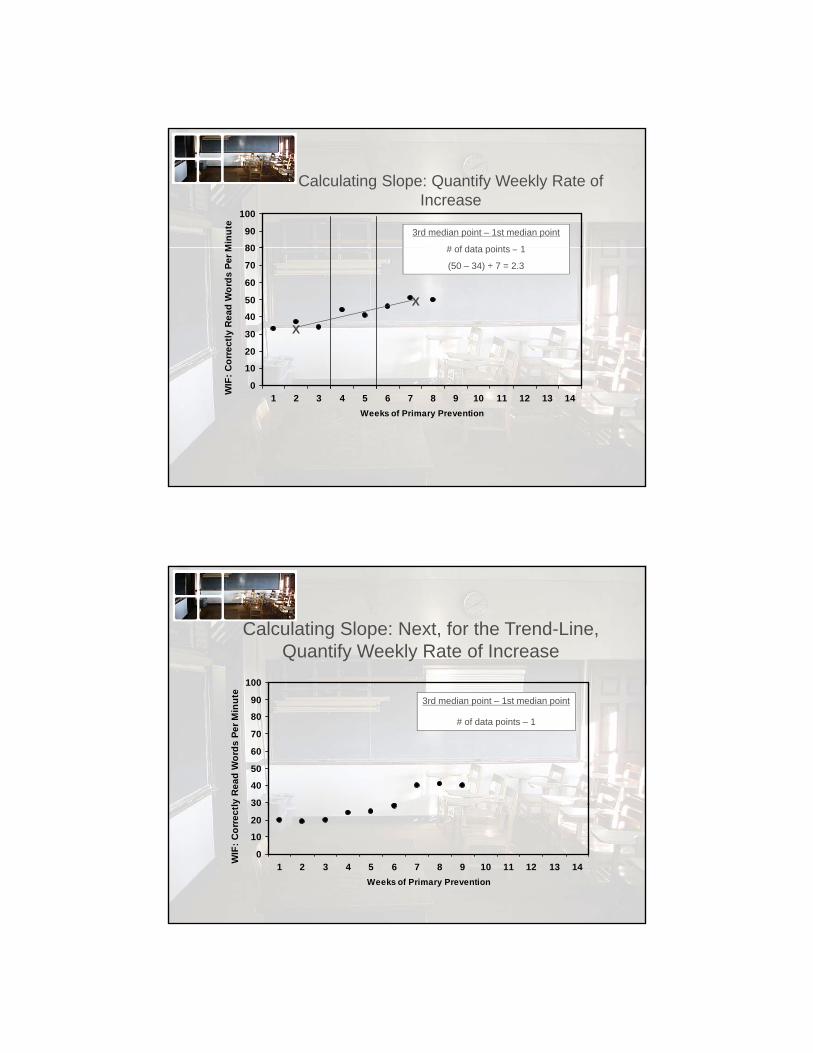
Calculating Slope: Quantify Weekly Rate of Increase
10
20
30
40
50
60
70
80
Co
rre
ctl
y R
ea
d W
ord
s P
er
M
X
X
# of data points – 1
(50 – 34) ÷ 7 = 2.3
0
10
1 2 3 4 5 6 7 8 9 10 11 12 13 14
Weeks of Primary Prevention
WIF
: C
100
Calculating Slope: Next, for the Trend-Line, Quantify Weekly Rate of Increase
30
40
50
60
70
80
90
100
ly R
ea
d W
ord
s P
er
Min
ute
3rd median point – 1st median point
# of data points – 1
0
10
20
30
1 2 3 4 5 6 7 8 9 10 11 12 13 14
Weeks of Primary Prevention
WIF
: C
orr
ec
tl
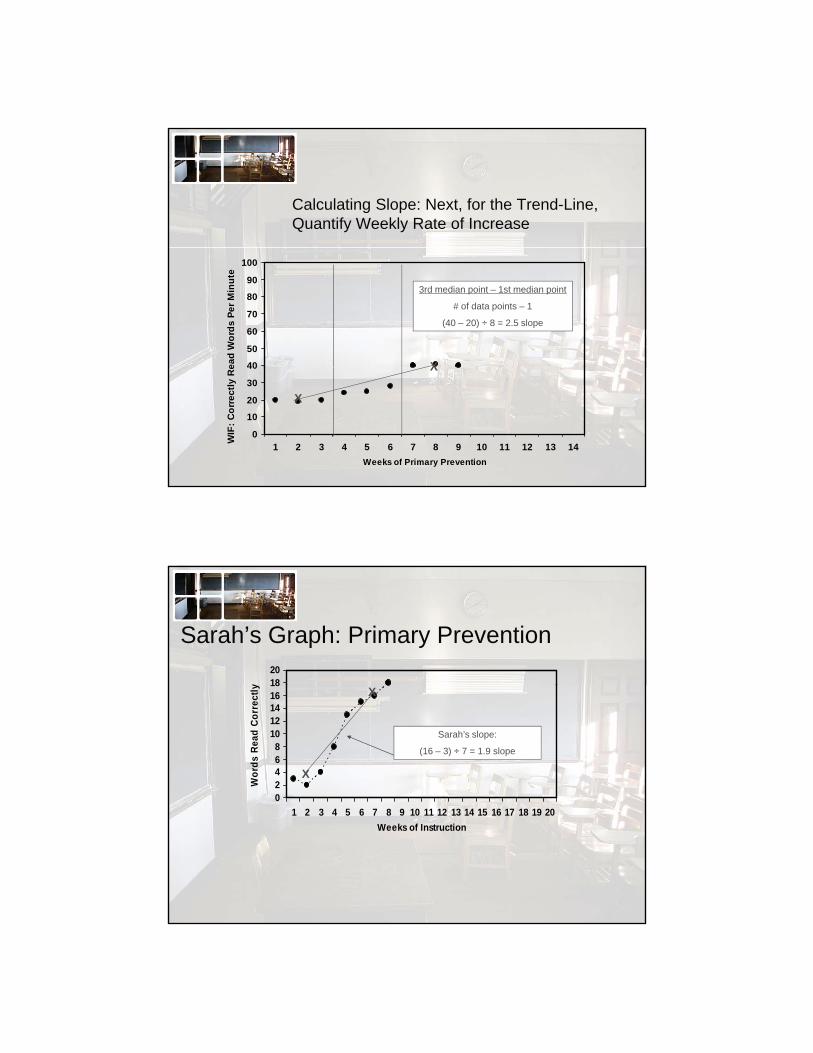
Calculating Slope: Next, for the Trend-Line, Quantify Weekly Rate of Increase
40
50
60
70
80
90
100
ea
d W
ord
s P
er
Min
ute
3rd median point – 1st median point
# of data points – 1
(40 – 20) ÷ 8 = 2.5 slope
X
0
10
20
30
40
1 2 3 4 5 6 7 8 9 10 11 12 13 14
Weeks of Primary Prevention
WIF
: C
orr
ec
tly
Re
X
X
Sarah’s Graph: Primary Prevention
1820
y
02468
1012141618
Wo
rds
Rea
d C
orr
ectl
y
X
X
Sarah’s slope:
(16 – 3) ÷ 7 = 1.9 slope
1 2 3 4 5 6 7 8 9 10 11 12 13 14 15 16 17 18 19 20
Weeks of Instruction
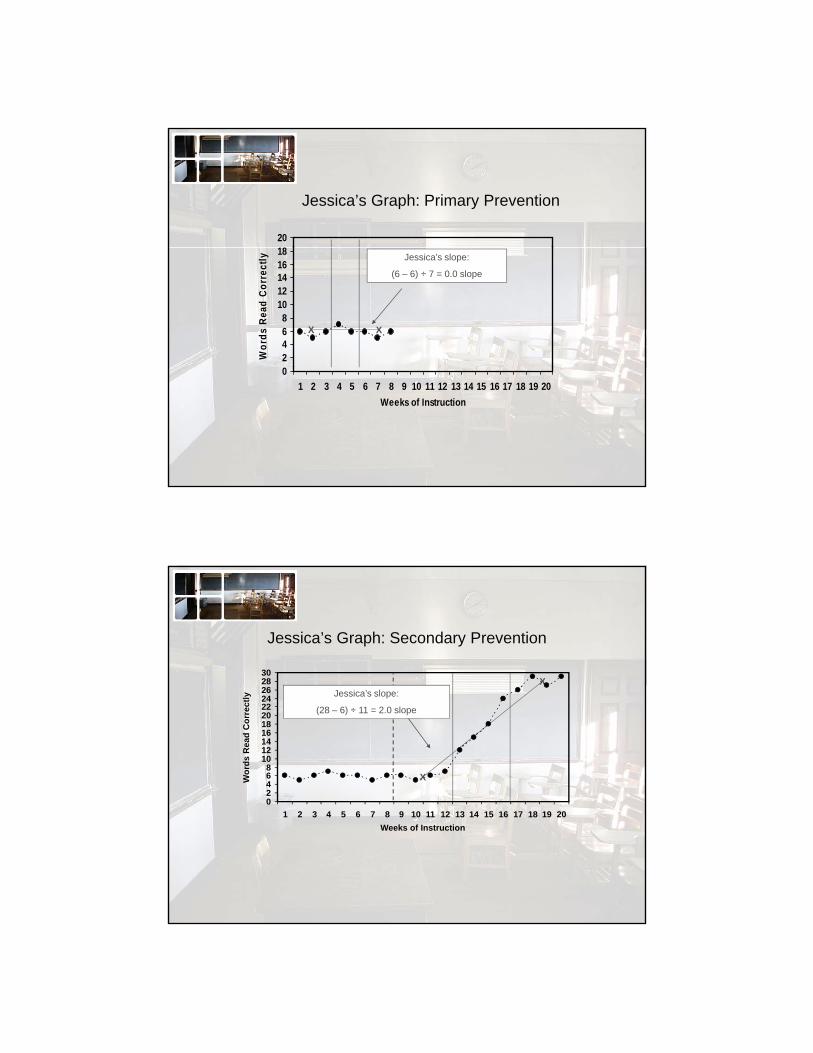
Jessica’s Graph: Primary Prevention
1820
02468
1012141618
Wo
rds
Rea
d C
orr
ectl
y
X
Jessica’s slope:
(6 – 6) ÷ 7 = 0.0 slope
X
0
1 2 3 4 5 6 7 8 9 10 11 12 13 14 15 16 17 18 19 20
Weeks of Instruction
Jessica’s Graph: Secondary Prevention
X2830
Jessica’s slope:
(28 – 6) ÷ 11 = 2.0 slope
02468
101214161820222426
Wo
rds
Rea
d C
orr
ectl
y
X
1 2 3 4 5 6 7 8 9 10 11 12 13 14 15 16 17 18 19 20
Weeks of Instruction
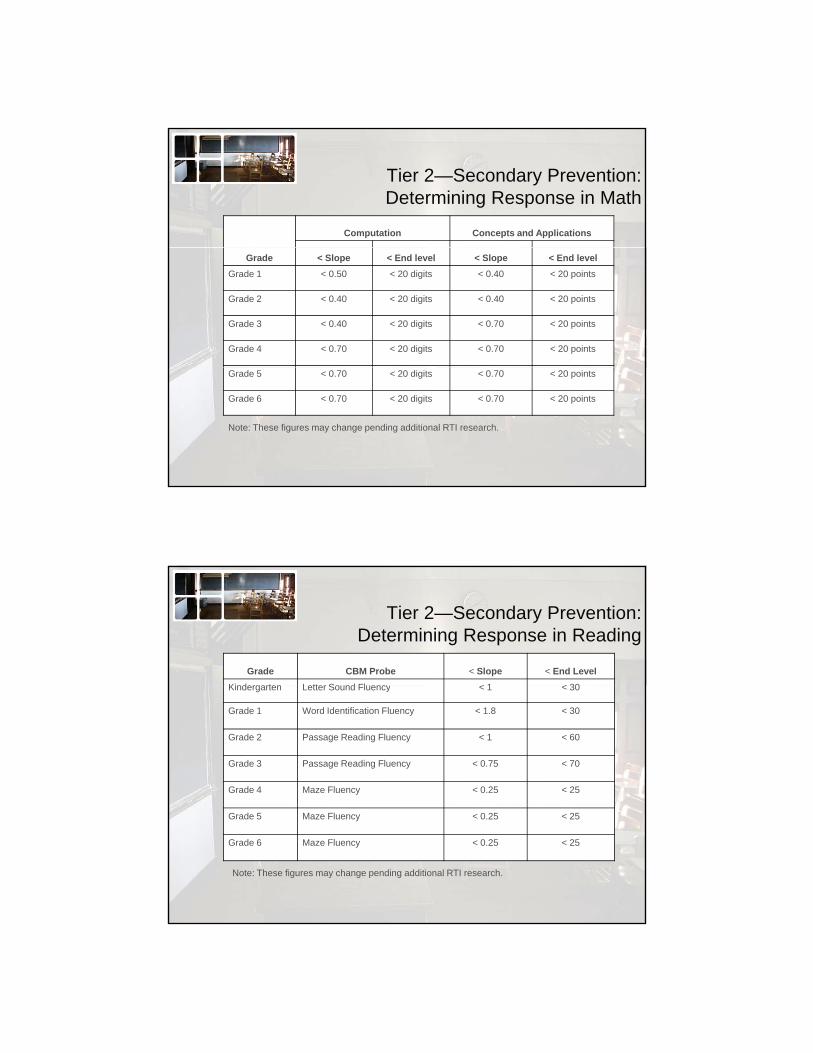
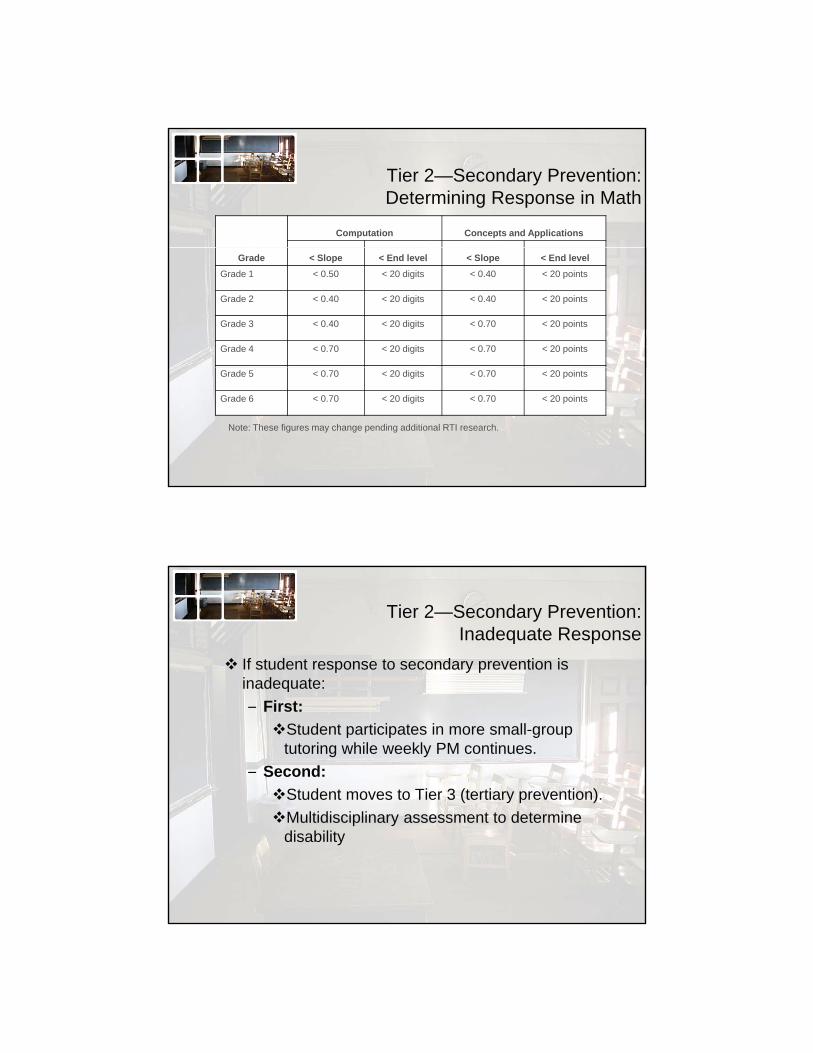
Tier 2—Secondary Prevention:Determining Response in Math
Computation Concepts and Applications
Grade < Slope < End level < Slope < End level
Grade 1 < 0.50 < 20 digits < 0.40 < 20 points
Grade 2 < 0.40 < 20 digits < 0.40 < 20 points
Grade 3 < 0.40 < 20 digits < 0.70 < 20 points
Grade 4 < 0.70 < 20 digits < 0.70 < 20 points
Grade 5 < 0.70 < 20 digits < 0.70 < 20 points
Grade 6 < 0.70 < 20 digits < 0.70 < 20 points
Note: These figures may change pending additional RTI research.
Tier 2—Secondary Prevention:Determining Response in Reading
Grade CBM Probe < Slope < End Level
Ki d t L tt S d Fl < 1 < 30Kindergarten Letter Sound Fluency < 1 < 30
Grade 1 Word Identification Fluency < 1.8 < 30
Grade 2 Passage Reading Fluency < 1 < 60
Grade 3 Passage Reading Fluency < 0.75 < 70
Grade 4 Maze Fluency < 0.25 < 25
Grade 5 Maze Fluency < 0.25 < 25
Grade 6 Maze Fluency < 0.25 < 25
Note: These figures may change pending additional RTI research.
Tier 2—Secondary Prevention:Determining Response in Math
Computation Concepts and Applications
Grade < Slope < End level < Slope < End level
Grade 1 < 0.50 < 20 digits < 0.40 < 20 points
Grade 2 < 0.40 < 20 digits < 0.40 < 20 points
Grade 3 < 0.40 < 20 digits < 0.70 < 20 points
Grade 4 < 0.70 < 20 digits < 0.70 < 20 points
Grade 5 < 0.70 < 20 digits < 0.70 < 20 points
Grade 6 < 0.70 < 20 digits < 0.70 < 20 points
Note: These figures may change pending additional RTI research.
Tier 2—Secondary Prevention:Inadequate Response
If student response to secondary prevention is inadequate:inadequate:
– First:
Student participates in more small-group tutoring while weekly PM continues.
– Second:
Student moves to Tier 3 (tertiary prevention).
Multidisciplinary assessment to determine disability
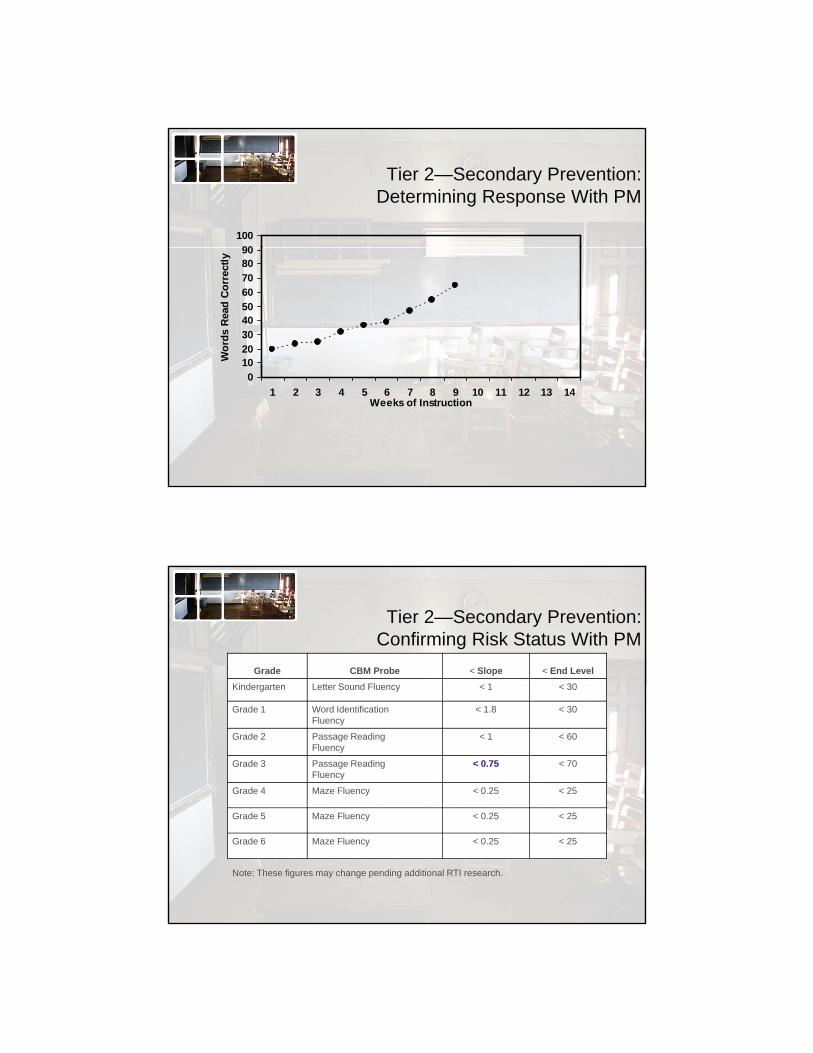
Tier 2—Secondary Prevention:Determining Response With PM
90100
102030405060708090
Wo
rds
Rea
d C
orr
ectl
y
0
1 2 3 4 5 6 7 8 9 10 11 12 13 14Weeks of Instruction
Tier 2—Secondary Prevention:Confirming Risk Status With PM
Grade CBM Probe < Slope < End Level
Kindergarten Letter Sound Fluency < 1 < 30Kindergarten Letter Sound Fluency < 1 < 30
Grade 1 Word IdentificationFluency
< 1.8 < 30
Grade 2 Passage ReadingFluency
< 1 < 60
Grade 3 Passage ReadingFluency
< 0.75 < 70
Grade 4 Maze Fluency < 0.25 < 25
Grade 5 Maze Fluency < 0.25 < 25
Grade 6 Maze Fluency < 0.25 < 25
Note: These figures may change pending additional RTI research.
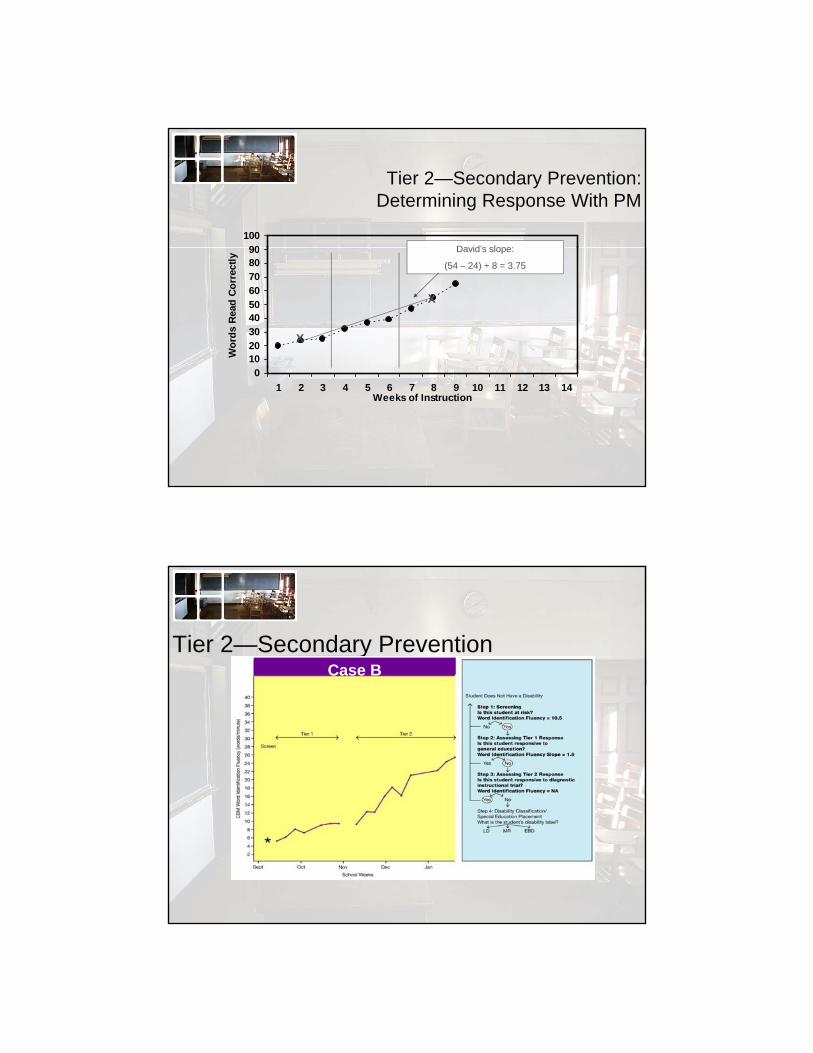
Tier 2—Secondary Prevention:Determining Response With PM
90100
David’s slope:
102030405060708090
Wo
rds
Rea
d C
orr
ectl
y
David s slope:
(54 – 24) ÷ 8 = 3.75
X
X
0
1 2 3 4 5 6 7 8 9 10 11 12 13 14Weeks of Instruction
Tier 2—Secondary PreventionCase B
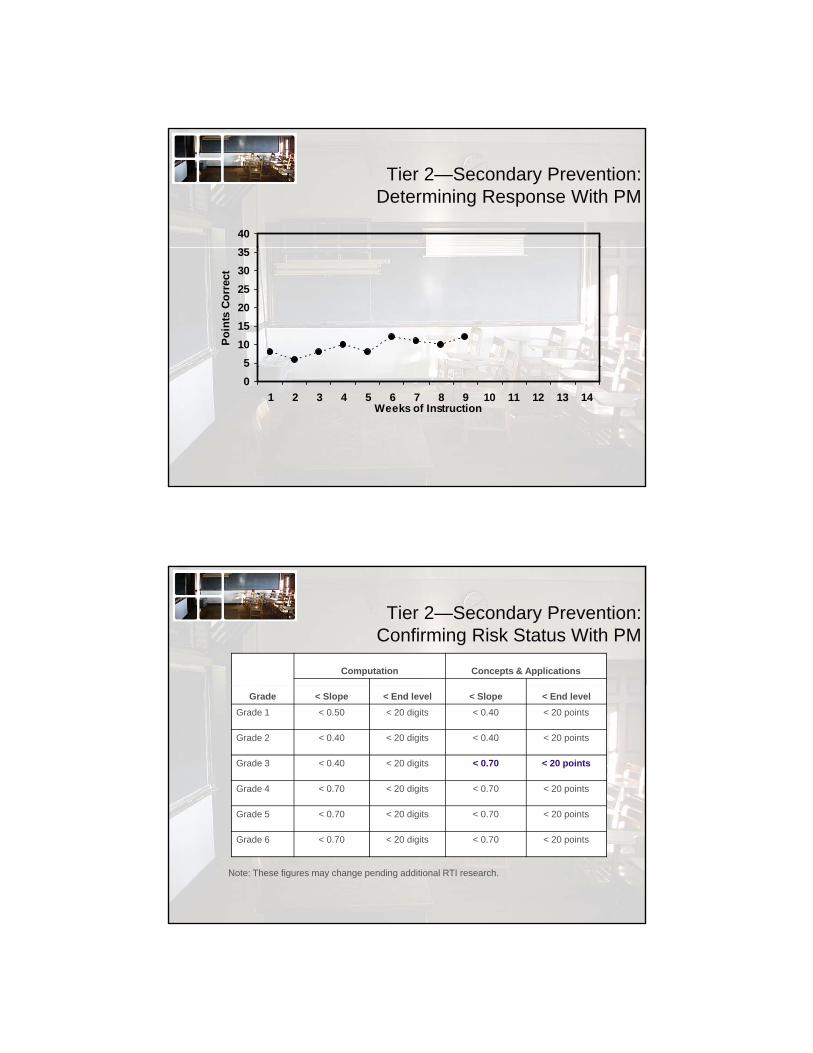
Tier 2—Secondary Prevention:Determining Response With PM
40
5
10
15
20
25
30
35
Po
ints
Co
rrec
t
0
1 2 3 4 5 6 7 8 9 10 11 12 13 14Weeks of Instruction
Tier 2—Secondary Prevention:Confirming Risk Status With PM
Computation Concepts & Applications
Grade < Slope < End level < Slope < End level
Grade 1 < 0.50 < 20 digits < 0.40 < 20 points
Grade 2 < 0.40 < 20 digits < 0.40 < 20 points
Grade 3 < 0.40 < 20 digits < 0.70 < 20 points
Grade 4 < 0.70 < 20 digits < 0.70 < 20 points
Grade 5 < 0.70 < 20 digits < 0.70 < 20 points
Grade 6 < 0.70 < 20 digits < 0.70 < 20 points
Note: These figures may change pending additional RTI research.
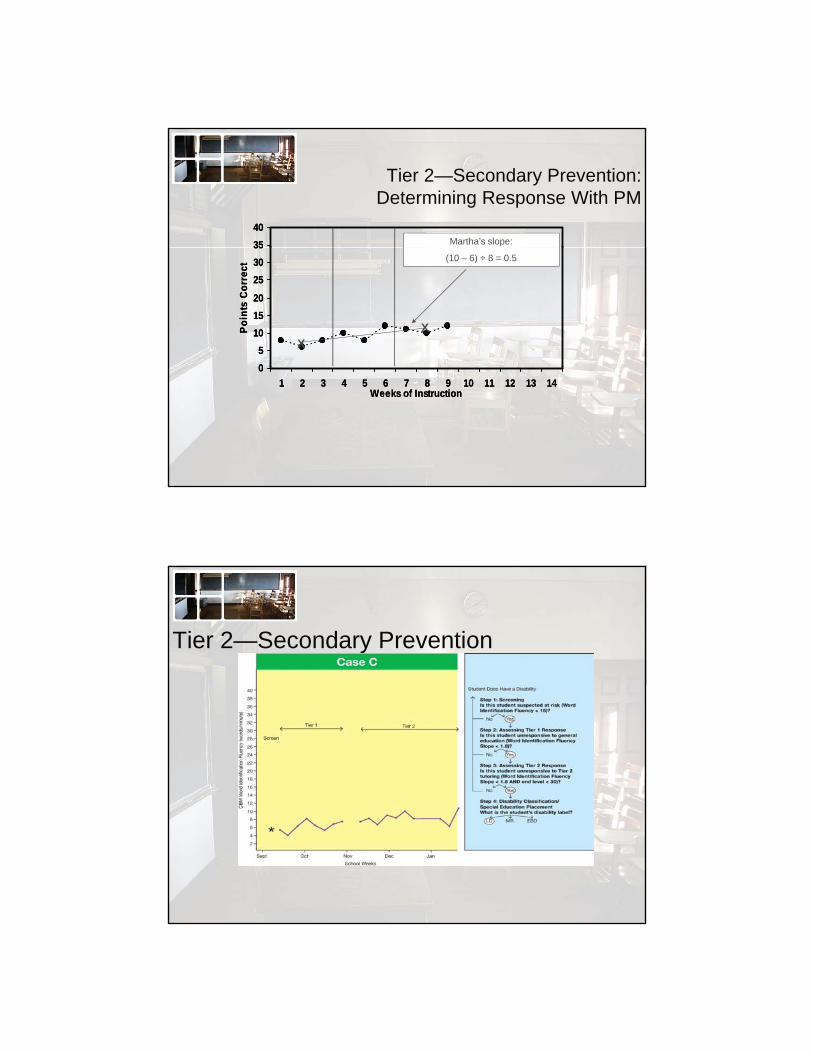
Tier 2—Secondary Prevention:Determining Response With PM
35
40
35
40Martha’s slope:
0
5
10
15
20
25
30
35P
oin
ts C
orr
ect
0
5
10
15
20
25
30
35P
oin
ts C
orr
ect
XX
(10 – 6) ÷ 8 = 0.5
0
1 2 3 4 5 6 7 8 9 10 11 12 13 14Weeks of Instruction
0
1 2 3 4 5 6 7 8 9 10 11 12 13 14Weeks of Instruction
Tier 2—Secondary Prevention
Tier 2—Secondary Prevention: Review
Suspected at-risk students with inadequate CBM performance in Tier 1 are tutored inCBM performance in Tier 1 are tutored in small groups.– Tutoring uses research-based interventions
taught by school tutors.
Student progress is monitored weekly:– Students with adequate slopes return toStudents with adequate slopes return to
primary prevention, with continued PM.
– Students with inadequate slopes move to tertiary prevention (Tier 3).
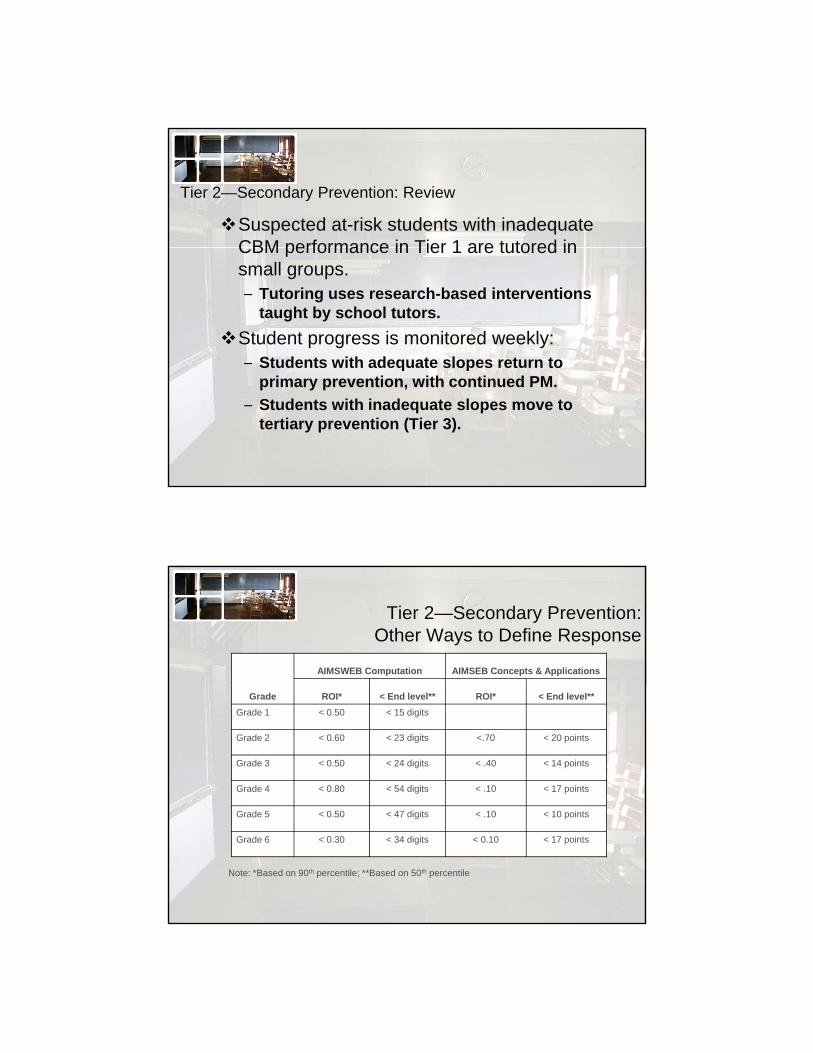
Tier 2—Secondary Prevention:Other Ways to Define Response
AIMSWEB Computation AIMSEB Concepts & Applications
Grade ROI* < End level** ROI* < End level**
Grade 1 < 0.50 < 15 digits
Grade 2 < 0.60 < 23 digits <.70 < 20 points
Grade 3 < 0.50 < 24 digits < .40 < 14 points
Grade 4 < 0.80 < 54 digits < .10 < 17 points
Grade 5 < 0.50 < 47 digits < .10 < 10 points
Grade 6 < 0.30 < 34 digits < 0.10 < 17 points
Note: *Based on 90th percentile; **Based on 50th percentile
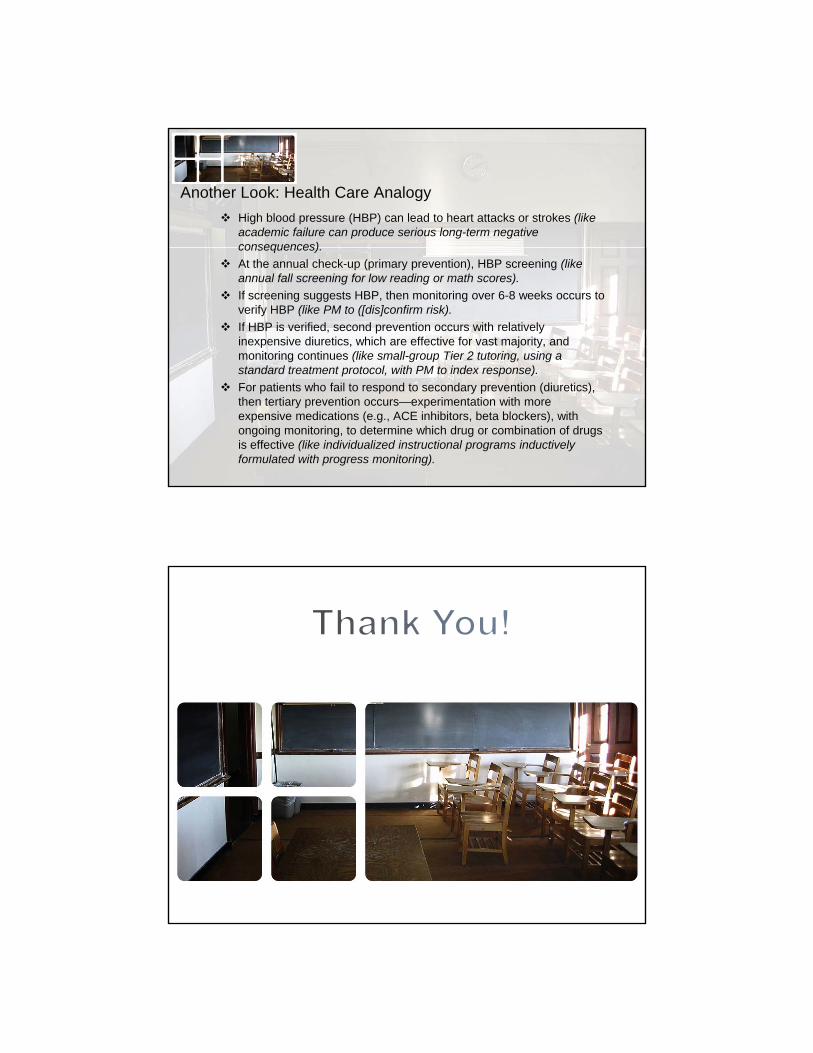
Another Look: Health Care Analogy
High blood pressure (HBP) can lead to heart attacks or strokes (like academic failure can produce serious long-term negative consequences)consequences).
At the annual check-up (primary prevention), HBP screening (like annual fall screening for low reading or math scores).
If screening suggests HBP, then monitoring over 6-8 weeks occurs to verify HBP (like PM to ([dis]confirm risk).
If HBP is verified, second prevention occurs with relatively inexpensive diuretics, which are effective for vast majority, and monitoring continues (like small-group Tier 2 tutoring, using a t d d t t t t l ith PM t i d )standard treatment protocol, with PM to index response).
For patients who fail to respond to secondary prevention (diuretics), then tertiary prevention occurs—experimentation with more expensive medications (e.g., ACE inhibitors, beta blockers), with ongoing monitoring, to determine which drug or combination of drugs is effective (like individualized instructional programs inductively formulated with progress monitoring).