ticker symbol: aeommoore.ba.ttu.edu/valuationreports/spring2007/american...key statistics industry...
TRANSCRIPT

- 1 -
Ticker Symbol: AEO
Jennifer Pfieffer ([email protected])
Lisa Hase ([email protected]) Michael Gerrish ([email protected])
Carl Ebbern ([email protected])
Kevin Cooper ([email protected])

- 2 -
Table of Contents
Executive Summary 3
Company Overview 7
Five Forces Model 9
Formal Accounting Analysis 27
Financial Ratio Analysis 49
Forecasting 79
Regression Analysis 89
Valuation 91
Appendix 1 106
Appendix 2 121
Works Cited 126

- 3 -
Executive Summary
www.finance.yahoo.com
Investment Recommendation: Overvalued, Sell
Key Statistics Industry Members PPS (as of 4/1/07)Index NYSE Abercrombie and FitchPPS AEO (as of 4/1/07) $29.99 Aeropostale52-week range $20.07 - $34.80 GapRevenue (2006) $2.8 B LimitedMarket Capitalization $6.6 BShares Outstanding $221 M Comparables ValuationsEnterprise Value $7 B P/E (trailing) $33.74 UndervaluedDividend Payout Ratio 15.9% P/E (forecast) $32.25 Undervalued3 month Avg. Daily Trading Volume 3.2 mil. P/B $24.12 OvervaluedPrice/Earnings 17.13 Dividends/Price $18.09 OvervaluedPrice/Earnings forecast 15.30 P.E.G. $27.24 OvervaluedBook value per share $8.98 P/EBITDA $31.85 UndervaluedReturn on Equity 33.5% P/(FCF per share) $16.27 OvervaluedReturn on Assets 24.10% Enterprise Value/EBITDA $34.92 Undervalued
Cost of Capital Est. Beta R2 Ke Intrinsic Valuation72 months -0.80 3.0% 1.9% Discounted Dividends $6.64 Overvalued60 months -0.36 -0.7% 3.6% Free Cash Flows $90.97 Undervalued48 months -1.49 8.3% -0.8% Free Cash Flows (Cap. Leases) $283.02 Undervalued36 months -0.75 -0.4% 2.1% Residual Income $11.90 Overvalued24 months -0.52 -3.3% 3.0% Abnormal Earnings Growth $19.78 OvervaluedPublished Beta 1.2
Ke 13% Altman Z-Score 3.75 Low RiskWACC 11% Altman Z-Score(Capitalized) 2.66 Moderate Risk
$40.23$17.21$26.06
4/1/2007
$75.68

- 4 -
Analysts’ Recommendation – Overvalued, Sell
Company and Industry Overview and Analysis
American Eagle Inc. was established in 1977 to offer affordable, quality
clothing to the younger generation. American Eagle is in a sub-industry of the
apparel industry, which consists of other competitors Gap Inc., Limited Brands,
Abercrombie and Fitch Co., and Aeropostale. These companies sell denim, shirts,
footwear, swimwear, accessories, and outerwear. Rivalry amongst existing firms
is intensified by focusing on a smaller market, and competition is propelled by
the industry’s constant need to have the latest fashions when demanded.
American Eagle and its direct competitors expand their economies of scope into
sub-brands and a wider variety of merchandise in order to capture more market
share. The current competition deters new entrants because it is hard for new
entrants to secure channels of distribution in order to deliver to customers.
Department stores pose a threat of substitution for cheaper clothes and a wider
variety. Although department stores are more convenient, consumers of
American Eagle are loyal to it and its competitors because these consumers are
driven by brand names and logos. This helps eliminate the threat of substitutes
of cheaper clothes. Consumers have low switching costs between the direct
competitors because consumers alternate between the stores seamlessly.
American Eagle sets itself apart in the specialty retail sub-industry by offering its
products at a lower price and emphasizing a healthy brand image.
Accounting Analysis
American Eagle altered its accounting policies in 2003 in order to improve
efficiency. The company did this by changing inventory policies and how they
manage discounted merchandise. GAAP allows companies in the specialty retail
sub-industry a wide range of flexibility when determining goodwill amortization,

- 5 -
asset depreciation, classifying leases, and accounting for inventory. This
flexibility enables the management to convey the workings of the company to
shareholders with additional explanations to provide understanding for investors.
When analyzing American Eagle, we considered many sales and expense
manipulation diagnostics to investigate management’s treatment of revenues and
expenses. The only “red flag” raised was the operating leases which expenses
only the current portion of the lease obligation instead of capitalizing the future
lease holds on the balance sheet. This underestimates assets and liabilities and
modifies a potential investor’s view of the company. When the leases are
capitalized we gain a better knowledge of American Eagle’s true financial
situation.
Financial Ratio Analysis and Forecasting
A firm’s financial ratios are broken down into three categories: liquidity
ratios, profitability ratios, and capital structure ratios. American Eagle presents
average liquidity ratios in comparison to the industry. The current ratio is
currently 2.6, which means $2.60 of current assets are available for every $1 of
current liabilities. Therefore, American Eagle has plenty of liquidity that would
appeal to lenders. According to our analysis, American Eagle has high profitability
ratios and it leads the industry in gross profit margin and operating profit margin.
This is because American Eagle is able to purchase its merchandise at a cheap
rate from a variety of vendors. They are then able to turn the product around
and sell in a high end market to gain a high gross profit. The capital structure
ratios show that American Eagle is financed mostly by equity, which frees them
from payments to bond holders who could hold leverage over the company.
In order to forecast American Eagle’s financial statements out for the next
ten years, we created a common-size statement of the balance sheet and income
statement. This helped us determine structural trends for the company to better
forecast future growth. Since American Eagle changed accounting policies in

- 6 -
2003, the past five years has seen a dramatic alteration across the financials.
Therefore, we used the past three years in order to determine trends to grow
net sales and total assets. In the forecasted balance sheet, we compensated for
the operating leases and capitalized the leases on a second balance sheet.
American Eagle already grows in sales at about 14%, which is consistent with
the industry.
Intrinsic Valuation
When calculating the intrinsic valuations, we first calculated the cost of
debt and cost of equity to determine the weighted average cost of capital. We
adjusted cost of debt when we capitalized leases. We then valued the company
through the discounted dividends model, free cash flows model, residual income
model, and abnormal earnings growth model. The discounted dividends, residual
income, and abnormal earnings growth models all stated American Eagle is
overvalued in the market. We based our recommendation on the residual income
and abnormal earnings growth models because they presented the most
accurate valuations. The two averaged a $15.84 value for American Eagle Stock
compared to the observed April 1, 2007 price of $29.99. We finally considered
Altman’s z-score to examine American Eagle’s credit risk. The z-score revealed
American Eagle to have minimal chance of going bankrupt with a 3.75 score
considering operating leases. After converting the leases to capital leases, the z-
score fell to 2.66, making the company an indeterminable risk. Ultimately, we
believe American Eagle to be at moderate to low risk of going bankrupt. Our
overall conclusion is the firm is overvalued by approximately $14.

- 7 -
Company Overview American Eagle Outfitters, Inc., also known as American Eagle or AE, was
established in 1977. The corporate headquarters are currently located in
Warrendale, Pennsylvania, but will soon be moving to Pittsburgh, PA. It is a
specialty apparel retailer of fashionable clothing targeting people between the
ages 15 and 25. American Eagle sells jeans, t-shirts, accessories, footwear,
swimwear, and outerwear. It has expanded its operations from the United
States, into Canada, and Puerto Rico. Currently there are a total of 911 stores,
839 in the U.S., and 72 in Canada. (www.ae.com)
American Eagle considers itself to be a part of the competitive, “brand
name”, specialty apparel industry. Its successes derive from its ability to adapt
and offer the newest trends at a reasonable price. Other firms in this unique
industry include the following: Abercrombie and Fitch Co., Gap Inc., Aeropostale
Inc., and Limited Brands Inc. The following graph illustrates the market
capitalization for each firm not only as a number but also as a percentage of this
sub-industry. It is calculated by multiplying the price per share times the number
of shares outstanding.
www.abercrombie.com, www.ae.com, www.aeropostale.com, www.gap.com, www.limitedbrands.com
Industry Market Cap (in billions of dollars)
$6.64
$6.68
$2.39
$18.81
$10.37American EagleAbercrombie and FitchAeropostaleGapLimited

- 8 -
All members of this industry design, market, and sell their own lines of
specialty apparel. American Eagle intends to increase its market share by
continuing to promote brand loyalty through the customer loyalty programs. In
addition, the company will provide the newest fashion the customers want, at
the prices they can afford. They have also recently expanded its customer base
by introducing the MARTIN + OSA, and aerie sub-brands. MARTIN + OSA
consists of sportswear targeting 25 to 40 year olds, and aerie is a new collection
of dorm wear and intimates for young women (AEO 10-K).
Revenues for the 2006 fiscal year increased over 20 percent to the
amount of $2,794,3409,000. The majority of the firms in this industry
experienced similar increases in revenue. In addition to increasing revenue, total
asset value has also increased. The chart below describes the percent change in
total asset value for American Eagle over last five years. There has been a
definite increase in asset value for each of the years with the largest increase
from 2004 to 2005. Analyzing a firm’s total asset value is another way to
measure the size of a company.
AEOS Asset Values
Year Asset Value (in
thousands) % Change from Previous
Year 2006 $1,987,484 19.21% 2005 $1,605,649 17.23% 2004 $1,328,926 29.84% 2003 $932,414 20.49% 2002 $741,339 N/A
www.abercrombie.com, www.ae.com, www.aeropostale.com, www.gap.com, www.limitedbrands.com
The following graph, found on the yahoo website, illustrates American
Eagle’s stock price performance for the past five years. It experienced a 5-year
low of $3.35 on October 9, 2002, and the 5-year high of %34.34 occurred on
January 16, 2007. After adjusting for splits and dividends, the data shows that
the stock price has tripled in the past five years. This graph also shows all of
American Eagle’s industry competitors and their stock price performances over

- 9 -
the past five years. The firms in this industry seem to be following the same
general stock price trends (www.finance.yahoo.com).
Splits:06-Jan-98 [3:2], 11-May-98 [3:2], 04-May-99 [2:1], 26-Feb-01 [3:2], 08-Mar-05 [2:1], 19-Dec-06 [3:2]
Five Forces Model The five forces model details the extent of competition within an industry
by analyzing factors such as rivalry among existing firms, threat of new entrants,
threat of substitutes, buying power of buyers, and bargaining power of suppliers.
When the competition level is properly assessed, a company can better
determine its core competencies so it can best succeed in the industry.
Rivalry Among Existing
Firms
Threat of New
Entrants
Threat of Substitutes
Buying Power of Buyers
Bargaining Power of Suppliers
High Low Medium High Low

- 10 -
The apparel industry consists of a wide variety of clothing, footwear, and
accessories stores. Within this large industry is a smaller sub-industry of
specialty retail. The specialty retail industry is made up of companies such as
Abercrombie and Fitch Co., American Eagle Outfitters Inc., Gap Inc., Aeropostale
Inc., and Limited Brands Inc. These stores are competitive in higher end retail
and market to a narrower customer base. This customer base focuses on
consumers from ages 15-25 (www.ae.com). The key is to balance a different,
yet trendy product and proved a price that suggests value to the customer while
being affordable.
Rivalry Among Existing Firms
Rivalry among existing firms breaks down the competition level between the
leading competitors in an industry. The competition is best depicted by
analyzing the growth of the industry, concentration and balance of competitors,
degree of differentiation and switching costs, ratio to fixed and variable costs,
and exit barriers and excess capacity. The different degrees of competition
determined by these factors affect how companies relate to one another in order
to prove successful.
INDUSTRY GROWTH
Industry growth determines if companies must fight for their share of the
market. If the industry is growing, there are plenty of consumers for each
company to be profitable. In the specialty retail sector, the industry has been
growing steadily which should lower competition. The sub-industry, specialty
retail is encompassed by the apparel industry; competitors include American
Eagle Outfitters Inc. Gap Inc., Aeropostale Inc., Abercrombie and Fitch Co.,
Limited Brands Inc. These companies make up a cluster of specialty retail stores
that market quality clothing to a younger generation. The industry has shown a

- 11 -
steady increase in stock value over the past five years. The cyclical nature of
this industry is created by quarterly fashion trends; this creates a constant
demand for the latest product.
These companies offer a differentiated product but they also compete
heavily with each other. The industry strives by marketing higher end clothing to
15-25 year olds. Although the industry is growing, limiting marketing to such a
small portion of the population intensifies competition. The companies
differentiate themselves with highly recognized brand names. The brand name
and quality of clothes separate each company from the other, giving them a
unique advantage over other general clothing shops such as department stores.
In this portion of the industry, brand is everything and the customers pay a
premium for it. The demand for these styles of clothing is limited to certain age
groups, causing more stores to fight for the same market share and therefore
increasing competition. Nevertheless, firms in this industry seem to be
experiencing growth.
Total Assets
0
2,000,000
4,000,000
6,000,000
8,000,000
10,000,000
12,000,000
2002 2003 2004 2005 2006
Year
Tota
l Ass
ets
(in
thou
sand
s of
dol
lars
)
American Eagle
Abercrombie and Fitch
Aeropostale
Gap
Limited
Industry Average
www.abercrombie.com, www.ae.com, www.aeropostale.com, www.gap.com, www.limitedbrands.com

- 12 -
As illustrated in the previous graph, the firms in this industry are steadily
increasing their assets with the exception of Gap Inc. and the Limited Brands.
By measuring changes in total assets, we can analyze the amount of growth
within a firm or an industry. The growth trends of this industry are further
evident in the following pie chart. The chart illustrates industry market share.
Industry Market Share (based on net sales)
32%31%
7%
31%
9%30%
10%
4%
31%
6%
5%
55%
2%
6%5%
55%
3%
6%
53%
3%
7%
50%
4%
8%
47%
American Eagle
Abercrombie and Fitch
Aeropostale
Gap
Limited2002
2006
2005
2004
2003
www.abercrombie.com, www.ae.com, www.aeropostale.com, www.gap.com, www.limitedbrands.com
Market share is the portion of the market a particular firm controls as a
percentage of the entire industry. This chart uses net sales as the determinate
for market share of a firm. Net sales must increase at an equal or greater rate
than the competition in order to maintain market share. According to the chart
ANF, AEO, and ARO appear to be gaining market share, while GPS and LTD seem
- 13 -
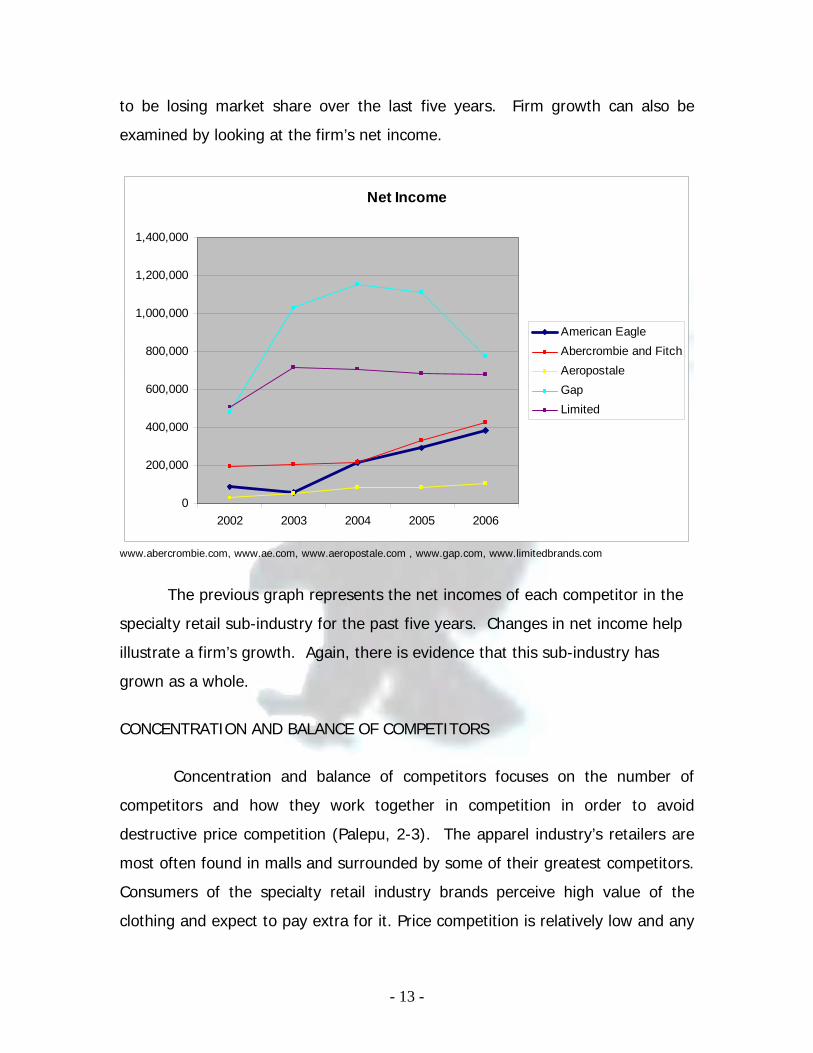
to be losing market share over the last five years. Firm growth can also be
examined by looking at the firm’s net income.
Net Income
0
200,000
400,000
600,000
800,000
1,000,000
1,200,000
1,400,000
2002 2003 2004 2005 2006
American EagleAbercrombie and FitchAeropostaleGapLimited
www.abercrombie.com, www.ae.com, www.aeropostale.com , www.gap.com, www.limitedbrands.com
The previous graph represents the net incomes of each competitor in the
specialty retail sub-industry for the past five years. Changes in net income help
illustrate a firm’s growth. Again, there is evidence that this sub-industry has
grown as a whole.
CONCENTRATION AND BALANCE OF COMPETITORS
Concentration and balance of competitors focuses on the number of
competitors and how they work together in competition in order to avoid
destructive price competition (Palepu, 2-3). The apparel industry’s retailers are
most often found in malls and surrounded by some of their greatest competitors.
Consumers of the specialty retail industry brands perceive high value of the
clothing and expect to pay extra for it. Price competition is relatively low and any

- 14 -
discounts to the customer are considered bonuses. But, with so many direct
competitors centrally located, the companies must fight to lure customers into
their stores as opposed to the others. Additionally, companies are continuing to
search for new mall to add locations, create sub-brands within their own stores,
and remodel and update current stores to increase the concentration and
consequently the competition. Therefore, this intense concentration of
competitors stimulates a high degree of competition.
DEGREE OF DIFFERENTIATION AND SWITCHING COST
The degree of differentiation refers to the ability of a company to distinguish
its products from other stores’ merchandise. By increasing differentiation,
competition is decreased because people are willing to pay more for a unique
product. Switching costs determine the customers’ likelihood to change their
product preference. American Eagle’s portion of the apparel industry is
completely different than other clothing stores in the industry such as Kohl’s or
Dillard’s. The clothes in the specialty retail industry are styled to have a more
casual, laidback look that appeals to 15-25 year olds. This different, specialized
style is what separates the companies from other clothing stores in the apparel
industry.
Consumers of these products tend to switch quite frequently between the
different direct competitors. The companies offer very similar clothing styles to
the same targeted market. Therefore, the low switching cost 15-25 year old
buyers stimulates higher competition between the companies. Within this unique
sector of the apparel industry, some firms offer more affordable clothing. It is
within the specialized section that American Eagle, for example, uses price
competition as a business strategy (www.ae.com).
In addition to using price to attract consumers to American Eagle, the
company launched the AE All-Access Pass in Fiscal 2005 to encourage brand
loyalty. This pass rewards frequent customers by granting “credits” after buying

- 15 -
a certain amount of merchandise. The credits can be accumulated to purchase
free merchandise from the American Eagle website (www.ae.com). Similarly,
American Eagle, Gap, and Abercrombie and Fitch all have brand credit cards for
purchases made in their stores and on their respective websites. Although
gimmicks such as credit cards are used to sway the customer from switching
between brands, it is not entirely effective. Since switching costs are low and
the degree of differentiation between these specialty retail shops is low,
competition for the targeted market remains high.
RATIO OF FIXED TO VARIABLE COSTS
If the ratio of fixed to variable costs is high, there is higher competition
because fewer variable costs can be minimized to enhance profits. Firms can
decrease prices to attract more consumers. The ratio of fixed to variable costs is
low in the apparel industry. Fixed costs for American Eagle primarily consist of
building leases for stores, offices, and two distribution centers. Abercrombie and
Fitch, Aeropostale, and Limited Brands all lease their properties as well
(www.abercrombie.com, www.aeropostale.com, www.gap.com,
www.limitedbrands.com). This is common in stores primarily located in malls or
shopping centers. Variable costs consist of purchasing inventory and paying
wages along with other selling and administrative expenses, which make up a
large percentage of total costs. The costs are based on the quantity of inventory
each store chooses to buy and its ability to sell it. This decreases competition
because it allows the store to adjust to the economy or buying trends and can
avoid burdening itself with excessive inventories.
EXIT BARRIERS AND EXCESS CAPACITY
Exit barriers occur when a specific product would be hard to liquidate or
sell if the firm left the industry. In the apparel industry, inventory is easy to sell
with a single sale or clearance. A firm in the apparel industry must turnover

- 16 -
most of its merchandise four times a year as the seasons change. Therefore,
there are four times a year a firm in this industry could easily exit the apparel
industry if it chooses not to replenish its inventory. The barriers to exit this
industry are relatively low because of the frequent total inventory turnover.
Companies in this industry will only buy enough merchandise it can sell in a
single season to prevent discounts and receive optimal profits.
Excess capacity is when supply surpasses consumer demand and there is
unsold merchandise. Retail stores can easily prevent this by holding sales to
move of the leftover seasonal inventory. Firms place clothes on sale at the end of
each quarter before new shipments of clothes arrive. Low exit barriers and low
excessive capacity leads to low competition because a firm can exit the industry
whenever necessary without suffering heavy consequences.
In conclusion, the degree of competition among existing firms is very high
within the select specialty retail industry. Competitors market a similar clothing
style to a very limited amount of people. This makes supply surpass demand and
companies must work to stress the importance of brand loyalty to the customer.
Threat of New Entrants
If a company in the industry is earning abnormal profits, competitors are
likely to enter because the potential profit is high and attainable. This threat can
force firms already in the industry to keep prices low to discourage new entrants.
In this industry, a competing firm must be differentiated from the industry, but in
its sub-industry firms need to be a price leader. If the competing companies fail
to become price leaders, there will be new entrants who will drive down profit
margins and gain market share.
ECONOMIES OF SCALE
Economies of scale differ in every industry. An industry with large
economies of scale is unlikely to see a substantial amount of new entrants.

- 17 -
Economies of scale include brand advertising, research and development, and
investment in physical assets. In this industry, there are large economies of
scale in brand advertising. Although it is very easy to compete on price in the
apparel industry, consumers are willing to pay for the label. The businesses
already competing with each other are very well known among the target
consumer. In order to enter this business a new company would have to put
enormous capital into advertising to increase brand awareness and become the
“cool” brand. A competitor could enter the industry by undercutting the
competition in price, but face an obstacle if they wanted to compete with stores
such as Gap and Abercrombie and Fitch. This industry is easy to enter because
the cost of capital can be quite cheap relative to the price of goods sold, but
hitting the target market can be quite difficult because of brand recognition.
Because of the necessity brand recognition, the threat of new entrants is greatly
reduced.
LEARNING ECONOMIES
Learning economies refer to industries that require an extra amount of skill
or knowledge that makes it difficult for new companies to enter the field. Firms
in the apparel industry focus on knowing the up and coming trends to produce
clothing, footwear, and accessories in a timely fashion to meet customer
expectations. If the company was unaware of popular fashions for youth, they
would be left behind the style curve. The industry is able to advertise to the
target market “what is in style” in several ways such as, ads seen industry-wide
feature popular stars, and attractive people modeling the clothes found in the
stores. The stores in this industry also have a visual appeal that is lacking from
other retail chains. Young, good-looking employees are hired to work the retail
side of the business. These employees are able to tell customers what looks
best on them while focusing on what will make their store the most money. The
learning economies in this industry reduce the threat of new entrants.

- 18 -
ECONOMIES OF SCOPE
Economies of scope refer to the variety of business within a company.
Some companies provide various goods and services to expand their customer
base while other companies emphasize certain products. For example, in Fiscal
2005r American Eagle expanded by introducing two sub-brands, aerie and
MARTIN + OSA. Aerie is a line of intimates and dormwear for young women,
while MARTIN + OSA is a line of casual sports wear for men and women ages
25-40. If successful, these sub-brands will expand the market share of the
company to customers not in its original business model (www.ae.com). For the
industry to stay competitive, the consumer is likely to see sub-brands being
offered at all the major competitors in this industry. The expanded scope utilized
by companies in this industry lead to an intense challenge for new entrants to
overcome in order to be successful.
FIRST MOVER ADVANTAGE
In an industry that is dominated by brand recognition, there is a very
apparent first mover advantage. The competitors in the high end retail industry
all started competing around the late 1990s. These competitors wanted to offer
a substitute to higher end department stores for the consumer in the mid teens
to mid twenties. The target consumer takes pride in owning name brand
products. To have a name brand the company must establish itself by being in
the industry for a significant amount of time. There are exceptions to this rule, if
a movie star finds a designer that they like, a first mover advantage can be
attained by getting the designer to design for the company. If a start up
company can grab the designer before one of the companies already in place,
the new company will have a competitive advantage. This industry is filled with

- 19 -
brands that have been around for quite awhile, and with very few exceptions
there are no new entrants.
ACCESS TO CHANNELS OF DISTRIBUTION AND RELATIONSHIPS
Access to channels of distribution and the relationships with suppliers
plays a substantial role in an industry such as this. Fashion constantly changes
with the seasons, so inventory turnover is continually happening. Without good
reliable relationships with suppliers, the stores in this industry would not be able
to provide the current season’s line of clothing in stores when demanded. Poor
channels of distribution lead to poor quarterly sales and force stores to discount
merchandise to move it off the shelves. This industry thrives on having the
latest fashion. Even the most prestigious firm will fail if it can not keep up with
the ever changing pace. This means that one late shipment from the companies’
suppliers can be devastating for bottom line profits. This pressure will
discourage new entrants.
LEGAL BARRIERS
Because of the nature of retail, there are not many legal barriers to entry
in the industry. The largest legal barrier that new entrants face is trademarks.
The new entrant must differentiate its brand logo and their clothing enough so
that it is not exactly like the competition, but keep the same basic ideas to
appeal to the targeted market. Legal barriers do exist in the form of credit/debit
sales, but this is a risk that should be calculated for on the financial statements
of the company. Legal barriers also exist for high end retail stores that offer
there own credit cards. A final legal issue that every retail store faces is the
possibility of lawsuits from consumers who injure themselves at the stores. The
small number of legal barriers leads to an increase in the likelihood of new
entrants.

- 20 -
CONCLUSION
In conclusion, the threat of new entrants is relatively low in this industry
because this industry has large economies of scale, large learning economies,
large economies of scope, a large first mover advantage, and access to
distribution channels is well set. Legal barriers pose less of a threat as the other
categories, but they still will discourage new entrants on a smaller scale than the
other categories.
Threat of Substitutes
The threat of substitutes refers to products that potentially replace other
products due to changes in the economy or consumer preferences. The apparel
industry does not need to worry about the threat of a physical product
substituting the need for clothing. Companies worry about preserving their brand
name and work to make their name the must-have. If the brand name looses its
significance, consumers are likely to substitute the specialty retail shops with
something more convenient like a department store.
Department stores expand past casual comfortable wear and sell casual,
formal, and professional clothes for all ages. They also sell jewelry, makeup,
furniture, and other products making the department store a big time saver for
consumers. If a customer does not value a brand name but does value their
time, they are more likely to shop at the department store to get everything they
need at once.
Firms in the specialty retail industry tend to locate their stores close to
department stores. This helps to eliminate the threat of department stores being
too far from specialty retail stores. Therefore, it is not too much of a burden to
go to one of these specialty retail stores to find the desired brand name. This
way most of the family can shop at department stores and youth from ages 15
to 25 can shop at a specialty retail store. As long as these companies can

- 21 -
preserve the significance of brand names, the threat of substitute products is
low.
Power of Buyers
Buyers hold the ultimate power in deciding which companies within the
specialty retail industry succeed because they determine demand. Price
sensitivity and bargaining power are forums on which buyers base their
purchasing decisions. Many of these specialty stores are located in shopping
malls. Abercrombie and Fitch, Gap, Aeropostale, and American Eagle are usually
located close to each other in malls and shopping centers. The majority of the
industry’s buyers shop at more than one of the specialty stores which make
switching costs for customers within the specialty retail apparel industry almost
non-existent and could lead to direct competition between all industry
competitors. However, buyers are usually willing to pay the industry’s premium
prices as long as a firm maintains relatively high levels of design and quality.
Power of Suppliers
In an industry with few suppliers, buyers are forced to pay the demanded
price for supply. They also increase their demand by supplying at a lower cost
than their competitors. However, the suppliers in this specialized retail industry
have very little bargaining power over the companies they supply. Cheap
manufacturing labor is abundant throughout the world. Though each company
uses different purchasing methods, no one in the industry relies heavily on a
specific supplier. For example, Abercrombie & Fitch has no more than 5% of its
apparel coming from a single supplier. (www.abercrombie.com) Though the
majority of the firms’ merchandise is purchased from lone venders, the firms are
under no contractual obligation to continue to purchase merchandise from the
said vendor. Because these companies are not held to a contract with their

- 22 -
suppliers, the cost of switching vendors would be low. The vast majority of
materials and product manufacturing in the industry are purchased from
overseas (mainly in Southeast Asia and Central America). The merchandise is
shipped to the distribution centers (located in Warrendale, Pennsylvania and
Ottawa, Kansas in American Eagle’s case) where it is inspected for quality and
consistency. Due to the nature of foreign shipping, imports can be affected by
trade laws, increased taxes or changes in foreign economies or political systems.
This volatility increases the risk of receiving merchandise late or at an increased
price. This is another reason why the retailers are hesitant to put responsibility
and power into the hands of the suppliers (www.ae.com).
Industry Classification
The five forces model indicates that this is a competitive sub-industry that
differentiates itself from the larger retail clothing industry. As shown, this is a
mixed industry with competition ranging from high to medium and even to low.
More work exists for a firm in order to remain a major competitor in such a
mixed industry. It is this mixed industry that gives companies within the industry
the opportunity to increase their market shares fairly easily because the threat of
new entrants remains low.
Value Chain Analysis
The value chain is how a firm derives value from its every day operating
policies and procedures. Because we have classified this industry as a mixed
competition industry, there are many things a business can do to gain the most
value out of its activities. This industry requires competitors to differentiate and
keep manufacturing costs low. To be successful in this sub-industry, competitors
must be able to keep costs low and provide merchandise that consumers are
willing to pay a premium for. To do this, firms spend money on their brand
- 23 -
image and find additional places to cut costs. Each firm in the industry chooses
how to achieve its optimum balance of differentiation and cost efficiency.
Because this is a higher end retail industry, if a company does not differentiate;
the consumer will see it as a substitute to low-end clothing brands. Having a
product that is different is not enough though because consumers can easily
switch between companies. In order to stay profitable, a company must engage
in cost leadership practices. Corporate strategies in this sub-industry can be
costly. Each firm uses its corporate strategies to attempt to add value to the
firm. Examples of corporate strategies that derive value in this industry are
consumer benefits though discount cards and credit cards, maintaining low
manufacturing costs, expanding world-wide through the use of the internet, and
being innovative when introducing new lines (www.abercrombie.com,
www.ae.com, www.aeropostale.com, www.gap.com, www.limitedbrands.com).
Industry-wide, a competitive company must both be a cost leader and be
differentiated. All the firms in this industry sell very similar products; they are
produced with superior quality. This industry produces quality products
efficiently. It also exercises tight const control over production and shipping.
Within each of the firms in the sub-industry, there is a very high degree of
customer service. The customer service draws a consumer to buy more
products. Every store in this industry has spent considerable money on their
brand image. Consumers shopping in this industry know their preferred brands.
Money must also be invested in research and development, to determine the up
and coming fashions for each season. The nature of the fashion industry
requires that each company anticipate what is going to be in style the next
season so that they can start production and meet the demand of consumers.
American Eagle: Differentiation or Cost Leadership or Both?
American Eagle has had to both differentiate itself and be a cost leader in
the industry. To start with differentiation, American Eagle has selected a specific

- 24 -
target consumer. According to their 10-K, also provide “high quality
merchandise.” During the 2005 fiscal year, American Eagle spent $53.3 million
on advertising (AEO 10-K). This shows just a small portion of its investment into
brand image. American Eagle states in its 10-K that it relies heavily on personnel
in upper management positions as well in retail sales positions to move the
products it sells off the shelves and into the hands of consumers.
Although American Eagle has a strategy of differentiation, this only
propels it to the high end retail sub-industry. Within this sub-industry, American
Eagle is a cost leader. The 10-K states that it will not only provide high quality
goods, but they will be at “affordable prices.” The economies of scale and scope
mentioned earlier also help American Eagle be a cost leader. Specifically,
manufacturing of the goods that American Eagle sells in its stores has been
outsourced all over the world. In order to enforce quality standards, American
Eagle has a strict program that requires factories to comply with “global
workplace standards and their code of conduct” (AEO 10-K).
American Eagle offers a private label credit card. The credit card is issued
through a third party bank, so American Eagle recognizes no bad debt on its
income statement. Although there are undisclosed expenses associated with this
service, the benefit of not having bad debt far outweighs those expenses. This
helps American Eagle be a cost leader because it does not have to set money
aside for an allowance for bad debt. In conclusion, American Eagle succeeds in
the specialty retail sub-industry because it is able to differentiate itself from
department stores, while remaining a cost leader among its direct competitors.
American Eagle’s Corporate Strategies
Corporate strategy is how a firm sets itself apart based on its
infrastructure as a business. This includes differentiation and cost leadership
techniques. American Eagle uses the following techniques to improve customer
loyalty and relationships, minimize costs, and maximize market share.

- 25 -
AE ALL ACCESS PASS
The AE All Access Pass rewards customers for purchasing American Eagle
products by granting credits that are redeemable at www.ae.com . The purpose
of this program, according to www.ae.com, is to increase switching costs and
provide incentive for customer loyalty towards American Eagle. The All Access
Pass gives the holder access to exclusive American Eagle music. Customers are
entitled to sales and contests that only All Access Pass members are privileged to
attend. There are also other incentives, such as computer wallpapers, based
online for All Access Pass members.
AE CREDIT CARD
The American Eagle Credit Card also encourages customer loyalty through
small purchases. In addition, the credit card provides special promotional
information and advance notice of sales and other events. This increases
customer relations because customers are better informed of events and are
more likely to participate in said events.
The credit card also benefits American Eagle because they outsource the
bad debt through a private third party bank. This relieves American Eagle of
potentially unrecoverable accounts receivable (www.ae.com).
COST OF MANUFACTURING
American Eagle minimizes costs by outsourcing the majority of production.
In order to maintain low costs, the company uses a variety of suppliers so no
single supplier can control American Eagle’s production. In addition to
outsourcing, American Eagle participates in the Customs-Trade Partnership
Against Terrorism program, where they work with the United States Customs
Agency to ensure the security of the safety chains. By securing the safety

- 26 -
chains, American Eagle minimizes their potential liabilities and reduces excessive
insurance rates that protect their merchandise (AEO 10-K).
EXPANSIONARY SUB-BRANDS
In the 2005 fiscal year, American Eagle started to expand past their
previous targeted market group by establishing a sub-brand MARTIN + OSA.
This sub-brand is a line that combines the traditional sport, classic, and denim
clothing but is geared towards 25-40 year old men and women. In addition to
expanding their market share, American Eagle is broadening their scope for
younger women by introducing the sub-brand aerie. Aerie is a line that
specializes in dormwear and intimates. By expanding through sub-brands,
American Eagle is making itself more competitive with the leaders in the industry
(www.ae.com).
EXPANSION TO CANADA
In 2000, American Eagle purchased three Canadian businesses:
Bluenotes, which was recently discontinued, Braemar, and National Logistics
Services (NLS). Bluenotes is a previously established Canadian retail store. By
acquiring a well known clothing chain, Canadian consumers were able to
maintain confidence in the firm’s products. Braemar is similar to American Eagle
with premier mall locations. NLS is a 400,000 square foot distribution center
located near Toronto, and it enables American Eagle to ship products to the
growing Canadian market (AEO 10-K) (www.ae.com). By expanding into
Canada, American Eagle has created a competitive advantage by being on the
forefront of Canadian expansion within the industry. This creates barriers for
entry for American Eagle’s competitors because consumers are more likely to
trust the brand that they have been around the longest.

- 27 -
THE FUTURE OF AMERICAN EAGLE
American Eagle is expected to continue expansion in Canada and the
United States. Currently, there are no disclosed plans for expansion into Europe;
however, e-commerce allows people worldwide to purchase American Eagle
products. By expanding through e-commerce, American Eagle has unlimited
potential for future growth (www.ae.com).
Formal Accounting Analysis
Companies often distort financial statements to produce numbers more
appeasing to shareholders and reflect a better picture of the company. This bias
clouds the true value of the company and therefore the firm must be
reevaluated. The purpose of analyzing companies’ accounting policies is to undo
the accounting distortions to better assess the financial infrastructure of the
company (Palepu, 3-4). Bias can come from three different sources: noise from
accounting rules, forecast errors, and managers' accounting choices. Accounting
rules sometimes create noise because "it is often difficult to restrict management
discretion without reducing the information content of accounting data" (Palepu,
3-4). Forecast errors occur because it is difficult to predict what is going to
happen and how much inventory to have on hand for the future. It is also
difficult to accurately predict bad debt expense and write-offs. GAAP allows
managers to choose to be more aggressive or conservative when implementing
certain accounting policies. Ideally, the manager will aim for an accounting policy
somewhere between the two extremes. Managers also hold freedom to a level of
disclosure in regards to the firm’s financial statements. When a firm improves its
disclosure level, an analyst has a better chance of valuing the company
accurately.

- 28 -
Key Accounting Policies
In identifying key accounting policies, we consider the key success factors
of the industry and how American Eagle deals with and accounts for those
success factors. It is also important to analyze the level of disclosure with
regards to these success factors. In the retail industry, we analyze how American
Eagle manages its inventory and then compare it to the rest of the industry. We
should also review the way American Eagle deals with their leases and gift
cards. We need to look at the firm’s benefit and retirement plans and how they
account for goodwill impairments. The final two things we should examine are
how they handle expenses related to marketing and branding.
American Eagle leases both its retail spaces and the warehouses used to
store their merchandise. This makes them a cost leader because it allows for
tight cost control. GAAP flexibility allows many firms in this niche industry to use
the operating leases. American Eagle tends to establish contractual five to ten
year leases with set annual rental payments. The firm accounts for these rental
expenses though the use of operating leases. These operating leases could in
fact be revalued at a more applicable level though the use of capital leasing. This
is possible because American Eagle holds the future rights to these rental
properties with lease holding rights. Since American Eagle has acquired the
future use of the properties through contracts, they could list it as an asset on
the consolidated balance sheet to show a more accurate representation of the
company.
The subsequent chart compares the estimated present value of capital
leases to the present value of operating leases based on an industry mortgage
rate of 8%. Most retail firms prefer operating leases to capital leases simply
because operating leases will minimize liabilities and keep these contractual
obligations off of the balance sheet. American Eagle and its competitors have
true capital leases however, because stores are found in malls. The corporation
that owns the mall leases space to retail stores. By capitalizing American Eagle’s

- 29 -
leases we will gain an insight to their balance sheet that can show issues within
their liabilities and assets.
Operating & Capital Lease Present Values
$0$100,000$200,000$300,000$400,000$500,000$600,000$700,000$800,000$900,000
$1,000,000
2002 2,003 2004 2004 2006
Year
Pres
ent V
alue
s (th
ousa
nds)
Operating Lease PVCapital Lease PV
American Eagle evaluates their goodwill every year; however, the number
has not changed in the past two years. Goodwill for the past fiscal year was
nearly one million while assets were 1.6 billion. Therefore only .6% of American
Eagle’s assets are based on goodwill. This is a .1% drop from the previous
year's goodwill. Previously, the goodwill decreased at an accelerated rate due to
impairment. In 2003 American Eagle approximated its goodwill decreased value
by an approximated $14.1 million due to the "continued weak performance of
the Bluenotes segment" (AE 2003 10-K). Although American Eagle properly
recognized goodwill impairment, it failed to amortize the goodwill over a given
amount of time. If the goodwill held a greater portion of the company’s assets, it
would be considered an aggressive accounting strategy if the firm failed to
amortize it on an annual basis. By disclosing the amortization of the goodwill, an
analyst can better value the company’s true total asset value.
American Eagle increased inventory and the number of store locations over
the past five years. Sales have increased along with inventory. Inventory as a

- 30 -
percentage of sales is approximately 9.07% for the 2004 fiscal year. This
percentage stayed at about 9.13% for the 2005 fiscal year, and in fiscal 2006
this ratio increased to 9.4%. This shows the company is attempting to maintain
a steady ratio between sales and inventory. American Eagle efficiently
outsources production, and is able to better maintain a low cost of production
which leads to a greater profit margin. Although American Eagle outsources
production, it holds rigorous standards for the quality of its clothing. These
higher standards help American Eagle differentiate from the competition. These
disclosures in the 10-K allows analysts to place additional value on the high
standard for quality clothing and therefore determine a more relevant value.
American Eagle participates in a 401(K) plan and a stock purchase plan.
Both of these plans include company matches up to a certain percent. This falls
under customer service because both of plans require employees to stay
employed in order to optimize their potential benefits. The benefit plans attract
higher quality employees, which in turn improves customer service in the long
run. It also reduces training costs for new employees by encouraging current
employees to work diligently and increase employee loyalty to American Eagle.
The disclosure in the annual report reveals American Eagle puts a high emphasis
on taking care of their employees through the use of these benefit plans.
Gift cards are a means to increase the switching costs for customers,
which guarantees American Eagle a liability that they will later expense within
the next two years when the cards are redeemed or expired. American Eagle
had a more than 10 million dollar increase in unredeemed store value cards and
gift cards from fiscal years 2005 to 2006. This number reflects the value of gift
cards that are over two years old and can legally be counted as revenue.
American Eagle defines and utilizes gift cards as a key success factor (AE 10-K).
American Eagle established itself by initially creating the brand name and
then advertising the logo. This was accomplished through purchasing a
trademark and also implementing extensive advertisements. By creating a
demanded brand, the company then allows the customers to continue the

- 31 -
advertisements with a simple eagle logo found on the bottom of an American
Eagle shirt to set it apart from other clothing brands. These things come at a
cost, with trademark expenses and advertising expense. Advertising expenses
made up $53.3 million of Fiscal 2005's budget. Trademark costs are included in
intangible assets and are amortized over five to fifteen years. Although these
costs must be expensed, they also create true value for future cash flows with
potential customers.
Accounting Flexibility
Financial Statements for publicly traded companies must follow Generally
Accepted Accounting Principles (GAAP). GAAP attempts to set accounting
standards which will allow consistent evaluations of each firm within an industry
on a level field. GAAP allows for quite a bit of flexibility in certain areas. The
flexibilities are there to ensure truer valuations on the different financial
statements. However, some aspects of GAAP severely limit firms’ abilities to
properly value their company. Assessing the degree of accounting flexibility of a
particular firm’s key accounting policies will allow us to properly identify where a
firm might biasly report its worth instead of presenting a true value. These
discrepancies might come from limitations or flexibilities in GAAP.
American Eagle utilizes the flexibilities in GAAP to report different aspects of
its key accounting policies. Leases can be classified operating leases or capital
leases, but most of the firms in the specialty retail industry, including American
Eagle, choose to record leases as operating leases. GAAP allows for this
flexibility because not all leases are the same, and the different types require
different accounting measures. American Eagle chose operating leases because
it can reduce liabilities. This flexibility allows for these firms to manipulate their
values to shareholders.
American Eagle also utilizes the flexibilities of GAAP with respects to
estimating depreciation and amortization rates and schedules. GAAP will let the

- 32 -
firms decide how they want to value their assets because every asset is different.
Assets provide different values to different firms across industries. It would be
almost impossible to establish standards for every type of asset. Therefore,
assets such as goodwill can be amortized at the rate at the company’s discretion.
American Eagle has great flexibility in these areas, and the true value of the firm
is distorted because of the flexibility.
American Eagle also exercises flexibility by recognizing inventory at a
lower of average cost or market as opposed to LIFO or FIFO like other retailers.
In this method, American Eagle expenses cost of goods sold by using the lesser
of the weighted average cost as compared to the estimated market value. Some
may consider this to be a fairly accurate method which expresses the true value
of the inventory sold. However, American Eagle has autonomy in these
“estimations”, which may not be entirely unbiased.
GAAP allows for great flexibility with respects to merchandising
markdowns. American Eagle expenses merchandise markdowns at the current
term instead of counting the markdown as a contra-asset. GAAP also mandates
accrual based accounting for publicly trade firms. The American Eagle 10-K cites
in Fiscal 2004, the company had a net increase in cost of sales by $359,000. The
firm discloses that a non-related third party purchased the marked down
merchandise in a “strategic plan to eliminate transactions” with related parties
(AE 10-K). With the lower of average cost or market inventory system, the
company must expense the marked down merchandise. By selling it to a third
party, merely the proceeds affect the cost of goods sold and therefore the
company minimizes costs. If American Eagle did not find a third party to
purchase the merchandise, it would have to expense the entire loss to cost of
goods sold and would not recover any compensation. Selling to a third party
enables the firm to forgo the greater loss. However, this flexibility may have
been used to inaccurately report the firm’s value in the financial statements.
Gift cards provided limited room for flexibility. In the retail industry, the
companies recognize unearned revenues and increase liabilities until the gift card

- 33 -
is redeemed or expired. At that point, the revenue from the gift card is
recognized. American Eagle exercises flexibility by choosing to expiring gift cards
after two years. The card then requires a one dollar per month reactivation fee
after that time. American Eagle has been given much flexibility with deciding how
fast and how long to expire the gift cards.
Although GAAP allows for much flexibility in the industry, it also enforces
strict regulations in certain accounting areas. "Marketing and brand building are
key to the success of consumer goods firms, they are required to expense all
their marketing outlays" (Palepu 3-7). This portion of the retail industry must
expense advertisements and marketing. Firms in the specialized retail industry
rely on marketing to establish a strong customer base. This strong customer
base or future economic benefit could be considered an asset. Due to the
inflexibility of GAAP in this accounting aspect, assets might be greatly
undervalued.
Accounting Strategy
Based on the degree of accounting flexibility allowed by GAAP in the
specialty retail industry, firms such as American Eagle choose how aggressive or
conservative they would like to report different aspects of the financial
statements. This is important because flexibility enables managers of a company
to over additional explanations or to hide facts in the financial statements. A
good balance between the two extremes is essential to a firm's success, so they
may provide enough information to offer shareholders a representative value
while not unfolding all of their key business strategies to the competition. In the
United States firms can choose where they would like to be in the spectrum. We
can evaluate the accounting strategy by comparing American Eagle's accounting
policies to industry wide accounting policies.
American Eagle uses operating leases as opposed to capital leases as
discussed in the previous sections. By using operating leases, the firm only

- 34 -
recognizes the current year’s rent as a liability. When capitalizing a lease,
liabilities are increased by the present value of all future rent payments.
Liabilities increase by this future value and so assets also increase by this future
value. American Eagle has a contract to the future rights of the leased property;
therefore, the leases could be capitalized as assets. By not capitalizing the
leases, the firm understates its liabilities, making it more appealing to lenders.
This practice leads to overstating the company’s value and could be considered a
very aggressive accounting policy.
American Eagle is one of two firms in the industry that records goodwill as
an asset that has enough significance to disclose on the balance sheet. The
amortization rate of goodwill is based on the opinion of the upper level
managers. American Eagle annually reevaluates the market value of its goodwill
and checks for impairments. A very conservative firm would choose to quickly
amortize goodwill. Conversely a very aggressive firm might inflate its assets by
slowly amortizing goodwill. This reduces annual expenses and artificially inflates
net income. The annual reevaluations of goodwill are neither aggressive nor
conservative conveying a relatively true value of goodwill.
American Eagle reports inventory at lower of average cost or market
utilizing the retail method. This means "markdowns are fully accounted for in
the month in which they have been taken. It assumes most of the markdowns
apply to goods sold and therefore that few of those goods are part of the ending
inventory" (www.cfpsa.com). Looking at other firms in the industry,
Abercrombie & Fitch and The Limited Brands use this same method with their
inventory, while Aeropostale and The Gap use the first-in first-out method.
Assuming inflation, the first-in first-out method will provide an artificially low cost
of goods sold which will inflate net income. This inventory accounting is
considered aggressive. Conversely a last-in first-out method would be
conservative accounting. Because of the method American Eagle has chosen to
use, they are again neither aggressive nor conservative. The market rate that is

- 35 -
involved in their inventory calculations reveals a more relevant estimate of
inventory value.
By reporting gift cards as a current liability, American Eagle practices
conservative accounting. American Eagle only recognizes revenue when the gift
card is redeemed for merchandise. American Eagle can also credit their selling,
general, and administrative expenses when a card has been inactive for more
than twenty-four months. A more aggressive firm would deduct more value from
a gift card at a faster rate for inactivity on the account. This will allow them to
recognize more revenue sooner. Conversely a more conservative firm might not
recognize revenue from unredeemed gift cards for an unidentified time period.
American Eagle, once again, appears to have taken a moderate stance in
another area of their financial statements.
Overall American Eagle is relatively moderate in accounting for their key
success factors. Because of this, their financial statements more closely reflect
true values than other firms that take more aggressive or conservative stances.
Quality of Disclosure
The quality of disclosure is important because it helps identify a
company’s accounting strategy. Poor disclosure potentially raises red flags; a
company may be concealing information to smooth out financial statements.
Disclosure elaborates on the business based on the consolidated financial
statements through the use of footnotes and explanations. Quality of disclosure
has more importance than the quantity of disclosure. This is a very important
distinction because a firm that discloses more than enough information could be
trying to overwhelm analysts and stockholders, so they miss underlying problems
the company is facing.
In previous fiscal years, AE presented a higher quality of disclosure. As
we continued to search for necessary line items to compute ratios to gain a
better understanding, we ran into problems. The company offers a poor list of

- 36 -
what liabilities entail and fails to offer essential information such as the interest
rates that accompany debt. By failing to disclose this information we must make
assumptions to determine the value for the company. However, American Eagle
disclosed how each new FASB Pronouncement directly affected their financial
statements with respect to Fiscal 2004, and how it will affect the company in
years to come. Many entries on the financial statements have supplementary
notes to help better explain specific entries. The table of contents is very
informative and specific. This makes it easier to find specialized information.
American Eagle also experienced disclosure problems in a few other
areas. For example, the "Merchandise Inventory" disclosure was confusing
because American Eagle uses lower of average cost or market, but they did not
define what the implications of utilizing that method entailed. American Eagle
did not disclose the legal proceedings that arise out of the conduct of business.
The vagueness of the "legal proceedings and claims" section leaves the investor
to draw their own conclusions about such an important aspect of business.
SALES MANIPULATION DIAGNOSTICS
Sales manipulation diagnostics allows analysts to compare net sales
dollars to other revenue related accounts: cash from sales, net accounts
receivables, unearned revenues and inventory. The following tables compare
American Eagle with its major competitors in the retail industry over a five year
span. The tables also provide a five year average among the industry. By
comparing the five most recent years, we can compare American Eagle to within
the industry to identify red flags, and determine how past accounting policies
influenced where the company is now.

- 37 -
Net Sales/Cash From Sales
0.99
1.00
1.01
1.02
1.03
2002 2003 2004 2005 2006
Year
Net
Sal
es/C
ash
from
Sal
es
American Eagle
Abercrombie and Fitch
Aeropostale
Gap
Limited
Industry Average
In this section of the retail industry, the net sales/cash from sales ratio
suggests that almost all revenue in net sales comes from cash over the past five
years. The accounts receivable (non-cash sales) makes up a minimal portion of
sales and therefore hardly impacts the ratio. This stays consistent over the five
year period throughout the industry. A third party assumes all of the consumer
accounts receivable and compensates American Eagle with cash. Therefore,
Accounts Receivable from customers is never actually recorded on the company’s
balance sheet. This is how companies in the apparel industry maintain a net
sales/cash from sales ratio so close to one. This means that the industry, based
solely on this ratio has some liquidity.

- 38 -
The net sales/net accounts receivables ratio for the past five years in the
retail industry was inconsistent and unpredictable. After looking into American
Eagle’s previous 10-Ks, we found accounts receivables detailed, and then we
analyzed the dramatic increase in 2003. The increase is a result of collected
smaller increases over different categories including fabrics, related parties, sell-
offs to non-related parties, etc. which caused a substantial overall effect in
accounts receivable. Aeropostale and Gap cannot be included in this ratio
because they do not disclose their accounts receivables balance in their 10-Ks.
These numbers tell us that, although most of the companies in the industry do
have accounts receivable, this balance makes up a very small portion of their
business.
Net Sales/Net Accounts Receivables
0.00
50.00
100.00
150.00
200.00
250.00
2002 2003 2004 2005 2006
Year
Net
Sal
es/N
et A
ccou
nts
Rec
eiva
bles
American Eagle
Abercrombie and Fitch
Aeropostale
Gap
Limited
Industry Average

- 39 -
Unlike its competitors, American Eagle discloses unearned revenues due
to gift cards. This disclosure allows us to assess net sales/unearned revenues
ratio. By listing the unearned revenue, American Eagle recognizes it is liable to
the customer, and it allows analysts to acknowledge potential liabilities that may
be recorded as assets in future periods.
Net Sales/Unearned Revenues
56.0058.0060.0062.0064.0066.0068.0070.0072.00
2002 2003 2004 2005 2006
Year
Net
Sal
es/U
near
ned
Rev
enue
s
AEOS
Net Sales/Inventory
0.00
2.00
4.00
6.00
8.00
10.00
12.00
14.00
16.00
2002 2003 2004 2005 2006
Year
Net
Sal
es/In
vent
ory American Eagle
Abercrombie and Fitch
Aeropostale
Gap
Limited
Industry Average

- 40 -
The net sales/inventory ratio for the past five years has steadily
decreased. This is consistent with the industry, although American Eagle is
higher than the industry average. American Eagle has been attempting to better
match inventory with projected sales to become more efficient and drive the
ratio down. American Eagle is decreasing the ratio in order to become more like
the industry leaders. As it shifts its trend to a more stable and cost efficient level
of inventory, they further secure their place in the market. This ratio informs
analysts that this industry is very efficient and appears to be getting more
efficient with time.
CORE EXPENSES MANIPULATING DIAGNOSTICS
On the other side of the spectrum, core expense manipulating diagnostics
analyze how expenses affect operations and production. If expenses decrease
too much, then there is a chance the expenses are understated and therefore
signaling a red flag.
Declining Asset Turnover
0.00
0.50
1.00
1.50
2.00
2.50
3.00
2002 2003 2004 2005 2006
Year
Dec
linin
g A
sset
Tur
nove
r
American Eagle
Abercrombie and Fitch
Aeropostale
Gap
Limited
Industry Average

- 41 -
The total asset turnover ratio measures net sales divided by total assets. A
company wants its assets to produce more sales, and therefore should strive for
a higher ratio. In the retail industry, all of the companies seem to have a
wavering ratio and therefore American Eagle’s declining ratio does not merit a
red flag. Looking into American Eagle’s sales compared to assets, the figures are
both inclining at a steady rate. Because American Eagle has been restructuring
their company, this could explain the declining ratio. A red flag is not merited
because in the most recent years the ratio has been increasing, and American
Eagle remains close to the industry average.
American Eagle’s four year average for changes in cash from operating
cash flow over operating income is higher than the other averages in their
portion of the retail industry. This implies investments made in operating income
effectively increased the cash flows from operations. This average is heavily
biased by the Fiscal year 2003 where the ratio is .83. Although a .83 ratio looks
Changes in CFFO/OI
-0.80
-0.60
-0.40
-0.20
0.00
0.20
0.40
0.60
0.80
1.00
2002 2003 2004 2005 2006
Year
Cha
nges
in C
FFO
/OI
American Eagle
Abercrombie and Fitch
Aeropostale
Gap
Limited
Industry Average

- 42 -
appealing on face value, the ratio is so high because of a significant decrease in
operating income. The operating income stabilized over the remaining years in
the average. Because of the stabilization process, American Eagle’s ratio does
not raise a red flag.
The cash flows from operations to net of assets ratio compares CFFO
against plant, property, equipment (net of depreciation) and inventory. American
Eagle produces higher than industry average ratios because they increase their
CFFO at a much greater rate than the competitors. American Eagle increases by
more than $100,000,000 while their competitors increase their CFFO by closer to
$50,000,000. This indicates the firm is growing at a much faster rate than the
other companies in the industry. Reading American Eagle’s 10-K leads us to
conclude that American Eagle’s growth strategy causes this ratio to be so high.
American Eagle plans how many stores to implement each year, and this number
is higher than other firms in the industry.
Changes in CFFO/NOA
-0.30
-0.20
-0.10
0.00
0.10
0.20
0.30
0.40
2002 2003 2004 2005 2006
Year
Cha
nges
in C
FFO
/NO
A
American Eagle
Abercrombie and Fitch
Aeropostale
Gap
Limited
Industry Average

- 43 -
The total accruals/change ratio in sales analyzes the inventory less the
cash flows from operations over the change in sales. This ratio is negative
because the CFFO is higher than the inventory. Changes in sales are increasing
which drives the ratio even smaller in Fiscal 2004 and 2005. The AE 10-K fails to
disclose additional reasons for the smaller ratio. This ratio would raise a red flag
when looking at just American Eagle, but the entire industry also has a negative
ratio. Because this negative ratio is seen industry wide we must assume that it
is standard for the industry. American Eagle’s ratio falls in the middle of the
industry which also provides some confidence that this ratio should not be
alarming.
The figures for these ratios were easy to find in the American Eagle 10-K
as opposed to their competitors. Gap and Aeropostale both failed to report their
accounts receivables but instead lump them into oversimplified categories such
as current assets. American Eagle’s disclosure elaborated on many of their
policies including retirement plans, the details of expenses, and plenty of
footnotes to elaborate on management’s reasons and methods. This helps not
Total Accruals/Change in Sales
-2.00
-1.50
-1.00
-0.50
0.00
0.50
1.00
2002 2003 2004 2005 2006
Year
Tota
l Acc
rual
s/C
hang
e in
Sal
es
American Eagle
Abercrombie and Fitch
AeropostaleGap
Limited
Industry Average

- 44 -
only investors, but analysts so we can better appraise the true value of the
company.
CONCLUSION
These diagnostics deal with sales and expense manipulation in many
ways. Most of the ratios include sales as one part of them. It is easy to spot
areas that a company in the industry attempts to compensate their numbers by
comparing each ratio to the industry and the industry average and also analyzing
the relevant revenues or expenses. American Eagle has very few examples
where the ratio is not around the industry average. This can be explained by
American Eagle’s recent growth strategy and restructuring.
Potential Red Flags
Analyzing "red flags" can show potential pitfalls of the firm. "Red flags"
are the easiest way to find quality errors in accounting. Although "red flags" can
be hazardous to a company, some red flags deal with good business practices.
In looking for "red flags", the fourth quarter statements are crucial. This is
because adjustments are more likely to be made in this time period trying to
smooth out end of year numbers to appeal more to stock holders. We should
watch for changes in auditors, financial ratios changing, and changes in
accounting in the face of poor performance. We should examine accounts
receivable and inventory in relation to sales, and if there is a big change we
should be concerned.
American Eagle’s disclosure level allowed us to analyze ratios and
management strategies clearly and have yet to find substantial red flags. Even
so, there are a few factors we need to double check before approving of all
accounting. Two of these factors include their leases and how they amortize
goodwill. The operating leases produce the only noteworthy “red flag” because
the company expenses leases instead of capitalizing the lease as an asset and

- 45 -
adding the liability. American Eagles amortization of goodwill is not significant
and does not greatly affect the accounting of the firm.
Undo Accounting Distortions
After going through this long process, it is possible to "fix" the accounting
of a company so that we can see what is really going on in a business. American
Eagle’s operating leases could be considered a distortion because the lease
contract implies future economic gain. Therefore, the leases should be
capitalized as assets in order to properly value the firm’s assets. By not doing
this, it overvalues the firm because the liabilities are understated. The following
is a table showing the present value of operating leases as opposed to
capitalized leases.
Capitalization of American Eagle's Operating Leases
Operating Leases Capital Leases Year FV PV Factor (8%) PV Year FV PV Factor (8%) PV 2006 $149,645 0.926 $138,560 2006 $157,582 0.926 $145,909 2007 $149,545 0.857 $128,211 2007 $150,530 0.857 $129,055 2008 $145,321 0.794 $115,360 2008 $142,922 0.794 $113,456 2009 $137,838 0.735 $101,315 2009 $135,044 0.735 $99,261 2010 $124,257 0.681 $84,567 2010 $127,133 0.681 $86,525 2011 $165,352 0.630 $104,200 2011 $119,676 0.630 $75,416 2012 $165,352 0.583 $96,481 2012 $108,335 0.583 $63,212
Total PV $768,695 Total PV $712,835
The total present value of capitalized leases equals $712,835. A truer
value of the firm would have long-term liabilities and long-term assets increased
by this number. The total liabilities stated in the 10-K for 2006 was $450,097.
By increasing total liabilities by the present value of the capitalized leases this
would increase liabilities by more than 250 percent. By expensing advertising
and trademarks instead of recognizing the potential assets, it undervalues the
firm (AEO 10-K). This is significant because if American Eagle utilized capital
leases, the debt-to-equity ratio would increase substantially due to recognizing

- 46 -
leases as liabilities as opposed to expenses. Below is how the balance sheet
looks with the leases capitalized as well as how the leases looked before they
were changed.

- 47 -
2002 2003 2004 2005 2006 Assume 2007 2008 2009 2010 2011 2012 2013 2014 2015 2016 Current assets:
Cash and cash equivalents
194,526 137,087
219,372 130,529 59,737 Short-term investments
47,047 200,725
370,235 620,989 767,376 Merchandise inventory
124,708 120,586
170,576 210,739 263,644 13% 285,608 325,593 371,176 423,141 482,380 549,914 626,901 714,668 814,721 928,782 Accounts and note receivable, including related party 13,598
24,129 26,432 29,146 26,045
Prepaid expenses and other 32,153
27,589 25,856 30,110 33,720
Deferred income taxes 15,846
20,584 39,313 46,976 33,720
Assets held-for-sale --- --- 13,581 12,183 47,732
Total current Assets 427,878 530,700 865,365 1,080,672 1,198,254 62% 1,362,130 1,552,828 1,770,224 2,018,055 2,300,583 2,622,665 2,989,838 3,408,415 3,885,593 4,429,576 Property and equipment, at cost, net of accumulated depreciation and amortization 267,479 340,955 339,833 345,518 481,645 Goodwill, net of accumulated amortization
23,614 10,136
9,950 9,950 9,950 Long-term investments
24,357
84,416 145,774 251,644 Other assets, net of accumulated amortization
22,368 26,266 29,362 23,735 45,991 Non-current Assets:
313,461 401,714 463,561 524,977 789,230 834,854 951,733 1,084,976 1,236,873 1,410,035 1,607,440 1,832,481 2,089,029 2,381,493 2,714,902 Total assets
741,339 932,414 1,328,926 1,605,649 1,987,484 1.45 2,196,984 2,504,561 2,855,200 3,254,928 3,710,618 4,230,104 4,822,319 5,497,444 6,267,086 7,144,478 growth %
Current liabilities:
Accounts payable
50,608 71,330
108,929 139,197 171,150 Current portion of note payable
4,225 4,832
Accrued compensation and payroll taxes
13,001 14,409
36,008 58,186 58,371 Accrued rent
28,476 30,985
45,089 52,506 57,543 Accrued income and other taxes
12,655 28,669
33,926 43,273 87,780 Unredeemed stored value cards and gift certificates 22,837
25,785 32,724 43,045 54,554
Current portion of deferred lease credits --- 10,261 9,798 10,406 12,803
Other liabilities and accrued expenses 9,784
13,025 16,152 15,010 18,263
Total current liabilities 141,586 208,979 282,626 361,623 460,464 21.5% 472,351 538,481 613,868 699,810 797,783 909,472 1,036,799 1,181,950 1,347,423 1,536,063
Non-current liabilities:
Note payable 16,356
13,874 --- ---
Deferred lease credits --- 53,936 57,758 60,087 65,114
Other non-current liabilities 5,915
18,492 25,056 28,387 44,594
Total non-current liabilities 22,271 86,058 82,814 88,474 109,708 5.5% 120,834 137,751 157,036 179,021 204,084 232,656 265,228 302,359 344,690 392,946
Total Liabilities 163,857 295,037 365,440 450,097 570,172 27% 593,186 676,232 770,904 878,831 1,001,867 1,142,128 1,302,026 1,484,310 1,692,113 1,929,009
Stockholders’ equity 577,482 637,377 963,486 1,155,552 1,417,312 76% 1,669,708 1,903,467 2,169,952 2,473,745 2,820,070 3,214,879 3,664,962 4,178,057 4,762,985 5,429,803
Total liabilities and stockholders’ equity 741,339 932,414 1,328,926 1,605,649 1,987,484 100% 2,196,984 2,504,561 2,855,200 3,254,928 3,710,618 4,230,104 4,822,319 5,497,444 6,267,086 7,144,478

48
2002 2003 2004 2005 2006 Assume 2007 2008 2009 2010 2011 2012 2013 2014 2015 2016 Current assets: Cash and cash equivalents
194,526 137,087
219,372 130,529 59,737 Short-term investments
47,047 200,725
370,235 620,989 767,376 Merchandise inventory 124,708 120,586 170,576 210,739 263,644 13% 285,608 325,593 371,176 423,141 482,380 549,914 626,901 714,668 814,721 928,782 Accounts and note receivable, including related party 13,598
24,129 26,432 29,146 26,045
Prepaid expenses and other 32,153 27,589 25,856 30,110 33,720 Deferred income taxes 15,846 20,584 39,313 46,976 33,720 Assets held-for-sale --- --- 13,581 12,183 47,732 Total current Assets 427,878 530,700 865,365 1,080,672 1,198,254 62% 1,362,130 1,552,828 1,770,224 2,018,055 2,300,583 2,622,665 2,989,838 3,408,415 3,885,593 4,429,576 Property and equipment, at cost, net of accumulated depreciation and amortization 267,479 340,955 339,833 345,518 481,645 Goodwill, net of accumulated amortization 23,614 10,136 9,950 9,950 9,950 Long-term investments 24,357 84,416 145,774 251,644 Other assets, net of accumulated amortization
22,368 26,266 29,362 23,735 45,991 Future Lease Hold Rights 697,769 747,264 675,204 712,845 811,618 29% 637,125 726,323 828,008 943,929 1,076,079 1,226,730 1,398,472 1,594,259 1,817,455 2,071,899 Non-current Assets: 1,011,230 1,148,978 1,138,765 1,237,822 1,600,848 834,854 951,733 1,084,976 1,236,873 1,410,035 1,607,440 1,832,481 2,089,029 2,381,493 2,714,902 Total assets 741,339 932,414 1,328,926 1,605,649 2,799,102 1.45 2,196,984 2,504,561 2,855,200 3,254,928 3,710,618 4,230,104 4,822,319 5,497,444 6,267,086 7,144,478 growth % Current liabilities: Accounts payable 50,608 71,330 108,929 139,197 171,150 Current portion of note payable
4,225 4,832
Accrued compensation and payroll taxes
13,001 14,409
36,008 58,186 58,371 Accrued rent
28,476 30,985
45,089 52,506 57,543 Accrued income and other taxes
12,655 28,669
33,926 43,273 87,780 Unredeemed stored value cards and gift certificates 22,837
25,785 32,724 43,045 54,554
Current portion of deferred lease credits --- 10,261 9,798 10,406 12,803
Other liabilities and accrued expenses 9,784
13,025 16,152 15,010 18,263
Total current liabilities 141,586 208,979 282,626 361,623 460,464 21.5% 472,351 538,481 613,868 699,810 797,783 909,472 1,036,799 1,181,950 1,347,423 1,536,063
Non-current liabilities:
Note payable 16,356
13,874 --- ---
Deferred lease credits --- 53,936 57,758 60,087 65,114
Future LeaseHold Obligations 697,769 747,264 675,204 712,845 811,618 29% 637,125 726,323 828,008 943,929 1,076,079 1,226,730 1,398,472 1,594,259 1,817,455 2,071,899
Other non-current liabilities 5,915
18,492 25,056 28,387 44,594
Total non-current liabilities 703,684 819,692 758,018 801,319 921,326 5.5% 120,834 137,751 157,036 179,021 204,084 232,656 265,228 302,359 344,690 392,946
Total Liabilities 845,270 1,028,671 1,040,644 1,162,942 1,381,790 27% 593,186 676,232 770,904 878,831 1,001,867 1,142,128 1,302,026 1,484,310 1,692,113 1,929,009
Stockholders’ equity 577,482 637,377 963,486 1,155,552 1,417,312 76% 1,669,708 1,903,467 2,169,952 2,473,745 2,820,070 3,214,879 3,664,962 4,178,057 4,762,985 5,429,803
Total liabilities and stockholders’ equity 741,339 932,414 1,328,926 1,605,649 2,799,102 100% 2,196,984 2,504,561 2,855,200 3,254,928 3,710,618 4,230,104 4,822,319 5,497,444 6,267,086 7,144,478

49
Financial Ratio Analysis
The best way to estimate the future of the company is to analyze the past; an
analyst must observe trends and ratios that reveal how managers run operations.
Ratios give the analyst an idea of the stability of a firm and also show potential for
growth. Evaluating ratios ties the largest financial numbers of the firm's income
statement and balance sheet together, showing how the two are interrelated. The
ratios we use break down in to groups to describe the liquidity, profitability, and capital
structure of a firm. They also offer a quantitative method to compare a single company
to an industry standard or a similar benchmark company. Alone a ratio may not provide
a clear idea as to how the firm is performing, but comparison to other companies in the
industry shows relative performance and provides a sense of direction for the company
aims. Ratios may be misleading when simply evaluating the numbers, but the analyst
further explores the make up of the ratios through investigating the company's annual
report. .
Additionally, these relationships allow the analysts to forecast future earnings. It is
the future earnings and cash flows that ultimately determine the present value of the
firm. If a company produces steadily improving ratios, investors gain confidence in the
firm and are willing to invest. American Eagle greatly altered accounting methods in
2003 and matured as a company. Therefore, we based most of our assumptions upon
2004 to 2006 to forecast the next 10 years.
Trend/Cross Sectional Analysis
The trend or time series analysis helps to analyze the financial situation of a
company over a period of time. By understanding the changes in these ratios, an
analyst can properly forecast future financial estimations. Similarly, the cross sectional
analysis utilizes the information from the trend analysis and compares it to the same
ratios of the industry competitors. Below is the trend analysis for American Eagle for the
past five years.

- 50 -
Trend Analysis for American Eagle 2002 2003 2004 2005 2006 Current Ratio 3.02 2.52 3.06 2.99 2.60 Quick Asset Ratio 1.80 1.73 2.18 2.16 1.85 Accounts Receivable Turnover 101.70 62.90 71.17 79.23 107.29 Inventory Turnover 6.75 7.35 5.88 5.86 3.40 Days Supply of Inventory 54.06 49.68 62.05 62.25 5.51 Days Supply of Receivables 3.59 5.80 5.13 4.61 66.24 Working Capital Turnover 4.83 4.46 3.23 3.21 3.79 Gross Profit Margin 39.12% 38.28% 46.66% 46.50% 47.97% Operating Profit Margin 11.49% 9.28% 19.28% 19.97% 21% Net Profit Margin 6.37% 4.15% 11.34% 12.74% 13.86% Asset Turnover 1.87 1.66 1.42 1.44 1.41 ROA 13.10% 8.04% 22.88% 22.13% 24.12% ROE 17.55% 10.32% 33.47% 30.53% 33.52% Debt to Equity Ratio 0.28 0.46 0.38 0.39 0.40 Times Interest Earned 83.12 90.59 309.78 n/a 33109.79Debt Service Margin 31.97 44.54 n/a n/a n/a Net Store Openings 75 52 41 23 42 Sustainable Growth Rate 16.77% 11.74% 32.89% 35.17% 39.13% Internal Growth Rate 13.10% 8.04% 23.83% 25.30% 27.95%
Liquidity Ratios CURRENT RATIO
The current ratio measures current assets to current liabilities. This number
measures the firm’s ability to use its current assets to meet its current obligations. The
current ratio will increase if the current assets increase and/or the current liabilities
decrease. A stable or slowly increasing number is considered a favorable outcome for
the company. It could also be used to measure the efficiency of a company’s current
assets. If a company’s current ratio is excessive, then this could be indicative that they
keep too many current assets and should be investing them into long-term assets.
American Eagle’s current ratio has fluctuated over the past five years. With the
exception of 2002, current assets and current liabilities are increasing, but the increase
in assets is larger than the increase in liabilities. For the past five years, current
liabilities as a percentage of assets are remaining stable around 21.5%. Therefore, it
might be a safe assumption that current assets will stay at this percentage of total
assets for the next ten forecasted years. However, current assets increased about 2%

- 51 -
as a percentage of total assets for the past year to 67.3%. Obviously, current assets
will not increase by this amount indefinitely. A safe assumption for forecasting
purposes might be that current assets will stable off at the five year average of current
assets as a percentage of total assets. American Eagle’s 2006 current ratio fell from the
previous year because current liabilities increased more than the increase in current
assets.
Current Ratio
0.00
0.50
1.00
1.50
2.00
2.50
3.00
3.50
2002 2003 2004 2005 2006
Year
Cur
rent
Rat
io
American Eagle
Abercrombie and Fitch
Gap
Limited
Aeropostale
Industry Average
The graph above shows the cross sectional analysis of the industry as compared
to American Eagle. American Eagle’s trend follows the industry average with the
exception of 2003, and its ratio usually stays about .5 above the industry average.
Typically staying above the industry average is favorable. Abercrombie and Fitch’s
current ratio seems stable until 2004 where it dropped because its current assets
dropped considerably. Gap’s current ratio jumped from 2002 to 2003 because of a
large increase in current assets. Gap’s numbers stable off in the past three years
because current assets and current liabilities decreased at about the same rate.

- 52 -
Limited’s current ratio takes a dive in 2004 because of a large decrease in current
assets while current liabilities increased. Aeropostale’s current ratio is relatively stable
and has not shown any major fluctuations.
Too high of a current ratio is inefficient because a companies assets are not
invested to derive the highest rate of return. A stable current ratio around 2.0 is
favorable because banks feel they can predict a company’s risk better and therefore are
more likely to lend money at a lower interest rate. American Eagle’s current ratio is
above the industry average but it is not excessively large, and remains consistent with
the industry’s fluctuations over the past five years.
QUICK ASSET RATIO
The quick asset ratio measures cash, securities, and accounts receivables to
current liabilities. This ratio is more defined because it doesn’t include large accounts
such as inventory. Similar to the current ratio, it measures assets to liabilities;
however, it measures only the most liquid of assets to cover the current liabilities. A
quick asset ratio of less than one is unfavorable be because a firm would not have
enough quick assets to cover its current liabilities in an emergency.
American Eagle’s quick asset ratio has remained relatively stable over the past 5
years. As current liabilities increase, quick assets also increase by about the same
amount. Therefore, the ratio has remained stable. Currently, American Eagle’s quick
asset ratio is 1.85. This means that they have $1.85 of quick assets to pay off every $1
of current liabilities.

- 53 -
Quick Asset Ratio
0.00
0.50
1.00
1.50
2.00
2.50
3.00
3.50
4.00
2002 2003 2004 2005 2006
Year
Qui
ck A
sset
Rat
io American Eagle
Abercrombie and Fitch
Gap
Limited
Aeropostale
Industry Average
The industry maintains a quick asset ratio of above one. Abercrombie and Fitch’s
quick asset ratio fell after 2003. The large spike in 2003 is due to of a substantial
increase in their marketable securities for that year. Gap steadily increased quick assets
ratio over the past five years. This is because its securities increase every year as its
current liabilities decreases. Limited saw a quick asset ratio trend similar to
Abercrombie and Fitch’s and the industries. Limited’s 2006 ratio is the only ratio below
one for the past five years. Aeropostale’s quick asset ratio has a spike because they
have an increase followed by a decrease in cash with steadily increasing current
liabilities.
ACCOUNTS RECEIVABLE TURNOVER
The accounts receivable turnover measures sales to accounts receivables. This
shows how many times in a year that a company could convert current accounts

- 54 -
receivables into sales. Accounts receivable turnover shows a firm’s ability to collect debt
that is owed to it. It also is an indication of a company’s credit policy. A low accounts
receivable turnover indicates that a company has trouble collecting its debts. On the
other hand a high accounts receivable turnover implies that a company issues a low
amount of credit and operates more in terms of cash. In this case, the firm is not using
its assets in an efficient manor. A company with high accounts receivables might also
have a strict accounts receivables policy that encourages early payment. Accounts
receivables turnover would also increase if sales increases by any increase in accounts
receivables. Days supply of accounts is a ratio that identifies the average number of
days that accounts receivables are outstanding.
Accounts receivables turnover for American Eagle has remained relatively stable
over the past five years, with the exception of 2002. Sales and accounts receivables
grew for all of the years except 2002 where sales increased, but accounts receivables
actually decreased for that year. This caused an unusual spike for that year. Similarly,
days supply of account seems almost stable around five days for the last five years with
the exception of 2002. During this year, the decrease in accounts receivables causes
the days supply of accounts to drop to almost 3.5 days. This is considered good
because American Eagle collects its accounts faster than the five year average.

- 55 -
Accounts Receivables Turnover
0.00
50.00
100.00
150.00
200.00
250.00
2002 2003 2004 2005 2006
Year
Acc
ount
s R
ecei
vabl
es T
urno
ver
American EagleAbercrombie and FitchGap LimitedAeropostaleIndustry Average
The graph above shows that American Eagle’s accounts receivable turnover has,
with the exception of 2003, been almost identical to the industry average. The industry
maintained an average that seems to be stable with the exception of Abercrombie and
Fitch during Fiscal 2003. Abercrombie shows a peak in accounts receivable turnover of
230 in 2003. This peak was caused by steadily increasing sales and a decrease in
accounts receivables from 2002-2003. Limited saw a low ratio in accounts receivables
turnover in 2002 because accounts receivables increased by a higher percentage than
sales. During 2003 they returned to a higher turnover, and they slowly decreased
turnover for the remainder of the five years.

- 56 -
Days Supply of Receivables
0.00
1.00
2.00
3.00
4.00
5.00
6.00
7.00
8.00
2002 2003 2004 2005 2006
Year
Day
s R
ecei
vabl
es
American EagleAbercrombie and FitchGap LimitedAeropostaleIndustry Average
The days supply of accounts graph represents the average number of days the
accounts receivable are outstanding. The graph shows similar things about each
company and the industry, as compared to the accounts receivables turnover graph.
The significant changes in the Abercrombie and Fitch line play a part in the industry
line’s path over the last five years. The industry average of days supply of accounts
doubled from 2003 to 2005. This is because both Limited and Abercrombie and Fitch’s
receivables turnover sharply decreased for those years. Therefore, the days supply of
receivables increased as a result.
INVENTORY TURNOVER
Inventory turnover shows the number of times that a company replaces its
current inventory during a period. It is calculated by dividing cost of goods sold by the
inventory. A low turnover could exist because of poor sales or an abundance of
unnecessary inventory. An increase in the ratio suggests sales are improving, and/or
the amount of inventory does not meet the selling needs of the company. An increase

- 57 -
might also represent a company becoming more efficient by decreasing its unnecessary
inventory. Days supply of inventory is a similar ratio that represents the average
number of days during a period that inventory is on hand.
American Eagles inventory turnover seems to decrease over time, with the
exception of Fiscal 2003, because sales and inventory are increasing. However,
inventory levels are increasing at a higher rate than sales. 2003 is an outlier because
sales increased while inventory levels decreased. The days supply of inventory ratio
provides an inverse look at the sales and inventory levels. The number of days of
supply increases from 2002 to 2006 with the exception of 2003. The decrease in days
of supply is caused by the fall in inventory levels for 2003. Otherwise the number of
days increases because inventory levels are increasing by a larger percentage than the
respective increases in sales.
Inventory Turnover
0.00
1.00
2.00
3.00
4.00
5.00
6.00
7.00
8.00
9.00
10.00
2002 2003 2004 2005 2006
Year
Inve
ntor
y Tu
rnov
er American EagleAbercrombie and FitchGap LimitedAeropostaleIndustry Average

- 58 -
The industry’s inventory turnover appears to remain stable over the last five
years. Abercrombie and Fitch provides the largest amount of deviation because its
inventory turnover plummets over the course of five years. This decrease is caused by
a higher percentage increase in inventory relative to cost of goods sold in 2005 and
2006. Aeropostale, a relatively new company, has an inventory turnover that is not
consistent with the industry. Its inventory levels increased at a higher rate than the
increases in cost of goods sold. Gap’s inventory turnover seems very stable; the
company saw very small changes in inventory and cost of goods sold throughout the
five years. Limited also had a stable inventory turnover and experienced very small
increases in both inventory and cost of goods sold. Therefore, the industry provided a
seemingly stable inventory turnover ratio.
Days Supply of Inventory
0.00
20.00
40.00
60.00
80.00
100.00
120.00
140.00
160.00
2002 2003 2004 2005 2006
Year
Day
s
American EagleAbercrombie and FitchGap LimitedAeropostaleIndustry Average

- 59 -
The above graph represents the industry’s days supply of inventory as compared
to American Eagle’s. This graph shows very similar information compared to the
inventory turnover graph. Any decrease on the inventory turnover will produce an
increase on the days supply of inventory graph. This is because the two ratios are
inversely related. The industry line seems fairly stable with the exception of 2005. The
2005 ratio resulted from the massive increase in days supply of inventory for
Abercrombie and Fitch. The large increase in inventory levels for 2005 caused
inventory turnover to fall and days supply of inventory to rise sharply. The other firms
all had more stable lines, which resulted from correlative changes in cost of goods sold
and inventory levels. Increasing days supply number, as seen in the industry and
American Eagle ratios, could be considered unfavorable because it is taking longer for
each of the firms to turnover an amount of inventory into sales.
WORKING CAPITAL TURNOVER
Working capital turnover divides sales by working capital. Working capital is
determined by subtracting current liabilities from current assets. It represents the
amount of current assets that are not tied up in current liabilities. Working capital is
used to purchase inventory and make both short and long term investments. This ratio
measures the amount of working capital used to create the sales numbers for that fiscal
year. An increase in working capital turnover is usually considered favorable because it
implies that the same amount of working capital produces a greater amount of sales.
An increase is only considered favorable when the increase is caused by increasing
sales or decreased current assets. An increase is considered unfavorable when the
increase is because of increased current liabilities because that implies that the
increases in sales are due to an increase in debt.
American Eagle’s working capital turnover fell from 2002 to 2005. This steady
decrease is a result of current assets increasing at a higher rate than sales or current
liabilities. It implies that higher amounts of working capital are necessary to produce
an increase in sales.

- 60 -
The industry’s working capital turnover, as represented above, fluctuates
throughout the five years. Limited and Abercrombie and Fitch see very similar
fluctuations. They both have increasing sales and current liabilities for the five years.
They also have increasing current assets which fall during 2004 then continue to rise
again. These falls in current assets cause their ratios to jump up in 2004.
Aeropostale’s ratio seems stable due steadily increasing sales, current assets, and
current liabilities. Gap’s working capital turnover gradually increases for the five years
due to slightly fluctuating current assets, current liabilities, and sales numbers.
Working Capital Turnover
0.00
2.00
4.00
6.00
8.00
10.00
12.00
2002 2003 2004 2005 2006
Year
Wor
king
Cap
ital T
urno
ver
American Eagle
Abercrombie and Fitch
Gap
LimitedAeropostale
Industry Average

- 61 -
Liquidity Ratios 2002 2003 2004 2005 2006 Outcome Current Ratio 3.02 2.52 3.06 2.99 2.60 Favorable Quick Asset Ratio 1.80 1.73 2.18 2.16 1.85 Favorable Accounts Receivable Turnover 101.70 62.90 71.17 79.23 107.29 Neutral Inventory Turnover 6.75 7.35 5.88 5.86 3.40 Neutral Days Supply of Inventory 54.06 49.68 62.05 62.25 5.51 Neutral Days Supply of Receivables 3.59 5.80 5.13 4.61 66.24 Neutral Working Capital Turnover 4.83 4.46 3.23 3.21 3.79 Unfavorable
In conclusion, show that American Eagle’s liquidity seems above average
compared to the industry. Most of the liquidity ratios remain consistent over the
previous five years and follow similar trends of the industry. The current and quick
asset ratios appear favorable because American Eagle has a better ability to pay off
current liabilities than the rest of the industry. American Eagle’s working capital
turnover seems unfavorable compared to the industry because it turns over its working
capital fewer times a year that the industry average. Because the other liquidity ratios
appear in good standing, American Eagle’s overall liquidity is favorable.
Profitability Ratios
GROSS PROFIT MARGIN
The gross profit margin ratio is one of six ratios that indicate if a company is
profitable and is calculated by dividing gross profits by sales. It shows a company’s
ability to pay off debts and the ability to invest in future company growth. The gross
profit margin is a measurement of sales that shows the remaining net sales is left to
cover all selling, general, and administrative expenses, as well as, interest and tax
expenses. A steadily increasing gross profit margin is favorable because it is a sign of
stability within a company and a decreasing cost of goods sold.

- 62 -
As the chart indicates, American Eagle has a gross profit margin that is fairly
consistent with the industry average. The margin for years 2002-2003 remains around
40% with very little deviation while the industry average hovers around 37%. From
2003 to 2004 American Eagle’s gross profit margin jumps to 46% due to increased
efficiency in inventory procedure in 2003. The industry standard rises in 2005 to
decrease the gap. American Eagle is a frontrunner in the industry in terms of gross
profit margin.
Compared to the industry, Abercrombie and Fitch is a major outlier in 2005 and
2006. It is experiencing a gross profit margin that exceeds the industry average by
20%, which could be explained by a higher markup on its inventory relative to the
industry. On average, the companies that charge more for their items have a higher
Gross Profit Margin
0.00%
10.00%
20.00%
30.00%
40.00%
50.00%
60.00%
70.00%
2002 2003 2004 2005 2006
Year
Gro
ss P
rofit
Mar
gin American EagleAbercrombie and FitchGap LimitedAeropostaleIndustry Average

- 63 -
gross profit margin in this specialty retail industry. The graph illustrates that customers
are willing to pay a premium price for American Eagle and Abercrombie and Fitch
products, because they are both above the industry average. This graph also shows
that American Eagle and Abercrombie and Fitch could be considered two of the more
efficient companies in the industry because they have the highest profit margins.
OPERATING PROFIT MARGIN
Operating profit margin is obtained by dividing a company’s operating income by
its net sales. Operating income is a company’s gross profits minus any selling expenses
such as salaries, advertising, shipping; and any administrative expenses incurred.
Operating profit margin is the percentage of net sales remaining to pay interest, debt,
and tax expenses. Also, any gains or losses that are not incurred during the operating
activities are added to or subtracted from each sales dollar on a percentage basis. The
residual amount is the net profit margin. A high operating profit margin is favorable
because this means that a company has an adequate amount of sales income to cover
its interest and taxes.
American Eagle’s operating profit margin is consistent over time with its gross
profit margin. On average, American Eagle spends 26.5-27.7% of its net sales dollars
on operating related expenses. From 2004 to 2006, American Eagle had the highest
operating profit margins of the industry.

- 64 -
The industry average remains stable. With the exception of American Eagle in
2004 and Gap in 2003, the companies’ operating profit margins only vary by a few
percentage points. The jump by both Gap and American Eagle represent changes in
policies made in order to become more efficient. Abercrombie and Fitch is the industry
leader and maintains a 20% operating profit margin.
NET PROFIT MARGIN
Net profit margin is calculated by dividing net income by revenue. It is a
profitability measure that shows the percentage of net profit that is gained relative to
each dollar gained in sales. A higher net profit margin would definitely be considered
favorable and it would indicate an industry that is less competitive, attracting other
firms that are seeking profits to join the industry.
Operating Profit Margin
0.00%
5.00%
10.00%
15.00%
20.00%
25.00%
2002 2003 2004 2005 2006
Year
Ope
ratin
g P
rofit
Mar
gin
American EagleAbercrombie and FitchGap LimitedAeropostaleIndustry Average

- 65 -
American Eagle’s profit margin slumped from 2002 to 2003 and experienced an
industry low 4 percent net profit margin. In 2003, American Eagle became more
efficient in purchasing inventory. It was able to reduce markdowns thus increasing its
profit margin. Between the years 2003 and 2005, American Eagle showed a 325%
profit margin increase, becoming the new industry leader.
Net Profit Margin
0.00%
2.00%
4.00%
6.00%
8.00%
10.00%
12.00%
14.00%
16.00%
2002 2003 2004 2005 2006
Year
Net P
rofit
Mar
gin American Eagle
Abercrombie and FitchGap LimitedAeropostaleIndustry Average
Abercrombie and Fitch has been the most profitable company over the last five
year period, averaging a profit margin around 12 percent. American Eagle has recently
established itself among the industry’s more profitable companies. Customers are
willing to pay a premium for this company’s items because it has been able to
distinguish itself from other companies within the industry. American Eagle has done so
by maintaining positive brand recognition and by developing clothes that appeal to its
target customer base.

- 66 -
ASSET TURNOVER
Asset turnover is a measure of sales to assets. This ratio is useful because it
shows the amount of sales generated for every dollars worth of total assets. The asset
turnover reveals how a firm uses its assets to generate sales. A company might have a
higher asset turnover if its products are sold at a higher profit margin. The asset
turnover is lower if the company sells less costly products or with a lesser profit margin.
Therefore, it is better for a company to have a higher asset turnover.
American Eagle’s asset turnover has been slowly decreasing which means it is
less efficiently using its assets to generate sales. From 2002-2004 their assets
increased by a higher amount than sales, thus causing the ratio to get smaller each
year. This decrease was bad for American Eagle because it shows that their assets are
not generating as much sales as the year before. In 2005, asset turnover began to
increase slightly because of a larger increase in sales of $428,130,000 and a lesser
increase in total assets of $276,723,000.

- 67 -
Asset Turnover
0.00
0.50
1.00
1.50
2.00
2.50
3.00
2002 2003 2004 2005 2006
Year
Ass
et T
urno
ver American Eagle
Abercrombie and FitchGap LimitedAeropostaleIndustry Average
The graph above shows American Eagle had the highest asset turnover in the
industry during 2002 with the exception of Aeropostale, and it steadily decreased to
become the lowest of the specialty retail industry in 2006. Abercrombie and Fitch had a
similar decrease in asset turnover in 2003 but has stabilized around a ratio of 1.48.
Gap’s asset turnover has increased and improved since 2002 and is similar to the
industry average. Limited’s asset turnover ratio increased in 2004 because its assets
decreased by a higher amount than its net sales, but has since decreased. The industry
average has either increased or stayed the same over the past four years. This is partly
because Aeropostale’s asset turnover is still slightly increasing and it is already so much
higher than all the other firms in the industry. It is so high that it inflates industry
average to higher than the four other companies during 2004.

- 68 -
RETURN ON ASSETS
Return on assets is another profitability measurement that is similar to asset
turnover except it measures net income instead of revenues to total assets. Also called
return on investment, it shows how effective a company is at using its assets to
generate profit. Companies want to have a higher return on assets because a higher
ratio means the company is more profitable. A lower percentage would indicate that
their total assets are generating less net income which is less desirable.
American Eagle’s return on assets was above the industry average three out of
the past five years. From 2002-2003, American Eagle’s net income dwindled down and
then in 2004 it bounced back to higher than the ratio in 2002. The main reason for its
return on asset increase was because its net income was high in 2004 and 2005. This
was a beneficial aspect of the company because net income increase by a larger
amount than assets. If assets had been the factor to decrease this would have also
been a good situation for the company because this would mean that the company is
still making the same net income with a smaller amount of assets and therefore yielding
a higher return.

- 69 -
Compared to the industry, American Eagle is about average to above average
with regards to return on assets. In 2004, American Eagle’s net income rose, but this
wasn’t an industry trend since none of the other companies had great increases in net
income. American Eagle’s return is not stable, and this is because of large fluctuations
in net income. Abercrombie and Fitch, Aeropostale, and American Eagle are similar
because they are the companies in the industry that have had rising net incomes the
past two years. Gap and Limited’s net income have both had a slight decrease within
the past two years and this contributes to why their returns are less than the rest of the
competitors. Both of their ROA’s became fairly stable well below the industry average
in 2005. As of 2006, American Eagle was generating a better return on assets than all
the other competitors which looks appealing to analysts.
Return on Assets
0.00%
5.00%
10.00%
15.00%
20.00%
25.00%
30.00%
2002 2003 2004 2005 2006
Year
Ret
urn
on A
sset
s American EagleAbercrombie and FitchGap LimitedAeropostaleIndustry Average

- 70 -
RETURN ON EQUITY
The return on equity is calculated by taking net income as a percentage of
shareholder’s equity. This shows how profitable a company is at using shareholder’s
invested money. Overall, the ratio measures how much profit a company generates per
dollar that a shareholder invests. When analyzing this ratio, a higher percentage will
mean a company has a greater profitability, and a lower number indicates the company
has a smaller profitability.
American Eagle’s return on equity has varied greatly in the past five years, and it
has only been above the industry average two out of the past five years. From 2003
to 2004 the return on equity noticeably increased from 10.3% to 33.5%. This can be
attributed to the large increase of $445,805,000 in net sales which increased net
income by $153,721,000 from 2003 to 2004. Stockholders’ equity has increased for the
past five years, and in 2004 it also had a larger than average growth. This growth was
less than the increase in net income, and therefore, increased American Eagle’s return
on equity. American Eagle had declining net income values from 2002-2003, but its net
income has grown since 2003. American Eagle’s most recent return on equity for 2006
was 33.52%, which was above-average for that year. The return on equity has not
been stable, and this can be recognized by the widely varying values in net income
relative to the stockholders’ equity.

- 71 -
The graph above shows, the industry’s average return on equity has increased
four of the past five years. Abercrombie and Fitch stands out in the industry as having
the highest return on equity the past two years. Gap’s ROE steadily decreased since
2003, and in 2005 and 2006 they recorded the lowest ROE in the industry. Limited’s
ROE had decreased from 2002 to 2004, but in 2005 it increased greatly because of
higher shareholders’ equity. Aeropostale’s ROE decreased from 2004 to 2005 because
of decreasing net income and a large increase in shareholders’ equity. By observing the
graph, each of the companies does not have a very stable ROE.
Return on Equity
0.00%
10.00%
20.00%
30.00%
40.00%
50.00%
60.00%
2002 2003 2004 2005 2006
Year
Ret
urn
on E
quity
American EagleAbercrombie and FitchGap LimitedAeropostaleIndustry Average

- 72 -
Profitability Ratios 2002 2003 2004 2005 2006 Outcome Gross Profit Margin 39.12% 38.28% 46.66% 46.50% 47.97% Positive Operating Profit Margin 11.49% 9.28% 19.28% 19.97% 21% Positive Net Profit Margin 6.37% 4.15% 11.34% 12.74% 13.86% Positive Asset Turnover 1.87 1.66 1.42 1.44 1.41 Negative Return on Assets 13.10% 8.04% 24.66% 22.13% 24.12% Neutral Return on Equity 17.55% 10.32% 33.47% 30.53% 33.52% No Trend
Generally, American Eagle’s profitability ratios are high relative to the industry
average and therefore the company produces high profits. Percentage-wise, the
company yields the highest net income relative to net sales (net profit margin).
However, these high profits fail to yield substantial returns on assets and equity. Return
on equity has increased in recent years while fluctuating around the industry average.
Because the profitability ratios suggest strong profits in the future, we forecasted the
company to yield high profits in the future.
Capital Structure Ratios
DEBT TO EQUITY RATIO
The debt to equity ratio can be used to help analyze a firm’s capital structure.
This ratio directly compares total liabilities to total equity. This ratio illustrates if a firm
is more heavily financed by debt or equity in order to invest in long term assets many
firms prefer to be financed by both debt and equity. A debt to equity ratio of less than
one is considered advantageous because the firm would not miss debt payments as a
result of low returns. A higher debt to equity ratio might be considered advantageous
because a firm will deduct more interest from the taxable earnings, thus saving money.
A ratio that is too high or too low would be a problem for debt repayment reasons or
increased taxable income reasons.
American Eagle has experienced a fairly constant debt to equity ratio that
fluctuates around 40%. This would mean that American Eagle finances only $.40

- 73 -
through debt for every $1 of equity. The fluctuations could be explained by the
increases in both debt and equity for the five years, with the exception of a decrease in
debt for 2002. American Eagle decreases their risk of debt default by having such low
debt to equity ratios. The debt to equity ratios stable off during 2005 and 2006. This
stability is useful for forecasting purposes and determining the common-sized balance
sheet.
Debt to Equity
0.00
0.20
0.40
0.60
0.80
1.00
1.20
1.40
1.60
1.80
2002 2003 2004 2005 2006
Year
Debt
to E
quity
American EagleAbercrombie and FitchGap LimitedAeropostaleIndustry Average
Individual firms in this industry experienced a wide range in debt to equity ratios.
They combined to produce an industry line that is indicative of these ratios. The
industry line looks similar to the American Eagle line except that it is about .5 higher in
the most recent years. Gap’s ratio plummeted after 2002 because liabilities fell as
equity increase. The firm became more equity financed. Limited’s ratios fluctuated
greatly because liabilities increased for the five years as equity increased until 2003
then fell until 2005. Abercrombie and Fitch’s debt to equity ratios would have gradually

- 74 -
increased for the five years except a spike occurred in 2004. This spike occurred
because equity fell sharply during that period. All other periods saw gradual increases
in both debt and equity. Aeropostale experienced a stable line due to similar yearly
increases in both debt and equity.
TIMES INTEREST EARNED
The times interest earned ratio compares operating income levels to interest
expense. This ratio also measures capital structure. A fall in this ratio is considered
unfavorable because it implies a firm is producing less operating income while paying
the same level of interest from debt obligations.
American Eagle experienced stable ratios until 2004 when the ratio jumped to
three times the previous year. This jump was caused by a large increase in operating
income. This was an exception to the other years when both operating income and
interest expense were only slightly increasing. The enormous jump means that the firm
is producing about three times more operating income from about the same amount of
interest expense. American Eagle did not to disclose an interest expense amount for the
2005 fiscal year.

- 75 -
Times Interest Earned
0.00
100.00
200.00
300.00
400.00
500.00
600.00
700.00
800.00
900.00
1000.00
2002 2003 2004 2005 2006
Year
Tim
es In
tere
st E
arne
d
American EagleAbercrombie and FitchGap LimitedAeropostaleIndustry Average
The industry line would be steadily increasing if not for the exceptionally high
times interest earned ratio for Aeropostale during 2003. This unusually high ratio came
during the first year of being a publicly traded company. The interest expense number
was very low compared to the increasing operating income. They see very similar and
stable ratio lines. Limited and Gap both had correlated increases and decreases in
interest expense and operating income. Abercrombie and Fitch saw a slightly fluctuating
line because of rising operating income levels that combined with a falling interest
expense until 2003, and then a rising expense until 2005.
Capital Structure Ratios 2002 2003 2004 2005 2006 Outcome Debt to Equity Ratio 0.28 0.46 0.38 0.39 0.40 Neutral Times Interest Earned 83.12 90.59 309.78 n/a 33109.79 UnfavorableDebt Service Margin 31.97 44.54 n/a n/a n/a Neutral

- 76 -
Overall American Eagle’s capital structure ratios are low. In the case of the debt
to equity ratio, the company finances most of its activities through equity and therefore
has a much lower ratio compared to the company. American Eagle held steady with the
industry prior to 2003 for times interest earned, but through altering accounting policies
the ratio shot escaladed in 2004. The final trend is unknown because interest was not
reported in 2005 and the 2006 number is inflated due to the extremely low interest
expense. American Eagle has not disclosed current debt service for the past three
years. These ratios reveal that American Eagle relies on equity to finance a large
percentage of its long term assets. We believe that the debt to equity ratio should be
more consistent with the industry average.
Internal Growth Rate and Sustainable Growth Rate
Sustainable and Internal Growth Rate 2002 2003 2004 2005 2006 SGR 16.77% 11.74% 32.89% 35.17% 39.13% IGR 13.10% 8.04% 23.83% 25.30% 27.95%
The internal growth rate measures a company’s ability to grow based on internal
financing. This rate is derived by calculating only the retained earnings portion of
return on assets. This is because retained earnings are put back into the company for
future growth. The retained earnings portion is calculated by subtracting the dividends
payout ratio from one, because earnings can only go towards either the company or
dividends. The retained earnings portion is then multiplied by return on assets. Return
on assets measures a firm’s ability to produce a level of earnings as compared to the
correlating asset level. From 2002 to 2003 American Eagle’s internal growth rate was
equal to the return on assets because they did not pay out any dividends in this time
period. The internal growth rate fell during this period because assets increased faster
than net income. Such a decrease would make American Eagle seem increasingly
inefficient. They began to distribute dividends but continued to retain 96% of net
income. Therefore, the large rise in internal growth rate was due to a substantial

- 77 -
increase in net income. Then in 2005, the dividend payout ratio increased to about
14%, all else being equal this would reduce the internal growth rate. However, a
reduction in the increase of net income also contributed to its decline during 2005.
Internal Growth Rate (AEO)
0.00%
5.00%
10.00%
15.00%
20.00%
25.00%
30.00%
2002 2003 2004 2005 2006
Year
Inte
rnal
Gro
wth
Rat
e
Sustainable growth rate is derived from internal growth rate. It does not
measure the current rate but instead the growth rate that could possibly be sustained if
the company’s future financial situation would continue at its present situation. In
sustainable growth rate the variable is the debt to equity ratio. A company’s SGR is
higher if the debt to equity ratio is higher. This is because a company that is more
financially leveraged is considered more stable than a less leveraged company. The
reason American Eagle’s SGR and IGR look similar is because the variable (debt to
equity) proved to be stable over the five year period. The SGR would merely be the
IGR multiplied by one plus the debt to equity ratio which stayed around 40%.

- 78 -
Sustainable Growth Rate (AEO)
0.00%
5.00%
10.00%
15.00%
20.00%
25.00%
30.00%
35.00%
40.00%
45.00%
2002 2003 2004 2005 2006
Year
Sust
aina
ble
Gro
wth
Rat
e
STORE OPENINGS
Net Store Openings 2002 2003 2004 2005 2006 Net Store Openings 75 52 41 23 42
As shown by the table, net store openings are decreasing. American Eagle’s net
income continues to grow even though fewer stores are opening. They are still liquid
and profitable as well as a leading competitor in the industry even with slowed store
growth. American Eagle is stabilizing and therefore rapid growth is not needed to stay
competitive in the specialty retail industry.

- 79 -
FORECASTING
Analysts use forecasting to allow investors a greater understanding of the
company’s future. By forecasting, the investor can see where a company is potentially
headed. Some of the trends seen in the past cannot be sustained, so although
forecasting serves as a futuristic benchmark, it is not always reliable. We forecasted
the balance sheet, income statement, and the statement of cash flows for the next ten
years. When forecasting, we started by making common size financial statements and
looked for structural trends. After finding these trends, we were then able to make
assumptions about what would happen in the future.
BALANCE SHEET
When forecasting the balance sheet, the first step is to create a common size
balance sheet for several previous years. This is done by comparing the line items to
the total assets or total liabilities and stockholders equity. American Eagle changed
accounting policies and management’s direction in 2003. This led to a more mature
company in the following years. Because 2004 to 2006 numbers were so stable we
concluded a trend would build in following years. We initially forecasted total assets as
the foundation for the subsequent ten years. In 2005 the asset turnover ratio was
1.44, and we decided that this ratio would grow about 1% per year toward 1.54, which
is the standard among mature industry companies. Based upon the common sized
balance sheet, we determined certain items remained more or less constant percentage
of the total assets. Because of fluctuating figures, long-term assets were deemed not
forecastable. We concluded since total liabilities and stockholders equity must equal
total assets that the forecast values must reach a harmonious balance. Because of the
inconsistent nature of American Eagle’s liabilities, we found only the subtotals to be
forecastable as a fraction of total liabilities and stockholders equity.

- 80 -
Forecasting the balance sheet is important because it details the major
investments and expenditures that allow the company to function. Our forecast tells us
American Eagle is in a position where they can expect to see continued growth.
American Eagle’s future growth should attract investors today and in the future. Below
is the forecasted Balance Sheet.

81
2002 2003 2004 2005 2006 Assume 2007 2008 2009 2010 2011 2012 2013 2014 2015 2016 Current assets:
Cash and cash equivalents
194,526 137,087
219,372 130,529 59,737 Short-term investments
47,047 200,725
370,235 620,989 767,376 Merchandise inventory
124,708 120,586
170,576 210,739 263,644 13% 285,608 325,593 371,176 423,141 482,380 549,914 626,901 714,668 814,721 928,782 Accounts and note receivable, including related party 13,598
24,129 26,432 29,146 26,045
Prepaid expenses and other 32,153
27,589 25,856 30,110 33,720
Deferred income taxes 15,846
20,584 39,313 46,976 33,720
Assets held-for-sale --- --- 13,581 12,183 47,732
Total current Assets 427,878 530,700 865,365 1,080,672 1,198,254 62% 1,362,130 1,552,828 1,770,224 2,018,055 2,300,583 2,622,665 2,989,838 3,408,415 3,885,593 4,429,576 Property and equipment, at cost, net of accumulated depreciation and amortization 267,479 340,955 339,833 345,518 481,645 Goodwill, net of accumulated amortization 23,614
10,136 9,950 9,950 9,950
Long-term investments
24,357 84,416 145,774 251,644
Other assets, net of accumulated amortization 22,368 26,266 29,362 23,735 45,991 Non-current Assets:
313,461 401,714 463,561 524,977 789,230 834,854 951,733 1,084,976 1,236,873 1,410,035 1,607,440 1,832,481 2,089,029 2,381,493 2,714,902 Total assets
741,339 932,414 1,328,926 1,605,649 1,987,484 1.45 2,196,984 2,504,561 2,855,200 3,254,928 3,710,618 4,230,104 4,822,319 5,497,444 6,267,086 7,144,478 growth %
Current liabilities:
Accounts payable
50,608 71,330
108,929 139,197 171,150 Current portion of note payable
4,225 4,832
Accrued compensation and payroll taxes 13,001
14,409 36,008 58,186 58,371
Accrued rent 28,476
30,985 45,089 52,506 57,543
Accrued income and other taxes 12,655
28,669 33,926 43,273 87,780
Unredeemed stored value cards and gift certificates 22,837
25,785 32,724 43,045 54,554
Current portion of deferred lease credits --- 10,261 9,798 10,406 12,803 Other liabilities and accrued expenses 9,784
13,025 16,152 15,010 18,263
Total current liabilities 141,586 208,979 282,626 361,623 460,464 21.5% 472,351 538,481 613,868 699,810 797,783 909,472 1,036,799 1,181,950 1,347,423 1,536,063
Non-current liabilities:
Note payable 16,356
13,874 --- ---
Deferred lease credits --- 53,936 57,758 60,087 65,114
Other non-current liabilities 5,915
18,492 25,056 28,387 44,594
Total non-current liabilities 22,271 86,058 82,814 88,474 109,708 5.5% 120,834 137,751 157,036 179,021 204,084 232,656 265,228 302,359 344,690 392,946
Total Liabilities 163,857 295,037 365,440 450,097 570,172 27% 593,186 676,232 770,904 878,831 1,001,867 1,142,128 1,302,026 1,484,310 1,692,113 1,929,009
Stockholders’ equity 577,482 637,377 963,486 1,155,552 1,417,312 76% 1,669,708 1,903,467 2,169,952 2,473,745 2,820,070 3,214,879 3,664,962 4,178,057 4,762,985 5,429,803
Total liabilities and stockholders’ equity 741,339 932,414 1,328,926 1,605,649 1,987,484 100% 2,196,984 2,504,561 2,855,200 3,254,928 3,710,618 4,230,104 4,822,319 5,497,444 6,267,086 7,144,478

- 82 -
Common Sized Balance Sheet
2002 2003 2004 2005 2006 Current assets:
Cash and cash equivalents
26.24% 14.70% 16.51% 8.13% 3.01% Short-term investments
6.35% 21.53% 27.86% 38.68% 38.61% ` Merchandise inventory
16.82% 12.93% 12.84% 13.12% 13.27% 13% Accounts and note receivable, including related party 1.83% 2.59% 1.99% 1.82% 1.31% Prepaid expenses and other
4.34% 2.96% 1.95% 1.88% 1.70% Deferred income taxes
2.14% 2.21% 2.96% 2.93% 1.70% Assets held-for-sale
--- --- 1.02% 0.76% 2.40%
Total current Assets 57.72% 56.92% 65.12% 67.30% 60.29% 61.47% Property and equipment, at cost, net of accumulated depreciation and amortization 36.08% 36.57% 25.57% 21.52% 30.00% Goodwill, net of accumulated amortization 3.19% 1.09% 0.75% 0.62% 0.62% Long-term investments
0.00% 2.61% 6.35% 9.08% 15.67% Other assets, net of accumulated amortization 3.02% 2.82% 2.21% 1.48% 2.86% Total assets
100% 100% 100% 100% 100%
Current liabilities:
Accounts payable
6.83% 7.65% 8.20% 8.67% 10.66% Current portion of note payable
0.57% 0.52% 0.00% 0.00% 0.00% Accrued compensation and payroll taxes 1.75% 1.55% 2.71% 3.62% 3.64% Accrued rent
3.84% 3.32% 3.39% 3.27% 3.58% Accrued income and other taxes
1.71% 3.07% 2.55% 2.70% 5.47% Unredeemed stored value cards and gift certificates 3.08% 2.77% 2.46% 2.68% 3.40% Current portion of deferred lease credits --- 1.10% 0.74% 0.65% 0.80% Other liabilities and accrued expenses 1.32% 1.40% 1.22% 0.93% 1.14% Total current liabilities
19.10% 22.41% 21.27% 22.52% 28.68% Non-current liabilities:
0.00% 0.00% 0.00% 0.00% 0.00% Note payable
2.21% 1.49% --- --- --- Deferred lease credits
--- 5.78% 4.35% 3.74% 4.06% Other non-current liabilities
0.80% 1.98% 1.89% 1.77% 2.78% Total non-current liabilities
3.00% 9.23% 6.23% 5.51% 6.83% 6.16% Total Liabilities
22.10% 31.64% 27.50% 28.03% 35.51% 28.96% Stockholders’ equity
77.90% 68.36% 72.50% 71.97% 88.27% 76% Total liabilities and stockholders’ equity 100.00% 100.00% 100.00% 100.00% 100.00%

83
INCOME STATEMENT
As with forecasting the balance sheet, the first step for forecasting the income
statement is to make a common size income statement. When making a common sized
income statement, we stated all items as a percentage of net sales. The sales growth
percentage presented problems because American Eagle saw phenomenal growth in
2004. The company most likely saw this growth because in 2003 it restructured its
business strategy from a mediocre or average performance to a strategy based on
efficiency and optimal pricing techniques. These techniques mostly focused on
minimizing mark downs and selling a greater majority of the inventory at the retail price
(AEO 10-K). We forecasted that the sales growth rate will stabilize at a more plausible
rate of about 14% which mirrors the industry average.
When we forecasted cost of goods sold, we initially considered the average of
the previous five years at 58%. Upon further examination, we realized we needed to
consider the restructuring managerial moves in 2003. The company significantly
decreased its cost of goods sold expenses because previous proceeds from markdown
merchandise were recorded in the cost of goods sold expenses. Additionally, because
the company streamlined its operating processes; needless and excessive costs were
minimized. Therefore, we decided to forecast this critical line item based on the most
recent three years which were consistently reported at 52-54%. Selling, general and
administrative expenses appeared fairly consistent, hovering around 24% of net sales,
therefore we kept it as a constant percentage for the next ten forecasted years.
Depreciation and amortization expenses were also relatively constant at approximately
4% of net sales.
Operating income and net income acted similarly by jumping around from 2001-
2003 but began to stabilize after the accounting changes in 2003. In 2004 to 2006,
operating income has grown from 19% to 21%. We decided to project the company’s
operating income will stabilize around 20% and we don’t suspect it will drop below the

84
status quo since the company has already renovated its operating functions to become
as efficient as possible.
Net income was forecasted by comparing it to industry standards. Although the
industry does not produce a clear average increase in net income, most companies fall
between a 5% and 15% growth each year. Since American Eagle fell mostly in the
higher portion of the range during the last two years, we chose to grow net income at
13%. We feel this growth rate is sustainable because the rate falls consistent with the
rest of the industry.
Forecasting the income statement is essential because it projects the company’s
ability to produce profit. This means the forecasted income statement shows if a firm
will be able to hold on to its already acquired financial stability and then add to it. If the
company were to remain stagnate, it would be hard to attract shareholders or increase
the stock price. We project that American Eagle will continue to grow their net income
and therefore retained earnings.

85
2002 2003 2004 2005 2006 Assume 2007 2008 2009 2010 2011 2012 2013 2014 2015 2016 Net sales
1,382,923 1,435,436 1,889,645 2,321,962 2,794,409 0.14 growth 3,185,626 3,631,614 4,140,040 4,719,645 5,380,396 6,133,651 6,992,362 7,971,293 9,087,274 10,359,493 Cost of sales, including certain buying, occupancy and warehousing expenses 841,968 885,939 1,008,459 1,244,213 1,453,980 54% 1,720,238 1,961,072 2,235,622 2,548,609 2,905,414 3,312,172 3,775,876 4,304,498 4,907,128 5,594,126 Gross profit
540,955 549,497 881,188 1,077,749 1,340,429 1,465,388 1,670,542 1,904,418 2,171,037 2,474,982 2,821,480 3,216,487 3,666,795 4,180,146 4,765,367 Selling, general and administrative expenses 328,733 356,261 450,777 540,332 665,606 24% 764,550 871,587 993,610 1,132,715 1,291,295 1,472,076 1,678,167 1,913,110 2,180,946 2,486,278 Depreciation and amortization expense
53,361 59,965 69,443 78,728 88,033 4% 127,425 145,265 165,602 188,786 215,216 245,346 279,694 318,852 363,491 414,380 Operating income
158,861 133,271 360,968 458,689 586,790 20% 637,125 726,323 828,008 943,929 1,076,079 1,226,730 1,398,472 1,594,259 1,817,455 2,071,899 Other income (expense), net
2,418 2,016 5,867 18,278 42,277 Income before income taxes
161,279 135,287 366,835 476,967 629,067 Provision for income taxes
61,635 52,179 142,603 183,256 241,708 Income from continuing operations
99,644 83,108 224,232 293,711 387,359 Loss from discontinued operations, net of income tax benefit
-11,536 -23,486 -10,889 442 Net income
88,108 59,622 213,343 294,153 387,359 13% 414,131 472,110 538,205 613,554 699,451 797,375 909,007 1,036,268 1,181,346 1,346,734
ACTUAL
Common sized Income Statement 2002 2003 2004 2005 2006 Assume
Sales Growth Percentage 4% 32% 23% 20% 20% Net sales
100% 100% 100% 100% 100% Cost of sales, including certain buying, occupancy and warehousing expenses 61% 62% 53% 54% 52% 53% Gross profit
39% 38% 47% 46% 48% 1.5 growth Selling, general and administrative expenses 24% 25% 24% 23% 24% 24% Depreciation and amortization expense
4% 4% 4% 3% 3% 4% Operating income
11% 9% 19% 20% 21% 20% Other income (expense), net
0% 0% 0% 1% 2% Income before income taxes
12% 9% 19% 21% 23% Provision for income taxes
12% 9% 19% 21% 23% Income from continuing operations
7% 6% 12% 13% 14% Loss from discontinued operations, net of income tax benefit
-1% -2% -1% 0% 0% Net income
6% 4% 11% 13% 14% 13%

86
CASH FLOWS
We initiated forecasting the statement of cash flows by seeking a definitive
relationship with the growth in cash flows from operations. We compared cash flows
from operations to net income, operating income, and net sales. Only net sales brought
steady results that we deemed forecastable at a steady ratio of 20% of net sales during
2004, 2005, and 2006. By forecasting out the cash flows from operations, we could
better understand what the line items would look at. Next we added in depreciation
and amortization at 4% of net sales because they are non cash expenses. Inventory
and accounts receivable are projected to increase by 13% and 2% respectively. As
these two accounts increase, the cash outflows amounts also increase; shrinking the
cash flows from operations. Accounts payable produces no obvious trend, other than it
is growing. This means American Eagle is able to hold on to the cash they owe, but it is
not forecastable since it is growing at an inconsistent rate. To forecast cash flows from
investing activities, we took total assets from the current year and subtracted them
from total assets from the previous year. Cash flows from financing were determined
not to be forecastable because they fluctuate so greatly. All of the line items fail to
reveal any consistent trend so that we can predict the changes in cash in these two
sections. Forecasting the statement of cash flows is important because it unveils
accounting policies so that an analyst can actually see how much physical revenue or
expenses have been realized.

87
Cash Flows Assume
2002 2003 2004 2005 2006 2007 2008 2009 2010 2011 2012 2013 2014 2015 2016 Operating activities:
Net income
88,108 59,622 213,343 294,153 3,873,598 13% 414,131 472,110 538,205 613,554 699,451 797,375 909,007 1,036,268 1,181,346 1,346,734 Loss from discontinued operations
11,536 23,486 10,889 (442) Income from continuing operations
99,644 83,108 224,232 293,711 387,359 Adjustments to reconcile net income to net cash provided by operating activities:
Depreciation and amortization
53,361 59,965 68,273 74,578 88,033 4% of sales 127,425 145,265 165,602 188,786 215,216 245,346 279,694 318,852 363,491 414,380
Stock compensation 853 1,192 25,166 19,620 36,556
Deferred income taxes 8,012 13,008 (17,087) 4,752 (27,615)
Investment expense 1,155
Tax benefit from share based payments 674 28,800 35,371 25,465
Loss on impairment of assets 1,399 1,185 Proceeds from sale of trading securities 183,968 Other adjustments
3,091 5,999 Changes in assets and liabilities:
Merchandise inventory
(34,516) 14,452 (44,540) (39,137) (53,527) 13% of
TA 37,129 42,327 48,253 55,008 62,709 71,489 81,497 92,907 105,914 120,742 Accounts and note receivable, including related party 4,941 (9,344) 3,878 4,638 2,778 2% of TA 43,940 50,091 57,104 65,099 74,212 84,602 96,446 109,949 125,342 142,890 Prepaid expenses and other
(8,495) 3,342 1,918 (3,642) (4,204) Accounts payable
12,752 13,353 23,166 29,366 32,345 Unredeemed stored value cards and gift certificates 5,226 2,725 7,373 10,137 11,623 Deferred lease credits
9,999 5,290 3,359 2,784 7,791 Accrued liabilities
(20,967) 21,437 41,349 43,374 78,237 Total adjustments
35,412 132,093 144,451 186,708 361,909 Net cash provided by operating activities
135,056 215,201 368,683 480,419 749,268 Sales*.2 637,125 726,323 828,008 943,929 1,076,079 1,226,730 1,398,472 1,594,259 1,817,455 2,071,899 Investing activities:
Capital expenditures
(78,787) (77,544) (97,288) (81,545) (225,939) Proceeds from Sale of Assets
12,345 Purchase of investments
(132,532) (397,506) (508,768) (1,187,556) (1,353,339) Sale of short-term investments
102,265 245,640 330,390 876,111 915,952 Other investing activities
(5,102) (1,513) (14) (74) (140) Net cash used for investing activities
(114,156) (230,923) (275,680) (393,064) 651,121 209,500 307,578 350,639 399,728 455,690 519,486 592,215 675,125 769,642 877,392 Financing activities:
Principal payments on note payable
(9,555) (5,434) (2,655) (745) (3,020)

- 88 -
Proceeds from issuance of note payable 2,025
Retirement of note payable and termination of swap agreement — — (16,915) — Proceeds from borrowings from line of credit 4,777 Repurchase of common stock
(19,476) Repurchase of common stock as part of publicly announced programs (550) — (161,008) (146,485) Repurchase of common stock from employees (139) — (10,487) (7,635) Cash paid for three-for-two stock split
(113) Net proceeds from stock options exercised
1,840 1,139 57,533 48,198 25,447 Excess Tax benefit from share-based payments 19,541
Payment of cash dividend — — (8,841) (42,058) 61,521 Net cash provided by financing activities
(22,414) (4,984) 29,122 (166,100) (168,761) Not Forecastable
Effect of exchange rates on cash 275 1,055 1,903 4,680 (178)
Net cash provided by (used for) discontinued operations (12,938) (11,618) 9,448 (14,778) Net increase in cash and cash equivalents
(14,177) (31,269) 133,476 (88,843) (70,792) Cash and cash equivalents—beginning of period 180,398 117,165 85,896 219,372 130,529 Cash and cash equivalents—end of period
166,221 85,896 219,372 130,529 59,737

89
Limitations
Forecasting serves as a great tool for determining how a company may perform
in the future, but only if it is recognized as a series of assumptions and not solid truths.
We founded the forecasted numbers using our logical rationale based on the
information provided in the company annual reports, and therefore the forecasts are
limited to an extent to the disclosure level. .
Forecasting is also limited because it is impossible to predict future economic
recessions, natural disasters, government regulations, or anything that may negatively
affect the growth of a company's sales or assets base with any certainty. Therefore
when forecasting American Eagle, we cannot begin to guess how current market
conditions will affect the overall numbers. Our assumptions are based upon how the
company currently functions (quantitatively and qualitatively) while considering its past.
In 2003, American Eagle Outfitters changed a wide array of managerial policies,
including refocusing the brand to the targeted audience, "improving productivity, and
strengthen[ing] operating disciplines" (AE 10-K 2003). In order to remain consistent,
the company restated the previous financial statements but the changes resulted in a
more mature company with a different strategy for growth and profits. Therefore,
American Eagle prior to 2003 is a vastly different, less mature company than American
Eagle after 2003. This affected forecasting substantially. It would be erroneous to
average in 2001-2003 when searching for recent trends because they are so greatly
different than the 2004-2006 numbers. This means we could only consider the three
most recently reported years when forecasting. Although these three years appear fairly
consistent through the major forecastable items, it would be better to have more years
to strength any observed trend.
Regression Analysis
As can be seen below, our Beta is not correct. When we ran the regressions for
all the time periods, we faced the difficulty of having negative beta and negative

- 90 -
adjusted R2. We chose the 10 year model because there is a positive explanatory
power, and it is the largest explanatory power observed in our models. American Eagle
switched from the NASDQ to the NYSE, which complicated finding stock prices, and we
had to depend on Wharton Research Data Services to provide the CRSP monthly
cumulative dividend returns for the last several years.
Beta R2 Ke
72 months -0.797825728 2.99% 1.89%
60 months -0.358393843 -0.70% 3.60%
48 months -1.494008959 8.25% -0.82%
36 months -0.745603569 -0.38% 2.10%
24 months -0.520171081 -3.32% 2.97%
Rf = 5% 0.05
MRP = .03896 0.03896
WACC
To find a more reasonable cost of equity and weighted average cost of capital,
we worked backwards to derive the numbers we should use. First we found American
Eagle’s cost of debt. American Eagle disclosed that 2.2 million dollars of their debt had
an interest rate of 3.25%. That left almost 57 million dollars of debt with no disclosed
interest rate. American Eagle disclosed that they have an 8.25% lending rate. Because
they disclosed this number, the only reasonable assumption we could make was that all
of their outstanding debt had this interest rate. With these numbers and interest rates,
we were able to calculate our weighted average cost of debt. This number is
approximately 8.2%.
Yahoo Finance observed that on April 1, 2007 American Eagle’s book value per
share was $6.41 and their return on equity was 30.11%. The fifty two week average
stock price dating back from April 1, 2007 was $27.44. As earlier calculated the
approximate growth rate for American Eagle is 8%. With these numbers, we were able
to calculate the cost of equity to be approximately 13%. Once we had cost of debt and
cost of equity, American Eagle’s weighted average cost of capital became easy to

- 91 -
calculate. We found American Eagle has a weighed average cost of capital of
approximately 11%.
Because of operating leases, we decided to recalculate the cost of debt and
weighted average cost of capital for American Eagle to see what would change in our
valuations when we accounted for capitalized leases. Our cost of debt we calculated as
the cost of the operating leases with an 8% interest rate. The new cost of debt we
calculated was approximately 8.1%. An 8.1% cost of debt paired with the cost of
equity discussed above led to a new weighted average cost of capital. This number
was approximately 9%.
Valuation
After evaluating the industry, accounting methods, and financials to gain a better
understanding of the company, we can finally value the firm. Using different valuation
models allows investors to see if a company is overvalued, fairly valued, or undervalued
compared to the market stock price. The market value of equity is comprised of a
combination of company performance, shareholder expectations and influences on the
market, current accounting policies, etc. As analysts, we search for a more tangible
valuation method based upon the firm’s actual performance and tangible assets and
liabilities to determine a better understanding of the company’s worth.
We used the method of comparables, discounted dividends model, free cash
flows model, residual income model, and abnormal earnings growth model to derive a
comparable value of the firm. The residual income and abnormal earnings growth
models reflect the most accurate valuations because the information considered is more
relevant than information considered in the discounted dividends model which has a
built in limitation unlike the free cash flows, and is based on financial theory unlike the
method of comparables.

- 92 -
Method of Comparables Valuation Many valuation models exist to establish an estimate of a firm’s stock price. The
method of comparables valuation model is widely used because these valuations are
easy to perform and use historical values. Once historical prices are gathered, negative
numbers and outliers are excluded in order to make the valuations more accurate.
Different aspects of the financial statements are compared to price in order to find
which method is the most accurate compared to the market price per share. Each
method of comparable will derive the value of the analyzed firm by relating its specific
comparable to that of the industry average. However, these valuation models are
widely criticized because they do not incorporate the expected future value of a firm.
Many comparables valuation models could be used to derive a firm’s value.
Method of Comparables Models P/E (trailing) 33.74 Undervalued P/E (forecast) 32.25 Undervalued P/B 24.12 Overvalued Dividends/Price 18.09 Overvalued P.E.G. 27.24 Overvalued P/EBITDA 31.85 Undervalued P/(FCF per share) 16.27 Overvalued Enterprise Value/EBITDA 34.92 Undervalued
Above are the results of each method of comparables valuation model. Only two
were affected by the corrected capitalized lease information discussed earlier. Most of
the results seem to show fairly accurate price per share values as compared to the
current market price. Therefore, it would be up to the analyst to decide which method
of comparable model to use as a predictor to find market value.
P/E TRAILING
The price to earnings comparable is the most widely used multiple because many
analysts believe that price can be derived directly from earnings. The price to earnings
ratios of each company in the industry are used to find the industry average price to

- 93 -
earnings ratio. The industry’s price to earnings ratio is then multiplied by the earnings
per share of the firm being valued. This calculation will provide the analyst with a
comparable value for the specific firm.
Industry Firms PPS EPS P/E
Abercrombie and Fitch 75.68 4.78 15.83
Aeropostale 40.23 1.80 22.38
Gap 17.21 0.71 24.17
Limited 26.06 1.77 14.71
19.27 Industry Average P/E
1.75 EPS American Eagle
33.74 PPS AE
By applying this particular method, American Eagle has a value of $33.74. This
would mean that American Eagle is undervalued compared to its current price of
$29.99. In this model there were no apparent outliers because the industry price to
earnings ratios were similar.
P/E FORECAST
In addition to the trailing price to earnings model, many analysts use the price to
earnings forecast model. In this model, the forecasted earnings per share are used
instead of past earnings per share. Forecasted earnings per share are divided from the
price per share for each firm in the industry. The average of these per share values are
then multiplied by American Eagle’s forecasted earnings per share value, and this shows
American Eagle’s estimated price per share. The forecasted earnings per share
numbers were obtained through http://finance.yahoo.com.
Industry Firms PPS EPS (Yahoo) P/E Abercrombie and Fitch 75.68 5.24 14.44 Aeropostale 40.23 2.31 17.42 Gap 17.21 0.88 19.56 Limited 26.06 1.81 14.40 16.45 Industry Average P/E 1.96 EPS Est. AE 32.25 PPS AE

- 94 -
The P/E forecast model produced a price per share amount of $32.25 for
American Eagle. This implies that the current market price of $29.99 is undervalued.
Again, there were no existing outliers in this model.
P/B
In the price to book model the current market price of the firm is compared to
the book value price of the firm’s assets. The current price is divided by the book value
of assets for each firm in the industry. The average for the industry is multiplied by
American Eagle’s book value per share. This produces a price per share value of
American Eagle that is derived from its book value.
Industry Firms PPS BPS P/B Abercrombie and Fitch 75.68 25.46 2.97 Aeropostale 40.23 9.80 4.11 Gap 17.21 7.82 2.20 Limited 26.06 17.82 1.46 2.69 Industry Average P/B 8.98 BPS American Eagle 24.12 PPS AE
As shown by the table above, this model estimates American Eagle’s price per
share value to be $24.12 per share. This implies that the current market price of
$29.99 is overvalued. There were no apparent outliers in this model.
All of the firms in this industry choose not to capitalize their operating leases.
This will understate all of the firm’s true asset values. Perhaps, a more accurate price
to book model would consider how these capitalized leases would affect each firm’s
book value, as well as, the estimated price per share of American Eagle.

- 95 -
D/P
In the dividends to price model, the firm’s dividends per share are compared to
the current market price of the firms. Each of the industry’s dividends per share
amounts are divided by their current market price. These values are then averaged and
American Eagle’s dividends per share amount is divided by this number. This is another
way to estimate American Eagle’s price per share amount.
Industry Firms PPS DPS D/P Abercrombie and Fitch 75.68 0.60 0.01
40.23 0.00 0.00 *Outlier Gap 17.21 0.00 0.00 *Outlier Limited 26.06 0.60 0.02 0.02 Industry Average D/P 0.28 DPS American Eagle 18.09 PPS AE
By using this model, American Eagle’s price per share value is estimated to be
$18.09. Compared the current market price of $29.99, American Eagle is an overvalued
firm. In this model Aeropostale and Gap are both outliers because neither of them pay
dividends, therefore, these amounts will not be included the model.
P/E TO EARNINGS GROWTH (P.E.G.)
The P.E.G. model is similar to P/E model previously discussed. However, the P/E
ratios for each firm in the industry are divided by their respective earnings growth ratios
for the next year. Then an average P.E.G. is found and this is multiplied by the current
earnings per share value of American Eagle as well as its earnings growth rate. This
results in American Eagle’s estimated price per share value using his model.
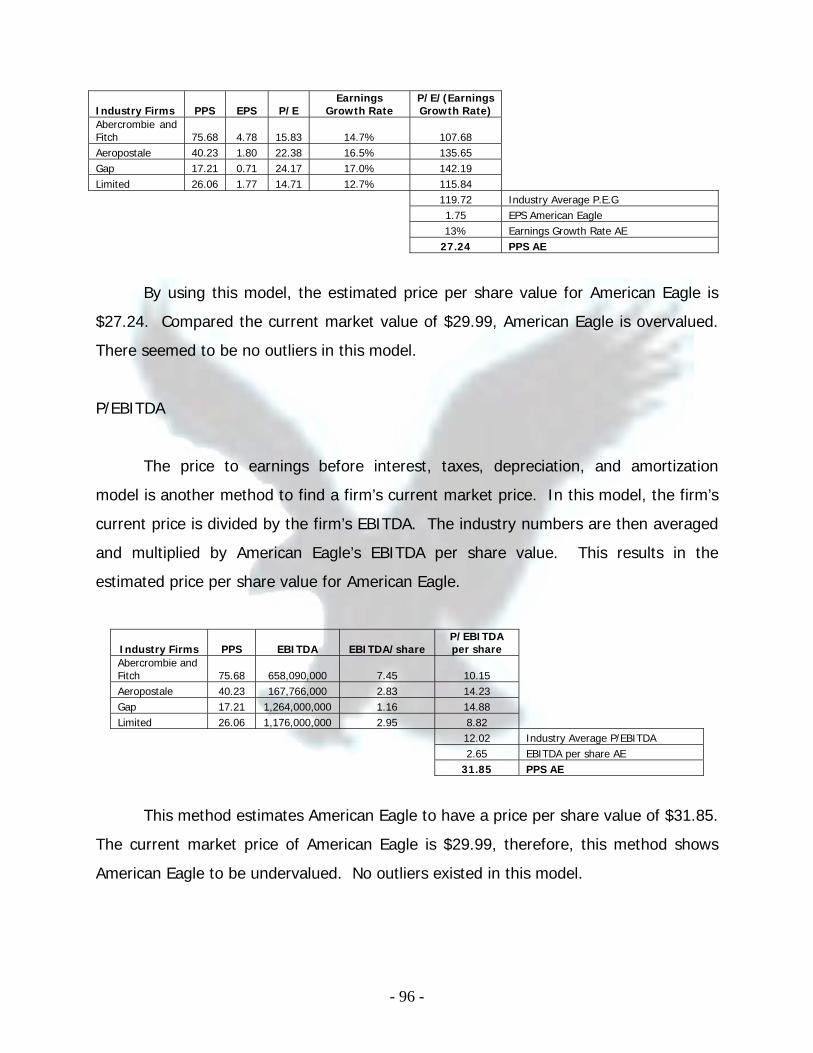
- 96 -
By using this model, the estimated price per share value for American Eagle is
$27.24. Compared the current market value of $29.99, American Eagle is overvalued.
There seemed to be no outliers in this model.
P/EBITDA
The price to earnings before interest, taxes, depreciation, and amortization
model is another method to find a firm’s current market price. In this model, the firm’s
current price is divided by the firm’s EBITDA. The industry numbers are then averaged
and multiplied by American Eagle’s EBITDA per share value. This results in the
estimated price per share value for American Eagle.
Industry Firms PPS EBITDA EBITDA/share P/EBITDA per share
Abercrombie and Fitch 75.68 658,090,000 7.45 10.15 Aeropostale 40.23 167,766,000 2.83 14.23 Gap 17.21 1,264,000,000 1.16 14.88 Limited 26.06 1,176,000,000 2.95 8.82 12.02 Industry Average P/EBITDA 2.65 EBITDA per share AE 31.85 PPS AE
This method estimates American Eagle to have a price per share value of $31.85.
The current market price of American Eagle is $29.99, therefore, this method shows
American Eagle to be undervalued. No outliers existed in this model.
Industry Firms PPS EPS P/E Earnings
Growth Rate P/E/(Earnings Growth Rate)
Abercrombie and Fitch 75.68 4.78 15.83 14.7% 107.68 Aeropostale 40.23 1.80 22.38 16.5% 135.65 Gap 17.21 0.71 24.17 17.0% 142.19 Limited 26.06 1.77 14.71 12.7% 115.84 119.72 Industry Average P.E.G 1.75 EPS American Eagle 13% Earnings Growth Rate AE 27.24 PPS AE

- 97 -
P/FREE CASH FLOWS
The price to free cash flows model compares the current market price of the
industry’s firms to their respective free cash flows per share. In this model, each of the
firm’s current market prices are divided by their free cash flows per share. These
numbers are then averaged and multiplied by American Eagle’s free cash flows per
share. This results in American Eagle’s estimated price per share.
Industry Firms PPS CFFO CFFI FCF
FCF per
share
P/FCF per
share Abercrombie and Fitch 75.68 582,171,000 -473,764,000 108,407,000 1.23 61.64 Aeropostale 40.23 177,445,000 -101,135,000 76,310,000 1.29 31.28 Gap 17.21 1,250,000,000 -150,000,000 1,100,000,000 1.01 17.10 Limited 26.06 600,000,000 -1,093,000,000 -493,000,000 -1.24 -21.04 *Outlier
36.67 Industry Average P/FCF per share
American Eagle 749,268,000 -651,121,000 98,147,000 0.44 FCF per share AE 16.27 PPS AE
By using this method, American Eagle’s price per share is estimated to be
$16.27. The current market price per share of American Eagle is $29.99, and would be
considered overvalued by using this model. Limited recorded a negative free cash flow;
therefore, they could be considered an outlier when computing the industry average.
ENTERPRISE VALUE/EBITDA
The enterprise value per EBITDA method compares the enterprise value of each
firm to its EBITDA. The enterprise value is found by adding the market value of equity
and the book value of liabilities, and then subtracting cash and cash equivalents.
Market value of equity is found by multiplying price per share by number of shares
outstanding. The enterprise value for each firm in the industry is then divided by its
EBITDA. The average of these numbers is multiplied by American Eagles EBITDA to
produce American Eagles estimated enterprise value. American Eagle’s book value of

- 98 -
liabilities is subtracted and American Eagle’s cash and cash equivalents are added to its
estimated enterprise value to produce its estimated market value of equity. Finally,
American Eagle’s Market value of equity is divided by its number of shares outstanding
to derive its estimated price per share. Account values are in thousands.
Industry
Firms MVe BVL C and C Equiv.
Enterprise Value EBITDA EV/EBITDA
Abercrombie and Fitch 6,682,544 842,770 81,959 7,443,355 658,090 11.31 Aeropostale 2,386,926 269,048 200,064 2,455,910 167,766 14.64 Gap 18,806,307 3,370,000 2,030 22,174,277 1,264,000 17.54 Limited 10,371,880 4,138,000 500,000 14,009,880 1,176,000 11.91 13.85 Industry Average American Eagle 460,464 59,737 586,790 EBITDA AE
8,127,855 Enterprise Value AE
7,727,128 MVE AE 34.92 PPS AE
By using this method, American Eagle’s estimated price per share was $34.92.
The current market value of American Eagle is $29.99, therefore, could be considered
undervalued when using this model.
All of the firms in this industry choose not to capitalize their operating leases.
This will understate all of the firm’s true liability values. Perhaps, a more accurate
enterprise value to EBITDA model would consider how these capitalized leases would
affect each firm’s book value of liabilities, as well as, the estimated price per share of
American Eagle.
DISCOUNTED DIVIDENDS MODEL
The discounted dividends valuation model values the company based on the
dividend return to the shareholder. As earnings increase in a dividend paying company,
shareholders anticipate a higher dividend payout over time. The present value of
expected future dividends compiles a price that should be comparable to the stock
price. But because dividends tend to be incremental in nature or in some cases steady
for years, dividends do not necessarily correlate to company growth. Therefore, it is

- 99 -
difficult for an investor to accurately derive a value of the firm based on expected future
dividends. The model considers future growth in the form of a perpetuity which
constitutes dividing the future expected dividend by cost of equity less the growth rate.
With American Eagle, we grew the dividend by five cents annually, working
toward a 7% growth. This incorporates the current 38% growth in dividends in the
valuation, but a flat increase in the dividends allows the growth rate to stabilize over
the subsequent ten years to a more reasonable rate. We discounted the dividends with
a 13% cost of capital and then calculated the perpetuity. We assume American Eagle
will continue to pay dividends indefinitely and use perpetuity to determine a value of
the stock following year 10. After discounting the future dividends and perpetuity to
April 1, 2007, the discounted dividends model derives a $6.64 value per share
compared to the observed $29.99. Therefore, according to the discounted dividends
model, American Eagle is exorbitantly overvalued.
Investors use sensitivity analysis to determine how the value of the firm would
be affected by similar costs of equity and growth rates. This helps compensates if there
is an error in the cost of equity or growth rate because it allows the analyst to still
determine the value per share. In this case, even after manipulating the cost of capital
and growth rate, the American Eagle stock is still overvalued according to the
discounted dividends model.
Sensitivity Analysisg
0 0.05 0.07 0.12Ke 0.11 5.50$ 7.67$ 10.06$ (25.78)$
0.13 4.49$ 5.64$ 6.64$ 26.69$ 0.15 3.76$ 4.43$ 4.94$ 9.16$ 0.17 3.22$ 3.64$ 3.92$ 5.63$ 0.19 2.80$ 3.07$ 3.24$ 4.11$
overvaluedfairly valued +/- 10%undervalued

- 100 -
FREE CASH FLOWS MODEL
The free cash flows model summates expected future free cash flows divided by
one plus the after tax weighted average cost of capital. Free cash flows are determined
by adding the operating cash flows to the investing cash flows. This remaining cash is
the cash available to debt and equity holders discounted at the WACC rate. Because it
is cash-based, it is hard to forecast the statement of cash flows due to its unpredictable
nature. Therefore the free cash flows valuation must consider a high degree of error.
The free cash flows model also lacks an anchoring number that bounds the valuation
from increasing dramatically and unrealistically.
When calculating the American Eagle free cash flows model we used CFFI as a
growth percentage from total assets in the current year compared to the total assets in
the previous year. This made the free cash flows grow at a steady 14% annually. After
forecasting the free cash flows for 2016, we were able to determine the perpetuity.
As shown in the above sensitivity analysis, the free cash flows model is very
sensitive to different WACC and growth rates. Using the free cash flows valuation
model is more beneficial than discounted dividends because it does grow according to
the cash available instead of being based on a potentially static number chosen by
company. At an 11% WACC and 8% growth, the firm is considered to be valued at
$90.97, far above the observed April 1, 2007 price. Therefore, the firm is undervalued
Sensitivity Analysisg
0 0.02 0.04 0.06 0.08 0.1 0.12WACC 0.09 48.62$ 56.99$ 72.06$ 107.22$ 283.02$ (244.39)$ (68.59)$
0.11 37.51$ 41.96$ 48.96$ 61.56$ 90.97$ 237.99$ (203.07)$ 0.13 30.08$ 32.67$ 36.41$ 42.28$ 52.85$ 77.52$ 200.86$ 0.15 24.83$ 26.43$ 28.61$ 31.75$ 36.69$ 45.59$ 66.35$ 0.17 20.96$ 21.99$ 23.34$ 25.18$ 27.83$ 32.01$ 39.52$
overvaluedfairly valued +/- 10%undervalued

- 101 -
according to the free cash flows valuation. Below is a sensitivity analysis describing the
value of the firm based off of the operating leases being capitalized.
After we capitalized the operating leases, we recomputed the cost of debt and
expensed the leases at an 8% interest rate. Before we capitalized the leases, over 99%
had an 8.25% interest rate which is why WACC only dropped from 11% to 9%. At an
8% growth, the value of the stock is $283.02. Therefore, according to the free cash
flows model adjusted for operating leases, the firm is undervalued.
RESIDUAL INCOME MODEL
The residual income model links the income statement and the balance sheet to
give a better valuation of a company. Residual income is found by taking the earnings
and subtracting the normal income (ke*BVEt-1). This limits the growth of the valuation
and, therefore, presents a more reliable number than the free cash flows. After being
coupled with a perpetuity and taking the present value, the residual income model
presents a more realistic value of a company. The net income is also simpler to forecast
because it is based on trends shown through the history of the firm instead of the
predicted annual cash flow. The residual income can also be broken down into basic
units of the financial statements, allowing an analyst to better understand the makeup
of the valuation. Although American Eagle shows a growing residual income currently,
Sensitivity Analysisg
0 0.02 0.04 0.06 0.08 0.1 0.12WACC 0.09 48.62$ 56.99$ 72.06$ 107.22$ 283.02$ (244.39)$ (68.59)$
0.11 37.51$ 41.96$ 48.96$ 61.56$ 90.97$ 237.99$ (203.07)$ 0.13 30.08$ 32.67$ 36.41$ 42.28$ 52.85$ 77.52$ 200.86$ 0.15 24.83$ 26.43$ 28.61$ 31.75$ 36.69$ 45.59$ 66.35$ 0.17 20.96$ 21.99$ 23.34$ 25.18$ 27.83$ 32.01$ 39.52$
overvaluedfairly valued +/- 10%undervalued

- 102 -
we expect that to continue only for a limited time period. Therefore, we showed a
negative growth rate for the perpetuity because it is unrealistic to expect American
Eagle to out perform itself year after year.
Because the residual income valuation model is bounded, it is not nearly as
sensitive as the free cash flows model. As show in the above sensitivity analysis, the
value of the firm stays between $11.89 and $12.84 regardless of the manipulated
growth rates or costs of equity. Because the range is so concentrated, we can
confidently assume the true value of the firm is closer to $11.90 than the observed
$29.99. According to the residual income model, American Eagle’s stock price is
overvalued.
ABNORMAL EARNINGS GROWTH MODEL
The abnormal earnings growth model links the additional income, or economic
income, to the observed share price. Because it values the earnings that exceed the
norm, it is related to the residual income model and can serve as a check method when
computing the value of the firm. When the AEG is positive, it is surpassing its current
cost of capital. Over time the growth should dwindle close to zero. If the AEG is
negative, the firm is earning less on its cost of capital and the AEG should grow toward
zero.
Sensitivity Analysisg
-0.05 -0.1 -0.2 -0.3 -0.4 -0.5Ke 0.11 11.94$ 11.89$ 12.01$ 12.23$ 12.45$ 12.67$
0.13 11.90$ 11.90$ 12.05$ 12.27$ 12.50$ 12.72$ 0.15 11.89$ 11.92$ 12.10$ 12.32$ 12.54$ 12.76$ 0.17 11.89$ 11.95$ 12.14$ 12.36$ 12.59$ 12.80$ 0.19 11.91$ 11.98$ 12.18$ 12.41$ 12.63$ 12.84$
overvaluedfairly valued +/- 10%undervalued

- 103 -
The AEG produced a value of $19.78, the closest valuation to American Eagle’s
April 1, 2007 stock price of $29.99. This is found by adding net income and the previous
year’s dividends invested at the cost of equity (13%) to form the cum-dividend
earnings. The abnormal earnings growth is found by subtracting the normal earnings
from the cum-dividend earnings.
Sensitivity Analysisg
-0.05 -0.1 -0.2 -0.3 -0.4 -0.5Ke 0.11 28.23$ 27.11$ 25.97$ 25.38$ 25.02$ 24.78$
0.13 19.78$ 19.37$ 18.91$ 18.67$ 18.52$ 18.42$ 0.15 13.93$ 13.88$ 13.82$ 13.79$ 13.77$ 13.76$ 0.17 9.66$ 9.81$ 9.99$ 10.09$ 10.16$ 10.21$ 0.19 6.43$ 6.69$ 7.01$ 7.20$ 7.32$ 7.41$
overvaluedfairly valued +/- 10%undervalued
The above sensitivity analysis shows the abnormal earnings growth model is
more sensitive than the residual income model, but it still presents realistic values for
the company. The model shows American Eagle to be overvalued by approximately $10
per share, which would equate to a market cap of $2,212,480,000.
ALTMAN'S Z-SCORE
)(1)(6.)(3.3)(4.1)(2.1assetstotal
salesBVLMVE
assetstotalEBITA
assetstotalearningsretained
assetstotalcapitalworkingScoreZ ++++=−
Altman's Z-score is a technique to help determine if a company is in risk of
bankruptcy. It compares working capital, retained earnings, earnings before interest
and taxes, sales to total assets, and market value of equity to the book value of
liabilities. These factors are weighted differently to compose a number to give lenders
an idea of the company's likelihood to default on a loan. Investors consider the Z-score

- 104 -
when looking for a company that will provide a high return and to avoid risky
companies that are probable to go bankrupt. A company is considered liable to go
bankrupt if its Z-score is lower than 1.8 and is considered to have a low chance of
declaring bankruptcy if the Z-score is higher than 2.7. If a company maintains a higher
Z-score and has a minimal chance of going bankrupt, banks are likely to lend at a lower
interest rate which lowers cost of debt and consequently, WACC.
We initially calculated the Z-score with the operating leases and found American
Eagle to have a relatively high Z-score at 3.75. This implies that there is minimal risk of
American Eagle falling into bankruptcy if the company continues to make sound
managerial and financial decisions. After capitalizing the leases, American Eagle's z-
score drops from 3.75 to 2.66, just below the critical 2.7 that states a company has
minimal probability of declaring bankruptcy. Capitalizing the leases expanded American
Eagle’s asset base and therefore the Z-score decreased. Fiscal 2003 shows American
Eagle had a Z-score of 3.11 when using operating leases, but after capitalizing the
leases only a Z-score of 1.73. This drop shows that American Eagle could have been at
risk of bankruptcy at the time. The Z-score most likely recovered because the company
altered management styles and changed accounting principles. Since then, American
Eagle looks like it is continuing to improve its Z-score and is presently at a low-
moderate risk of going bankrupt.
ANALYSTS’ CONCLUSION – OVERVALUED - SELL
After analyzing the intrinsic valuation models, we determined that American
Eagle is overvalued. The discounted dividends model revealed a value of $6.64 per
share. Since dividends fail to fluctuate with the true value of the firm, it does not
adequately reflect the value of the share. The free cash flows model projected American
Altman's Z-score 2002 2003 2004 2005 2006Operating Leases 3.84 3.11 3.61 3.78 3.75Capitalized Leases 1.97 1.73 2.39 2.62 2.66

- 105 -
Eagle to be undervalued and to have a true value of $90.97. This is an unrealistic
representation of the firm. We converted the operating leases to capitalized leases
which lowered the cost of debt and WACC from 11% to 9%. Due to the free cash flow
model’s sensitivity, the price soared and it was not reasonable.
The residual income model and abnormal earnings growth model produced the
most realistic values at $11.90 and $19.78, confirming American Eagle is overvalued.
We believe the true value of the firm falls between these two values at $15.84.
Therefore, it is our recommendation to sell American Eagle stock.

- 106 -
Appendix 1
3 months SUMMARY OUTPUT 72 months
Regression Statistics Multiple R 0.210222 R Square 0.044193 Adjusted R Square 0.030539 Standard Error 0.144333 Observations 72 ANOVA
df SS MS F Significance F Regression 1 0.067424 0.067424 3.236551 0.076322 Residual 70 1.458250 0.020832 Total 71 1.525674
Coefficients Standard Error t Stat P-value Lower 95% Upper 95% Lower 95.0% Upper 95.0%
Intercept 0.027891 0.017010 1.639662 0.105562 -0.006035 0.061818 -0.006035 0.061818 X Variable 1 -0.803950 0.446877
-1.799042 0.076322 -1.695218 0.087318 -1.695218 0.087318
SUMMARY OUTPUT 60 months
Regression Statistics Multiple R 0.101634 R Square 0.010329 Adjusted R Square -0.006734 Standard Error 0.127982 Observations 60 ANOVA
df SS MS F Significance F Regression 1 0.009915409 0.009915 0.605363 0.439702 Residual 58 0.949998047 0.016379 Total 59 0.959913456
Coefficients Standard Error t Stat P-value Lower 95% Upper 95% Lower 95.0% Upper 95.0%
Intercept 0.0308479 0.016566077 1.862114 0.067655 -0.00231 0.064009 -0.0023127 0.064008524 X Variable 1 -0.364007 0.467845391
-0.778051 0.439702 -1.3005 0.572487 -1.3005018 0.57248681

- 107 -
SUMMARY OUTPUT
48 months Regression Statistics
Multiple R 0.3150994 R Square 0.0992877 Adjusted R Square 0.079707 Standard Error 0.1060744 Observations 48 ANOVA
df SS MS F Significance
F Regression 1 0.057054295 0.057054 5.070689 0.029151 Residual 46 0.517582056 0.011252 Total 47 0.574636351
Coefficients Standard
Error t Stat P-value Lower 95% Upper 95%
Lower 95.0%
Upper 95.0%
Intercept 0.0600391 0.016342123 3.673886 0.000622 0.027144 0.092934 0.0271441 0.092934076 X Variable 1 -1.464334 0.650289557
-2.251819 0.029151 -2.7733 -0.15537 -2.7732994 -0.15536943
SUMMARY OUTPUT 36 months
Regression Statistics Multiple R 0.1465986 R Square 0.0214912 Adjusted R Square -0.007289 Standard Error 0.0965744 Observations 36 ANOVA
df SS MS F Significance
F Regression 1 0.006964625 0.006965 0.746748 0.393564 Residual 34 0.317104743 0.009327 Total 35 0.324069368
Coefficients Standard
Error t Stat P-value Lower 95% Upper 95%
Lower 95.0%
Upper 95.0%
Intercept 0.0568778 0.016303729 3.488638 0.001363 0.023745 0.090011 0.02374465 0.090010977 X Variable 1 -0.697816 0.807520907
-0.864146 0.393564 -2.3389 0.943264 -2.3388956 0.943264212

- 108 -
SUMMARY OUTPUT
24 months Regression Statistics
Multiple R 0.1127209 R Square 0.012706 Adjusted R Square -0.032171 Standard Error 0.0948861 Observations 24 ANOVA
df SS MS F Significance
F Regression 1 0.002549124 0.002549 0.28313 0.59999 Residual 22 0.198074391 0.009003 Total 23 0.200623515
Coefficients Standard
Error t Stat P-value Lower 95% Upper 95%
Lower 95.0%
Upper 95.0%
Intercept 0.0359149 0.01965222 1.827522 0.081218 -0.00484 0.076671 -0.0048414 0.076671065 X Variable 1 -0.545109 1.024449658
-0.532099 0.59999 -2.66969 1.57947 -2.6696874 1.579469645

- 109 -
1 year SUMMARY OUTPUT 72 months
Regression Statistics Multiple R 0.210040 R Square 0.044117 Adjusted R Square 0.030461 Standard Error 0.144339 Observations 72 ANOVA
df SS MS F Significance F Regression 1 0.067308 0.067308 3.230715 0.076582 Residual 70 1.458366 0.020834 Total 71 1.525674
Coefficients Standard Error t Stat P-value Lower 95% Upper 95% Lower 95.0% Upper 95.0%
Intercept 0.027711 0.017011 1.629069 0.107791 -0.006215 0.061638 -0.006215 0.061638 X Variable 1 -0.802757 0.446617
-1.797419 0.076582 -1.693506 0.087992 -1.693506 0.087992
SUMMARY OUTPUT 60 months
Regression Statistics Multiple R 0.101597 R Square 0.010322 Adjusted R Square -0.006741 Standard Error 0.127982 Observations 60 ANOVA
df SS MS F Significance F Regression 1 0.009908195 0.009908 0.604918 0.439869 Residual 58 0.950005261 0.016379 Total 59 0.959913456
Coefficients Standard Error t Stat P-value Lower 95% Upper 95% Lower 95.0% Upper 95.0%
Intercept 0.0307544 0.016557873 1.857389 0.068335 -0.00239 0.063899 -0.0023898 0.063898596 X Variable 1 -0.363429 0.467273451
-0.777765 0.439869 -1.29878 0.571921 -1.2987783 0.571920607

- 110 -
SUMMARY OUTPUT
48 months Regression Statistics
Multiple R 0.3144163 R Square 0.0988576 Adjusted R Square 0.0792675 Standard Error 0.1060997 Observations 48 ANOVA
df SS MS F Significance F Regression 1 0.056807163 0.056807 5.046316 0.029522 Residual 46 0.517829188 0.011257 Total 47 0.574636351
Coefficients Standard
Error t Stat P-value Lower 95% Upper 95%
Lower 95.0%
Upper 95.0%
Intercept 0.0596376 0.016288619 3.661306 0.000646 0.02685 0.092425 0.02685032 0.092424903 X Variable 1 -1.459358 0.649642686
-2.246401 0.029522 -2.76702 -0.15169 -2.7670206 -0.15169483
SUMMARY OUTPUT 36 months
Regression Statistics Multiple R 0.1457371 R Square 0.0212393 Adjusted R Square -0.007548 Standard Error 0.0965868 Observations 36 ANOVA
df SS MS F Significance F Regression 1 0.006883003 0.006883 0.737806 0.39638 Residual 34 0.317186366 0.009329 Total 35 0.324069368
Coefficients Standard
Error t Stat P-value Lower 95% Upper 95%
Lower 95.0%
Upper 95.0%
Intercept 0.0566802 0.016273021 3.483078 0.001384 0.023609 0.089751 0.02360945 0.089750966 X Variable 1 -0.693146 0.806962618
-0.858957 0.39638 -2.33309 0.9468 -2.3330911 0.946799551

- 111 -
SUMMARY OUTPUT
24 months Regression Statistics
Multiple R 0.1107237 R Square 0.0122597 Adjusted R Square -0.032638 Standard Error 0.0949076 Observations 24 ANOVA
df SS MS F Significance F Regression 1 0.002459591 0.00246 0.273062 0.606508 Residual 22 0.198163924 0.009007 Total 23 0.200623515
Coefficients Standard
Error t Stat P-value Lower 95% Upper 95%
Lower 95.0%
Upper 95.0%
Intercept 0.035783 0.019625025 1.823336 0.08187 -0.00492 0.076483 -0.0049168 0.076482825 X Variable 1 -0.535 1.023819817
-0.522553 0.606508 -2.65827 1.588272 -2.6582726 1.588272079

- 112 -
5 years SUMMARY OUTPUT 72 months
Regression Statistics Multiple R 0.208311 R Square 0.043393 Adjusted R Square 0.029727 Standard Error 0.144394 Observations 72 ANOVA
df SS MS F Significance F Regression 1 0.066204 0.066204 3.175317 0.079096 Residual 70 1.459470 0.020850 Total 71 1.525674
Coefficients Standard Error t Stat P-value Lower 95% Upper 95% Lower 95.0% Upper 95.0%
Intercept 0.027009 0.017021 1.586827 0.117059 -0.006938 0.060955 -0.006938 0.060955 X Variable 1 -0.794648 0.445945
-1.781942 0.079096 -1.684056 0.094761 -1.684056 0.094761
SUMMARY OUTPUT 60 months
Regression Statistics Multiple R 0.099968 R Square 0.009994 Adjusted R Square -0.007075 Standard Error 0.128003 Observations 60 ANOVA
df SS MS F Significance F Regression 1 0.00959306 0.009593 0.585484 0.447273 Residual 58 0.950320396 0.016385 Total 59 0.959913456
Coefficients Standard Error t Stat P-value Lower 95% Upper 95% Lower 95.0% Upper 95.0%
Intercept 0.0304349 0.016539274 1.84016 0.070863 -0.00267 0.063542 -0.002672 0.063541868 X Variable 1 -0.356725 0.466203378
-0.765169 0.447273 -1.28993 0.576483 -1.289932 0.576482926

- 113 -
SUMMARY OUTPUT
48 months Regression Statistics
Multiple R 0.3176403 R Square 0.1008954 Adjusted R Square 0.0813496 Standard Error 0.1059797 Observations 48 ANOVA
df SS MS F Significance
F Regression 1 0.057978157 0.057978 5.162011 0.027808 Residual 46 0.516658194 0.011232 Total 47 0.574636351
Coefficients Standard
Error t Stat P-value Lower 95% Upper 95%
Lower 95.0%
Upper 95.0%
Intercept 0.058795 0.01612968 3.645146 0.000678 0.026328 0.091262 0.02632768 0.091262407 X Variable 1 -1.481394 0.652020252
-2.272006 0.027808 -2.79384 -0.16895 -2.7938425 -0.1689452
SUMMARY OUTPUT 36 months
Regression Statistics Multiple R 0.1526579 R Square 0.0233044 Adjusted R Square -0.005422 Standard Error 0.0964849 Observations 36 ANOVA
df SS MS F Significance
F Regression 1 0.007552256 0.007552 0.811257 0.374085 Residual 34 0.316517112 0.009309 Total 35 0.324069368
Coefficients Standard
Error t Stat P-value Lower 95% Upper 95%
Lower 95.0%
Upper 95.0%
Intercept 0.0564467 0.016206186 3.483034 0.001384 0.023512 0.089382 0.02351177 0.089381633 X Variable 1 -0.722887 0.802585146
-0.900698 0.374085 -2.35394 0.908162 -2.3539361 0.908162388

- 114 -
SUMMARY OUTPUT
24 months Regression Statistics
Multiple R 0.1094129 R Square 0.0119712 Adjusted R Square -0.032939 Standard Error 0.0949215 Observations 24 ANOVA
df SS MS F Significance
F Regression 1 0.002401701 0.002402 0.266557 0.610802 Residual 22 0.198221814 0.00901 Total 23 0.200623515
Coefficients Standard
Error t Stat P-value Lower 95% Upper 95%
Lower 95.0%
Upper 95.0%
Intercept 0.0357267 0.019616583 1.821248 0.082197 -0.00496 0.076409 -0.0049556 0.076408968 X Variable 1 -0.526875 1.020498894
-0.516292 0.610802 -2.64326 1.58951 -2.6432602 1.589510095

- 115 -
7 years SUMMARY OUTPUT 72 months
Regression Statistics Multiple R 0.208813 R Square 0.043603 Adjusted R Square 0.029940 Standard Error 0.144378 Observations 72 ANOVA
df SS MS F Significance F Regression 1 0.066524 0.066524 3.191340 0.078360 Residual 70 1.459151 0.020845 Total 71 1.525674
Coefficients Standard Error t Stat P-value Lower 95% Upper 95% Lower 95.0% Upper 95.0%
Intercept 0.026799 0.017022 1.574420 0.119900 -0.007149 0.060747 -0.007149 0.060747 X Variable 1 -0.797901 0.446645
-1.786432 0.078360 -1.688707 0.092904 -1.688707 0.092904
SUMMARY OUTPUT 60 months
Regression Statistics Multiple R 0.100285 R Square 0.010057 Adjusted R Square -0.007011 Standard Error 0.127999 Observations 60 ANOVA
df SS MS F Significance F Regression 1 0.009653929 0.009654 0.589237 0.445828 Residual 58 0.950259527 0.016384 Total 59 0.959913456
Coefficients Standard Error t Stat P-value Lower 95% Upper 95% Lower 95.0% Upper 95.0%
Intercept 0.0303441 0.016534203 1.835229 0.071601 -0.00275 0.063441 -0.0027528 0.063440855 X Variable 1 -0.35833 0.466808391
-0.767618 0.445828 -1.29275 0.576088 -1.2927489 0.576088166

- 116 -
SUMMARY OUTPUT
48 months Regression Statistics
Multiple R 0.318458 R Square 0.1014155 Adjusted R Square 0.0818811 Standard Error 0.1059491 Observations 48 ANOVA
df SS MS F Significance
F Regression 1 0.058277042 0.058277 5.191625 0.027386 Residual 46 0.516359309 0.011225 Total 47 0.574636351
Coefficients Standard
Error t Stat P-value Lower 95% Upper 95%
Lower 95.0%
Upper 95.0%
Intercept 0.0584798 0.016077611 3.637345 0.000694 0.026117 0.090842 0.02611727 0.090842375 X Variable 1 -1.487359 0.65277602
-2.278514 0.027386 -2.80133 -0.17339 -2.8013291 -0.17338921
SUMMARY OUTPUT 36 months
Regression Statistics Multiple R 0.1558666 R Square 0.0242944 Adjusted R Square -0.004403 Standard Error 0.0964359 Observations 36 ANOVA
df SS MS F Significance
F Regression 1 0.007873072 0.007873 0.846577 0.364005 Residual 34 0.316196296 0.0093 Total 35 0.324069368
Coefficients Standard
Error t Stat P-value Lower 95% Upper 95%
Lower 95.0%
Upper 95.0%
Intercept 0.0563586 0.01618152 3.482901 0.001384 0.023474 0.089243 0.02347383 0.089243436 X Variable 1 -0.737101 0.801113488
-0.920096 0.364005 -2.36516 0.890957 -2.3651598 0.890957108
SUMMARY OUTPUT 24 months
Regression Statistics Multiple R 0.108306

- 117 -
R Square 0.0117302 Adjusted R Square -0.033191 Standard Error 0.094933 Observations 24 ANOVA
df SS MS F Significance
F Regression 1 0.002353351 0.002353 0.261127 0.614437 Residual 22 0.198270164 0.009012 Total 23 0.200623515
Coefficients Standard
Error t Stat P-value Lower 95% Upper 95%
Lower 95.0%
Upper 95.0%
Intercept 0.0356733 0.01960769 1.819353 0.082495 -0.00499 0.076337 -0.0049906 0.076337171 X Variable 1 -0.520358 1.018301637
-0.511006 0.614437 -2.63219 1.59147 -2.6321866 1.591470049

- 118 -
10 years SUMMARY OUTPUT 72 mo
Regression Statistics Multiple R 0.208724 R Square 0.043566 Adjusted R Square 0.029902 Standard Error 0.144381 Observations 72 ANOVA
df SS MS F Significance F Regression 1 0.066467 0.066467 3.188497 0.078490 Residual 70 1.459208 0.020846 Total 71 1.525674
Coefficients Standard Error t Stat P-value Lower 95% Upper 95% Lower 95.0% Upper 95.0%
Intercept 0.026631 0.017025 1.564238 0.122272 -0.007324 0.060585 -0.007324 0.060585 X Variable 1 -0.797825 0.446801
-1.785636 0.078490 -1.688942 0.093292 -1.688942 0.093292
SUMMARY OUTPUT 60 mo
Regression Statistics Multiple R 0.100281 R Square 0.010056 Adjusted R Square -0.007012 Standard Error 0.127999 Observations 60 ANOVA
df SS MS F Significance F Regression 1 0.009653234 0.009653 0.589194 0.445845 Residual 58 0.950260222 0.016384 Total 59 0.959913456
Coefficients Standard Error t Stat P-value Lower 95% Upper 95% Lower 95.0% Upper 95.0%
Intercept 0.0302638 0.016530983 1.830735 0.072279 -0.00283 0.063354 -0.0028265 0.063354205 X Variable 1 -0.358392 0.466906227 -0.76759 0.445845 -1.29301 0.576222 -1.2930068 0.576221942

- 119 -
SUMMARY OUTPUT
48 mo Regression Statistics
Multiple R 0.3194133 R Square 0.1020249 Adjusted R Square 0.0825037 Standard Error 0.1059131 Observations 48 ANOVA
df SS MS F Significance
F Regression 1 0.058627197 0.058627 5.226363 0.026901 Residual 46 0.516009154 0.011218 Total 47 0.574636351
Coefficients Standard
Error t Stat P-value Lower 95% Upper 95%
Lower 95.0%
Upper 95.0%
Intercept 0.0582191 0.016032848 3.631242 0.000707 0.025947 0.090492 0.02594669 0.090491591 X Variable 1 -1.494005 0.653510116
-2.286124 0.026901 -2.80945 -0.17856 -2.8094528 -0.17855753
SUMMARY OUTPUT 36 mo
Regression Statistics Multiple R 0.1578126 R Square 0.0249048 Adjusted R Square -0.003774 Standard Error 0.0964058 Observations 36 ANOVA
df SS MS F Significance
F Regression 1 0.008070884 0.008071 0.86839 0.357972 Residual 34 0.315998485 0.009294 Total 35 0.324069368
Coefficients Standard
Error t Stat P-value Lower 95% Upper 95%
Lower 95.0%
Upper 95.0%
Intercept 0.056275 0.016163775 3.481548 0.00139 0.023426 0.089124 0.02342622 0.089123707 X Variable 1 -0.745605 0.800112782
-0.931875 0.357972 -2.37163 0.88042 -2.3716296 0.880419973
SUMMARY OUTPUT 24 mo
Regression Statistics Multiple R 0.1083029

- 120 -
R Square 0.0117295 Adjusted R Square -0.033192 Standard Error 0.0949331 Observations 24 ANOVA
df SS MS F Significance
F Regression 1 0.002353218 0.002353 0.261112 0.614447 Residual 22 0.198270297 0.009012 Total 23 0.200623515
Coefficients Standard
Error t Stat P-value Lower 95% Upper 95%
Lower 95.0%
Upper 95.0%
Intercept 0.0356426 0.019598643 1.818628 0.082609 -0.005 0.076288 -0.0050025 0.076287741 X Variable 1 -0.520172 1.017966563
-0.510991 0.614447 -2.63131 1.590961 -2.6313055 1.590961321

121
Appendix 2
Discounted Dividends
Date Dividends 3/28/2007 0.075
12/19/2006 0.05 0.25066 9/20/2006 0.07533 6/22/2006 0.07533 3/22/2006 0.05
12/21/2005 0.05 0.18333 9/21/2005 0.05 6/23/2005 0.05 ke= 13%
3/22/2005 0.03333 growth assumption 7.00%
12/21/2004 0.02 0.08 9/22/2004 0.02
time 1 2 3 4 5 6 7 8 9 1011 perpetuity
Year 2007 2008 2009 2010 2011 2012 2013 2014 2015 2016 2017 0.3 0.35 0.4 0.45 0.5 0.55 0.6 0.65 0.7 0.75 0.8 PV of Div 0.2655 0.2741 0.2772 0.2760 0.2714 0.2642 0.2550 0.2445 0.2330 0.2209 3.9278 Value at April 1 Value per share $ 6.51 6.64 Price at April 1, 2007 $29.99 Sensitivity Analysis g overvalued 0 0.05 0.07 0.12 fairly valued +/- 10% Ke 0.11 $ 5.50 $ 7.67 $ 10.06 $ (25.78)
undervalued 0.13 $ 4.49 $ 5.64 $ 6.64 $ 26.69
0.15 $ 3.76 $ 4.43 $ 4.94 $ 9.16
0.17 $ 3.22 $ 3.64 $ 3.92 $ 5.63
0.19 $ 2.80 $ 3.07 $ 3.24 $ 4.11

- 122 -
Residual Income
1 2 3 4 5 6 7 8 9 10 perp Forecast Years 2006 2007 2008 2009 2010 2011 2012 2013 2014 2015 2016 2017 Beginning BE 1417312 1765616 2167290 2630130 3163042 3776207 4481255 5291473 6222037 7290279 Earnings 387359 414,131 472,110 538,205 613,554 699,451 797,375 909,007 1,036,268 1,181,346 1,346,734 Dividends 65827 70435 75366 80641 86286 92326 98789 105705 113104 121021 129493 Ending BE 1,417,312 1765616 2167290 2630130 3163042 3776207 4481255 5291473 6222037 7290279 8515992 Ke 0.13 "Normal" Income 184251 229530 281748 341917 411195 490907 582563 687892 808865 947736 Residual Income (RI) 229881 242580 256457 271637 288256 306468 326444 348377 372481 398998 398998 Discount Factor 0.885 0.783 0.693 0.613 0.543 0.480 0.425 0.376 0.333 0.295 Present Value of RI 203434 189976 177738 166600 156454 147202 138758 131045 123993 117540 ROE 0.292 0.267 0.248 0.233 0.221 0.211 0.203 0.196 0.190 0.185
BV Equity (per share) $1,417,312 gr -0.0849 -0.0713 -0.0606 -0.0521 -0.0451 -0.0394 -0.0346 -0.0305 -0.0270 0.2247
Total PV of RI $1,435,201
Continuation (Terminal) Value
$2,216,655 avg gr -0.049
PV of Terminal Value $ 653,001 Sensitivity Analysis
Estimated Value $3,505,513 g
Shares Outstanding $ 221,284 -0.05 -0.1 -0.2 -0.3 -0.4 -0.5
Price Per Share 15.84 Ke 0.11 $ 11.94 $ 11.89 $ 12.01 $ 12.23 $ 12.45 $ 12.67 0.13 $ 11.90 $ 11.90 $ 12.05 $ 12.27 $ 12.50 $ 12.72 Actual Price per share $29.99 0.15 $ 11.89 $ 11.92 $ 12.10 $ 12.32 $ 12.54 $ 12.76 Growth -0.05 0.17 $ 11.89 $ 11.95 $ 12.14 $ 12.36 $ 12.59 $ 12.80 Ke 0.13 0.19 $ 11.91 $ 11.98 $ 12.18 $ 12.41 $ 12.63 $ 12.84 Price on April 1, 2007 $ 11.90 overvalued fairly valued +/- 10% undervalued

- 123 -
AEG
Forecast Years
2006 2007 2008 2009 2010 2011 2012 2013 2014 2015 2016 2017 Net Income 387359 414,131 472,110 538,205 613,554 699,451 797,375 909,007 1,036,268 1,181,346 1,346,734 1,535,277 Dividends 65827 70435 75366 80641 86286 92326 98789 105705 113104 121021 Dividends invested at 13% (Drip) 7241 7748 8290 8871 9492 10156 10867 11627 12441 13312 Cum-Dividend Earnings $479,351 $545,953 $621,844 $708,322 $806,866 $919,163 $1,047,135 $1,192,973 $1,359,175 $1,548,589 Normal Earnings $459,686 $524,042 $597,408 $681,045 $776,391 $885,086 $1,008,998 $1,150,258 $1,311,294 $1,494,875 AEG $19,665 $21,911 $24,436 $27,277 $30,475 $34,077 $38,137 $42,716 $47,882 $53,714 Change in RI 12699 13878 15180 16619 18212 19976 21933 24104 26517 PV Factor 0.8850 0.8850 0.7831 0.6931 0.6133 0.5428 0.4803 0.4251 0.3762 0.33288483 PV of AEG $17,403 $17,160 $16,936 $16,730 $16,541 $16,368 $16,211 $16,068 $15,939.12 Core Net Income $414,131 Sensitivity Analysis Total PV of AEG $149,354 g Terminal Value $335,714 -0.05 -0.1 -0.2 -0.3 -0.4 -0.5
PV of Terminal Value $111,754 Ke 0.11 $28.23 $27.11 $25.97 $25.38 $25.02 $24.78 Total PV of AEG $261,108 0.13 $19.78 $19.37 $18.91 $18.67 $18.52 $18.42 Total Average NI Perp $675,239 0.15 $13.93 $13.88 $13.82 $13.79 $13.77 $13.76 Capitalization Rate 0.11 0.17 $9.66 $9.81 $9.99 $10.09 $10.16 $10.21
0.19 $6.43 $6.69 $7.01 $ 7.20 $7.32 $7.41 Intrinsic Value $6,138,539 overvalued
Ke 0.11 fairly valued +/- 10%
g -0.05 undervalued Number of Shares 221,284 Per Share at April 1st Price Per Share $27.74 $28.23 Price at April 1, 2007 $29.99

- 124 -
Free Cash Flows
1 2 3 4 5 6 7 8 9 10 perp
Forecast Years
2006 2007 2008 2009 2010 2011 2012 2013 2014 2015 2016 2017 EPS 387359 441589 503412 573889 654234 745827 850242 969276 1104975 1259672 1436026 DPS 66385 77449 88514 99578 110642 121706 132770 143835 154899 165963 BV Equity 1417312 1738286 2102426 2517324 2991636 3535228 4159348 4876820 5702262 6652338 7746046 CFFO 749268 637,125 726,323 828,008 943,929 1,076,079 1,226,730 1,398,472 1,594,259 1,817,455 2,071,899 CFFI -651121 -209,500 -307,578 -350,639 -399,728 -455,690 -519,486 -592,215 -675,125 -769,642 -877,392 Free Cash Flows 427626 418745 477369 544201 620389 707244 806258 919134 1047813 1194507 1361737 BV Liabilities 540,172 Ke 0.13 Kd 0.081 WACC 0.13 g 0.08 PV Factor 0.8850 0.7831 0.6931 0.6133 0.5428 0.4803 0.4251 0.3762 0.3329 0.2946 PV FCF 378430 327939 330841 333769 336722 339702 342708 345741 348801 351888 Total PV FCF $3,436,541 PV perp $8,023,040 Sensitivity Analysis Total PV FCF 11,459,581 g Number of Shares 221,284 0 0.02 0.04 0.06 0.08 0.1 0.12
WACC 0.09 $48.62 $56.99 $72.06 $107.22 $283.02 $(244.39) $(68.59)
Price Per Share $51.79 0.11 $37.51 $41.96 $48.96 $61.56 $90.97 $237.99 $(203.07)
Price at April 1 $52.85 0.13 $30.08 $32.67 $36.41 $42.28 $52.85 $77.52 $200.86 0.15 $24.83 $26.43 $28.61 $31.75 $36.69 $45.59 $66.35 overvalued 0.17 $20.96 $21.99 $23.34 $25.18 $27.83 $32.01 $39.52 fairly valued +/- 10%
undervalued

- 125 -
Capitalized Free Cash Flows
1 2 3 4 5 6 7 8 9 10 perp
Forecast Years
2006 2007 2008 2009 2010 2011 2012 2013 2014 2015 2016 2017 EPS 387359 441589 503412 573889 654234 745827 850242 969276 1104975 1259672 1436026 DPS 66385 77449 88514 99578 110642 121706 132770 143835 154899 165963 BV Equity 1417312 1738286 2102426 2517324 2991636 3535228 4159348.005 4876820 5702262 6652338 7746046 CFFO 749268 637,125 726,323 828,008 943,929 1,076,079 1,226,730 1,398,472 1,594,259 1,817,455 2,071,899 CFFI -651121 -209,500 -307,578 -350,639 -399,728 -455,690 -519,486 -592,215 -675,125 -769,642 -877,392 Free Cash Flows 427626 418745 477369 544201 620389 707244 806258 919134 1047813 1194507 1361737 BV Liabilities 540,172 Ke 0.13 Kd 0.08 WACC 0.09 g 0.08 PV Factor 0.9174 0.8417 0.7722 0.7084 0.6499 0.5963 0.5470 0.5019 0.4604 0.4224 PV FCF 392317 352449 368617 385526 403210 421706 441051 461282 482442 504572 Total PV FCF $4,213,173
PV perp $57,521,261 Sensitivity Analysis
Total PV FCF 61,734,435 g Number of Shares 221,284 0 0.02 0.04 0.06 0.08 0.1 0.12
WACC 0.09 $48.62 $56.99 $72.06 $107.22 $283.02 $(244.39) $(68.59)
Price Per Share $278.98 0.11 $37.51 $41.96 $48.96 $61.56 $90.97 $237.99
$(203.07)
Price at April 1 $283.02 0.13 $30.08 $32.67 $36.41 $42.28 $52.85 $77.52 $200.86 overvalued 0.15 $24.83 $26.43 $28.61 $31.75 $36.69 $45.59 $66.35
fairly valued +/- 10% 0.17 $20.96 $21.99 $23.34 $25.18 $27.83 $32.01 $39.52
undervalued

126
Resources
www.abercrombie.com
Form 10-K405 ABERCROMBIE & FITCH CO /DE/ - ANF Filed: April 20, 2001 (period:
February 03, 2001)
Form 10-K ABERCROMBIE & FITCH CO /DE/ - ANF Filed: April 17, 2002 (period:
February 02, 2002)
Form 10-K ABERCROMBIE & FITCH CO /DE/ - ANF Filed: April 17, 2003 (period:
February 01, 2003)
Form 10-K ABERCROMBIE & FITCH CO /DE/ - ANF Filed: April 14, 2004 (period:
January 31, 2004)
Form 10-K ABERCROMBIE & FITCH CO /DE/ - ANF Filed: April 14, 2005 (period:
January 29, 2005)
Form 10-K ABERCROMBIE & FITCH CO /DE/ - ANF Filed: April 07, 2006 (period:
January 28, 2006)
Form 10-K ABERCROMBIE & FITCH CO /DE/ - ANF Filed: March 30, 2007 (period:
February 03, 2007)
www.ae.com
Form 10-K AMERICAN EAGLE OUTFITTERS INC – AEO Filed: April 27, 2001 (period:
February 03, 2001)
Form 10-K AMERICAN EAGLE OUTFITTERS INC – AEO Filed: May 01, 2002 (period:
February 02, 2002)
Form 10-K AMERICAN EAGLE OUTFITTERS INC – AEO Filed: April 02, 2003 (period:
February 01, 2003)
Form 10-K AMERICAN EAGLE OUTFITTERS INC – AEO Filed: April 01, 2004 (period:
January 31, 2004)
Form 10-K AMERICAN EAGLE OUTFITTERS INC – AEO Filed: April 14, 2005 (period:
January 29, 2005)
Form 10-K AMERICAN EAGLE OUTFITTERS INC – AEO Filed: April 05, 2006 (period:
January 28, 2006)

- 127 -
Form 10-K AMERICAN EAGLE OUTFITTERS INC – AEO Filed: April 04, 2007 (period:
February 03, 2007)
www.aeropostale.com
Form 10-K AEROPOSTALE INC – ARO Filed: April 29, 2003 (period: February 01, 2003)
Form 10-K AEROPOSTALE INC – ARO Filed: April 14, 2004 (period: January 31, 2004)
Form 10-K AEROPOSTALE INC – ARO Filed: April 12, 2005 (period: January 29, 2005)
Form 10-K AEROPOSTALE INC – ARO Filed: April 05, 2006 (period: January 28, 2006)
Form 10-K AEROPOSTALE INC – ARO Filed: April 02, 2007 (period: February 03, 2007)
www.cfpsa.com
www.finance.yahoo.com
www.gap.com
Form 10-K GAP INC - GPS Filed: April 05, 2001 (period: February 03, 2001)
Form 10-K GAP INC - GPS Filed: April 02, 2002 (period: February 02, 2002)
Form 10-K GAP INC - GPS Filed: April 01, 2003 (period: February 01, 2003)
Form 10-K GAP INC - GPS Filed: March 30, 2004 (period: January 31, 2004)
Form 10-K GAP INC - GPS Filed: March 28, 2005 (period: January 29, 2005)
Form 10-K GAP INC - GPS Filed: March 28, 2006 (period: January 28, 2006)
Form 10-K GAP INC - GPS Filed: April 02, 2007 (period: February 03, 2007)
www.limitedbrands.com
Form 10-K LIMITED BRANDS INC - LTD Filed: April 24, 2001 (period: February 03,
2001)
Form 10-K LIMITED BRANDS INC - LTD Filed: April 22, 2002 (period: February 02,
2002)
Form 10-K LIMITED BRANDS INC - LTD Filed: April 18, 2003 (period: February 01,
2003)
Form 10-K LIMITED BRANDS INC - LTD Filed: April 14, 2004 (period: January 31, 2004)
Form 10-K LIMITED BRANDS INC - LTD Filed: April 08, 2005 (period: January 29, 2005)
Form 10-K LIMITED BRANDS INC - LTD Filed: March 31, 2006 (period: January 28,
2006)

- 128 -
Form 10-K LIMITED BRANDS INC - LTD Filed: April 03, 2007 (period: February 03,
2007)
Palepu, Krishna G., Healy, Bernard. Business Analysis & Valuation. Thomson Learning:
2004.
Moore, Mark Dr. Texas Tech University, Finance.
Wharton Research Data Services