this issue ofthe alan tennant - jampress.orgjampress.org/jom_v5n1.pdf · this issue ofthe journal...
TRANSCRIPT
This issue of the Journal of Outcome Measurement
was generously donated by Alan Tennant
EDITOR
Richard F Harvey MD Rehabilitation Foundation Inc
ASSOCIATE EDITORS
Benjamin D Wright University of Chicago Carl V Granger State University of Buffalo (SUNY)
IlEALTH SCIENCES EDITORIAL BOARD
David Cella Evanston Northwestern Healthcare William Fisher Jr Louisiana State University Medical Center Anne Fisher Colorado State University Gunnar Grimby University of Goteborg Perry N Halkitis New York University Mark Johnston Kessler Institute for Rehabilitation David McArthur UCLA School of Public Health Tom Rudy University of Pittsburgh Mary Segal Moss Rehabilitation Alan Tennant University of Leeds Luigi Tesio Foundazione Salvatore Maugeri Pavia Craig Velozo University of Florida
EDUCATIONALIPSYCHOLOGICAL EDITORIAL BoARD
David Andrich Murdoch University Trevor Bond James Cook University Ayres DCosta Ohio State University George Engelhard Jr Emory University Robert Hess Arizona State University West J Michael Linacre MESA Press Laura Knight-Lynn Rehabilitation Foundation Inc Geofferey Masters Australian Council on Educational Research Carol Myford Educational Testing Service Nambury Raju Illinois Institute of Technology Randall E Schumacker University of North Texas Mark Wilson University of California Berkeley
JOURNAL OF OUTCOME MEASUREMENTreg
Volume 5 Number 1 200112002
Reviewer Acknowledgement
Articles
Comparison of Seven Different Scales used to Quantify Severity of Cervical Spondylotic Myelopathy and Post-Operative Improvement 798 A Singh HA Crockard
The Impact of Rater Effects on Weighted Composite Scores UnderNested and Spiraled Scoring Designs Using the Multifaceted Rasch ModeL 819
Husein M Taherbhai and Michael James Young
The following article from Volume 4 Issue 3 is being reprinted due to errors in printing the tables
Measuring Disability Application of the Rasch Model to Activities ofDaily Living (ADLIIADL) 839 T Joseph Sheehan Laurie M DeChello Ramon Garcia Judith Fifield Naomi Rothfield Susan Reisine
Call for Papers 864
REVIEWER ACKNOWLEDGEMENT
The Editor would like to thank the members of the Editorial Board who provided manuscript reviews for the Journal of Outcome Meashysurement Volume 5 Number 1
JOURNAL OF OUTCOME MEASUREMENTreg 5(1)798-818 Copyrightcopy 2001 Rehabilitation Foundation Inc
Comparison of Seven Different Scales used to Quantify
Severity of Cervical middotSpondylotic Myelopathy and
Post-Operative Improvement A Singh
HA Crockard Department of Surgical Neurology
National Hospital for Neurology and Neurosurgery London UK
Considerable uncertainty exists over the benefit that patients receive from surgical decompressive treatment for cervical spondylotic myelopathy (CSM) Such diffishyculties might be addressed by accurate quantification ofCSM severity as part of a trial determining the outcome of surgery in different patient groups This study compares the applicability of various existing quantitative severity scales to meashysurement of CSM severity and the effects on severity of surgical decompression Scores on the following scales were determined on 100 patients with CsM preshyoperatively and then again six months following surgical decompression Odoms Criteria Nurick grade Ranawat grade Myelopathy Disability Index (MDI) Japashynese Orthopaedic Association (JOA) Score European Myelopathy Score (EMS) and Short Form-36 Health Survey (SF36) All the scales showed significant imshyprovement following surgery However each had differing qualities of reliability validity and responsiveness that made them more or less suitable The MDI showed the greatest sensitivity between different severity levels sensitivity to operative change and reliability However analysis of all the questionnaire scales into comshyponents that looked at different aspects of function revealed potential problems with redundancy and a lack of consistency This prospective observational study provides a rational basis for determining the advantages and disadvantages of difshyferent existing scales in measurement ofCSM severity and for making adaptations to develop a scale more specifically suited to a comprehensive surgical trial
Requests for reprints should be sent to Alan Crockard DSc Department of Surshygical Neurology National Hospital for Neurology and Neurosurgery Queen Square London WCIN 3BBG UK
798
Comparison of Seven Different Severity and Outcome Scales 799
INTRODUCTION
Rational observation ofdisease management requires a consideration of and measurement of the outcome of such management In this context outcome may be defined as an attributable effect of intershyvention or its lack on a previous health state (CaIman 1994) Inforshymation about the outcome of different treatments is important not only to clinicians and to patients and their families but in the curshyrent era ofcost constraints also to the health provider and the health purchaser In the present climate of evidence-based health care all clinicians in their individual practices must aspire to achieve compashyrable best results such aims can only be realised by a proper considshyeration and quantification of the outcomes of their treatments
Treatment of CSM well illustrates this increasing need for a more rigorous investigation of management outcomes Decompresshysive surgery for cervical spondylotic myelopathy (CSM) was first performed by Victor Horsley in 1892 and has been a standard pracshytice for many years However the selection of appropriate patients for such procedures and the determination of the correct stage in the disease to operate remains uncertain In fact Rowland (Rowland 1992) has questioned the fact that surgery has any role in cervical spondylotic myelopathy arguing that there has been no large proshyspective surgical series and that retrospective series in the literature (Phillips 1973 Clarke and Robinson 1956) do not demonstrate any treatment advantage over conservative management While the lack of such data does not invalidate operative treatment different clinishycians do appear to vary greatly in their selection practices for decomshypressive surgery and it is likely that a considerable number of pashytients are unnecessarily operated upon while others are operated upon too late or not at all As discussed the increasing demand for scienshytific justification of clinical practice makes some form of large proshyspective comparison of the outcomes for operated versus non-opershyated patients extremely timely
Currently clinicians rely on specific symptoms such as diffishyculty with gait or urinary difficulties together with specific findings on clinical examination and radiological imaging to identify the most
800 Singh and Crockard
severe forms of cervical spondylosis and to decide when surgery is appropriate It is clear that more quantitative severity and outcome measures would be required for a clinical trial and such measures might also ultimately prove useful in clinical assessment ofindividual patients
A variety of quantitative assessment scales now exist that have or could potentially be applied to the quantification of CSM severity and so facilitate proper study ofthe outcome of surgery The goal of our study was therefore to explore prospectively the applicability of various impairment disability and handicap scales to CSM patients pre- and post -operatively and if no one scale is found to be ideal to determine those applicability and statistical qualities ofdifferent scales that would be desirable in the development of an ideal scale
METHODS
Subjects
We prospectively studied 100 patients with CSM who were conshysecutively referred and accepted for decompressive surgery to the Neurosurgical Unit at National Hospital for Neurology and Neuroshysurgery The median age ofthe patients was 58 years and there were 62 males and 38 females All patients had the diagnosis corroborated by MRI and none had undergone previous neck surgery or had any other pathology that might have resulted in functional impairment Ethical committee approval and informed consent from each patient was obtained under the guidelines of the Hospital Policy The pashytients were under the care of six Neurosurgeons The assessor was a Nurse Practitioner previously experienced in the use of such scales (Singh and Crockard 1999) who had no input in surgical decisionshymaking
Of the 100 patients 50 anterior cervical discectomies (Clowards or Smith Robinsons) and 50 posterior decompressions (laminectomies n=16 laminoplasties n=34) were performed by 7 different neurosurgeons
Comparison of Seven Different Severity and Outcome Scales 801
Study design and data analysis
Each patient was assessed by the same assessor Scores for the folshylowing functional assessment scales were detennined shortly before surgery and then again 6 months after surgery 1 Myelopathy Disability Index (MDI) this is a disability scale
applied to assessment of rheumatoid myelopathy and constishytuting a shortened fonn of the Health Assessment Questionshynaire (HAQ) which in tum is adapted from the Activities of daily living (ADL) scale Scores range from 0 (nonnal) to 30 (worst) (Casey et aI 1996)
2 Japanese Orthopaedic Association Score (JOA) a disability scale that attempts to look at various impainnent categories such as disability related to upper motor neurone radicular and sphincter deficits Scores range from 0 (worst) to 17 (norshymal) (Hirabayashi et aI 1981)
3 European Myelopathy Score (EMS) a scale adapted from the JOA for Western use that also includes pain assessment Scores range from 5 (worst) to 18 (nonnal) (Herdman et aI 1994)
4 Nurick Score a simple scale mainly focusing on walking disshyability ranging from 1 (nonnal) to 5 (worst) (Nurick 1972)
5 Ranawat a simple impainnent scale ranging from 1 (norshymal) to 4 (3B) (worst) (Ranawat 1979)
6 Odoms criteria a simple score looking at overall surgical outcome ranging from 1 (best outcome) to 4 (no change or worse) (Odom et aI 1958)
7 The MOS 36-item short-forn1 health survey (SF36) A comshyplex health questionnaire measuring disability and handicap ( ofnonnall00) (Ware and Sherbourne 1992) These different outcome measures were then analyzed with
respect to their properties of internal consistency sensitivity validshyity and responsiveness Data were analysed statistically using the SPSS package version 9
802 Singh and Crockard
Figure 1
~
~
bull -shy
1
RSqgt
171
csect
ui11 ~ ~ ~
Rap FQtpRap RBp
~Fjgure 1 Box plots of the 100 pre-operative and 99 post-operative scores of all the patients on 5 different scales (One patient died shortly following surgery) For the MOl the Nurick and the Ranawat scales a better score is a lower value while for the EMS and lOA better scores arc repre~ented by higher values The circles represent outlying values greater than I Y interquartile intervals and the stars represent extremes greater than 3 interquartile intervals In all cases the improvement following surgery was statistically significant (Wilcoxon) (tahle 1)
~F
igur
e 2
sect o
plt
O0
04
plt
O0
18
plt
O0
01
plt
O0
01
plt
O0
01
plt
O0
05
plt
O0
01
plt
O0
09
~
11
0
10
0
~ 90
80
en
o 7
0
60
e U
) E
l
50
E
~
4
0
2 3
0
20
1~11
1 --1
B
od
y pa
in
I o =
o
JJ ~ ~ =
~ ~
~ -~ =
~ ~ ~ -~ =
Q o C
tgt 3 ~ JJ
tgt
Dgt
(i
III
I I
I 11-
11 ~
p
o
Me
nta
l h
ea
lth
Rol
e em
otio
na
l S
oci
al f
un
ctio
n
Ge
ne
ral
heal
th
Ph
ysic
al f
un
ctio
n
Ro
le p
hys
ica
l V
italit
y
Fig
ure
2
Box
plo
ts o
f pre
and
pos
t ope
rati
ve s
core
s fo
r th
e 8
cate
gori
es o
f the
SF
-36
Que
stio
nnai
re
The
se s
core
s ha
ve a
ll be
en tr
ansf
onne
d to
o
perc
enta
ges
for
com
pari
son
whe
re 1
00
is th
e be
st p
ossi
ble
scor
e E
ach
cate
gory
sho
ws
sign
ific
ant i
mpr
ovem
ent f
ollo
win
g su
rger
y (W
ilco
xon)
w
0
0
804 Singh and Crockard
RESULTS
Patient and Operative Details
The median length of hospital stay for the 100 patients was 8 days and there was a 3 wound infection rate There was one peri-operashytive death due to cardio-respiratory failure 3 weeks following surshygery Thus only 99 comparisons were available
Pre- and Post-operative Scale Scores
All scales recorded an improvement following surgery (Figures 1 2) On a Wilcoxin test this improvement was significant in each case (Table 1 and Figure 2 for SF 36 subcategories) Note that Odoms criteria only record operative results so there are no pre- and postshyoperative values There were a minority ofpatients who scored worse 6 months following surgery (eg 8 out of99 for the MDI) On each scale these were slightly different patients (see correlations section)
Sensitivity to change
While all of the scales showed a statistically significant improveshyment following surgery this does not reveal the magnitude of the change It is clearly desirable for a scale to show a large sensitivity to change This was quantified by calculating the Normalised Change the mean ofthe differences following surgery for the 99 subjects (in whom a comparison was possible) divided by the overall median of the 199 pre- and post-operative scores ie (mean of (preop score shypostop score )) median ofall scores The mean rather than median of differences was used because while the scale values were not norshymally distributed the differences in values did follow an approxishymately normal distribution The MDI was found to be the best scale according to this criterion while the EMS was the worst (Table 1)
Absolute Sensitivity
It may be desirable to have a high sensitivity to distinguish different
Tab
le 1
SCA
LE
MD
I
EM
S
JOA
NU
RIC
K
RA
NA
WA
T
SF36
T101
Com
pari
son
ofp
rope
rtie
s o
fdif
fere
nt s
cale
s T
he
sign
ific
ance
of i
mpr
ovem
ent i
s th
e pshy
n o va
lue
of t
he o
pera
tive
cha
nge
Sen
siti
vity
to c
hang
e is
mea
n o
f (p
reop
sco
re -
post
op
sect ~sc
ore )
med
ian
of a
ll s
core
s C
oeff
icie
nts
of v
aria
tion
pre
-op
an
d p
ost-
op a
nd
the
rel
ishy fii
middot oab
ilit
y (C
ron
bac
hs
a)
pre-
op a
nd
pos
t-op
are
als
o sh
own
for
all s
cale
s
=
o
rIl
Igt
~
IgtS
IGN
IFIC
AN
CE
S
EN
SII
IW
IY
C
O-E
FF
ICIE
NT
C
O-E
FF
ICIE
NT
IN
TE
RN
AL
IN
TE
RN
AL
I
=
OF
T
O C
HA
NG
E
OF
O
F V
AR
IAT
ION
C
ON
SIS
TE
NC
Y
CO
NS
IST
EN
CY
51
IMP
RO
VE
ME
NT
V
AR
IAT
ION
P
OS
T-O
P
(CR
ON
BA
CH
S a
(C
RO
NB
AC
HS
a
a ~ P
RE
-OP
P
RE
-OP
) P
OS
T-O
P)
I
PltO
(xn
052
0
85
129
0
92
095
rI
l Igt
(11
SCO
RE
S)
(11
SCO
RE
S)
Igt
I
~ 0
76
081
(4
CA
TE
GO
RIE
S)
(4 C
AT
EG
OR
IES)
4 ~ 5shy
PltO
OO
I 0
18
027
0
29
068
0
77
o = o ~
(6 S
CO
RE
S)
(6 S
CO
RE
S)
3 Plt
OO
OI
021
0
5 0
4
072
0
73
066
0
65
Igt
rIl
~(4
CA
TE
GO
RIE
S)
(4 C
AT
EG
OR
IES)
I
~ shy
PltO
OO
I 0
42
033
1
I
PltO
OO
I 0
34
0 0
PltO
OO
I 0
32
041
0
68
082
0
86
00
(361
1EM
S)
(36I
Th1
ES)
I
o Vl
806 Singh and Crockard
absolute levels of severity between patients in the sample group as well as sensitivity to changes following surgery Absolute sensitivshyity was quantified by the coefficient of variation (the interquartile range divided by the median) It is seen that the Ranawat score has poor sensitivity for distinguishing patients with different levels of severity because the range across the patients is narrow This is ilshylustrated by the fact that the box plot shows a single horizontal line instead of a box (Figure 1) Thus nearly all pre-operative patients were scored at one level and post-operatively at a level one grade better indicating that the Ranawat score nevertheless records a postshyoperative improvement
The Nurick scale was found to have much greater sensitivity post operatively perhaps indicating that the scale was more sensishytive at distinguishing milder levels of severity
Internal Consistency
If different questions in a multipart questionnaire are attempting to measure the same parameter eg CSM severity then there should be consistent scoring within patients This is measured by Cronbachs alpha (Cronbach and Meehl 1955) a normalised measure of correshylations between multiple components of a scale A score of 1 indishycates a perfect correlation The very high Cronbachs alpha values of the MDI (table 1) show that the questionnaires were reliably comshypleted but also suggest the possibility of redundancy When the 11 questions of the MDI were split into 4 categories (walking hand function transfers and dressing) the alpha scores were somewhat lower This is appropriate since ifdifferent questions within a quesshytionnaire are designed to address different parameters then it is not desirable to have high internal consistency
Correlations of Scores
To explore the validity ofthe different scales correlation coefficients were calculated for the pre-operative scores (Table 2A) post-operashytive scores (Table 2B) and for the changes following surgery (Table 2C) All correlations were corrected for the fact that some scales
Comparison of Seven Different Severity and Outcome Scales 807
recorded no disability as the maximum value while others recorded no disability as the minimum value
It was found that some scales were correlated better than othshyers the best correlation was found post-operatively between the MDI and the EMS scales (r= 082) which are both disability questionshynaires while the poorest correlation was postoperatively between the SF36 (measuring handicap and disability) and the Ranawat (meashysuring neurological impainnent)
The correlations were poorer when comparing operative changes Many values were close to zero or even negative
Breaking down Scales into Components
The generally poor correlation between scales with better correlashytion between more similar scales (eg the postoperative MDI and EMS scores) could be due to some scales measuring different asshypects of function or impainnent This was initially investigated by empirically dividing the multi-part scales into components measurshying certain aspects ofdisability or impairment This breakdown might also reveal that different individual aspects have different potentials for improvement following surgery Thus the Normalised Changes measuring the magnitude ofoperative change (sensitivity to change) of the different components of the three multipart disability quesshytionnaires were calculated and compared (Table 3)
A reasonably consistent trend was apparent across the scales revealing that good improvement tended to occur in hand function as assessed by all three scales addressing this aspect while both scales looking at sphincter function showed that it remained little changed by surgery Within the SF 36 physical and social function and social role changed most (Figure 2) but no corroboration was available for these parameters since they were not measured by any other scale The findings in general support the possibility that the poor correlashytions might be better ifone compared specific aspects ofCSM rather than overall scales However since the scale components have not been validated when looked at individually one has to interpret difshyferences in improvement between these specific aspects with caushy
808 Singh and Crockard
Table 2A
MDI EMS RANAWAT NURICK JOA SF36
Pre-op MDI 1 - - - - shyPre-op EMS 075 1 - - - shyPre-op RANAWAT 051 061 1 - - shyPre-op NURICK 066 069 071 - - shyPre-op JOA 056 062 047 059 1 shyPre-op SF36trade 048 042 031 038 040 1
Table 2B
Post- Post- Post- Post- Post- Post-Op Op Op Op Op Op
MDI EMS RANAWAT NURICK JOA SF36
Post-Op MDI 1 - - - - shyPost-Op EMS 082 1 - - - shyPost-Op RANAWAl 067 063 1 - - shyPost-Op NURICK 071 074 075 1 - shyPost-Op JOA 057 072 042 051 1 shyPost-Op SF36trade 035 035 025 036 037 1
Comparison of Seven Different Severity and Outcome Scales 809
Table 2C
MDI EMS RANAWAl NURICK JOA SF36 ODOMS
Change Change Change Change Change Change Change
MDI Chan2e 1 - - - - - - shyEMS Chan2e 027 1 - - - - - shyRANAWAT Chan2e 022 023 1 - - - - shyNURICK Chan2e 032 032 055 1 - - shyJOA Chan~e 015 035 002 019 1 - shySF36trade Change 022 012 0003 013 028 1 shyODOMS Change 002 027 033 025 024 019 1
Table 2ABC Correlations of score pre-operatively (2A) post-operatively (2B) and operative changes ie differences between pre-operative and postshyoperative scores (2C)
tion For example the greater improvement in hand function after surgery might simply reflect a greater sensitivity of the questionshynaires to this component rather than a genuinely greater improveshyment
Correlations of Components
In order to seek some validation of the component sensitivities and to explore why the overall scale correlations ofoperative change were low the next step was to perform correlations between these composhynents in a similar way to the correlations performed above for the overall scales Thus the components of the multi-part scales quesshytioning walking function were directly correlated with each other as well as with the Ranawat and Nurick scales (which have a one-dishymensional measure primarily based on walking) while hand and bladshy
810 Singh and Crockard
Table 3 Breakdown of scales into components sensitivity to change in these aspects fllowing surgery
MDI EMS JOA sensitivity sensitivity sensitivity to change to change to change
WALKING 058 02 021 HAND 070 022 035 DRESSING 035 02 shySPINCTER - 003 004 WASHING
TRANSFERS 042 - shyPAIN - 022 shySENSORY
LOSS - - 033
Table 3 Three scales were broken down into their component aspects and sensitivities to change recalculated for these separate components For example the JOA has questions relating to walking hand and spincter function and sensory change The hand function components recorded by these scales change much more than bladder-related components
der components were similarly correlated between those scales that had aspects pertaining to these components (Table 4A B C)
It was found that particularly for hand and bladder function improvement correlations were still very poor The correlation of operative changes for two apparently similar questions on the JOA and EMS namely bladder function was only 023 On analysing individual patients responses the inconsistencies were clear For example patient number 10 indicated his bladder became worse postshyoperatively on the EMS going from normal to inadequate but on the JOA he reported only a mild disturbance both pre- and post-operashytively
Comparison of Seven Different Severity and Outcome Scales 811
Table 4A
MDI EMS RANAWAT NURICK JOA
Walk Walk Change Change Walk Change Change Change
MDI Walk 1 Change
EMS Walk 007 Change RANAWAT 026 Change NURICK 034 Change
JOA Walk 013 Chanfe
Table4B
JOA Hand Chanfe MDI Hand Change EMS Hand Change
Table 4C
EMS Bladder Difference
JOA Bladder Difference
- -
1
025
023
048
-
1
055
019
- -
- -
- -
1 -
029 1
JOA MDI EMS Hand Hand Hand Chanfe Chanfe Chanfe
1 012 025
EMS Bladder Difference
1
023
- -1 -026 1
JOABladder Difference
-
1
Table 4A B C Components such as walking hand function bladder were similarly correlated between those scales that had aspects pertaining to these comshyponents
812 Singh and Crockard
DISCUSSION
All the quantitative measures ofCSM severity satisfied the most bashysic requirement ofa scale useful in assessing the effects ofsurgery in that they were all able to demonstrate a significant improvement in score following surgery This consistent finding is ofcourse also inshydicative ofa genuine benefit resulting from such intervention Howshyever such an effect would only be properly demonstrated by a study that included a period of follow up longer than 6 months and that included a comparison with a similar group of CSM patients that were not operated upon
Sensitivities of Different Scales
While all the scales showed significant improvement following surshygery they have other properties that make them more or less suitable form assessment of CSM The MDI is sensitive to change and also gives a wide range of absolute values which means there is good sensitivity to differences between patients On the other hand the Ranawat score while being sensitive to change was very poor at distinguishing different levels of absolute severity This study in looking at both pre- and post-operative scores thus illustrates the important point that it is insufficient to attempt validation of scales only on absolute measurements their properties may be considershyably different if the scales are also to be used to assess the effect of operative or other interventions In addition widely differing absoshylute sensitivities between pre- and post-operative measurements sugshygests that different scales may have different applicability to differshyent patient groups For example the Nurick score had a much greater sensitivity post-operatively suggesting a greater ability to distinguish between different levels of severity at the milder end of the scale
Internal Consistency of Different Scales
The multi-part questionnaires had good internal consistency (intershynal reliability) particularly the MDI suggesting that the questionshy
Comparison of Seven Different Severity and Outcome Scales 813
naires were being reliably completed However the high level of reliability may entail some redundancy where very similar questions concentrating on the same aspect of disability are asked repeatedly Even worse ifdifferent aspects ofdysfunction are considered someshytimes to be affected to different degrees in different patients it would seem inappropriate that questions testing these different aspects alshyways score too similarly The lower alpha score when the MDI is divided into categories comparing different aspects does suggest some genuine effect in distinguishing these categories Nevertheless the presence of multiple questions within the same category while not resulting in poorer sensitivity and sensitivity to change does point to redundancy and therefore inefficiency A glance at the questions of the MDI (appendix) reveals that it tends to ask repeated questions on a few limited categories of disability After the initial demonstrashytion of high internal consistency during an initial study indicating that the patients answer the questions reliably perhaps redundant questions could simply be removed when designing an ideal scale used in assessing CSM severity
Intra-rater and inter-rater reliability were not investigated in this study Since the MDI EDM JOA and SF 36 are patient rated inter-rater reliability is irrelevant for such scales Instead internal consistency is a measure of reliability across questions within the questionnaire The Ranawat and Nurick scores are simple and oneshydimensional and have previously been shown to have good intrashyand inter-rater reliability
Correlations between Scales
Possible flaws in the scales are suggested when looking at correlashytions between the scores on the various scales The concept of intershynal consistency does not necessarily imply validity and accuracy ic whethcr or not a scale is actually measuring what it purports to meashysure (Wassertheil-Smoller 1995) Scales are ideally validated by comshyparing them with a gold standard This is most relevant when they are used as a convenient surrogate for a gold standard definitive inshyvestigation that is invasive risky or cumbersome or perhaps when
814 Singh and Crockard
used to predict an outcome that eventually becomes clear over time In the absence of a gold standard in CSM the scales were simply correlated with each other to see if certain inconsistencies became apparent
It was found that while correlations between similar scales were sometimes high correlations between recorded operative changes were poor This is because change is likely to be a much more sensitive indicator of dissimilarities between scales For exshyample if a patient generally scores well on different scales pre-opshyeratively and there is only a small post-operative improvement the changes may well be in different directions on the different scales while the post-operative absolute scores all still remain generally high These highlighted differences between scales could reflect aspects of change that some scales measure which others ignore Thus a mildly affected patient may generally score quite highly but operashytive decompression might change certain aspects much more than others This point again illustrates the importance ofvalidating scales by looking at changes rather than confining assessment to patients in the static state
Breakdown of Scales into Components
To explore the possibility that different scales measure different asshypects of function the individual scales were subdivided on empirical grounds into different functional components There were indeed difshyferences between components with hand function showing the greatshyest improvement walking showing moderate improvement and bladshyder function showing minimal improvement However these results must be interpreted with caution since they could reflect that differshyent scales are simply better at measuring changes in different aspects of function rather than there being real differences in change of funcshytion Indeed when one actually correlates these different aspects of function by correlation of the components between the scales the coefficients are often no better than for the overall scales throwing doubt upon the validity of making strong inferences about the sepashyrate components of a scale This finding also suggests that the poor
Comparison of Seven Different Severity and Outcome Scales 815
overall correlations of improvement between the overall scales canshynot be explained on the basis that the different scales record different aspects of this improvement but instead lead one to question the validity of some or all of the scales On review of individual pashytients responses it is clear that apparently similar single questions are sometimes answered very differently in different scales possibly due to the phrasing of such questions
An important precept of a multi-part scale is that there is an overall unidimensionality ie overall severity Thus the scale simshyply adds all the different components from which patients with myshyelopathy might suffer No hierarchy of components is considered at all other than perhaps more questions being asked on areas that are more important for patient functioning This study has addressed the relationship between the components of different scales and found that particularly when looking at changes in severity this unidimenshysionality cannot be applied - some components deteriorate while othshyers improve and there is no consideration ofwhich are more imporshytant
CONCLUSIONS
An ideal scale should be as quantitative as possible and show good sensitivity between patients and sensitivity to change It should also be scored reliably and be simple to use Of the scales investigated the MDI best reflects these characteristics This scale constitutes a questionnaire that focuses upon a limited range ofaspects ofdisabilshyity the findings indicate that such a scale does not necessarily suffer in terms of sensitivity Instead repeated questioning on similar asshypects of function may reflect redundancy Moreover the poor correshylations between the operative changes recorded by the overall scales and their components indicates that repeated questions on different or even similar aspects of function may actually reveal considerable inconsistencies Thus while a scale such as the MDI appears to be adequate for a prospective outcome trial ofintervention in CSM it is possible that an ideal scale might be one that makes a simple single quantitative measurement on a limited aspect of function
816 Singh and Crockard
APPENDIX
MYELOPATHY DISABILITY INDEX
Please tick the response which best describes your usual abilities over the past week
Without ANY difficulty
With SOME difficulty
With MUCH Difficulty
UNABLE to do so
Score 0 1 2 3
Rising are you able to
Stand up from an annless straight chair
Get in and out ofbed
Eating are you able to
Cut your meat
Lift a fun cup or glass to your mouth
Walking are you able to
Walk outdoors on a flat ground
Climb up five steps
Hygiene are you able to
Wash and dry your entire body
Get on and otT the toilet
Grip are you able to
Open jars which have been previously opened
Activities are you able to
Get in and out of the car
Dressing are you able to
Dress yourself include tying shoelaces and doing buttons on your shirt or blouse
TOTAL A B C D
Note If aids or assistance from another is required to perform any of the tasks please score the activity as with much difficulty Total score = A + B+C + D (range 0-33) The final score is expressed as a percentage
Comparison of Seven Different Severity and Outcome Scales 817
ACKNOWLEDGEMENTS
We would like to acknowledge Mr Adrian Casey Mr William Harkness Mr Neil Kitchen Mr Michael Powell Professor David Thomas and Mr Lawrence Watkins for allowing us to study their patients
REFERENCES
CaIman Kc (1994) The ethics of allocation of scarce health care resources a view from the centre J Med Ethics 1994 June 20(2) 71-4
Casey ATH Bland J M and Crockard H A (1996) Developshyment of a functional scoring system for rheumatoid arthritis patients with cervical myelopathy Annals of the Rheumatic Diseases 55901-906
Clarke E and Robinson PK (1956) Cervical myelopathy a complication ofcervical spondylosis Brain 79 483-510
Cronbach L J and Meehl P E (1955) Construct validity in psyshychological tests Psychological Bulletin 52281-302
Herdman J Linzbach M Krzan M et al (1994) The European myelopathy score In Bauer BL Brock M Klinger M eds Advances in Neurosurgery Berlin Springer 266-8
Hirabayashi K et al Operative results and post-operative progresshysion of ossification among patients with cervical osteophytic posterior longitudinal ligament Spine 1981 6354 364
Nurick S (1992) The Pathogenesis ofthe Spinal Cord Disorder As sociated with Cervical Spondylosis Brain 95 87-100
818 Singh and Crockard
Odom GL Finney W and Woodhall B (1958) Cervical disc leshysions JAMA 16623 - 28
Phillips DG (1973) Surgical treatment ofmyelopathy with cervishycal spondy losis J Neurol Neurosurg Psychiatry 36879 shy884
Ranawat C OLeary P Pellici P et al (1979) Cervical fusion in rheumatoid arthritis Journal ofBone and Joint Surgery
America 61A 1003-10 Rowland L P (1992) Surgical treatment of cervical spondylotic
myelopathy time for a controlled trial Neurology 42(1) 5shy13
Singh A and Crockard H A (1999) Quantitative assessment of cervical spondylotic myelopathy by a simple walking test Lancet 1999 Ju131 354(9176) 370-3
Ware JE and Sherbourne C D (1992) The MOS 36-item ShortshyForm Health Survey (SF-36) I Conceptual framework and item selection Med Care 30473-83
Wassertheil-Smoller S (1995) Biostatistics and Epidemiology - A Primer for Health Professionals Springer - Verlag New York Inc
JOURNAL OF OUTCOME MEASUREMENTreg 5(1)819-838 Copyrighteurogt 2001 Rehabilitation Foundation Inc
The Impact of Rater Effects on Weighted Composite Scores Under Nested and Spiraled Scoring Designs Using the Multifaceted Rasch Model
Husein M TaherbhaF Learning Research and Development Center
University of Pittsburgh
Michael James Young Harcourt Educational Measurement
Constructed-response or open-ended tasks are increasingly used in recent years Sin(e these tasks cannot be machine-scored variability among raters cannot be completely eliminated and their effects when they are not modeled can cast doubts on the reliability of the results Besides rater effects the estimation of student ability can also be impacted by differentially weighted tasksitems that formulate composite scores This simulation study compares student ability estimates with their true abilities under different rater scoring designs and differentially weighted composite scores Results indicate that the spiraled rater scoring design without modeling rater effects works as well as the nested design in which rater tendencies are modeled As expected differentially weighted composite scores have a conshyfounding effect on student ability estimates This is particularly true when openshyended tasks are weighted much more than the multiple-choice items and when rater effects interact with weighted composite scores
FOOTNOTE IAuthors names appear in alphabetical order
Requests for reprints should be sent to Husein M Taherbhai University of Pittsburgh Learning Research and Development Center University ofPittsburgh 3939 OHara St Room 802 Pittsurgh PA 15260
819
820 Taherbhai and Young
INTRODUCTION
Constructed response or open-ended tasks have been increasingly used in assessments in recent years Since these tasks cannot be mashychine-scored trained raters are used to score them In a crossed deshysign where every rater scores every task of every examinee the reshycovery of the examinee abilities in simulation studies is very accushyrate (Hombo Thayer amp Donoghue 2000) However because oftime and cost considerations it is impossible for every rater to rate all examinees When fully crossed designs are not used variability among raters cannot be completely eliminated and when rater effects are not modeled biased ability estimates can result Hombo and her colshyleagues however found that spiraled designs for assigning raters to the scoring oftasks performed better than nested designs in reducing the bias of ability estimates
Besides rater effects the use ofcomposite scores that apply a priori weights to items and tasks from different formats (eg the College Boards Advanced Placement examinations (College Board 1988)) can also have an effect in the estimation of student ability These composite scores can have a confounding effect on examinee abilities when they interact with rater effects (Taherbhai amp Young 2000)
Taherbhai and Young (2000) used data from the Reading Basic Understanding section ofthe New Standards English Language Arts (ELA) Examination to study the interaction ofrater effects with composite scores The New Standards ELA Examination consisted ofboth multiple- choice items (MC) and open-ended (OE) tasks The data were used to form different weighted composite scores which were then analyzed for rater effects using the multifaceted Rasch model Results indicated that the interaction of rater effects with the weighted composite scores could dramatically alter the estimates of student abilities
This study examines the impact of rater effects on weighted composite scores under nested and spiraled scoring designs Raters are modeled to reflect a nested design (ie raters scoring all tasks across a subset ofexaminees) and a spiraled design (ie raters SCOfshy
Rater Impact on Weighted Composites - 821
ing a subset of tasks across all examinees) across a complex strucshyture ofdifferentially weighted composite scores Examinee ability is then modeled using the multifaceted Rasch model
The primary purpose of this study was to examine how well the ability parameters of examinees are recovered under different rating designs using conditions of rater effects and differentially weighted composite scores The study also examined the effects of raters on composite scores for student classifications based on cutpoints
Design and Methodology
Various log linear models can be used to analyze the hypothesis of rater and weight effects in scoring the open-ended sections of an exshyamination One such model in Item Response Theory is the multishyfaceted Rasch model which can provide information on examinees items raters and their interactions for ordered response categories (Linacre 1989) The resulting probabilistic equation for a modified rating scale model (Andrich 1978) incorporating the different meashysurement facets (ie examinees raters and items) can be presented in logarithmic form as
(1)
where
Pnijk = probability of examinee n being rated k on item i by raterj
Pnijk = probability of examinee n being rated k-l on item i by rater j
fln = ability of examinee n
0 = difficulty of item i
Aj = severity of rater j
Tk = difficulty in rating step k relative to step k-l
822 Taherbhai and Young
The parameters of this model can be estimated using the FACETS program of Linacre (1989)
PROCEDURE
Simulated Data Generation
Data incorporating rater effects under the many-faceted Rasch model were simulated Response data were generated for a test conshysisting of20 dichotomously scored multiple-choice (MC) items and 3 open-ended (OE) (ie constructed response tasks) each scored on a 0 to 4 rubric The data set consisted of 12 equally spaced true stushydent ability (or thetas) from -200 to 200 Each of these true thetas was used to create 1000 sets of examinee responses giving a total examinee sample size of 12000 Besides true student abilities the following parameters were included in the generation of data
1 Item Difficulty Parameters The twenty multiple-choice item difficulty parameters were selected so that they were evenly spaced in the interval from -200 to 200 The three open-ended tasks were simulated with item difficulty parameters of -100 000 and 100 respectively The four step parameters on a rubric of0 to 4 were kept constant across the open-ended items at -100 -033 033 and 100
2 Rater Parameters The three rater parameters that were used for this study were -050000 and 050 The size of these rater pashyrameters reflects those seen in Taherbhai and Young (2000)
Scoring Designs
Two scoring designs nested and spiraled were considered in this study In the nested condition each rater scores all tasks for a subset ofthe examinees Under this design biased estimates ofstudent ability can occur depending on the combination of rater with student abilshyity For example a lenient rater whose tendency is to award a higher score than what the examinee actually deserves could have a group of examinees of high ability Similarly a severe rater whose tenshydency is to award a lower score than what the examinee actually deserves could rate a group of examinees of low ability
As Rombo et al (2000) explain extreme raters tend to pull
Rater Impact on Weighted Composites - 823
the Item Response Function (IRF) in the direction of the raters ratshying tendency That is lenient raters tend to shift the IRF to the left or down the ability scale while severe raters tend to shift the IRF to the right or up the ability scale By the same token moderate raters (those who are neither too lenient nor too severe) should have a moderate effect on student ability estimates
Under the spiraled design each rater scores only a subset of tasks for all of the examinees However the tasks are rotated so that raters are crossed with respect to students and tasks but rate only some tasks for some examinees and other tasks for other examinees Under this condition too there are various rater and examinee comshybinations that could result in biased estimations ofexaminee ability
Since this paper does not profess to exhaust all possible rater design of interest two designs were selected to illustrate the results of certain patterns of assignment of raters
Nested Design
Under this design the lenient rater rated the lowest ability examinshyees across all replications the moderate rater rated the moderate ability examinees across all replications and the most severe rater rated the highest ability examinees across all replications Since each rater rated four students whose performances were replicated 1000 times on the OE tasks the total number of ratings performed by each rater was 12000
This combination of raters and examinees was selected beshycause according to Hombo et als (2000) results this nested design (their Nested Design 1) was the one those that showed the greatest deviation in the recovery of the true ability parameters for extreme scores when rater effects were ignored FurthernlOre in our case this combination ofraters and examinees would also give us a chance to examine the effects of moderate raters on examinee ability estishymates
Spiraled Design
Under this design each exanlinee was rated by a different rater on
824 Taherbhai and Young
on each ofthe three tasks Specifically the first examinees first task was scored by the lenient rater their second task by the moderate rater and their third task by the severe rater For the second examshyinee the assignment of raters to tasks rotated so that the moderate rater scored the first task For the third examinee the rater assignshyment rotated yet again so that the most severe rater scored the first task This rotation of scoring pattern was then repeated for the reshymaining students These ratings were awarded as in the nested de-
Table 1 Assignment of Raters in Nested and Spiraled Designs
Nested Designs Spiraled Designs
Examnees OE OE OE OE OE OE
Task Task 2 Task 3 Task Task 2 Task 3
Rater 1 Rater 1 Rater 1 Rater 1 Rater 2 Rater 3
2 Rater 1 Rater 1 Rater 1 Rater 2 Rater 3 Rater 1
3 Rater 1 Rater 1 Rater 1 Rater 3 Rater 1 Rater 2
4 Rater 1 Rater 1 Rater 1 Rater 1 Rater 2 Rater 3
5 Rater 2 Rater 2 Rater 2 Rater 2 Rater 3 Rater 1
6 Rater 2 Rater 2 Rater 2 Rater 3 Rater 1 Rater 2
7 Rater 2 Rater 2 Rater 2 Rater 1 Rater 2 Rater 3
8 Rater 2 Rater 2 Rater 2 Rater 2 Rater 3 Rater 1
9 Rater 3 Rater 3 Rater 3 Rater 3 Rater 1 Rater 2
10 Rater 3 Rater 3 Rater 3 Rater 1 Rater 2 Rater 3
11 Rater 3 Rater 3 Rater 3 Rater 2 Rater 3 Rater 1
12 Rater 3 Rater 3 Rater 3 Rater 3 Rater 1 Rater 2
Note Rater 1 is Lenient Rater 2 is Moderate Rater 3 is Severe
Rater Impact on Weighted Composites - 825
sign across all replication for each student perfonnance Under this design too each rater rated every student on 1000 perfonnance repshylications for a total of 12000 ratings This particular spiral design was a modification of Hombo et aIs (2000) Spiral Design 1 The details of assigning raters to tasks and examinees for the nested and spiraled designs are shown in Table 1
Weights Assigned to Items and Tasks
In order to analyze the impact of differentially weighting multipleshychoice items and open-ended tasks four different composite scores were created Each composite was created with the method used by the Advanced Placement Program (College Board 1988) where the part scores for multiple-choice items and open-ended tasks are asshysigned weights to create a composite score with a target set of pershycentages for a fixed total
The first composite represented a baseline condition where equal weights were used for the part scores that is the parts are naturally weighted with respect to MC and OE totals Composites 12 and 3 used different part weights to produce scores with multiple-choice to open-ended contributions of 75-to-25 50-to-50 and 25shyto-75 respectively in the total scores
These different composite scores were used with rater effects for the nested and spiral designs discussed above and also without the inclusion of rater effects to produce various scoring designs
Data Analysis
In order to establish a common metric for comparing the different composite scores all of the item task and item-step difficulty pashyrameters were considered fixed across different designs and weightshying conditions The calibrations of the composites were anchored to these itemtask parameter estimates when producing Rasch paramshyeter estimates pertaining to examinee ability rater severity and OE tasks step difficulty The Rasch ability estimates were found for each composite score point on each weighted composite scale under each of the two scoring dcsigns discussed above
826 Taherbhai and Young
The FACETS program uses Unconditional Maximum Likelishyhood estimation (UCON) for estimating examinee abilities In this study examinee ability parameters used to generate data for examshyinee responses were considered as true examinee abilities The exshyaminee abilities that became infinite due to a zero or perfect score were adjusted by a fractional score adjustment of 03 Ability estishymates corresponding to zero scores were instead estimated for a score of 03 while abilities for perfect scores were instead estimated for the maximum obtainable raw score minus 03 With respect to the weights assigned to items and tasks the FACETS program uses the assigned weights as mutiplicative factors of the scores earned by the exammees
As in Hombo et al (2000) two measures of accuracy in estishymating examinee abilities were examined the squared bias and the mean squared error (MSE) These measures were calculated as folshylows
1000 2
I ( ()estillUlted - ()true)MSE = un-I_________
1000
Cutpoints at the quartiles ofthe Rasch ability estimates for the various composite scores without rater effects were compared with each other and then with the modeling of rater effects to examine changes in student classifications across the different composites
RESULTS
Table 2 presents true examinee ability parameters the squared bias and the mean squared errors across the two designs and across the two rater effects conditions ie modeled and not modeled
Rater Impact on Weighted Composites - 827
Parameter Recovery for Baseline Weighting
Under the nested design without modeling rater effects the expected pattern of examinee ability estimates was generally observed That is when rater effects were not modeled the impact of the severe rater was to move the estimates of examinees at the higher ability levels downward and for the lenient rater to move the estimates of examinees at the lower abilities upward The impact ofignoring rater tendencies under the nested design is clear from Figure I which show the estimated vs true ability estimates for the modeled and non-modshyeled rater effects under the baseline weighting When rater effects were modeled the ability estimates were pulled much closer to a 45shydegree line (see Figure 2)
Both the squared bias and the mean square errors are reduced for extreme raters when they are modeled in the nested design
Under the spiraled design there is a slight overall increase in bias from the nonmodeled rater condition to the modeled rater condishytion However the difference at each ability level is fairly small so that the two ability estimate plots coincide through most ofthe abilshyity distribution (see Figures 3 and 4) Overall the mean square errors are slightly higher under the spiraled design when raters are modshyeled
When the spiraled design is compared to the nested design under the nonmodeled rater condition both the squared bias and the mean square errors are decreased When raters are modeled there is an overall increase in the mean square errors from the nested to the spiraled design However there is no noticeable difference in the squared bias between the two designs
In general the squared bias under the spiraled design with nonmodeled raters is lower than for the nested design with nonmodeled raters and is comparable to modeled rater conditions These results concur with the finding of Hombo et al (2000) that support the notion that when ratings are spiraled rater effects get spread across examinees and the recovery ofability estimates is fairly accurate However the spiraled design did show slightly larger mean square errors than the nested design when raters were modeled
828 Taherbhai and Young
Table 2 Estimation of Squared Bias and Mean Square Effects
Rater Effects Not Modeled
True Nested Design Spiraled Design Theta Baseline Compo 1 Compo 2 Compo 3 Baseline Compo 1 Compo 2 Compo 3
-200
Sqd Bias 000 000 001 002 000 000 000 000 MSE 038 040 041 067 040 042 043 070
-164
Sqd Bias 001 000 002 005 001 001 001 004 MSE 026 027 031 053 028 029 031 057
-127 Sqd Bias 002 001 004 009 001 001 001 003
MSE 022 022 026 042 022 023 024 043 -091
Sqd Bias 004 002 007 014 000 000 001 001 MSE 021 020 025 041 016 018 017 024
-055 Sqd Bias 000 000 000 000 000 000 000 000
MSE 017 018 018 029 016 017 017 027
-018 Sqd Bias 000 000 000 000 000 000 000 000
MSE 017 018 019 029 017 018 019 029 018
Sqd Bias 000 000 000 000 000 000 000 000 MSE 016 017 018 027 014 015 014 020
055 Sqd Bias 000 000 000 000 000 000 000 001
MSE 017 019 018 028 016 018 018 027 091
Sqd Bias 004 002 006 011 000 000 000 om MSE 022 021 026 042 019 020 020 034
127 Sqd Bias 003 001 004 009 001 000 001 001
MSE 022 023 026 042 018 021 019 030 164
Sqd Bias 001 000 002 005 001 001 002 006 MSE 027 029 031 051 031 033 034 062
200 Sqd Bias 001 000 002 003 001 001 001 006
MSE 036 038 040 063 040 043 042 075
Rater Impact on Weighted Composites - 829
Errors Across Designs for Nonmodeled and Modeled Rater
Rater Effects Modeled
Nested Design Spiraled Design Baseline Compo 1 Compo 2 Compo 3 Baseline Compo 1 Compo 2 Compo 3
001 001 001 003 002 002 002 007 037 040 040 065 042 045 047 083
000 000 001 001 001 001 001 005 024 025 027 048 028 029 031 060
000 000 000 000 000 000 001 002
019 021 021 033 021 023 023 041
000 000 000 000 000 000 000 000 016 018 018 027 018 020 019 031
000 000 000 000 000 000 000 000 016 017 018 028 016 017 017 027
000 000 000 000 000 000 000 000 017 018 018 028 017 017 018 028
000 000 000 000 000 000 000 000 015 016 017 026 016 017 018 028
000 000 000 000 000 000 000 000 017 018 018 027 016 017 017 026
000 000 000 000 000 000 000 001 018 019 019 030 019 020 020 034
000 000 000 000 000 000 000 001 019 021 020 032 020 022 022 038
000 000 000 001 001 001 001 006 025 027 027 045 031 033 033 060
000 000 000 002 001 000 001 006 034 037 036 060 041 044 043 077
euro c 0(
C
IV
1
150
0
050
0
E
-25
00
-15
00
050
0 1
500
tl w
-15
00
(Xl
Fig
ure
1
Est
imat
ed v
s T
rue
Abi
lity
W
eigh
ted
Nes
ted
Des
ign
Wit
hout
Rat
ers
Mod
eled
w
o
250
0 1-3 ~ ~ =shy = =
== ~
~
o =
(JCl ==
250
0
-25
00
True
Ab
ility
~B
asel
ine ~
Com
posi
te 1
-
-C
om
po
site
2 -
-
Co
mp
osi
te 3
Fig
ure
2
Est
imat
ed v
s T
rue
Abi
lity
W
eigh
ted
Nes
ted
Des
igns
Wit
h R
ater
s M
odel
ed
250
c ~
I g ~
n o =
~
~ I1Q
250
0 =shy shy
l (j o 3 tl o til shy til
-25
0
Tru
e A
bili
ty
00
w
~
Bas
elin
e ~
Com
posi
te 1
-~
--
Com
posi
te 2
)(
C
ompo
site
3
g ~ tI ~ E
-25
00
-20
00
I
III
W
150
050
-15
00
-10
00
050
0 1
000
150
0 2
000
-15
0
832 Taherbhai and Young
Parameter Recovery for Weighted Composites
Across the weighted composites the mean squared errors increased as the weight assigned to the OE tasks increased This was true for both the nested and spiraled designs regardless of whether or not rater effects were modeled The squared bias on the other hand was fairly constant except for the ends of the ability distribution in Comshyposite 3
For the nested design when rater effects were not modeled and weights were included in the analysis the rater effects interacted with the weights assigned to the composite The composites with the highest OE task weights showed the greatest impact on the estimates ofexaminee ability at ends of the distribution (Figure 1) This is due to the effect of the extreme raters scoring exanlinees at the low and high ends of the ability distribution When rater effects are modeled the recovery of examinee abilities improves at the extreme ends of the ability distribution (Figure 2) Changes in OE task weights had little effect on the estimation of examinees of moderate abilities reshygardless of the modeling of raters since these were the examinees scored by moderate raters
Plots of the estimated vs the true abilities for the spiraled design composites are shown for the non-modeled rater effects in Figure 3 and for the modeled rater effects in Figure 4 With the exshyception of Composite 3 the recovery ofparameters was fairlyaccushyrate for the spiraled design regardless of whether the rater effects were modeled The modeling of raters in Figure 4 had the effect of straightening the plots in Figure 3 except for Composite 3 which has the greatest weight placed on OE tasks of all of the composites Contrary to the decrease in squared bias the mean square errors inshycreased slightly from the non-modeled rater condition to the modshyeled rater condition when the OE task weights in the composites inshycreased
Student Classification at the Quartiles for Different Composshyites
When cutpoints at the quartiles were examined (Table 3) under the two designs and the different weighting conditions the results did
Fig
ure
3
Est
imat
ed v
s T
rue
Abi
lity
W
eigh
ted
Spi
rale
d D
esig
ns W
itho
ut R
ater
s M
odel
s
250
0
200
0
150
0
euro c laquo C
IIgt
1U
E
t
w
-25
00
-15
00
100
0
050
0
-10
00
050
0
-15
00
-20
00
-25
00
Tru
e A
bilit
y
to
-B
ase
line
-0
--
Co
mp
osi
te 1
-
-shy--
Co
mp
osi
te 2
=c
~ (
) a C
~
f) o =
~
()
150
0 2
500
(JQ
=shy shy Q
()
o a C
o f- (
)
f-
00
J
)
)(
Co
mp
osi
te 3
J
)
00
g ~ CI
Ggt
1U
150
0
050
0
E
-25
00
-20
00
-15
00
-1
000
050
0 1
000
150
0 2
000
~
w
-15
00
Fig
ure
4
Est
imat
ed v
s T
rue
Abi
lity
W
eigh
ted
Spi
rale
d D
esig
ns W
ith
Rat
ers
Mod
els
w
Jgt
250
0 ~ =shy ~
I C =shy ~ ~ = ~ ~ Q
=
IJC =
250
0
-25
00
True
Abi
lity
-
Bas
elin
e --
O--
Co
mp
osit
e 1
bull
Com
posi
te 2
)0
( C
ompo
site
3
m
Rater Impact on Weighted Composites - 835
not differ much from Taherbhai and Youngs (2000) results Rere again there was little movement from one condition to another unshyder the two designs and consistency in examinee classification was very high
CONCLUSIONS
The impact of rater effects is well documented in the literature (Engelhard 1994 1996 Rombo et aI 2000 Linacre 1989 Lunz et aI 1990) The composite effect of weighing Me items and OE tasks differentially however has not received much attention
Under the nested design when very severe or lenient raters are paired with examinees at the ends of the ability distribution exshyaminee ability estimates can be systematically distorted As LUllZ Wright and Linacre (1990) point out ifraters are used to score tasks for assessments and their effects are not modeled it may lead to poor ability estimates especially if extreme raters are paired with examinshyees that are extreme in their abilities Furthermore weighing items and tasks differentially confounds rater effects and further complishycates the recovery of true ability estimates of examinees
The use of spiraled over nested designs when rater effects are not modeled was justified in Rombo et aI (2000) due to the deshycrease in bias that these designs provided in estimating examinees abilities This result is supported by our study The recovery of exshyaminee abilities and the overall MSEs was better for spiraled designs than nested designs when rater effects where not modeled The spishyraled design with unmodeled rater effects was also comparable to the modeled nested design except for the very slight increase in MSE
However any advantage that the spiraled design has in reshyducing the bias ofability estimates decreased when composite scores were used that placed much greater weights on open-ended tasks than those on the multiple-choice items In this situation the bias and the MSE increased not only for the unmodeled nested design but also for both the modeled and the unmodeled spiraled designs
As stated in the paper this study is not exhaustive of all the possible rater designs and weighted conditions that could be included Further research needs to be undertaken to examine the complex inshy
836 Taherbhai and Young
Table 3 Percent of Students Changing Classification with Respect to Quartiles
Nested Design Spiralled Design
Oassification Change Oassification Change
ConditionlCutpoint Up own Up Down
Baseline
Rater Effects Modeled vs Not
Modeled
Q3 3
Median
QI 2
Rater Effects Not Modeled
Baseline vs Corrposite I
Q3 2
Median
QI 2
Baseline vs Corrposite 2
Q3 3
Median
QI Baseline vs Corrposite 3
Q3 3
Median
QI
Rater Effects Modeled
Baseline vs Corrposite I
Q3 Median
QI Baseline vs Corrposite 2
Q3
Median
QI Baseline vs Corrposite 3
Q3
Median
QI
Rater Impact on Weighted Composites - 837
teraction of raters tasks and examinee abilities when creating spishyraled designs and applying them to assessments that use weighted composite scores It would also be interesting to obtain results under the spiral design when the number of raters are more than the tasks that have to be rated Under this condition a semi-nestedspiral deshysign would exist in which a sub-set of students would be rated by some raters while another sub-set would be rated by a different group of raters The raters within a subset however would be spiraled
This paper should serve as a warning for obtaining composite scores by increasing the weights ofOE tasks relative to the MC items for less than substantive reasons and also for unknowingly pairing extreme raters with extreme-ability-students when the spiraled deshysign is not used or under the nested design without modeling rater effects
REFERENCES
Andrich D (1978) A rating formulation for ordered response categories Psychometrika 43 561-563
College Board (1988) The College Board technical manual for the Advanced Placement Program New York NY College Entrance Examination Board
Engelhard G (1996) Evaluating rater accuracy in performance asshysessments Journal ofEducational Measurement 31 (1) 56-70
Engelhard G (1994) Examining rater errors in the assessment of written-composition with the many-faceted Rasch model Jour nal of Educational Measurement 31(2) 93-112
Hombo C M Thayer D T amp Donoghue 1 R (2000) A simulashytion study of the effect ofcrossed and nested rater designs on ability estimation Paper presented at the annual meeting ofthe National Council on Measurement in Education New Orleans LA
Linacre 1 M (1989) A users guide to FACETS Rasch measure ment program and Facform data formatting computer program Chicago IL MESA Press
838 Taherbhai and Young
Linacre1 M (1993) Many-facet Rasch measurement Chicago IL MESA Press
Lunz M E Wright B D amp Linacre 1 M (1990) Measuring the impact ofjudge severity on examination scores Applied Mea surement in Education 3(4) 331-345
Taherbhai H M amp Young M 1 (2000) An analysis ofrater impact on composite scores using the multifaceted Rasch model Pashyper presented at the annual meeting of the National Council on Measurement in Education New Orleans LA
JOURNAL OF OUTCOME MEASUREMENT7 5(1) 839-863
Copyright8 2000 Rehabilitation Foundation Inc
Measuring disability application of the Rasch model
to Activities of Daily Living (ADLIIADL)
T Joseph Sheehan PhD
Laurie M DeChello
Ramon Garcia
Judith FifieldPhD
Naomi Rothfield MD
Susan Reisine PhD
University ofConnecticut School ofMedicine amp
University ofConnecticut
Requests for reprints should be sent to T Josep Sheehan University of Connecticut School ofMedicine 263 Farmington Ave Farmington CT 06030
839
840 SHEEHAN et al
This paper describes a comparative analysis of (ADL) and (IADL) items administered to two samples 4430 persons representative of older Americans and 605 persons representative of patients with rheumatoid arthrisit (RA) Responses are scored separately using both Likert and Rasch measurement models While Likert scoring seems to provide information similar to Rasch the descriptive statistics are often contrary if not contradictory and estimates of reliability from Likert are inflated The test characteristic curves derived from Rasch are similar despite differences between the levels of disability with the two samples Correlations ofRasch item calibrations across three samples were 71 76 and 80 The fit between the items and the samples indicating the compatibility between the test and subjects is seen much more clearly with Rasch with more than half of the general population measuring the extremes Since research on disability depends on measures with known properties the superiority ofRasch over Likert is evident
INTRODUCTION Physical disability is a major variable in health related research Assessing the degree ofdifficulty in performing Activities ofDaily Living (ADL) and Instrumental Activities ofDaily Living (IADL) scales is a common way to measure physical disability Individuals are asked how much difficulty they have in performing activities ofdaily living such as dressing getting up from a chair or walking two blocks For each activity there are 4 possible responses no difficulty some difficulty much difficulty or unable to do Responses are scored from 1to 4 or from 0 to 3 summed across all items and averaged to yield a disability score the higher the average the greater the disability These well-validated scales are efficient and widely used but their ordinal scaling can result in distortion by masking ineffective treatments or hiding effective procedures (Merbitz Morris amp Grip 1989)
Ordinal scales do not have any obvious unit ofmeasurement so that addition and division ofunknown units is considered meaningless Wright and Linacre (Wright amp Linacre 1989) have argued that while all observations are ordinal all measurements must be interval ifthey are to be treated algebraically as they are in computing averages The Rasch (Rasch 1980) measurement model offers a way to create interval scales from ordinal data a necessary condition for averaging or analyzing in statistical models that assume interval data
MEASURING DiSABILITY 841
As Wright and Linacre (Wright amp Linacre 1989) maintain computing an average score implies a metric that is only available with an interval scale In addition those average scores are non-linear and thereby lack a fimdamental property assumed in all measurers from yardsticks to financial worth that the measures increase along a linear scale Recognition of this problem is not new Thorndike (Thorndike 1904) identified problems inherent in using measurements ofthis type such as the inequality ofthe units counted and the non-linearity ofraw scores This study demonstrates how the Rasch measurement model converts non-linear ordinal data to a linear interval scale that provides new information about the utility ofcommonly used measures ofdisability While demonstrating the application ofthe Rasch model is the main purpose ofthis study it also includes a number ofcomparisons Rasch person measures are compared to Lickert person scores Rasch item calibrations are compared to Lickert item scores Rasch item calibrations estimated on a sample of older Americans are compared to item measures estimated on a sample of American rheumatoid arthritis (RA) patients and to those same items estimated on a sample ofBritish RA patients These comparisons should enhance understanding ofthe strengths and perhaps limitations ofusing the Rasch model in practice
Background
Before considering Rasch there is an alternative to averaging ranked data and treating them as interval and that is to simply treat them as ranked data Responses to each ADL item can be rank ordered ie no difficulty is less than some difficulty is less than much difficulty is less than unable to do so that responses to the ADL tasks can be ordered Also the ADL tasks themselves can be ordered For instance for most people walking two blocks is more difficult than lifting a cup or a glass to ones mouth It is easy to imagine individuals who though completely unable to walk two blocks would have no difficulty lifting a full cup or glass Because items can be ordered according to a scale of inherent difficulty ADL items have been organized into hierarchies and disability status is determined by where a persons responses fall along the ordered
842 SHEEHAN et al
hard-to-easy hierarchy One such scoring scheme was proposed by Katz (Katz Downs Cash amp Grotz 1970) the creator ofthe original six item ADL scale Another step-wise scoring scheme was recently reported by S01111 (S01111 1996)
Lazaridis and his colleagues (Lazaridis Rudberg Furner amp Casse 1994) studied the scalabilityofselected ADL items using criteria associated with Guttman scales For Guttman (Guttman 1950) a set ofitems is a scale ifa person with a higher rank than another person is just as high or higher on every item than the other person Lazaridis found that the Katz scoring scheme fulfilled Guttmans scaling criteria Lazaridis and his colleagues went further however and showed that the Katz hierarchy was one of360 possible hierarchies based upon permutations ofsix ADL items Lazaridis tested all 360 ofthese hierarchies using the same Guttman scaling criteria and found four additional scoring schemes that performed equally as well as Katz and found a total of103 scoring hierarchies that satisfied minimum standards ofscalability according to Guttman
While Guttman scaling does not violate the ordinal nature ofthe scales neither does it produce measures suitable for outcomes analyses that assume interval scaled measures Also Guttmans measurement model is deterministic rather than probabilistic and assumes that responses fall along a single hierarchy in a fixed order The Guttman model would have difficulty WIth that rare individual who was able to walk two blocks but unable to lift a full cup to hislher mouth Daltroyet al tested a Guttman scale of ADL items to determine whether musculoskeletal function deteriorates in an orderly fashion (Daltroy Logigian Iversen amp Liang 1992) They recommended that lifting a cup be dropped because it was too easy We discuss the item later Furthermore the fact that there is not a single hierarchical scale but as many as 103 different hierarchies underlying Katz six original ADL items exposes the disadvantage ofa rigid and deterministic hierarchy Amore attractive approach would capture the probabilistic nature ofthe responses without losing the concept ofa hierarchical scoring function The Rasch measurement model provides such an alternative
Rasch a Danish statistician interested in measuring spelling ability created a probabilistic measurement function which simultaneously
MEASURING DiSABILITY 843
estimates the abilities ofpersons and the difficulty oftest items Rasch showed how the probability ofanswering a question correctly depended on two things the ability ofthe person and the difficulty ofthe test item His model estimates person ability and item difficulty simultaneously and shows that the two are independent (Rasch 1980 p 19) Moreover the model provides a common scale for assessing both persons and items The distribution ofitem difficulties can be examined and compared directly to the distribution ofperson abilities on the same scale permitting visual judgments about the appropriateness of these items for these people Furthermore the common scale turns out to be an interval scale that is linear in contrast to the non-interval and non-linear scale calculated from the sum ofthe ranks or the average rank
METHODS
There are two sets ofsubjects used in this study The first set includes 4430 persons who were between ages 50 and 77 during the first National Health And Nutrition Examination Survey (NHANES I) carried out between 1971 and 1975 and who provided complete or nearly complete answers to the 26 ADL items administered during the NHANES Followshyup Study (NHEFS) conducted between 1982 and 1984 There were no initial measures ofphysical disability administered during NHANES I comparable to the ADL items NHANES I was administered to a national probability sample ofthe civilian noninstitutionalized US popUlation (Hubert Bloch amp Fries 1993 Miller 1973)
The persons in the second study group are a nationally representative sample ofpatients with RA (Rei sine amp Fifield 1992) The patients were recruited in 1988 using a two-stage process to ensure that it represented RA patients cared for by board-certified rheumatologists First a sample of 116 board-certified rheumatologists was randomly selected from the membership ofthe American College ofRheumatology In the second stage patients with definite or classical RA were asked to participate as they visited the office over a defined recruitment period Nine hundred twenty-one (88) ofthe patients who initially expressed interest agreed to participate in the panel study Patients were interviewed
844 SHEEHAN et al
yearly by telephone regarding their social physical and emotional fimctioning including their fimctional ability using the Health Assessment Questionnaire (HAQ) (Fries Spitz Kraines amp Holman 1980) The data for the present analysis are from those patients who participated in the sixth year interview ofthe panel study (N=605 66 ofthe original panel) A recent study (Rei sine Fifield amp Winkelman 2000) indicates that those who continued to participate had a higher level ofeducation were more likely to be female had higher social support and fewer joint flares
For comparison ofitem calibrations data on a third set ofsubjects are included 174 from Great Britain diagnosed withRA (Whalley Griffiths amp Tennant 1997) The inclusion ofanotherRA group allows comparison ofitem calibration between groups ofpatients with the same diagnosis and between RA patients and the general popUlation ofolder Americans Person measures were not available for the British RA group
The NHEFS data were extracted from the tapes using SAS (SAS Institute 1989) Initial statistical analyses were performed using SPSS 80 (SPSS 1997) andPRELIS 212 (SSI 1998) Computations for the Rasch model were performed using WINSTEPS (Linacre amp Wright 1998b) a computer program written by Linacre and Wright (Linacre amp Wright 1998a)
Although Rasch created his model with test items which could be scored right orwrong Andrich (Andrich 1988) has extended the Rasch model to rating scales which include items with ordered response alternatives such as those found on the ADL scale Thus each item instead ofbeing scored right orwrong is considered to have two or more ordered steps between response categories The Andrich model estimates the thresholds for each item separating each ordered step from the next that point on a logit scale where a category 1 response changes to a category 2 response a category 2 response changes to a category 3 response or a category 3 response changes to a category 4 response The Andrich model also offers the user a choice between a model that assumes equal steps between categories the rating scale model or a model that actually estimates the distance between categories the partial credit model (Andrich 1978) the latter being used in this study to conform to the
MEASURING DiSABILITY 845
Whalley et al analysis The Rasch analysis estimates the difficulty level ofeach ADL item
and the ability level ofeach person along the same logit scale The Rasch analysis also produces a test characteristic curve which graphs the relationship between each person measure and the expected score based on the sum ofthe ranks the numerator used to compute a Likert score In
this study the test characteristic curve for 19 of26 ADL items from the
NHANES study is compared to the test characteristic curve estimated from 19 of20 parallel items in the Reisine study The 19 items used in the Reisine study are taken from the twenty item Health Assessment Questionnaire (HAQ) (Fries et aI 1980) The 19 HAQ items contain 15 exact matches and 4 items that are very similar to those used in the NHEFS The item abbreviations and full text for both ADL and HAQ are shown in Table 1 One of the 26 ADL items walkfrom one room to another on the same level had too many missing responses to be included in these analyses The parallel item from the HAQ walk outdoors on flat ground was dropped leaving 19 items to compute test characteristic
curves for comparison
RESULTS
The initial analyses showed skewed distributions ofresponses on all 25 ADL items for the NHEFS sample The category 1 responses ranged from a high of953 who had no difficulty lifting a cup to a low of 600 who had no difficulty with heavy chores The category 4 response unable to do an activity is uniformly low under 10 for most items with heavy chores being impossible for 174 A complete table of responses is available from the authors Skewness is also seen in the responses ofthe RA patients although their overall level ofdisability is higher
Figure 1 summarizes person disability measures horizontally and item difficulty level vertically for NHEFS Persons are distributed across the bottom with M marking the mean and S the standard deviation There are 102 persons at the mean (M) of-227 There are 2079 persons at the bottom end ofthe scale who have no difficulty with any ofthe ADL
846 SHEEHAN et al
Table 1
Item abbreviashytion Dresself
Shampoo Arisechr
Inoutbed Makefood Cutrneat Liftcup
Openmilk Wlk2b1ck
Wlk2step
Faucets Bathtub Washbody
Toilet Combhair Reach51b
Pkupclth
Cardoors Openjars
Write
Inoutcar Shop Ltchores
Liftbag
Hvchores
ADL
Dress yourself including tying shoes working zippers and doing buttons Shampoo your hair Stand up from an armless straight chair Get into and out of bed Prepare your own food Cut your own meat Lift a full cup or glass to your mouth Open a new milk carton Walk a quarter mile (2 or 3 blocks) Walk up and down at least two steps Turn faucets on or off Get in and out of the bathtub Wash and dry your whole body Get on and off the toilet Comb your hair Reach and get down a 51b Object (bag of sugar) from just above your head Bend down and pick up clothing from the floor Open push button car doors Open jars which have been previously opened Use a pen or pencil to write with Get in and out of a car Run errands and shop Do light chores such as vacuuming Lift and carry a full bag of groceries Do heavy chores around the house or yard or washing windows walls or floors
Activities ofDailyLivin~ (ADL) and Health Assessment QuestionnaIre items
close match modlfied
HAQ
Dress yourself including tying shoelaces and doing buttons
Shampoo your hair Stand up from an armless straight chair Get in and out of bed
Cut your meat Lift a full glass or cup to your mouth Open a new milk carton
Climb up five steps
Turn faucets on and off Take a tub bath Wash and dry your entire body
Get on and off the toilet
Reach and get down a 51b object from just above your head
Bend down and pick clothing up from the floor Open car doors Open jars which have been previously opened
Get in and out of a car Run errands and shop Do chores such as vacuuming and yard work
MEASURING DiSABILITY 847
items and 15 persons at the right end ofthe scale who were unable to perform any ofthe tasks When extreme persons are included the mean for persons drops from -227 to -393 and the standard deviation increases from 167 to 222 The presence ofso many atthe bottom of the scale draws attention to the floor effects ofthe test at least for the general population ofolder Americans
The right-hand column in Figure 1 orders items from easiest at the top to hardest at the bottom Items at the top ofthe Rasch scale such as lift a cup or turn afaucet on or off are easier than items below with the hardest items at the bottom lift and carry a full bag ofgroceries or do heavy chores around the house or yard To the left ofeach item the responses 123 and 4 are arranged at a location corresponding to the expected measure ofa person who chose that response to that item Thus the expected measure ofa person who responded with a 4 to the easiest item unable to lift afull cup or glass to ones mouth would be slightly greater than 4 or the most disabled end of the scale Whereas the expected measure ofa person who chose category 4 in response to the hardest item and was unable to perform heavy chores would be aboutshy08 almost a standard deviation above the mean person disability measure of -227
Figure 1 also shows a colon () separating the response categories for each item Those separation points are the thresholds between response categories estimated by the Andrich model mentioned earlier The mean item calibration is 00 and standard deviation is 111 It is noteworthy that the mean item calibration ofzero and standard deviation of111 suggests that the item distribution is far to the right ofthe person distribution Also the item standard deviation of 111 suggests far less dispersion among items than the dispersion among persons which reaches 222 when extreme measuring persons are included Such misalignment ofthe item andperson distributions signals serious limitations in using this measure for these persons The distribution of person measures is far lower than the distribution ofitem calibrations indicating a poor fit between this test and these persons at least at the time these items were administered that is the first ofseveral follow-up surveys on the same SUbjects For an ideal test the distribution ofitems and persons should show similar alignments
848 SHEEHAN at al
EXPECIED scxFE MEAN ( INDIaITES HALF-scxFE roINr) -5 -3 -1 1 3 5 7 I---+shy I ITEM 1 1 2 3 4 4 liftrnp 1 1 2 3 4 4 faucets 1 1 2 3 4 4 cxnbhair 1 1 2 3 4 4 toilet 1 1 2 3 4 4 arisEtecl 1 1 2 3 4 4 write 1 1 2 3 4 4 cpenjars 1 1 2 3 4 4 cutrreat 1 1 2 3 4 4 qenmilk 1 1 2 3 4 4 carctors 1 1 2 3 4 4 washIxxiy 1 1 2 3 4 4 dresself 1 1 2 3 4 4 inoutcar 1 1 2 3 4 4 rrekefcxxj 1 1 2 3 4 4 walk2ste 1 1 2 3 4 4 pkuplth 1 1 2 3 4 4 arisedrr 1 1 2 3 4 4 sharrpo 1 1 2 3 4 4 reach5Jb 1 1 2 3 4 4 bathtub 1 1 2 3 4 4 shcp 1 1 2 3 4 4 Itd10res 1 1 2 3 4 4 wlk2blck 1 1 2 3 4 4 lifttag 11 2 3 4 4 hvd10res I---+shy I I -+shy I I ITEM -5 -3 -1 1 3 5 7
2 o 3 211 111 7 5 1 8 3997010877675453322121 1 1 9 3883730403642918894807786977099501673 52 3 2 5 PERSN
S M S Q
Figure 1 Most probable responses items are ordered onthe right hand side with less difficult items on the top Persons are ordered on the bottom with more disabled persons on the right The figure answers the question which category is aperson ofaparticular person measure most likely to choose The distribution ofitem difficulties has amean ofzero and a standard deviation ofl04 The distribution of231 0 non-extreme person measures has amean of-218 and a standard deviation of168 There are 2079 extreme responses at the bottom ofthe scale and 15 extreme responses at the top ofthe scale
MEASURING DiSABILITY 849
The fit may improve as this population ages and becomes more disabled
In contrast the Rasch analysis ofthe RA sample shows a mean of-180 for 563 non-extreme persons indicating a higher level ofdisability than in the general population Also there are only 41 extreme measures 40 with no difficulty on any item and one person was unable to perform any ofthe ADL tasks The misalignment between the item and person distributions is not as severe for the RA patients but the item distribution centered about zero with a standard deviation of096 is still higher and more dispersed than the person distribution It is noteworthy that the mean for non-extreme NHEFS changes little from -227 to -212 when 19 rather than 25 ADL items are used likewise the mean changes little when extreme persons are included -393 to -386
Figure 2 graphs the relationship between person measures for the 25 ADL items and the Likert score the average ofthe sum ofthe ranks The graph demonstrates the non-interval and non-linear nature ofLikert scores Thus while the Rasch measures are linear and use the sanle invariant interval across the entire range ofmeasures the Likert scores are neither linear nor invariant Likert metric is about four times greater in the middle than toward the top or bottom ofthe scale a clear violation ofthe linearity assumption underlying all valid measurement There is a similar curve for the RA sample While Figure 2 shows the curve relating Rasch measures to observed Likert scores Winsteps also produces curves for a test based upon statistical expectations called the test characteristic curves
Figure 3 shows two test characteristic curves based upon a set of 19 ADL items One curve is estimated from the NHEFS sample the second curve from patients with Rheunlatoid Arthritis (RA) (Rei sine amp Fifield 1992) The NHEFS sample is slightly older on average than the RA sample 620 years versus 590 years and is more male 43 versus 22 Although the salllples differslightly in age and considerably in gender and disability with disability levels higher among the RA patients the test characteristic curves are similar
While the characteristic curves indicate that the two instruments process raw scores in much the same way it is helpful to examine the items themselves Table 2 contains the item calibrations for NHEFS for the RA sample and for the RA patients from Great Britain studied by
850 SHEEHAN et al
400rshyI
I o 300shy
~ laquo Q)
~ 2001
~
100 + I
-500
Rasch person measure on 25 ADL items
--r---- shy-250
I 000
I 250 500
Figure 2 Graph ofRasch measures for persons and ADL average scores based on the average rank assigned to each of25 ADL items
Whalley Griffiths and Tennant (Whalley et aI 1997) The item error varies from 03 to 08 for NHEFS from 06 to 09 for HAQ US and from 11 to 15 for HAQ UK Ideally infit root mean square standard errors should be at or near one Wash and dry body was the furthest from one in the NHEFS sample at 70 take a bath at 166 in HAQ US and wash and dry body at 58 in HAQ UK were those samples only extreme items These items do not fit the scales as well as all other items
MEASURING DiSABILITY 851
Wash and dry body in both the NHEFS and HAQ UK samples may indicate this item is dependent on the data but it is not so severe for NHEFS Take a bath in the HAQ US sample causes some noise in the scale however all other items are within 18 0 f one It appears that there
76 73
70 (f) 67 E 64 Q)
61 0 58 (J
55c 0 52 (f) 49Q)
46(f) c 430 0 40 (f)
37Q)
cr 34-0 31 E 28 -J () 25
NHEFS 22 -shy19
RA -8 -4 -2 0 2 4 6 8
Person Measure
Figure 3 Test characteristic curves for 19 similar ADL items administered to NHEFS and RA samples demonstrating the non-linear nature ofscores based upon the sum ofthe ranks and the similarity ofthe curves despite differences in the samples
Craquo
Tab
le 2
NH
EF
S H
AQ
US
and
HA
Q U
K it
em c
ompa
riso
n T
he it
em m
easu
res
are
from
the
part
ial c
redi
t II
)
UI
Ras
ch m
odel
en
I
m
m
Num
ber
Item
N
HE
FS
H
AQ
US
H
AQ
UK
N
HE
FS
H
AQ
US
H
AQ
UK
j
Mea
sure
s M
easu
res
Mea
sure
s R
ank
s R
ank
s R
ank
s _z
1
Lif
tcu
p
266
8
2 2
60
1 5
1 ~
2 F
auce
ts
156
9
9
70
2 3
5 shy
3 T
oil
et
71
153
1
44
3 2
2 4
Ari
seb
ed
56
154
7
8 4
1 3
5 O
pen
iars
3
6 2
0
-66
5
8 14
6
Cu
tmea
t 2
9 1
1 -
45
6 9
13
7 O
pen
mil
k
29
-11
0 -1
48
7 16
18
8
Car
do
ors
2
5 3
0
11
8
7 8
9 W
ash
bo
dy
1
2 3
8
-33
9
6 12
10
D
ress
elf
02
-01
1
1 10
11
9
11
In
ou
tcar
-
12
91
71
11
4 4
12
W
alk
2st
ep
-35
-
14
10
12
14
10
13
P
ku
pcl
th
-36
0
3 3
0 13
10
6
14
A
rise
chr
-42
-
07
2
6
14
12
7
15
Sh
amp
oo
-
45
-13
-
23
15
13
11
16
R
each
5lb
-1
15
-13
1 -1
86
16
1
7
19
17
B
ath
tub
-1
28
-18
7
-10
9 1
7
19
17
18
S
ho
p
-13
3 -
35
-7
2
18
15
15
19
L
tch
ore
s -1
37
-18
1 -1
01
19
18
16
Item
err
or
var
ies
from
03
to
08
forN
HE
FS
0
6 t
o 0
9 f
or
HA
Q U
S
and
11
to
15
for
HA
Q U
K
Th
e on
ly e
xtr
eme
infi
t ro
ot
mea
n s
qu
are
erro
rs a
re w
ash
an
d d
ry b
od
y at
7
0 a
nd
5
8 f
orN
HE
FS
an
d H
AQ
UK
re
spec
tiv
ely
an
d ta
ke
a ba
th a
t 1
66 f
orH
AQ
US
MEASURING DiSABILITY 853
are tasks which are ofdifferent difficulty for RA patients than for the general population ofolderAmericans Perhaps the most striking difference is the difficulty ofopening a milk carton where the difficulty for RA patients is -11 0 and -148 among their most difficult tasks as compared to 29 for the general public It also appears that getting in and out of cars is more difficult for the general public than for RA patients -12 versus 91 and71 respectively Likewise getting on and offofa toilet is easier for RA patients than for the general public 153 and 144 versus 71 Perhaps the most striking difference is that of lifting a full cup or glass to ones mouth where the American RA patients differ substantially from the British RA patients and from the US general public 82 versus 266 and 260 respectively The size ofthis difference does not seem spurious because follow-up ofUS RA patients one and two years later shows that item calibrations for lifting a cup were similar 55 And 85 Daltroy et al had earlier (1992) recommended replacing lift a cup with opening ajar based on an extreme Rasch Goodness ofFit t of72 Table 2 shows that opening ajaris more difficult for BritishRA patients than for the other two groups -66 versus 36 and 20 respectively
Figure 4 shows the two sets ofRA items are plotted against each other The numerals marking each point correspond to the item numbers in Table 2 The correlation between the two sets ofitems is 80 and ifthe most discrepant item lifting a cup is removed the correlation reaches 87 The correlation between the NHEFS item calibrations and the British RA calibrations are 76 and 71 with the American RA calibrations The correlation between the NHEFS and US RA items rises from 71 to 77 if the most discrepant item lifting a cup is removed
Another way to compare the hierarchical nature ofthe items is to tirst rank each item relative to its own sample and then to compare ranks across samples Where the relative difficulty ofopening a milk carton was 6th for NHEFS it was 16th and 18th for the RA samples Surprisingly getting in and out ofa car was 4th for both RA samples but 11 th for NHEFS Lifting a cup was first or easiest for NHEFS and the British RA samples but 5th for the US RA san1ple Then there are some AmericanshyBritish differences Picking up clothes from the floorwas 13th and 10th for the Americans while it was 6th for the British Similarly standing up from an armless chair was 14th and 12th for the Americans while it was
854 SHEEHAN et al
o 1
HAQ_G8 =-004 + 085 haCLUS Itn e R-Square =064
o 3I
tn m10
E 12 0 4
E (1) cP1 ~ 00 8CD 00
() 15 0 9 o 6
o 18 0 5~ J_10
o 7
o 16-20~
-200 -100 000 100
HAQ US item measures
Figure 4 The item measures from the British and US RA samples Item nwnbers correspond to Table 2
7th for the British Other than these 5 sets ofdifferences there do not appear to be major differences in the item hierarchical structure among these items Despite these limitations there is an overall similarity of hierarchical structure and especially with the similarity oftest characteristic
MEASURING DiSABILITY 855
curves it is interesting to compare the distribution ofNHEFS and US RA samples further
The theoretical independence ofperson and item estimates was shown early by Rasch (Rasch 1980) for dichotomous items and its extension to estimating thresholds between categories within each item has already been described by Andrich and van Schoubroeck (Andrich amp van Schoubroeck 1989) Andrich and van Schoubroeck also point out that no assumptions need to be made about the distribution of~n in the population (Andrich amp van Schoubroeck 1989 p 474) As shown below the person distributions are dramatically different for the NHEFS and RA samples
Figure 5 shows the distribution ofpersons and items for the RA and NHEFS samples based on Likert scoring To see how sample
dependent the item calibrations are for the Likert scoring compare the distribution of item averages in Figure 5 where they are much more bunched together for the NHEFS sample than they are forthe RA sample The pattern ofitem calibrations for Rasch measurement is more similar across samples as seen in Figure 6 It is clear from both figures that the distribution ofdisability is different in RA patients than in the general population Both figures show that the NHEFS sample has a much higher percentage of persons at the lower end of the scale Both Likert and Rasch also show the reversed J shape for the NHEFS sample and a flatter distribution ofRA patients It would appear at least at first that both Likert scores and Rasch calibrations provide similar infonnation about the distribution ofdisability in these two populations Important differences become apparent when the moment statistics mean standard deviation skewness and kurtosis shown in Table 3 enhance the infonnation available from the graphical images
The means show a higher level ofdisability in the RA sample but the differences seem greater on the Rasch scale The Likert means appear closer 124 and 175 than the Rasch means -387 and-2l0 although they are both about one standard deviation apart in either metric The standard deviations seem to show a much greater spread on the Rasch scale but are similar for both the Likert scoring and Rasch measurement for the two samples While the means and standard deviations appear to
60
856 SHEEHAN et al
NHEFS
Itchores ariseochr
kuPCllh wlk2step
40
~ampoo dre sse I degrisebed
wash body
penjars20 ardoors
tmeat bathtub pound6 let aop
fa~ Is ~aCh5lb bttc p om 8tcar
0 10 13 16 19 22 25 28 31 34 37 40
Awrage Score
RA
-
12
--
8 r--- sse I - 0 shy
oCu meat I- shy~ oarscia Q clth8ku I- shy
00ram i Qute r4 I- shy
fa eels ~lk step0
liftc P 0 enja 5 tcho s shy0 0
ras body J ris chr r ach5 b 0
0 toil toari ~bed shop
0 o e nm i k ba htub r----
0
I I0 I 10 13 16 19 22 25 28 31 34 37 4
Average Score
Figure 5 Distribution ofLikert scores for persons and items based on 19 common items for NHEFS and RA samples Means = 124 and 175 standard deviations = 52 and 54 skewness = 295 and 75 and kurtosis = 922 and72
MEASURING DiSABILITY 857
be different they are at least consistent in describing the two samples The skewness indices reflect the asymmetry ofthe distributions
The NHEFS skewness index for the Likert scores is nearly twice as large as the index for Rasch measures 295 versus 139 A normal distribution has a skewness index ofzero and a positive index describes a long tail to the right The skewness indices for the RA sample show a reversal of signs 075 to -045 With skewness therefore consistency is lost and the information conveyed by Rasch is both contrary and contradictory to information conveyed by the Likert scores
The indices of kurtosis describing how peaked or flat the distributions are show almost a 5 fold difference between Likert and Rasch for the NHEFS sample 922 and 189 while the indices are close for the RA sample 60 for Rasch and 72 for Likert Since normal theory statistics assume there are excesses neither in skewness nor kurtosis it is clear that the distributional properties ofthe Rasch measures are superior to those ofLikert The Likert scores provide information about skewness and kurtosis that is contrary ifnot contradictory to the information provided by the Rasch analysis The fact that the correlation between Likert scores and Rasch measures is extremely high obviously does not mean the measures are equivalent it simply means that persons are in the same rank order on both scales Furthermore high correlations distract from the real need ofa meaningful metric against which progress can be measured
Finally it is noteworthy that the Rasch reliability estimates are consistently lower than reliabilities estimated from Likert scoring The Rasch reliability ofthe person measures estimated from 25 ADL items is 86 for non-extreme persons and drops to 62 when the 2094 extreme person measures are included The person measure reliability for the RA patients based upon 19 HAQ items is 90 and drops slightly to 88 when 41 extreme person measures are included The coefficient alpha estimate ofreliability for these same items when scored as a Likert scale is 94 In the Rasch analysis the HAQ has greater precision and less measurement error in assessing patients with arthritis than the ADL has in the general population and both have more measurement errorassociated with person measures than suggested by coefficient alpha from a Likert scale
858 SHEEHAN et al
10
0
8hampoo doilel
erisechr Jrisebed b3ucets gftcup
NHEFS
50
40
oopenjars
8utmeat
30 8penm ilk
8ardOOrS~ gash bodya
dresself20 o
~alk2step
6each51b ~noulcar
ampalhtub Jkupclth
-5310 -4202 -3094 -1966 -0676 0230 1336 2446 3554 4662 577
Measure
RA
- r----shy
rshy12
- diftcup
jYashbody
oopenjars6
cutmeat
JWPll h
~ isech
cJen ilk ~ressel ~noutcar
4 I-shy ach Ib ~ mpo Jaucets
~tchO es OW lk2st p oarisebed
lgtatht b
e0 8a~rhf--_rl~_l--__-r-~__--j o shy-6580 -5253 -3926 -2599 -1272 0055 1362 2709 4036 5363 66
Measure
Figure 6 Distribution ofRasch measures for NHEFS and RA samples and items Means = -3_87 and -210 standard deviations = 197 for both skewness =139 and -045 and kurtosis = 189 and 60
MEASURING DiSABILITY 859
Table 3 Summary statistics to describe distribution ofdisability in NHEFS and RA samples using Likert scores and Rasch measures Means Standard Deviation Skewshyness (measure of symmetry and equals 00 for normal distribution tail to the right for posivite value and left for negative value) and Kurtosis (measure of peakness equals 00 for normal distribution)
Scale Sample Mean SD Skewness Kurtosis
Likert NHEFS 124 052 295 922
RA 175 054 075 072
Rasch NHEFS -387 197 139 189
RA -210 197 -045 OliO
CONCLUSIONS
Improved precision in the methods ofmeasuring disability is essential to disability research Thurstone set out the fundamentals ofmeasurement in the 1920s (Wright 1997) and described the universal characteristics of all measurement Measurements must be unidimensional and describe only one attribute of what is measured The Rasch model assumes a single dimension underlying the test items and provides measures offit so that the unidimensionality assumption can be examined Measurements must be linear because the act ofmeasuring assumes a linear continuum as for example length height weight price or volume The Rasch analysis
860 SHEEHAN et al
reveals the non-linear nature ofLikert scores Measurements must also be invariant and use a repeatable metric all along the measurement continuum the essence ofan interval scale The Rasch analysis reveals the lack ofa repeatable metric for Likert scores
While all ADL items showed adequate fit to the Rasch model and hence the unidimensionality requirement has been met further study may show that the single construct ofdisability may have more than one measurable feature In fact some HAQ users combine items into up to 8 subscales (Tennant Hillman Fear Pickering amp Chamberlain 1996) and report similarity in overall measures using either subscales or measures based on all ofthe items They also report large logit differences among items within a subscale Daltroy et al (Daltroy et aI 1992) grouped items into six subscales in search ofa sequential functional loss scale Their aim was to develop a Guttman scale offunction in the elderly They reported that 83 ofnon-arthritic subjects fit their scale compared to 65 ofarthritic subj ects Their Rasch analysis indicated that lifting a cup to the mouth did not fit the Guttman scale pattern In the Daltroy study getting in and out ofa car was grouped with doing chores and running errands as the most difficult subscale In the current study getting in and out ofa car was easier for US RA patients with a rank of 4th easiest compared to lifting a cup which was 5th bull Itwas also 4th easiest for British RA patients and 11 th easiest for the NHEFS sample The current study along with these findings maysignal cautions conceptualizing disability as a singleinvariant sequence orhierarchy The Rasch assumption ofunidimentionality seems intact and we have conducted confirmatory factor analysis using methods suitable for ordinal items and found that a single factor model adequately fit the ADL data Nonetheless the nature ofdisability may well vary within and between groups that even share the same diagnosis such as RA Such variation may be seen in the item calibrations for lifting a cup
The Rasch analysis also demonstrates that theADL based measures ofdisability provide a poor measurementtool for nearly halfofthe NHEFS sample who were entirely disability free during the 1982 to 1984 followshyup Certainly the fit between items and persons is better in a population with more disability such as RA patients However even for RA patients
MEASURING DiSABILITY 861
the estimate ofreliability for the Likert scale is inflated over that provided by the Rasch analysis and the infonnation provided by the Likert analysis about the distribution ofdisability in either the general population or among RA patients is different from and contradictory to the infonnation provided by the Rasch analysis
ACKNOWLEDGEMENTS
Supported in part by grants from the Arthritis Foundation and the Claude Pepper Older Americans Independence Center We thank Dr Alan Tennant from the University ofLeeds for his prompt response to our request for HAQ item data for RA patients from the UK
REFERENCES
Andrich D (1978) A rating fonnulation for ordered response categoshyries Psychometrika 43(4)561-573
Andrich D (1988) Rasch Models for Measurement Newbury Park CA Sage Publications Inc
Andrich D amp van Schoubroeck L (1989) The General Health Quesshytionnaire a psychometric analysis using latent trait theory PsycholMed 19(2)469-85
862 SHEEHAN et al
Daltroy L H Logigian M Iversen M D amp Liang M H (1992) Does musculoskeletal fimction deteriorate in a predictable sequence in the elderly Arthritis Care Res 5(3) 146-50
Fries1 F Spitz P Kraines R G amp Holman H R (1980) Measureshyment ofpatient outcome in arthritis Arthritis andRheumatism 23(2) 137-145
Guttman L (1950) The basis for scalogram analysis In Stouffer (Ed) Measurement and Prediction (Vol 4 pp 60-90) Princeton NJ Princeton University Press
Hubert H B Bloch D A amp Fries J F (1993) Risk factors for physishycal disability in an aging cohort the NHANES I Epidemiologic Followup Study [published erratum appears in J Rheumatol1994 Jan21 (1) 177] J Rheumatol 20(3) 480-8
Katz S Downs T D Cash H R amp Grotz R C (1970) Progress in development ofthe index ofADL Gerontologist 10(1)20-30
Lazaridis E N Rudberg M A Furner S E amp Casse C K (1994) Do activities ofdaily living have a hierarchical structure An analysis using the longitudinal study ofaging Journal ofGerontology 49(2 M47-M51) M47-M51
Linacre1 M amp Wright B D (1998a) A Users Guide to Bigsteps Winsteps Rasch-Model Computer Program Chicago MESA Press
Linacre 1 M amp Wright B D (1998b) Winsteps Chicago MESA Press
Merbitz C Morris 1 amp Grip 1 C (1989) Ordinal scales and foundashytions ofmisinference [see comments] Arch Phys Med Rehabil 70(4) 308-12
Miller H W (1973) Plan and operation ofthe Health and Nutrition Examination Survey United States- 1971-1973 Vital and Health Statistics Series 1(1 Oa) 1-42
Rasch G (1980) Probabilistic Models for Some Intelligence andAtshytainment Tests Chicago MESA Press
Reisine S amp Fifield 1 (1992) Expanding the definition ofdisability implications for planning policy and research Milbank Memorial
MEASURING DiSABILITY 863
Quarterly 70(3)491-509
Reisine S Fifield 1 amp Winkelman D K (2000) Characteristics of rheumatoid arthritis patients who participates in long-term research and who drops out Arthritis Care Res 13(1) 3-10
SAS Institute (1989) SAS (Version 60) Cary NC SAS Institute Inc
Sonn U (1996) Longitudinal studies ofdependence in daily life activities among elderly persons Scandinavian Journal of Rehabilitation Medicine S342-28
SPSS (1997) SPSS (Version 80) Chicago SPSS
SSI (1998) PRELIS (Version 220) Lincolnwood IL Scientific Softshyware International
Tennant A Hillman M Fear 1 Pickering A amp Chamberlain M A (1996) Are we making the most ofthe Stanford Health Assessment Questionnaire British Journal ofRheumatology 35574-578
Thorndike E L (1904) An Introduction to the Theory ofMental and Social Measurements New York Teachers College
Whalley D Griffiths B amp Tennant A (1997) The Stanford Health Assessment Questiom1aire a comparison ofdifferential item functionshying and responsiveness in the 8- and 20 item scoring systems Brit J Rheum 36(Supple 1) 148
Wright B (1997) A history ofsocial science measurement MESA Memo 62 Available httpMESAspcuchicagoedulmemo62htm [1998 Oct 29 1998]
Wright B D amp Linacre 1 M (1989) Observations are always ordinal measurements however must be interval Archives ofPhysical Medishycine and Rehabilitation 70857-867
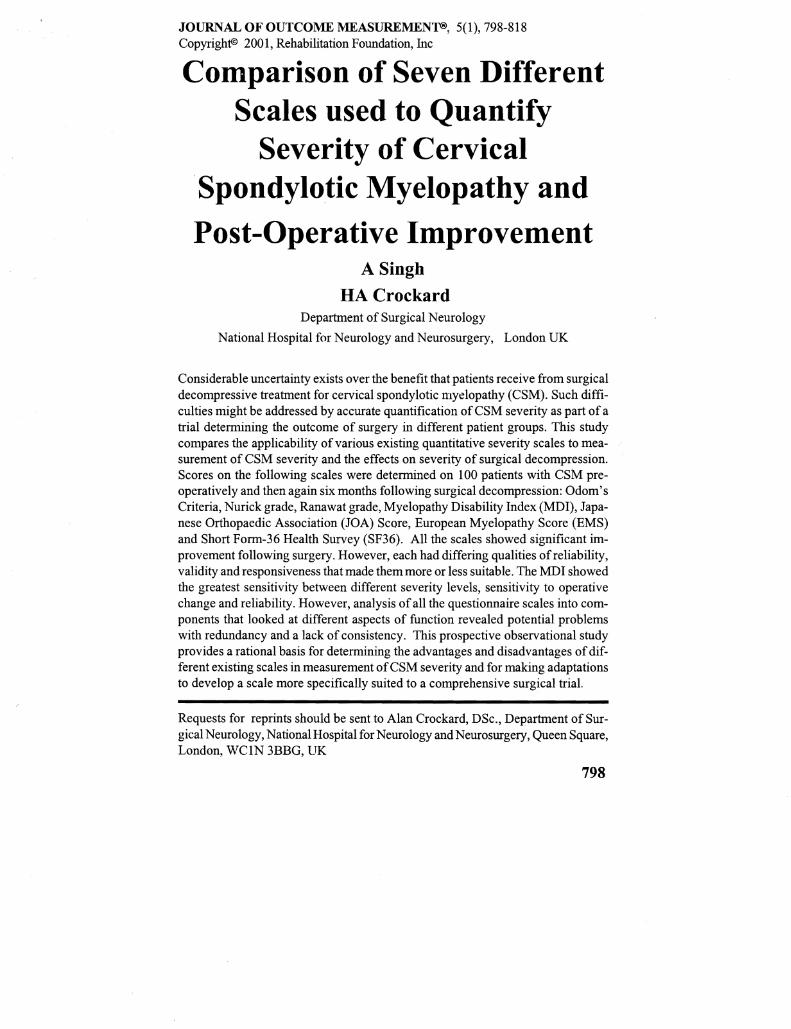
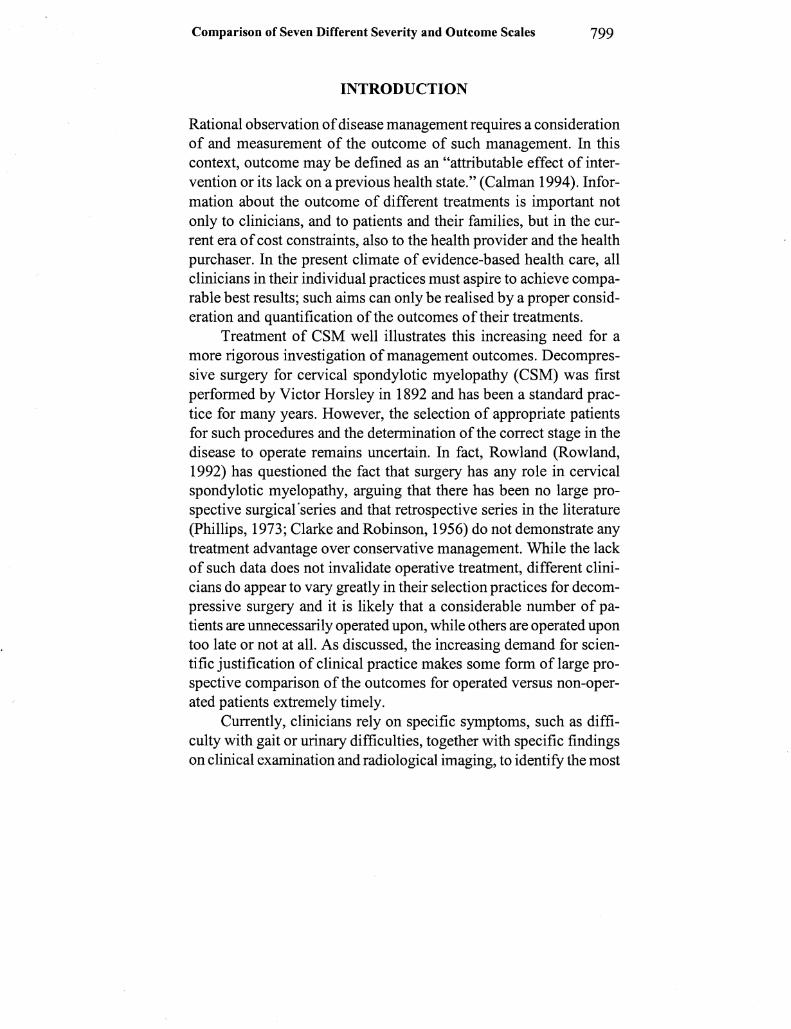
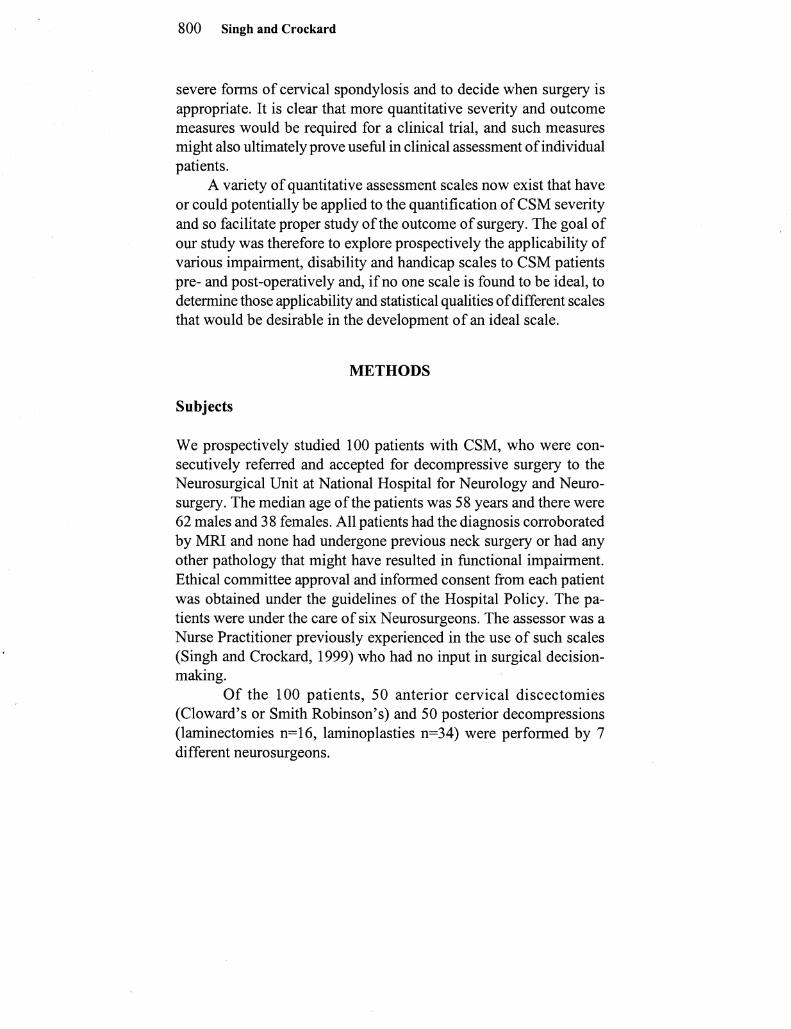
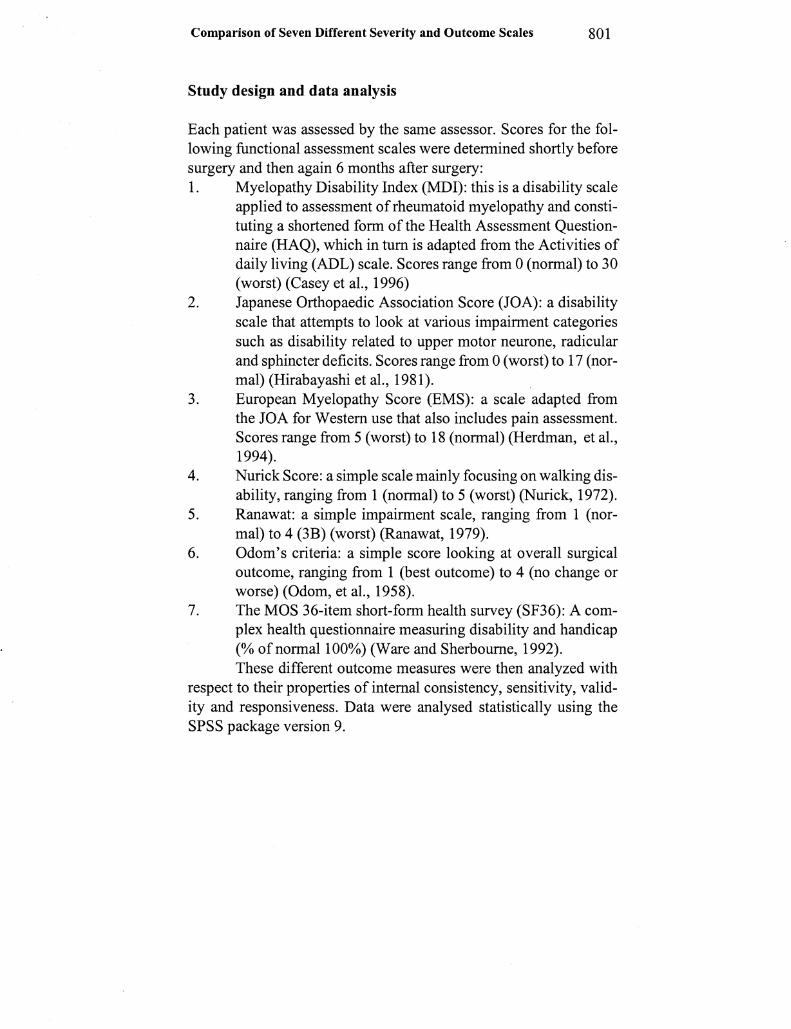
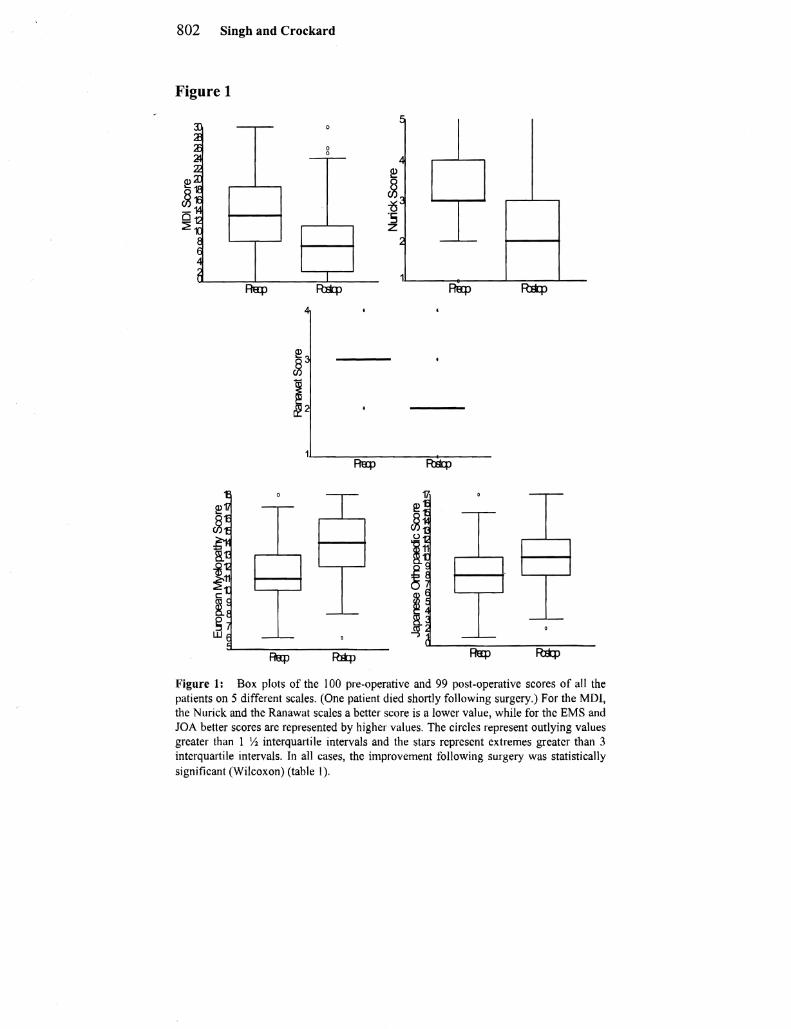
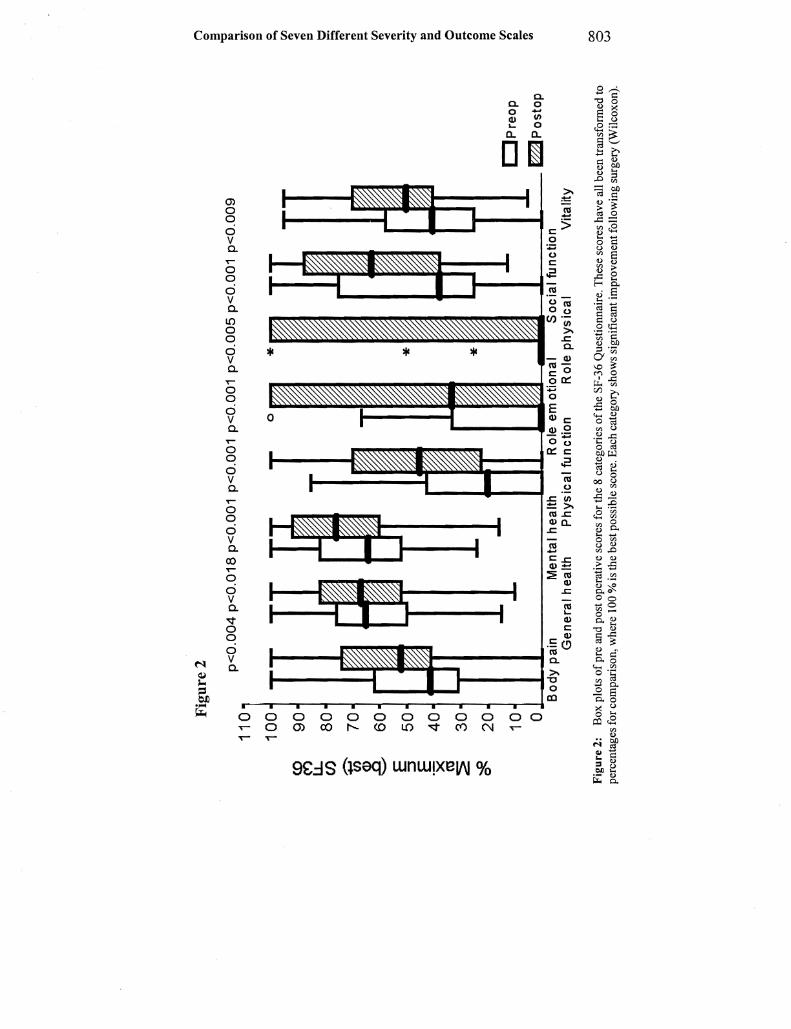
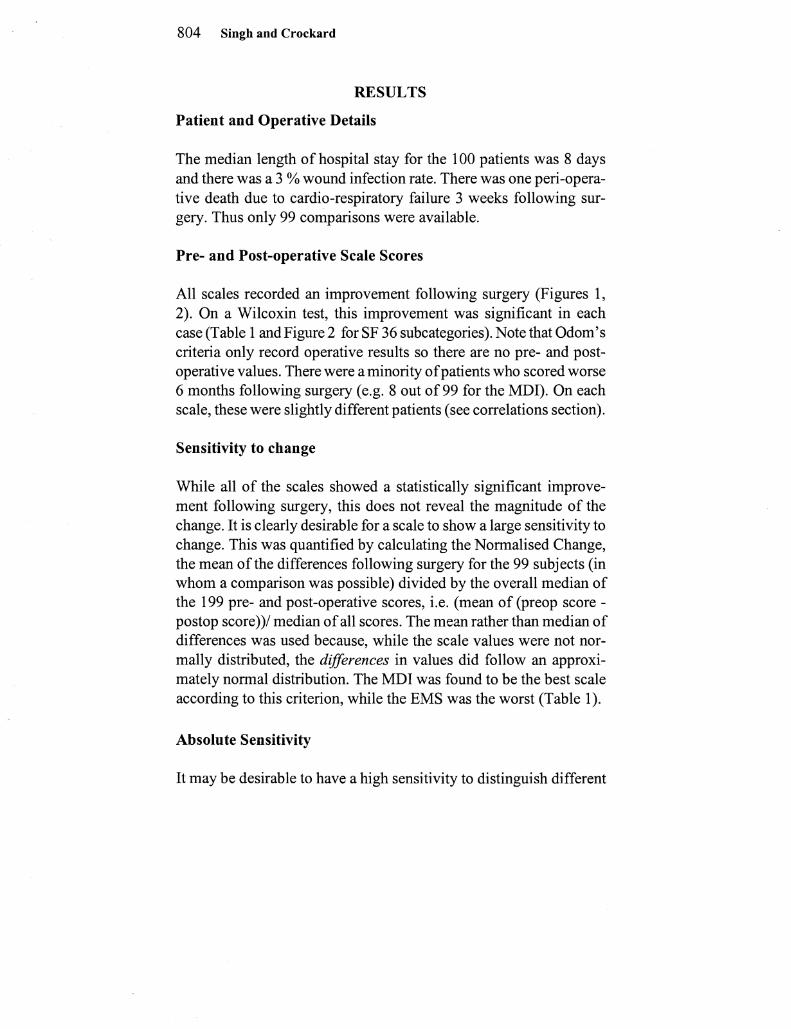
Tab
le 1
SCA
LE
MD
I
EM
S
JOA
NU
RIC
K
RA
NA
WA
T
SF36
T101
Com
pari
son
ofp
rope
rtie
s o
fdif
fere
nt s
cale
s T
he
sign
ific
ance
of i
mpr
ovem
ent i
s th
e pshy
n o va
lue
of t
he o
pera
tive
cha
nge
Sen
siti
vity
to c
hang
e is
mea
n o
f (p
reop
sco
re -
post
op
sect ~sc
ore )
med
ian
of a
ll s
core
s C
oeff
icie
nts
of v
aria
tion
pre
-op
an
d p
ost-
op a
nd
the
rel
ishy fii
middot oab
ilit
y (C
ron
bac
hs
a)
pre-
op a
nd
pos
t-op
are
als
o sh
own
for
all s
cale
s
=
o
rIl
Igt
~
IgtS
IGN
IFIC
AN
CE
S
EN
SII
IW
IY
C
O-E
FF
ICIE
NT
C
O-E
FF
ICIE
NT
IN
TE
RN
AL
IN
TE
RN
AL
I
=
OF
T
O C
HA
NG
E
OF
O
F V
AR
IAT
ION
C
ON
SIS
TE
NC
Y
CO
NS
IST
EN
CY
51
IMP
RO
VE
ME
NT
V
AR
IAT
ION
P
OS
T-O
P
(CR
ON
BA
CH
S a
(C
RO
NB
AC
HS
a
a ~ P
RE
-OP
P
RE
-OP
) P
OS
T-O
P)
I
PltO
(xn
052
0
85
129
0
92
095
rI
l Igt
(11
SCO
RE
S)
(11
SCO
RE
S)
Igt
I
~ 0
76
081
(4
CA
TE
GO
RIE
S)
(4 C
AT
EG
OR
IES)
4 ~ 5shy
PltO
OO
I 0
18
027
0
29
068
0
77
o = o ~
(6 S
CO
RE
S)
(6 S
CO
RE
S)
3 Plt
OO
OI
021
0
5 0
4
072
0
73
066
0
65
Igt
rIl
~(4
CA
TE
GO
RIE
S)
(4 C
AT
EG
OR
IES)
I
~ shy
PltO
OO
I 0
42
033
1
I
PltO
OO
I 0
34
0 0
PltO
OO
I 0
32
041
0
68
082
0
86
00
(361
1EM
S)
(36I
Th1
ES)
I
o Vl
806 Singh and Crockard
absolute levels of severity between patients in the sample group as well as sensitivity to changes following surgery Absolute sensitivshyity was quantified by the coefficient of variation (the interquartile range divided by the median) It is seen that the Ranawat score has poor sensitivity for distinguishing patients with different levels of severity because the range across the patients is narrow This is ilshylustrated by the fact that the box plot shows a single horizontal line instead of a box (Figure 1) Thus nearly all pre-operative patients were scored at one level and post-operatively at a level one grade better indicating that the Ranawat score nevertheless records a postshyoperative improvement
The Nurick scale was found to have much greater sensitivity post operatively perhaps indicating that the scale was more sensishytive at distinguishing milder levels of severity
Internal Consistency
If different questions in a multipart questionnaire are attempting to measure the same parameter eg CSM severity then there should be consistent scoring within patients This is measured by Cronbachs alpha (Cronbach and Meehl 1955) a normalised measure of correshylations between multiple components of a scale A score of 1 indishycates a perfect correlation The very high Cronbachs alpha values of the MDI (table 1) show that the questionnaires were reliably comshypleted but also suggest the possibility of redundancy When the 11 questions of the MDI were split into 4 categories (walking hand function transfers and dressing) the alpha scores were somewhat lower This is appropriate since ifdifferent questions within a quesshytionnaire are designed to address different parameters then it is not desirable to have high internal consistency
Correlations of Scores
To explore the validity ofthe different scales correlation coefficients were calculated for the pre-operative scores (Table 2A) post-operashytive scores (Table 2B) and for the changes following surgery (Table 2C) All correlations were corrected for the fact that some scales
Comparison of Seven Different Severity and Outcome Scales 807
recorded no disability as the maximum value while others recorded no disability as the minimum value
It was found that some scales were correlated better than othshyers the best correlation was found post-operatively between the MDI and the EMS scales (r= 082) which are both disability questionshynaires while the poorest correlation was postoperatively between the SF36 (measuring handicap and disability) and the Ranawat (meashysuring neurological impainnent)
The correlations were poorer when comparing operative changes Many values were close to zero or even negative
Breaking down Scales into Components
The generally poor correlation between scales with better correlashytion between more similar scales (eg the postoperative MDI and EMS scores) could be due to some scales measuring different asshypects of function or impainnent This was initially investigated by empirically dividing the multi-part scales into components measurshying certain aspects ofdisability or impairment This breakdown might also reveal that different individual aspects have different potentials for improvement following surgery Thus the Normalised Changes measuring the magnitude ofoperative change (sensitivity to change) of the different components of the three multipart disability quesshytionnaires were calculated and compared (Table 3)
A reasonably consistent trend was apparent across the scales revealing that good improvement tended to occur in hand function as assessed by all three scales addressing this aspect while both scales looking at sphincter function showed that it remained little changed by surgery Within the SF 36 physical and social function and social role changed most (Figure 2) but no corroboration was available for these parameters since they were not measured by any other scale The findings in general support the possibility that the poor correlashytions might be better ifone compared specific aspects ofCSM rather than overall scales However since the scale components have not been validated when looked at individually one has to interpret difshyferences in improvement between these specific aspects with caushy
808 Singh and Crockard
Table 2A
MDI EMS RANAWAT NURICK JOA SF36
Pre-op MDI 1 - - - - shyPre-op EMS 075 1 - - - shyPre-op RANAWAT 051 061 1 - - shyPre-op NURICK 066 069 071 - - shyPre-op JOA 056 062 047 059 1 shyPre-op SF36trade 048 042 031 038 040 1
Table 2B
Post- Post- Post- Post- Post- Post-Op Op Op Op Op Op
MDI EMS RANAWAT NURICK JOA SF36
Post-Op MDI 1 - - - - shyPost-Op EMS 082 1 - - - shyPost-Op RANAWAl 067 063 1 - - shyPost-Op NURICK 071 074 075 1 - shyPost-Op JOA 057 072 042 051 1 shyPost-Op SF36trade 035 035 025 036 037 1
Comparison of Seven Different Severity and Outcome Scales 809
Table 2C
MDI EMS RANAWAl NURICK JOA SF36 ODOMS
Change Change Change Change Change Change Change
MDI Chan2e 1 - - - - - - shyEMS Chan2e 027 1 - - - - - shyRANAWAT Chan2e 022 023 1 - - - - shyNURICK Chan2e 032 032 055 1 - - shyJOA Chan~e 015 035 002 019 1 - shySF36trade Change 022 012 0003 013 028 1 shyODOMS Change 002 027 033 025 024 019 1
Table 2ABC Correlations of score pre-operatively (2A) post-operatively (2B) and operative changes ie differences between pre-operative and postshyoperative scores (2C)
tion For example the greater improvement in hand function after surgery might simply reflect a greater sensitivity of the questionshynaires to this component rather than a genuinely greater improveshyment
Correlations of Components
In order to seek some validation of the component sensitivities and to explore why the overall scale correlations ofoperative change were low the next step was to perform correlations between these composhynents in a similar way to the correlations performed above for the overall scales Thus the components of the multi-part scales quesshytioning walking function were directly correlated with each other as well as with the Ranawat and Nurick scales (which have a one-dishymensional measure primarily based on walking) while hand and bladshy
810 Singh and Crockard
Table 3 Breakdown of scales into components sensitivity to change in these aspects fllowing surgery
MDI EMS JOA sensitivity sensitivity sensitivity to change to change to change
WALKING 058 02 021 HAND 070 022 035 DRESSING 035 02 shySPINCTER - 003 004 WASHING
TRANSFERS 042 - shyPAIN - 022 shySENSORY
LOSS - - 033
Table 3 Three scales were broken down into their component aspects and sensitivities to change recalculated for these separate components For example the JOA has questions relating to walking hand and spincter function and sensory change The hand function components recorded by these scales change much more than bladder-related components
der components were similarly correlated between those scales that had aspects pertaining to these components (Table 4A B C)
It was found that particularly for hand and bladder function improvement correlations were still very poor The correlation of operative changes for two apparently similar questions on the JOA and EMS namely bladder function was only 023 On analysing individual patients responses the inconsistencies were clear For example patient number 10 indicated his bladder became worse postshyoperatively on the EMS going from normal to inadequate but on the JOA he reported only a mild disturbance both pre- and post-operashytively
Comparison of Seven Different Severity and Outcome Scales 811
Table 4A
MDI EMS RANAWAT NURICK JOA
Walk Walk Change Change Walk Change Change Change
MDI Walk 1 Change
EMS Walk 007 Change RANAWAT 026 Change NURICK 034 Change
JOA Walk 013 Chanfe
Table4B
JOA Hand Chanfe MDI Hand Change EMS Hand Change
Table 4C
EMS Bladder Difference
JOA Bladder Difference
- -
1
025
023
048
-
1
055
019
- -
- -
- -
1 -
029 1
JOA MDI EMS Hand Hand Hand Chanfe Chanfe Chanfe
1 012 025
EMS Bladder Difference
1
023
- -1 -026 1
JOABladder Difference
-
1
Table 4A B C Components such as walking hand function bladder were similarly correlated between those scales that had aspects pertaining to these comshyponents
812 Singh and Crockard
DISCUSSION
All the quantitative measures ofCSM severity satisfied the most bashysic requirement ofa scale useful in assessing the effects ofsurgery in that they were all able to demonstrate a significant improvement in score following surgery This consistent finding is ofcourse also inshydicative ofa genuine benefit resulting from such intervention Howshyever such an effect would only be properly demonstrated by a study that included a period of follow up longer than 6 months and that included a comparison with a similar group of CSM patients that were not operated upon
Sensitivities of Different Scales
While all the scales showed significant improvement following surshygery they have other properties that make them more or less suitable form assessment of CSM The MDI is sensitive to change and also gives a wide range of absolute values which means there is good sensitivity to differences between patients On the other hand the Ranawat score while being sensitive to change was very poor at distinguishing different levels of absolute severity This study in looking at both pre- and post-operative scores thus illustrates the important point that it is insufficient to attempt validation of scales only on absolute measurements their properties may be considershyably different if the scales are also to be used to assess the effect of operative or other interventions In addition widely differing absoshylute sensitivities between pre- and post-operative measurements sugshygests that different scales may have different applicability to differshyent patient groups For example the Nurick score had a much greater sensitivity post-operatively suggesting a greater ability to distinguish between different levels of severity at the milder end of the scale
Internal Consistency of Different Scales
The multi-part questionnaires had good internal consistency (intershynal reliability) particularly the MDI suggesting that the questionshy
Comparison of Seven Different Severity and Outcome Scales 813
naires were being reliably completed However the high level of reliability may entail some redundancy where very similar questions concentrating on the same aspect of disability are asked repeatedly Even worse ifdifferent aspects ofdysfunction are considered someshytimes to be affected to different degrees in different patients it would seem inappropriate that questions testing these different aspects alshyways score too similarly The lower alpha score when the MDI is divided into categories comparing different aspects does suggest some genuine effect in distinguishing these categories Nevertheless the presence of multiple questions within the same category while not resulting in poorer sensitivity and sensitivity to change does point to redundancy and therefore inefficiency A glance at the questions of the MDI (appendix) reveals that it tends to ask repeated questions on a few limited categories of disability After the initial demonstrashytion of high internal consistency during an initial study indicating that the patients answer the questions reliably perhaps redundant questions could simply be removed when designing an ideal scale used in assessing CSM severity
Intra-rater and inter-rater reliability were not investigated in this study Since the MDI EDM JOA and SF 36 are patient rated inter-rater reliability is irrelevant for such scales Instead internal consistency is a measure of reliability across questions within the questionnaire The Ranawat and Nurick scores are simple and oneshydimensional and have previously been shown to have good intrashyand inter-rater reliability
Correlations between Scales
Possible flaws in the scales are suggested when looking at correlashytions between the scores on the various scales The concept of intershynal consistency does not necessarily imply validity and accuracy ic whethcr or not a scale is actually measuring what it purports to meashysure (Wassertheil-Smoller 1995) Scales are ideally validated by comshyparing them with a gold standard This is most relevant when they are used as a convenient surrogate for a gold standard definitive inshyvestigation that is invasive risky or cumbersome or perhaps when
814 Singh and Crockard
used to predict an outcome that eventually becomes clear over time In the absence of a gold standard in CSM the scales were simply correlated with each other to see if certain inconsistencies became apparent
It was found that while correlations between similar scales were sometimes high correlations between recorded operative changes were poor This is because change is likely to be a much more sensitive indicator of dissimilarities between scales For exshyample if a patient generally scores well on different scales pre-opshyeratively and there is only a small post-operative improvement the changes may well be in different directions on the different scales while the post-operative absolute scores all still remain generally high These highlighted differences between scales could reflect aspects of change that some scales measure which others ignore Thus a mildly affected patient may generally score quite highly but operashytive decompression might change certain aspects much more than others This point again illustrates the importance ofvalidating scales by looking at changes rather than confining assessment to patients in the static state
Breakdown of Scales into Components
To explore the possibility that different scales measure different asshypects of function the individual scales were subdivided on empirical grounds into different functional components There were indeed difshyferences between components with hand function showing the greatshyest improvement walking showing moderate improvement and bladshyder function showing minimal improvement However these results must be interpreted with caution since they could reflect that differshyent scales are simply better at measuring changes in different aspects of function rather than there being real differences in change of funcshytion Indeed when one actually correlates these different aspects of function by correlation of the components between the scales the coefficients are often no better than for the overall scales throwing doubt upon the validity of making strong inferences about the sepashyrate components of a scale This finding also suggests that the poor
Comparison of Seven Different Severity and Outcome Scales 815
overall correlations of improvement between the overall scales canshynot be explained on the basis that the different scales record different aspects of this improvement but instead lead one to question the validity of some or all of the scales On review of individual pashytients responses it is clear that apparently similar single questions are sometimes answered very differently in different scales possibly due to the phrasing of such questions
An important precept of a multi-part scale is that there is an overall unidimensionality ie overall severity Thus the scale simshyply adds all the different components from which patients with myshyelopathy might suffer No hierarchy of components is considered at all other than perhaps more questions being asked on areas that are more important for patient functioning This study has addressed the relationship between the components of different scales and found that particularly when looking at changes in severity this unidimenshysionality cannot be applied - some components deteriorate while othshyers improve and there is no consideration ofwhich are more imporshytant
CONCLUSIONS
An ideal scale should be as quantitative as possible and show good sensitivity between patients and sensitivity to change It should also be scored reliably and be simple to use Of the scales investigated the MDI best reflects these characteristics This scale constitutes a questionnaire that focuses upon a limited range ofaspects ofdisabilshyity the findings indicate that such a scale does not necessarily suffer in terms of sensitivity Instead repeated questioning on similar asshypects of function may reflect redundancy Moreover the poor correshylations between the operative changes recorded by the overall scales and their components indicates that repeated questions on different or even similar aspects of function may actually reveal considerable inconsistencies Thus while a scale such as the MDI appears to be adequate for a prospective outcome trial ofintervention in CSM it is possible that an ideal scale might be one that makes a simple single quantitative measurement on a limited aspect of function
816 Singh and Crockard
APPENDIX
MYELOPATHY DISABILITY INDEX
Please tick the response which best describes your usual abilities over the past week
Without ANY difficulty
With SOME difficulty
With MUCH Difficulty
UNABLE to do so
Score 0 1 2 3
Rising are you able to
Stand up from an annless straight chair
Get in and out ofbed
Eating are you able to
Cut your meat
Lift a fun cup or glass to your mouth
Walking are you able to
Walk outdoors on a flat ground
Climb up five steps
Hygiene are you able to
Wash and dry your entire body
Get on and otT the toilet
Grip are you able to
Open jars which have been previously opened
Activities are you able to
Get in and out of the car
Dressing are you able to
Dress yourself include tying shoelaces and doing buttons on your shirt or blouse
TOTAL A B C D
Note If aids or assistance from another is required to perform any of the tasks please score the activity as with much difficulty Total score = A + B+C + D (range 0-33) The final score is expressed as a percentage
Comparison of Seven Different Severity and Outcome Scales 817
ACKNOWLEDGEMENTS
We would like to acknowledge Mr Adrian Casey Mr William Harkness Mr Neil Kitchen Mr Michael Powell Professor David Thomas and Mr Lawrence Watkins for allowing us to study their patients
REFERENCES
CaIman Kc (1994) The ethics of allocation of scarce health care resources a view from the centre J Med Ethics 1994 June 20(2) 71-4
Casey ATH Bland J M and Crockard H A (1996) Developshyment of a functional scoring system for rheumatoid arthritis patients with cervical myelopathy Annals of the Rheumatic Diseases 55901-906
Clarke E and Robinson PK (1956) Cervical myelopathy a complication ofcervical spondylosis Brain 79 483-510
Cronbach L J and Meehl P E (1955) Construct validity in psyshychological tests Psychological Bulletin 52281-302
Herdman J Linzbach M Krzan M et al (1994) The European myelopathy score In Bauer BL Brock M Klinger M eds Advances in Neurosurgery Berlin Springer 266-8
Hirabayashi K et al Operative results and post-operative progresshysion of ossification among patients with cervical osteophytic posterior longitudinal ligament Spine 1981 6354 364
Nurick S (1992) The Pathogenesis ofthe Spinal Cord Disorder As sociated with Cervical Spondylosis Brain 95 87-100
818 Singh and Crockard
Odom GL Finney W and Woodhall B (1958) Cervical disc leshysions JAMA 16623 - 28
Phillips DG (1973) Surgical treatment ofmyelopathy with cervishycal spondy losis J Neurol Neurosurg Psychiatry 36879 shy884
Ranawat C OLeary P Pellici P et al (1979) Cervical fusion in rheumatoid arthritis Journal ofBone and Joint Surgery
America 61A 1003-10 Rowland L P (1992) Surgical treatment of cervical spondylotic
myelopathy time for a controlled trial Neurology 42(1) 5shy13
Singh A and Crockard H A (1999) Quantitative assessment of cervical spondylotic myelopathy by a simple walking test Lancet 1999 Ju131 354(9176) 370-3
Ware JE and Sherbourne C D (1992) The MOS 36-item ShortshyForm Health Survey (SF-36) I Conceptual framework and item selection Med Care 30473-83
Wassertheil-Smoller S (1995) Biostatistics and Epidemiology - A Primer for Health Professionals Springer - Verlag New York Inc
JOURNAL OF OUTCOME MEASUREMENTreg 5(1)819-838 Copyrighteurogt 2001 Rehabilitation Foundation Inc
The Impact of Rater Effects on Weighted Composite Scores Under Nested and Spiraled Scoring Designs Using the Multifaceted Rasch Model
Husein M TaherbhaF Learning Research and Development Center
University of Pittsburgh
Michael James Young Harcourt Educational Measurement
Constructed-response or open-ended tasks are increasingly used in recent years Sin(e these tasks cannot be machine-scored variability among raters cannot be completely eliminated and their effects when they are not modeled can cast doubts on the reliability of the results Besides rater effects the estimation of student ability can also be impacted by differentially weighted tasksitems that formulate composite scores This simulation study compares student ability estimates with their true abilities under different rater scoring designs and differentially weighted composite scores Results indicate that the spiraled rater scoring design without modeling rater effects works as well as the nested design in which rater tendencies are modeled As expected differentially weighted composite scores have a conshyfounding effect on student ability estimates This is particularly true when openshyended tasks are weighted much more than the multiple-choice items and when rater effects interact with weighted composite scores
FOOTNOTE IAuthors names appear in alphabetical order
Requests for reprints should be sent to Husein M Taherbhai University of Pittsburgh Learning Research and Development Center University ofPittsburgh 3939 OHara St Room 802 Pittsurgh PA 15260
819
820 Taherbhai and Young
INTRODUCTION
Constructed response or open-ended tasks have been increasingly used in assessments in recent years Since these tasks cannot be mashychine-scored trained raters are used to score them In a crossed deshysign where every rater scores every task of every examinee the reshycovery of the examinee abilities in simulation studies is very accushyrate (Hombo Thayer amp Donoghue 2000) However because oftime and cost considerations it is impossible for every rater to rate all examinees When fully crossed designs are not used variability among raters cannot be completely eliminated and when rater effects are not modeled biased ability estimates can result Hombo and her colshyleagues however found that spiraled designs for assigning raters to the scoring oftasks performed better than nested designs in reducing the bias of ability estimates
Besides rater effects the use ofcomposite scores that apply a priori weights to items and tasks from different formats (eg the College Boards Advanced Placement examinations (College Board 1988)) can also have an effect in the estimation of student ability These composite scores can have a confounding effect on examinee abilities when they interact with rater effects (Taherbhai amp Young 2000)
Taherbhai and Young (2000) used data from the Reading Basic Understanding section ofthe New Standards English Language Arts (ELA) Examination to study the interaction ofrater effects with composite scores The New Standards ELA Examination consisted ofboth multiple- choice items (MC) and open-ended (OE) tasks The data were used to form different weighted composite scores which were then analyzed for rater effects using the multifaceted Rasch model Results indicated that the interaction of rater effects with the weighted composite scores could dramatically alter the estimates of student abilities
This study examines the impact of rater effects on weighted composite scores under nested and spiraled scoring designs Raters are modeled to reflect a nested design (ie raters scoring all tasks across a subset ofexaminees) and a spiraled design (ie raters SCOfshy
Rater Impact on Weighted Composites - 821
ing a subset of tasks across all examinees) across a complex strucshyture ofdifferentially weighted composite scores Examinee ability is then modeled using the multifaceted Rasch model
The primary purpose of this study was to examine how well the ability parameters of examinees are recovered under different rating designs using conditions of rater effects and differentially weighted composite scores The study also examined the effects of raters on composite scores for student classifications based on cutpoints
Design and Methodology
Various log linear models can be used to analyze the hypothesis of rater and weight effects in scoring the open-ended sections of an exshyamination One such model in Item Response Theory is the multishyfaceted Rasch model which can provide information on examinees items raters and their interactions for ordered response categories (Linacre 1989) The resulting probabilistic equation for a modified rating scale model (Andrich 1978) incorporating the different meashysurement facets (ie examinees raters and items) can be presented in logarithmic form as
(1)
where
Pnijk = probability of examinee n being rated k on item i by raterj
Pnijk = probability of examinee n being rated k-l on item i by rater j
fln = ability of examinee n
0 = difficulty of item i
Aj = severity of rater j
Tk = difficulty in rating step k relative to step k-l
822 Taherbhai and Young
The parameters of this model can be estimated using the FACETS program of Linacre (1989)
PROCEDURE
Simulated Data Generation
Data incorporating rater effects under the many-faceted Rasch model were simulated Response data were generated for a test conshysisting of20 dichotomously scored multiple-choice (MC) items and 3 open-ended (OE) (ie constructed response tasks) each scored on a 0 to 4 rubric The data set consisted of 12 equally spaced true stushydent ability (or thetas) from -200 to 200 Each of these true thetas was used to create 1000 sets of examinee responses giving a total examinee sample size of 12000 Besides true student abilities the following parameters were included in the generation of data
1 Item Difficulty Parameters The twenty multiple-choice item difficulty parameters were selected so that they were evenly spaced in the interval from -200 to 200 The three open-ended tasks were simulated with item difficulty parameters of -100 000 and 100 respectively The four step parameters on a rubric of0 to 4 were kept constant across the open-ended items at -100 -033 033 and 100
2 Rater Parameters The three rater parameters that were used for this study were -050000 and 050 The size of these rater pashyrameters reflects those seen in Taherbhai and Young (2000)
Scoring Designs
Two scoring designs nested and spiraled were considered in this study In the nested condition each rater scores all tasks for a subset ofthe examinees Under this design biased estimates ofstudent ability can occur depending on the combination of rater with student abilshyity For example a lenient rater whose tendency is to award a higher score than what the examinee actually deserves could have a group of examinees of high ability Similarly a severe rater whose tenshydency is to award a lower score than what the examinee actually deserves could rate a group of examinees of low ability
As Rombo et al (2000) explain extreme raters tend to pull
Rater Impact on Weighted Composites - 823
the Item Response Function (IRF) in the direction of the raters ratshying tendency That is lenient raters tend to shift the IRF to the left or down the ability scale while severe raters tend to shift the IRF to the right or up the ability scale By the same token moderate raters (those who are neither too lenient nor too severe) should have a moderate effect on student ability estimates
Under the spiraled design each rater scores only a subset of tasks for all of the examinees However the tasks are rotated so that raters are crossed with respect to students and tasks but rate only some tasks for some examinees and other tasks for other examinees Under this condition too there are various rater and examinee comshybinations that could result in biased estimations ofexaminee ability
Since this paper does not profess to exhaust all possible rater design of interest two designs were selected to illustrate the results of certain patterns of assignment of raters
Nested Design
Under this design the lenient rater rated the lowest ability examinshyees across all replications the moderate rater rated the moderate ability examinees across all replications and the most severe rater rated the highest ability examinees across all replications Since each rater rated four students whose performances were replicated 1000 times on the OE tasks the total number of ratings performed by each rater was 12000
This combination of raters and examinees was selected beshycause according to Hombo et als (2000) results this nested design (their Nested Design 1) was the one those that showed the greatest deviation in the recovery of the true ability parameters for extreme scores when rater effects were ignored FurthernlOre in our case this combination ofraters and examinees would also give us a chance to examine the effects of moderate raters on examinee ability estishymates
Spiraled Design
Under this design each exanlinee was rated by a different rater on
824 Taherbhai and Young
on each ofthe three tasks Specifically the first examinees first task was scored by the lenient rater their second task by the moderate rater and their third task by the severe rater For the second examshyinee the assignment of raters to tasks rotated so that the moderate rater scored the first task For the third examinee the rater assignshyment rotated yet again so that the most severe rater scored the first task This rotation of scoring pattern was then repeated for the reshymaining students These ratings were awarded as in the nested de-
Table 1 Assignment of Raters in Nested and Spiraled Designs
Nested Designs Spiraled Designs
Examnees OE OE OE OE OE OE
Task Task 2 Task 3 Task Task 2 Task 3
Rater 1 Rater 1 Rater 1 Rater 1 Rater 2 Rater 3
2 Rater 1 Rater 1 Rater 1 Rater 2 Rater 3 Rater 1
3 Rater 1 Rater 1 Rater 1 Rater 3 Rater 1 Rater 2
4 Rater 1 Rater 1 Rater 1 Rater 1 Rater 2 Rater 3
5 Rater 2 Rater 2 Rater 2 Rater 2 Rater 3 Rater 1
6 Rater 2 Rater 2 Rater 2 Rater 3 Rater 1 Rater 2
7 Rater 2 Rater 2 Rater 2 Rater 1 Rater 2 Rater 3
8 Rater 2 Rater 2 Rater 2 Rater 2 Rater 3 Rater 1
9 Rater 3 Rater 3 Rater 3 Rater 3 Rater 1 Rater 2
10 Rater 3 Rater 3 Rater 3 Rater 1 Rater 2 Rater 3
11 Rater 3 Rater 3 Rater 3 Rater 2 Rater 3 Rater 1
12 Rater 3 Rater 3 Rater 3 Rater 3 Rater 1 Rater 2
Note Rater 1 is Lenient Rater 2 is Moderate Rater 3 is Severe
Rater Impact on Weighted Composites - 825
sign across all replication for each student perfonnance Under this design too each rater rated every student on 1000 perfonnance repshylications for a total of 12000 ratings This particular spiral design was a modification of Hombo et aIs (2000) Spiral Design 1 The details of assigning raters to tasks and examinees for the nested and spiraled designs are shown in Table 1
Weights Assigned to Items and Tasks
In order to analyze the impact of differentially weighting multipleshychoice items and open-ended tasks four different composite scores were created Each composite was created with the method used by the Advanced Placement Program (College Board 1988) where the part scores for multiple-choice items and open-ended tasks are asshysigned weights to create a composite score with a target set of pershycentages for a fixed total
The first composite represented a baseline condition where equal weights were used for the part scores that is the parts are naturally weighted with respect to MC and OE totals Composites 12 and 3 used different part weights to produce scores with multiple-choice to open-ended contributions of 75-to-25 50-to-50 and 25shyto-75 respectively in the total scores
These different composite scores were used with rater effects for the nested and spiral designs discussed above and also without the inclusion of rater effects to produce various scoring designs
Data Analysis
In order to establish a common metric for comparing the different composite scores all of the item task and item-step difficulty pashyrameters were considered fixed across different designs and weightshying conditions The calibrations of the composites were anchored to these itemtask parameter estimates when producing Rasch paramshyeter estimates pertaining to examinee ability rater severity and OE tasks step difficulty The Rasch ability estimates were found for each composite score point on each weighted composite scale under each of the two scoring dcsigns discussed above
826 Taherbhai and Young
The FACETS program uses Unconditional Maximum Likelishyhood estimation (UCON) for estimating examinee abilities In this study examinee ability parameters used to generate data for examshyinee responses were considered as true examinee abilities The exshyaminee abilities that became infinite due to a zero or perfect score were adjusted by a fractional score adjustment of 03 Ability estishymates corresponding to zero scores were instead estimated for a score of 03 while abilities for perfect scores were instead estimated for the maximum obtainable raw score minus 03 With respect to the weights assigned to items and tasks the FACETS program uses the assigned weights as mutiplicative factors of the scores earned by the exammees
As in Hombo et al (2000) two measures of accuracy in estishymating examinee abilities were examined the squared bias and the mean squared error (MSE) These measures were calculated as folshylows
1000 2
I ( ()estillUlted - ()true)MSE = un-I_________
1000
Cutpoints at the quartiles ofthe Rasch ability estimates for the various composite scores without rater effects were compared with each other and then with the modeling of rater effects to examine changes in student classifications across the different composites
RESULTS
Table 2 presents true examinee ability parameters the squared bias and the mean squared errors across the two designs and across the two rater effects conditions ie modeled and not modeled
Rater Impact on Weighted Composites - 827
Parameter Recovery for Baseline Weighting
Under the nested design without modeling rater effects the expected pattern of examinee ability estimates was generally observed That is when rater effects were not modeled the impact of the severe rater was to move the estimates of examinees at the higher ability levels downward and for the lenient rater to move the estimates of examinees at the lower abilities upward The impact ofignoring rater tendencies under the nested design is clear from Figure I which show the estimated vs true ability estimates for the modeled and non-modshyeled rater effects under the baseline weighting When rater effects were modeled the ability estimates were pulled much closer to a 45shydegree line (see Figure 2)
Both the squared bias and the mean square errors are reduced for extreme raters when they are modeled in the nested design
Under the spiraled design there is a slight overall increase in bias from the nonmodeled rater condition to the modeled rater condishytion However the difference at each ability level is fairly small so that the two ability estimate plots coincide through most ofthe abilshyity distribution (see Figures 3 and 4) Overall the mean square errors are slightly higher under the spiraled design when raters are modshyeled
When the spiraled design is compared to the nested design under the nonmodeled rater condition both the squared bias and the mean square errors are decreased When raters are modeled there is an overall increase in the mean square errors from the nested to the spiraled design However there is no noticeable difference in the squared bias between the two designs
In general the squared bias under the spiraled design with nonmodeled raters is lower than for the nested design with nonmodeled raters and is comparable to modeled rater conditions These results concur with the finding of Hombo et al (2000) that support the notion that when ratings are spiraled rater effects get spread across examinees and the recovery ofability estimates is fairly accurate However the spiraled design did show slightly larger mean square errors than the nested design when raters were modeled
828 Taherbhai and Young
Table 2 Estimation of Squared Bias and Mean Square Effects
Rater Effects Not Modeled
True Nested Design Spiraled Design Theta Baseline Compo 1 Compo 2 Compo 3 Baseline Compo 1 Compo 2 Compo 3
-200
Sqd Bias 000 000 001 002 000 000 000 000 MSE 038 040 041 067 040 042 043 070
-164
Sqd Bias 001 000 002 005 001 001 001 004 MSE 026 027 031 053 028 029 031 057
-127 Sqd Bias 002 001 004 009 001 001 001 003
MSE 022 022 026 042 022 023 024 043 -091
Sqd Bias 004 002 007 014 000 000 001 001 MSE 021 020 025 041 016 018 017 024
-055 Sqd Bias 000 000 000 000 000 000 000 000
MSE 017 018 018 029 016 017 017 027
-018 Sqd Bias 000 000 000 000 000 000 000 000
MSE 017 018 019 029 017 018 019 029 018
Sqd Bias 000 000 000 000 000 000 000 000 MSE 016 017 018 027 014 015 014 020
055 Sqd Bias 000 000 000 000 000 000 000 001
MSE 017 019 018 028 016 018 018 027 091
Sqd Bias 004 002 006 011 000 000 000 om MSE 022 021 026 042 019 020 020 034
127 Sqd Bias 003 001 004 009 001 000 001 001
MSE 022 023 026 042 018 021 019 030 164
Sqd Bias 001 000 002 005 001 001 002 006 MSE 027 029 031 051 031 033 034 062
200 Sqd Bias 001 000 002 003 001 001 001 006
MSE 036 038 040 063 040 043 042 075
Rater Impact on Weighted Composites - 829
Errors Across Designs for Nonmodeled and Modeled Rater
Rater Effects Modeled
Nested Design Spiraled Design Baseline Compo 1 Compo 2 Compo 3 Baseline Compo 1 Compo 2 Compo 3
001 001 001 003 002 002 002 007 037 040 040 065 042 045 047 083
000 000 001 001 001 001 001 005 024 025 027 048 028 029 031 060
000 000 000 000 000 000 001 002
019 021 021 033 021 023 023 041
000 000 000 000 000 000 000 000 016 018 018 027 018 020 019 031
000 000 000 000 000 000 000 000 016 017 018 028 016 017 017 027
000 000 000 000 000 000 000 000 017 018 018 028 017 017 018 028
000 000 000 000 000 000 000 000 015 016 017 026 016 017 018 028
000 000 000 000 000 000 000 000 017 018 018 027 016 017 017 026
000 000 000 000 000 000 000 001 018 019 019 030 019 020 020 034
000 000 000 000 000 000 000 001 019 021 020 032 020 022 022 038
000 000 000 001 001 001 001 006 025 027 027 045 031 033 033 060
000 000 000 002 001 000 001 006 034 037 036 060 041 044 043 077
euro c 0(
C
IV
1
150
0
050
0
E
-25
00
-15
00
050
0 1
500
tl w
-15
00
(Xl
Fig
ure
1
Est
imat
ed v
s T
rue
Abi
lity
W
eigh
ted
Nes
ted
Des
ign
Wit
hout
Rat
ers
Mod
eled
w
o
250
0 1-3 ~ ~ =shy = =
== ~
~
o =
(JCl ==
250
0
-25
00
True
Ab
ility
~B
asel
ine ~
Com
posi
te 1
-
-C
om
po
site
2 -
-
Co
mp
osi
te 3
Fig
ure
2
Est
imat
ed v
s T
rue
Abi
lity
W
eigh
ted
Nes
ted
Des
igns
Wit
h R
ater
s M
odel
ed
250
c ~
I g ~
n o =
~
~ I1Q
250
0 =shy shy
l (j o 3 tl o til shy til
-25
0
Tru
e A
bili
ty
00
w
~
Bas
elin
e ~
Com
posi
te 1
-~
--
Com
posi
te 2
)(
C
ompo
site
3
g ~ tI ~ E
-25
00
-20
00
I
III
W
150
050
-15
00
-10
00
050
0 1
000
150
0 2
000
-15
0
832 Taherbhai and Young
Parameter Recovery for Weighted Composites
Across the weighted composites the mean squared errors increased as the weight assigned to the OE tasks increased This was true for both the nested and spiraled designs regardless of whether or not rater effects were modeled The squared bias on the other hand was fairly constant except for the ends of the ability distribution in Comshyposite 3
For the nested design when rater effects were not modeled and weights were included in the analysis the rater effects interacted with the weights assigned to the composite The composites with the highest OE task weights showed the greatest impact on the estimates ofexaminee ability at ends of the distribution (Figure 1) This is due to the effect of the extreme raters scoring exanlinees at the low and high ends of the ability distribution When rater effects are modeled the recovery of examinee abilities improves at the extreme ends of the ability distribution (Figure 2) Changes in OE task weights had little effect on the estimation of examinees of moderate abilities reshygardless of the modeling of raters since these were the examinees scored by moderate raters
Plots of the estimated vs the true abilities for the spiraled design composites are shown for the non-modeled rater effects in Figure 3 and for the modeled rater effects in Figure 4 With the exshyception of Composite 3 the recovery ofparameters was fairlyaccushyrate for the spiraled design regardless of whether the rater effects were modeled The modeling of raters in Figure 4 had the effect of straightening the plots in Figure 3 except for Composite 3 which has the greatest weight placed on OE tasks of all of the composites Contrary to the decrease in squared bias the mean square errors inshycreased slightly from the non-modeled rater condition to the modshyeled rater condition when the OE task weights in the composites inshycreased
Student Classification at the Quartiles for Different Composshyites
When cutpoints at the quartiles were examined (Table 3) under the two designs and the different weighting conditions the results did
Fig
ure
3
Est
imat
ed v
s T
rue
Abi
lity
W
eigh
ted
Spi
rale
d D
esig
ns W
itho
ut R
ater
s M
odel
s
250
0
200
0
150
0
euro c laquo C
IIgt
1U
E
t
w
-25
00
-15
00
100
0
050
0
-10
00
050
0
-15
00
-20
00
-25
00
Tru
e A
bilit
y
to
-B
ase
line
-0
--
Co
mp
osi
te 1
-
-shy--
Co
mp
osi
te 2
=c
~ (
) a C
~
f) o =
~
()
150
0 2
500
(JQ
=shy shy Q
()
o a C
o f- (
)
f-
00
J
)
)(
Co
mp
osi
te 3
J
)
00
g ~ CI
Ggt
1U
150
0
050
0
E
-25
00
-20
00
-15
00
-1
000
050
0 1
000
150
0 2
000
~
w
-15
00
Fig
ure
4
Est
imat
ed v
s T
rue
Abi
lity
W
eigh
ted
Spi
rale
d D
esig
ns W
ith
Rat
ers
Mod
els
w
Jgt
250
0 ~ =shy ~
I C =shy ~ ~ = ~ ~ Q
=
IJC =
250
0
-25
00
True
Abi
lity
-
Bas
elin
e --
O--
Co
mp
osit
e 1
bull
Com
posi
te 2
)0
( C
ompo
site
3
m
Rater Impact on Weighted Composites - 835
not differ much from Taherbhai and Youngs (2000) results Rere again there was little movement from one condition to another unshyder the two designs and consistency in examinee classification was very high
CONCLUSIONS
The impact of rater effects is well documented in the literature (Engelhard 1994 1996 Rombo et aI 2000 Linacre 1989 Lunz et aI 1990) The composite effect of weighing Me items and OE tasks differentially however has not received much attention
Under the nested design when very severe or lenient raters are paired with examinees at the ends of the ability distribution exshyaminee ability estimates can be systematically distorted As LUllZ Wright and Linacre (1990) point out ifraters are used to score tasks for assessments and their effects are not modeled it may lead to poor ability estimates especially if extreme raters are paired with examinshyees that are extreme in their abilities Furthermore weighing items and tasks differentially confounds rater effects and further complishycates the recovery of true ability estimates of examinees
The use of spiraled over nested designs when rater effects are not modeled was justified in Rombo et aI (2000) due to the deshycrease in bias that these designs provided in estimating examinees abilities This result is supported by our study The recovery of exshyaminee abilities and the overall MSEs was better for spiraled designs than nested designs when rater effects where not modeled The spishyraled design with unmodeled rater effects was also comparable to the modeled nested design except for the very slight increase in MSE
However any advantage that the spiraled design has in reshyducing the bias ofability estimates decreased when composite scores were used that placed much greater weights on open-ended tasks than those on the multiple-choice items In this situation the bias and the MSE increased not only for the unmodeled nested design but also for both the modeled and the unmodeled spiraled designs
As stated in the paper this study is not exhaustive of all the possible rater designs and weighted conditions that could be included Further research needs to be undertaken to examine the complex inshy
836 Taherbhai and Young
Table 3 Percent of Students Changing Classification with Respect to Quartiles
Nested Design Spiralled Design
Oassification Change Oassification Change
ConditionlCutpoint Up own Up Down
Baseline
Rater Effects Modeled vs Not
Modeled
Q3 3
Median
QI 2
Rater Effects Not Modeled
Baseline vs Corrposite I
Q3 2
Median
QI 2
Baseline vs Corrposite 2
Q3 3
Median
QI Baseline vs Corrposite 3
Q3 3
Median
QI
Rater Effects Modeled
Baseline vs Corrposite I
Q3 Median
QI Baseline vs Corrposite 2
Q3
Median
QI Baseline vs Corrposite 3
Q3
Median
QI
Rater Impact on Weighted Composites - 837
teraction of raters tasks and examinee abilities when creating spishyraled designs and applying them to assessments that use weighted composite scores It would also be interesting to obtain results under the spiral design when the number of raters are more than the tasks that have to be rated Under this condition a semi-nestedspiral deshysign would exist in which a sub-set of students would be rated by some raters while another sub-set would be rated by a different group of raters The raters within a subset however would be spiraled
This paper should serve as a warning for obtaining composite scores by increasing the weights ofOE tasks relative to the MC items for less than substantive reasons and also for unknowingly pairing extreme raters with extreme-ability-students when the spiraled deshysign is not used or under the nested design without modeling rater effects
REFERENCES
Andrich D (1978) A rating formulation for ordered response categories Psychometrika 43 561-563
College Board (1988) The College Board technical manual for the Advanced Placement Program New York NY College Entrance Examination Board
Engelhard G (1996) Evaluating rater accuracy in performance asshysessments Journal ofEducational Measurement 31 (1) 56-70
Engelhard G (1994) Examining rater errors in the assessment of written-composition with the many-faceted Rasch model Jour nal of Educational Measurement 31(2) 93-112
Hombo C M Thayer D T amp Donoghue 1 R (2000) A simulashytion study of the effect ofcrossed and nested rater designs on ability estimation Paper presented at the annual meeting ofthe National Council on Measurement in Education New Orleans LA
Linacre 1 M (1989) A users guide to FACETS Rasch measure ment program and Facform data formatting computer program Chicago IL MESA Press
838 Taherbhai and Young
Linacre1 M (1993) Many-facet Rasch measurement Chicago IL MESA Press
Lunz M E Wright B D amp Linacre 1 M (1990) Measuring the impact ofjudge severity on examination scores Applied Mea surement in Education 3(4) 331-345
Taherbhai H M amp Young M 1 (2000) An analysis ofrater impact on composite scores using the multifaceted Rasch model Pashyper presented at the annual meeting of the National Council on Measurement in Education New Orleans LA
JOURNAL OF OUTCOME MEASUREMENT7 5(1) 839-863
Copyright8 2000 Rehabilitation Foundation Inc
Measuring disability application of the Rasch model
to Activities of Daily Living (ADLIIADL)
T Joseph Sheehan PhD
Laurie M DeChello
Ramon Garcia
Judith FifieldPhD
Naomi Rothfield MD
Susan Reisine PhD
University ofConnecticut School ofMedicine amp
University ofConnecticut
Requests for reprints should be sent to T Josep Sheehan University of Connecticut School ofMedicine 263 Farmington Ave Farmington CT 06030
839
840 SHEEHAN et al
This paper describes a comparative analysis of (ADL) and (IADL) items administered to two samples 4430 persons representative of older Americans and 605 persons representative of patients with rheumatoid arthrisit (RA) Responses are scored separately using both Likert and Rasch measurement models While Likert scoring seems to provide information similar to Rasch the descriptive statistics are often contrary if not contradictory and estimates of reliability from Likert are inflated The test characteristic curves derived from Rasch are similar despite differences between the levels of disability with the two samples Correlations ofRasch item calibrations across three samples were 71 76 and 80 The fit between the items and the samples indicating the compatibility between the test and subjects is seen much more clearly with Rasch with more than half of the general population measuring the extremes Since research on disability depends on measures with known properties the superiority ofRasch over Likert is evident
INTRODUCTION Physical disability is a major variable in health related research Assessing the degree ofdifficulty in performing Activities ofDaily Living (ADL) and Instrumental Activities ofDaily Living (IADL) scales is a common way to measure physical disability Individuals are asked how much difficulty they have in performing activities ofdaily living such as dressing getting up from a chair or walking two blocks For each activity there are 4 possible responses no difficulty some difficulty much difficulty or unable to do Responses are scored from 1to 4 or from 0 to 3 summed across all items and averaged to yield a disability score the higher the average the greater the disability These well-validated scales are efficient and widely used but their ordinal scaling can result in distortion by masking ineffective treatments or hiding effective procedures (Merbitz Morris amp Grip 1989)
Ordinal scales do not have any obvious unit ofmeasurement so that addition and division ofunknown units is considered meaningless Wright and Linacre (Wright amp Linacre 1989) have argued that while all observations are ordinal all measurements must be interval ifthey are to be treated algebraically as they are in computing averages The Rasch (Rasch 1980) measurement model offers a way to create interval scales from ordinal data a necessary condition for averaging or analyzing in statistical models that assume interval data
MEASURING DiSABILITY 841
As Wright and Linacre (Wright amp Linacre 1989) maintain computing an average score implies a metric that is only available with an interval scale In addition those average scores are non-linear and thereby lack a fimdamental property assumed in all measurers from yardsticks to financial worth that the measures increase along a linear scale Recognition of this problem is not new Thorndike (Thorndike 1904) identified problems inherent in using measurements ofthis type such as the inequality ofthe units counted and the non-linearity ofraw scores This study demonstrates how the Rasch measurement model converts non-linear ordinal data to a linear interval scale that provides new information about the utility ofcommonly used measures ofdisability While demonstrating the application ofthe Rasch model is the main purpose ofthis study it also includes a number ofcomparisons Rasch person measures are compared to Lickert person scores Rasch item calibrations are compared to Lickert item scores Rasch item calibrations estimated on a sample of older Americans are compared to item measures estimated on a sample of American rheumatoid arthritis (RA) patients and to those same items estimated on a sample ofBritish RA patients These comparisons should enhance understanding ofthe strengths and perhaps limitations ofusing the Rasch model in practice
Background
Before considering Rasch there is an alternative to averaging ranked data and treating them as interval and that is to simply treat them as ranked data Responses to each ADL item can be rank ordered ie no difficulty is less than some difficulty is less than much difficulty is less than unable to do so that responses to the ADL tasks can be ordered Also the ADL tasks themselves can be ordered For instance for most people walking two blocks is more difficult than lifting a cup or a glass to ones mouth It is easy to imagine individuals who though completely unable to walk two blocks would have no difficulty lifting a full cup or glass Because items can be ordered according to a scale of inherent difficulty ADL items have been organized into hierarchies and disability status is determined by where a persons responses fall along the ordered
842 SHEEHAN et al
hard-to-easy hierarchy One such scoring scheme was proposed by Katz (Katz Downs Cash amp Grotz 1970) the creator ofthe original six item ADL scale Another step-wise scoring scheme was recently reported by S01111 (S01111 1996)
Lazaridis and his colleagues (Lazaridis Rudberg Furner amp Casse 1994) studied the scalabilityofselected ADL items using criteria associated with Guttman scales For Guttman (Guttman 1950) a set ofitems is a scale ifa person with a higher rank than another person is just as high or higher on every item than the other person Lazaridis found that the Katz scoring scheme fulfilled Guttmans scaling criteria Lazaridis and his colleagues went further however and showed that the Katz hierarchy was one of360 possible hierarchies based upon permutations ofsix ADL items Lazaridis tested all 360 ofthese hierarchies using the same Guttman scaling criteria and found four additional scoring schemes that performed equally as well as Katz and found a total of103 scoring hierarchies that satisfied minimum standards ofscalability according to Guttman
While Guttman scaling does not violate the ordinal nature ofthe scales neither does it produce measures suitable for outcomes analyses that assume interval scaled measures Also Guttmans measurement model is deterministic rather than probabilistic and assumes that responses fall along a single hierarchy in a fixed order The Guttman model would have difficulty WIth that rare individual who was able to walk two blocks but unable to lift a full cup to hislher mouth Daltroyet al tested a Guttman scale of ADL items to determine whether musculoskeletal function deteriorates in an orderly fashion (Daltroy Logigian Iversen amp Liang 1992) They recommended that lifting a cup be dropped because it was too easy We discuss the item later Furthermore the fact that there is not a single hierarchical scale but as many as 103 different hierarchies underlying Katz six original ADL items exposes the disadvantage ofa rigid and deterministic hierarchy Amore attractive approach would capture the probabilistic nature ofthe responses without losing the concept ofa hierarchical scoring function The Rasch measurement model provides such an alternative
Rasch a Danish statistician interested in measuring spelling ability created a probabilistic measurement function which simultaneously
MEASURING DiSABILITY 843
estimates the abilities ofpersons and the difficulty oftest items Rasch showed how the probability ofanswering a question correctly depended on two things the ability ofthe person and the difficulty ofthe test item His model estimates person ability and item difficulty simultaneously and shows that the two are independent (Rasch 1980 p 19) Moreover the model provides a common scale for assessing both persons and items The distribution ofitem difficulties can be examined and compared directly to the distribution ofperson abilities on the same scale permitting visual judgments about the appropriateness of these items for these people Furthermore the common scale turns out to be an interval scale that is linear in contrast to the non-interval and non-linear scale calculated from the sum ofthe ranks or the average rank
METHODS
There are two sets ofsubjects used in this study The first set includes 4430 persons who were between ages 50 and 77 during the first National Health And Nutrition Examination Survey (NHANES I) carried out between 1971 and 1975 and who provided complete or nearly complete answers to the 26 ADL items administered during the NHANES Followshyup Study (NHEFS) conducted between 1982 and 1984 There were no initial measures ofphysical disability administered during NHANES I comparable to the ADL items NHANES I was administered to a national probability sample ofthe civilian noninstitutionalized US popUlation (Hubert Bloch amp Fries 1993 Miller 1973)
The persons in the second study group are a nationally representative sample ofpatients with RA (Rei sine amp Fifield 1992) The patients were recruited in 1988 using a two-stage process to ensure that it represented RA patients cared for by board-certified rheumatologists First a sample of 116 board-certified rheumatologists was randomly selected from the membership ofthe American College ofRheumatology In the second stage patients with definite or classical RA were asked to participate as they visited the office over a defined recruitment period Nine hundred twenty-one (88) ofthe patients who initially expressed interest agreed to participate in the panel study Patients were interviewed
844 SHEEHAN et al
yearly by telephone regarding their social physical and emotional fimctioning including their fimctional ability using the Health Assessment Questionnaire (HAQ) (Fries Spitz Kraines amp Holman 1980) The data for the present analysis are from those patients who participated in the sixth year interview ofthe panel study (N=605 66 ofthe original panel) A recent study (Rei sine Fifield amp Winkelman 2000) indicates that those who continued to participate had a higher level ofeducation were more likely to be female had higher social support and fewer joint flares
For comparison ofitem calibrations data on a third set ofsubjects are included 174 from Great Britain diagnosed withRA (Whalley Griffiths amp Tennant 1997) The inclusion ofanotherRA group allows comparison ofitem calibration between groups ofpatients with the same diagnosis and between RA patients and the general popUlation ofolder Americans Person measures were not available for the British RA group
The NHEFS data were extracted from the tapes using SAS (SAS Institute 1989) Initial statistical analyses were performed using SPSS 80 (SPSS 1997) andPRELIS 212 (SSI 1998) Computations for the Rasch model were performed using WINSTEPS (Linacre amp Wright 1998b) a computer program written by Linacre and Wright (Linacre amp Wright 1998a)
Although Rasch created his model with test items which could be scored right orwrong Andrich (Andrich 1988) has extended the Rasch model to rating scales which include items with ordered response alternatives such as those found on the ADL scale Thus each item instead ofbeing scored right orwrong is considered to have two or more ordered steps between response categories The Andrich model estimates the thresholds for each item separating each ordered step from the next that point on a logit scale where a category 1 response changes to a category 2 response a category 2 response changes to a category 3 response or a category 3 response changes to a category 4 response The Andrich model also offers the user a choice between a model that assumes equal steps between categories the rating scale model or a model that actually estimates the distance between categories the partial credit model (Andrich 1978) the latter being used in this study to conform to the
MEASURING DiSABILITY 845
Whalley et al analysis The Rasch analysis estimates the difficulty level ofeach ADL item
and the ability level ofeach person along the same logit scale The Rasch analysis also produces a test characteristic curve which graphs the relationship between each person measure and the expected score based on the sum ofthe ranks the numerator used to compute a Likert score In
this study the test characteristic curve for 19 of26 ADL items from the
NHANES study is compared to the test characteristic curve estimated from 19 of20 parallel items in the Reisine study The 19 items used in the Reisine study are taken from the twenty item Health Assessment Questionnaire (HAQ) (Fries et aI 1980) The 19 HAQ items contain 15 exact matches and 4 items that are very similar to those used in the NHEFS The item abbreviations and full text for both ADL and HAQ are shown in Table 1 One of the 26 ADL items walkfrom one room to another on the same level had too many missing responses to be included in these analyses The parallel item from the HAQ walk outdoors on flat ground was dropped leaving 19 items to compute test characteristic
curves for comparison
RESULTS
The initial analyses showed skewed distributions ofresponses on all 25 ADL items for the NHEFS sample The category 1 responses ranged from a high of953 who had no difficulty lifting a cup to a low of 600 who had no difficulty with heavy chores The category 4 response unable to do an activity is uniformly low under 10 for most items with heavy chores being impossible for 174 A complete table of responses is available from the authors Skewness is also seen in the responses ofthe RA patients although their overall level ofdisability is higher
Figure 1 summarizes person disability measures horizontally and item difficulty level vertically for NHEFS Persons are distributed across the bottom with M marking the mean and S the standard deviation There are 102 persons at the mean (M) of-227 There are 2079 persons at the bottom end ofthe scale who have no difficulty with any ofthe ADL
846 SHEEHAN et al
Table 1
Item abbreviashytion Dresself
Shampoo Arisechr
Inoutbed Makefood Cutrneat Liftcup
Openmilk Wlk2b1ck
Wlk2step
Faucets Bathtub Washbody
Toilet Combhair Reach51b
Pkupclth
Cardoors Openjars
Write
Inoutcar Shop Ltchores
Liftbag
Hvchores
ADL
Dress yourself including tying shoes working zippers and doing buttons Shampoo your hair Stand up from an armless straight chair Get into and out of bed Prepare your own food Cut your own meat Lift a full cup or glass to your mouth Open a new milk carton Walk a quarter mile (2 or 3 blocks) Walk up and down at least two steps Turn faucets on or off Get in and out of the bathtub Wash and dry your whole body Get on and off the toilet Comb your hair Reach and get down a 51b Object (bag of sugar) from just above your head Bend down and pick up clothing from the floor Open push button car doors Open jars which have been previously opened Use a pen or pencil to write with Get in and out of a car Run errands and shop Do light chores such as vacuuming Lift and carry a full bag of groceries Do heavy chores around the house or yard or washing windows walls or floors
Activities ofDailyLivin~ (ADL) and Health Assessment QuestionnaIre items
close match modlfied
HAQ
Dress yourself including tying shoelaces and doing buttons
Shampoo your hair Stand up from an armless straight chair Get in and out of bed
Cut your meat Lift a full glass or cup to your mouth Open a new milk carton
Climb up five steps
Turn faucets on and off Take a tub bath Wash and dry your entire body
Get on and off the toilet
Reach and get down a 51b object from just above your head
Bend down and pick clothing up from the floor Open car doors Open jars which have been previously opened
Get in and out of a car Run errands and shop Do chores such as vacuuming and yard work
MEASURING DiSABILITY 847
items and 15 persons at the right end ofthe scale who were unable to perform any ofthe tasks When extreme persons are included the mean for persons drops from -227 to -393 and the standard deviation increases from 167 to 222 The presence ofso many atthe bottom of the scale draws attention to the floor effects ofthe test at least for the general population ofolder Americans
The right-hand column in Figure 1 orders items from easiest at the top to hardest at the bottom Items at the top ofthe Rasch scale such as lift a cup or turn afaucet on or off are easier than items below with the hardest items at the bottom lift and carry a full bag ofgroceries or do heavy chores around the house or yard To the left ofeach item the responses 123 and 4 are arranged at a location corresponding to the expected measure ofa person who chose that response to that item Thus the expected measure ofa person who responded with a 4 to the easiest item unable to lift afull cup or glass to ones mouth would be slightly greater than 4 or the most disabled end of the scale Whereas the expected measure ofa person who chose category 4 in response to the hardest item and was unable to perform heavy chores would be aboutshy08 almost a standard deviation above the mean person disability measure of -227
Figure 1 also shows a colon () separating the response categories for each item Those separation points are the thresholds between response categories estimated by the Andrich model mentioned earlier The mean item calibration is 00 and standard deviation is 111 It is noteworthy that the mean item calibration ofzero and standard deviation of111 suggests that the item distribution is far to the right ofthe person distribution Also the item standard deviation of 111 suggests far less dispersion among items than the dispersion among persons which reaches 222 when extreme measuring persons are included Such misalignment ofthe item andperson distributions signals serious limitations in using this measure for these persons The distribution of person measures is far lower than the distribution ofitem calibrations indicating a poor fit between this test and these persons at least at the time these items were administered that is the first ofseveral follow-up surveys on the same SUbjects For an ideal test the distribution ofitems and persons should show similar alignments
848 SHEEHAN at al
EXPECIED scxFE MEAN ( INDIaITES HALF-scxFE roINr) -5 -3 -1 1 3 5 7 I---+shy I ITEM 1 1 2 3 4 4 liftrnp 1 1 2 3 4 4 faucets 1 1 2 3 4 4 cxnbhair 1 1 2 3 4 4 toilet 1 1 2 3 4 4 arisEtecl 1 1 2 3 4 4 write 1 1 2 3 4 4 cpenjars 1 1 2 3 4 4 cutrreat 1 1 2 3 4 4 qenmilk 1 1 2 3 4 4 carctors 1 1 2 3 4 4 washIxxiy 1 1 2 3 4 4 dresself 1 1 2 3 4 4 inoutcar 1 1 2 3 4 4 rrekefcxxj 1 1 2 3 4 4 walk2ste 1 1 2 3 4 4 pkuplth 1 1 2 3 4 4 arisedrr 1 1 2 3 4 4 sharrpo 1 1 2 3 4 4 reach5Jb 1 1 2 3 4 4 bathtub 1 1 2 3 4 4 shcp 1 1 2 3 4 4 Itd10res 1 1 2 3 4 4 wlk2blck 1 1 2 3 4 4 lifttag 11 2 3 4 4 hvd10res I---+shy I I -+shy I I ITEM -5 -3 -1 1 3 5 7
2 o 3 211 111 7 5 1 8 3997010877675453322121 1 1 9 3883730403642918894807786977099501673 52 3 2 5 PERSN
S M S Q
Figure 1 Most probable responses items are ordered onthe right hand side with less difficult items on the top Persons are ordered on the bottom with more disabled persons on the right The figure answers the question which category is aperson ofaparticular person measure most likely to choose The distribution ofitem difficulties has amean ofzero and a standard deviation ofl04 The distribution of231 0 non-extreme person measures has amean of-218 and a standard deviation of168 There are 2079 extreme responses at the bottom ofthe scale and 15 extreme responses at the top ofthe scale
MEASURING DiSABILITY 849
The fit may improve as this population ages and becomes more disabled
In contrast the Rasch analysis ofthe RA sample shows a mean of-180 for 563 non-extreme persons indicating a higher level ofdisability than in the general population Also there are only 41 extreme measures 40 with no difficulty on any item and one person was unable to perform any ofthe ADL tasks The misalignment between the item and person distributions is not as severe for the RA patients but the item distribution centered about zero with a standard deviation of096 is still higher and more dispersed than the person distribution It is noteworthy that the mean for non-extreme NHEFS changes little from -227 to -212 when 19 rather than 25 ADL items are used likewise the mean changes little when extreme persons are included -393 to -386
Figure 2 graphs the relationship between person measures for the 25 ADL items and the Likert score the average ofthe sum ofthe ranks The graph demonstrates the non-interval and non-linear nature ofLikert scores Thus while the Rasch measures are linear and use the sanle invariant interval across the entire range ofmeasures the Likert scores are neither linear nor invariant Likert metric is about four times greater in the middle than toward the top or bottom ofthe scale a clear violation ofthe linearity assumption underlying all valid measurement There is a similar curve for the RA sample While Figure 2 shows the curve relating Rasch measures to observed Likert scores Winsteps also produces curves for a test based upon statistical expectations called the test characteristic curves
Figure 3 shows two test characteristic curves based upon a set of 19 ADL items One curve is estimated from the NHEFS sample the second curve from patients with Rheunlatoid Arthritis (RA) (Rei sine amp Fifield 1992) The NHEFS sample is slightly older on average than the RA sample 620 years versus 590 years and is more male 43 versus 22 Although the salllples differslightly in age and considerably in gender and disability with disability levels higher among the RA patients the test characteristic curves are similar
While the characteristic curves indicate that the two instruments process raw scores in much the same way it is helpful to examine the items themselves Table 2 contains the item calibrations for NHEFS for the RA sample and for the RA patients from Great Britain studied by
850 SHEEHAN et al
400rshyI
I o 300shy
~ laquo Q)
~ 2001
~
100 + I
-500
Rasch person measure on 25 ADL items
--r---- shy-250
I 000
I 250 500
Figure 2 Graph ofRasch measures for persons and ADL average scores based on the average rank assigned to each of25 ADL items
Whalley Griffiths and Tennant (Whalley et aI 1997) The item error varies from 03 to 08 for NHEFS from 06 to 09 for HAQ US and from 11 to 15 for HAQ UK Ideally infit root mean square standard errors should be at or near one Wash and dry body was the furthest from one in the NHEFS sample at 70 take a bath at 166 in HAQ US and wash and dry body at 58 in HAQ UK were those samples only extreme items These items do not fit the scales as well as all other items
MEASURING DiSABILITY 851
Wash and dry body in both the NHEFS and HAQ UK samples may indicate this item is dependent on the data but it is not so severe for NHEFS Take a bath in the HAQ US sample causes some noise in the scale however all other items are within 18 0 f one It appears that there
76 73
70 (f) 67 E 64 Q)
61 0 58 (J
55c 0 52 (f) 49Q)
46(f) c 430 0 40 (f)
37Q)
cr 34-0 31 E 28 -J () 25
NHEFS 22 -shy19
RA -8 -4 -2 0 2 4 6 8
Person Measure
Figure 3 Test characteristic curves for 19 similar ADL items administered to NHEFS and RA samples demonstrating the non-linear nature ofscores based upon the sum ofthe ranks and the similarity ofthe curves despite differences in the samples
Craquo
Tab
le 2
NH
EF
S H
AQ
US
and
HA
Q U
K it
em c
ompa
riso
n T
he it
em m
easu
res
are
from
the
part
ial c
redi
t II
)
UI
Ras
ch m
odel
en
I
m
m
Num
ber
Item
N
HE
FS
H
AQ
US
H
AQ
UK
N
HE
FS
H
AQ
US
H
AQ
UK
j
Mea
sure
s M
easu
res
Mea
sure
s R
ank
s R
ank
s R
ank
s _z
1
Lif
tcu
p
266
8
2 2
60
1 5
1 ~
2 F
auce
ts
156
9
9
70
2 3
5 shy
3 T
oil
et
71
153
1
44
3 2
2 4
Ari
seb
ed
56
154
7
8 4
1 3
5 O
pen
iars
3
6 2
0
-66
5
8 14
6
Cu
tmea
t 2
9 1
1 -
45
6 9
13
7 O
pen
mil
k
29
-11
0 -1
48
7 16
18
8
Car
do
ors
2
5 3
0
11
8
7 8
9 W
ash
bo
dy
1
2 3
8
-33
9
6 12
10
D
ress
elf
02
-01
1
1 10
11
9
11
In
ou
tcar
-
12
91
71
11
4 4
12
W
alk
2st
ep
-35
-
14
10
12
14
10
13
P
ku
pcl
th
-36
0
3 3
0 13
10
6
14
A
rise
chr
-42
-
07
2
6
14
12
7
15
Sh
amp
oo
-
45
-13
-
23
15
13
11
16
R
each
5lb
-1
15
-13
1 -1
86
16
1
7
19
17
B
ath
tub
-1
28
-18
7
-10
9 1
7
19
17
18
S
ho
p
-13
3 -
35
-7
2
18
15
15
19
L
tch
ore
s -1
37
-18
1 -1
01
19
18
16
Item
err
or
var
ies
from
03
to
08
forN
HE
FS
0
6 t
o 0
9 f
or
HA
Q U
S
and
11
to
15
for
HA
Q U
K
Th
e on
ly e
xtr
eme
infi
t ro
ot
mea
n s
qu
are
erro
rs a
re w
ash
an
d d
ry b
od
y at
7
0 a
nd
5
8 f
orN
HE
FS
an
d H
AQ
UK
re
spec
tiv
ely
an
d ta
ke
a ba
th a
t 1
66 f
orH
AQ
US
MEASURING DiSABILITY 853
are tasks which are ofdifferent difficulty for RA patients than for the general population ofolderAmericans Perhaps the most striking difference is the difficulty ofopening a milk carton where the difficulty for RA patients is -11 0 and -148 among their most difficult tasks as compared to 29 for the general public It also appears that getting in and out of cars is more difficult for the general public than for RA patients -12 versus 91 and71 respectively Likewise getting on and offofa toilet is easier for RA patients than for the general public 153 and 144 versus 71 Perhaps the most striking difference is that of lifting a full cup or glass to ones mouth where the American RA patients differ substantially from the British RA patients and from the US general public 82 versus 266 and 260 respectively The size ofthis difference does not seem spurious because follow-up ofUS RA patients one and two years later shows that item calibrations for lifting a cup were similar 55 And 85 Daltroy et al had earlier (1992) recommended replacing lift a cup with opening ajar based on an extreme Rasch Goodness ofFit t of72 Table 2 shows that opening ajaris more difficult for BritishRA patients than for the other two groups -66 versus 36 and 20 respectively
Figure 4 shows the two sets ofRA items are plotted against each other The numerals marking each point correspond to the item numbers in Table 2 The correlation between the two sets ofitems is 80 and ifthe most discrepant item lifting a cup is removed the correlation reaches 87 The correlation between the NHEFS item calibrations and the British RA calibrations are 76 and 71 with the American RA calibrations The correlation between the NHEFS and US RA items rises from 71 to 77 if the most discrepant item lifting a cup is removed
Another way to compare the hierarchical nature ofthe items is to tirst rank each item relative to its own sample and then to compare ranks across samples Where the relative difficulty ofopening a milk carton was 6th for NHEFS it was 16th and 18th for the RA samples Surprisingly getting in and out ofa car was 4th for both RA samples but 11 th for NHEFS Lifting a cup was first or easiest for NHEFS and the British RA samples but 5th for the US RA san1ple Then there are some AmericanshyBritish differences Picking up clothes from the floorwas 13th and 10th for the Americans while it was 6th for the British Similarly standing up from an armless chair was 14th and 12th for the Americans while it was
854 SHEEHAN et al
o 1
HAQ_G8 =-004 + 085 haCLUS Itn e R-Square =064
o 3I
tn m10
E 12 0 4
E (1) cP1 ~ 00 8CD 00
() 15 0 9 o 6
o 18 0 5~ J_10
o 7
o 16-20~
-200 -100 000 100
HAQ US item measures
Figure 4 The item measures from the British and US RA samples Item nwnbers correspond to Table 2
7th for the British Other than these 5 sets ofdifferences there do not appear to be major differences in the item hierarchical structure among these items Despite these limitations there is an overall similarity of hierarchical structure and especially with the similarity oftest characteristic
MEASURING DiSABILITY 855
curves it is interesting to compare the distribution ofNHEFS and US RA samples further
The theoretical independence ofperson and item estimates was shown early by Rasch (Rasch 1980) for dichotomous items and its extension to estimating thresholds between categories within each item has already been described by Andrich and van Schoubroeck (Andrich amp van Schoubroeck 1989) Andrich and van Schoubroeck also point out that no assumptions need to be made about the distribution of~n in the population (Andrich amp van Schoubroeck 1989 p 474) As shown below the person distributions are dramatically different for the NHEFS and RA samples
Figure 5 shows the distribution ofpersons and items for the RA and NHEFS samples based on Likert scoring To see how sample
dependent the item calibrations are for the Likert scoring compare the distribution of item averages in Figure 5 where they are much more bunched together for the NHEFS sample than they are forthe RA sample The pattern ofitem calibrations for Rasch measurement is more similar across samples as seen in Figure 6 It is clear from both figures that the distribution ofdisability is different in RA patients than in the general population Both figures show that the NHEFS sample has a much higher percentage of persons at the lower end of the scale Both Likert and Rasch also show the reversed J shape for the NHEFS sample and a flatter distribution ofRA patients It would appear at least at first that both Likert scores and Rasch calibrations provide similar infonnation about the distribution ofdisability in these two populations Important differences become apparent when the moment statistics mean standard deviation skewness and kurtosis shown in Table 3 enhance the infonnation available from the graphical images
The means show a higher level ofdisability in the RA sample but the differences seem greater on the Rasch scale The Likert means appear closer 124 and 175 than the Rasch means -387 and-2l0 although they are both about one standard deviation apart in either metric The standard deviations seem to show a much greater spread on the Rasch scale but are similar for both the Likert scoring and Rasch measurement for the two samples While the means and standard deviations appear to
60
856 SHEEHAN et al
NHEFS
Itchores ariseochr
kuPCllh wlk2step
40
~ampoo dre sse I degrisebed
wash body
penjars20 ardoors
tmeat bathtub pound6 let aop
fa~ Is ~aCh5lb bttc p om 8tcar
0 10 13 16 19 22 25 28 31 34 37 40
Awrage Score
RA
-
12
--
8 r--- sse I - 0 shy
oCu meat I- shy~ oarscia Q clth8ku I- shy
00ram i Qute r4 I- shy
fa eels ~lk step0
liftc P 0 enja 5 tcho s shy0 0
ras body J ris chr r ach5 b 0
0 toil toari ~bed shop
0 o e nm i k ba htub r----
0
I I0 I 10 13 16 19 22 25 28 31 34 37 4
Average Score
Figure 5 Distribution ofLikert scores for persons and items based on 19 common items for NHEFS and RA samples Means = 124 and 175 standard deviations = 52 and 54 skewness = 295 and 75 and kurtosis = 922 and72
MEASURING DiSABILITY 857
be different they are at least consistent in describing the two samples The skewness indices reflect the asymmetry ofthe distributions
The NHEFS skewness index for the Likert scores is nearly twice as large as the index for Rasch measures 295 versus 139 A normal distribution has a skewness index ofzero and a positive index describes a long tail to the right The skewness indices for the RA sample show a reversal of signs 075 to -045 With skewness therefore consistency is lost and the information conveyed by Rasch is both contrary and contradictory to information conveyed by the Likert scores
The indices of kurtosis describing how peaked or flat the distributions are show almost a 5 fold difference between Likert and Rasch for the NHEFS sample 922 and 189 while the indices are close for the RA sample 60 for Rasch and 72 for Likert Since normal theory statistics assume there are excesses neither in skewness nor kurtosis it is clear that the distributional properties ofthe Rasch measures are superior to those ofLikert The Likert scores provide information about skewness and kurtosis that is contrary ifnot contradictory to the information provided by the Rasch analysis The fact that the correlation between Likert scores and Rasch measures is extremely high obviously does not mean the measures are equivalent it simply means that persons are in the same rank order on both scales Furthermore high correlations distract from the real need ofa meaningful metric against which progress can be measured
Finally it is noteworthy that the Rasch reliability estimates are consistently lower than reliabilities estimated from Likert scoring The Rasch reliability ofthe person measures estimated from 25 ADL items is 86 for non-extreme persons and drops to 62 when the 2094 extreme person measures are included The person measure reliability for the RA patients based upon 19 HAQ items is 90 and drops slightly to 88 when 41 extreme person measures are included The coefficient alpha estimate ofreliability for these same items when scored as a Likert scale is 94 In the Rasch analysis the HAQ has greater precision and less measurement error in assessing patients with arthritis than the ADL has in the general population and both have more measurement errorassociated with person measures than suggested by coefficient alpha from a Likert scale
858 SHEEHAN et al
10
0
8hampoo doilel
erisechr Jrisebed b3ucets gftcup
NHEFS
50
40
oopenjars
8utmeat
30 8penm ilk
8ardOOrS~ gash bodya
dresself20 o
~alk2step
6each51b ~noulcar
ampalhtub Jkupclth
-5310 -4202 -3094 -1966 -0676 0230 1336 2446 3554 4662 577
Measure
RA
- r----shy
rshy12
- diftcup
jYashbody
oopenjars6
cutmeat
JWPll h
~ isech
cJen ilk ~ressel ~noutcar
4 I-shy ach Ib ~ mpo Jaucets
~tchO es OW lk2st p oarisebed
lgtatht b
e0 8a~rhf--_rl~_l--__-r-~__--j o shy-6580 -5253 -3926 -2599 -1272 0055 1362 2709 4036 5363 66
Measure
Figure 6 Distribution ofRasch measures for NHEFS and RA samples and items Means = -3_87 and -210 standard deviations = 197 for both skewness =139 and -045 and kurtosis = 189 and 60
MEASURING DiSABILITY 859
Table 3 Summary statistics to describe distribution ofdisability in NHEFS and RA samples using Likert scores and Rasch measures Means Standard Deviation Skewshyness (measure of symmetry and equals 00 for normal distribution tail to the right for posivite value and left for negative value) and Kurtosis (measure of peakness equals 00 for normal distribution)
Scale Sample Mean SD Skewness Kurtosis
Likert NHEFS 124 052 295 922
RA 175 054 075 072
Rasch NHEFS -387 197 139 189
RA -210 197 -045 OliO
CONCLUSIONS
Improved precision in the methods ofmeasuring disability is essential to disability research Thurstone set out the fundamentals ofmeasurement in the 1920s (Wright 1997) and described the universal characteristics of all measurement Measurements must be unidimensional and describe only one attribute of what is measured The Rasch model assumes a single dimension underlying the test items and provides measures offit so that the unidimensionality assumption can be examined Measurements must be linear because the act ofmeasuring assumes a linear continuum as for example length height weight price or volume The Rasch analysis
860 SHEEHAN et al
reveals the non-linear nature ofLikert scores Measurements must also be invariant and use a repeatable metric all along the measurement continuum the essence ofan interval scale The Rasch analysis reveals the lack ofa repeatable metric for Likert scores
While all ADL items showed adequate fit to the Rasch model and hence the unidimensionality requirement has been met further study may show that the single construct ofdisability may have more than one measurable feature In fact some HAQ users combine items into up to 8 subscales (Tennant Hillman Fear Pickering amp Chamberlain 1996) and report similarity in overall measures using either subscales or measures based on all ofthe items They also report large logit differences among items within a subscale Daltroy et al (Daltroy et aI 1992) grouped items into six subscales in search ofa sequential functional loss scale Their aim was to develop a Guttman scale offunction in the elderly They reported that 83 ofnon-arthritic subjects fit their scale compared to 65 ofarthritic subj ects Their Rasch analysis indicated that lifting a cup to the mouth did not fit the Guttman scale pattern In the Daltroy study getting in and out ofa car was grouped with doing chores and running errands as the most difficult subscale In the current study getting in and out ofa car was easier for US RA patients with a rank of 4th easiest compared to lifting a cup which was 5th bull Itwas also 4th easiest for British RA patients and 11 th easiest for the NHEFS sample The current study along with these findings maysignal cautions conceptualizing disability as a singleinvariant sequence orhierarchy The Rasch assumption ofunidimentionality seems intact and we have conducted confirmatory factor analysis using methods suitable for ordinal items and found that a single factor model adequately fit the ADL data Nonetheless the nature ofdisability may well vary within and between groups that even share the same diagnosis such as RA Such variation may be seen in the item calibrations for lifting a cup
The Rasch analysis also demonstrates that theADL based measures ofdisability provide a poor measurementtool for nearly halfofthe NHEFS sample who were entirely disability free during the 1982 to 1984 followshyup Certainly the fit between items and persons is better in a population with more disability such as RA patients However even for RA patients
MEASURING DiSABILITY 861
the estimate ofreliability for the Likert scale is inflated over that provided by the Rasch analysis and the infonnation provided by the Likert analysis about the distribution ofdisability in either the general population or among RA patients is different from and contradictory to the infonnation provided by the Rasch analysis
ACKNOWLEDGEMENTS
Supported in part by grants from the Arthritis Foundation and the Claude Pepper Older Americans Independence Center We thank Dr Alan Tennant from the University ofLeeds for his prompt response to our request for HAQ item data for RA patients from the UK
REFERENCES
Andrich D (1978) A rating fonnulation for ordered response categoshyries Psychometrika 43(4)561-573
Andrich D (1988) Rasch Models for Measurement Newbury Park CA Sage Publications Inc
Andrich D amp van Schoubroeck L (1989) The General Health Quesshytionnaire a psychometric analysis using latent trait theory PsycholMed 19(2)469-85
862 SHEEHAN et al
Daltroy L H Logigian M Iversen M D amp Liang M H (1992) Does musculoskeletal fimction deteriorate in a predictable sequence in the elderly Arthritis Care Res 5(3) 146-50
Fries1 F Spitz P Kraines R G amp Holman H R (1980) Measureshyment ofpatient outcome in arthritis Arthritis andRheumatism 23(2) 137-145
Guttman L (1950) The basis for scalogram analysis In Stouffer (Ed) Measurement and Prediction (Vol 4 pp 60-90) Princeton NJ Princeton University Press
Hubert H B Bloch D A amp Fries J F (1993) Risk factors for physishycal disability in an aging cohort the NHANES I Epidemiologic Followup Study [published erratum appears in J Rheumatol1994 Jan21 (1) 177] J Rheumatol 20(3) 480-8
Katz S Downs T D Cash H R amp Grotz R C (1970) Progress in development ofthe index ofADL Gerontologist 10(1)20-30
Lazaridis E N Rudberg M A Furner S E amp Casse C K (1994) Do activities ofdaily living have a hierarchical structure An analysis using the longitudinal study ofaging Journal ofGerontology 49(2 M47-M51) M47-M51
Linacre1 M amp Wright B D (1998a) A Users Guide to Bigsteps Winsteps Rasch-Model Computer Program Chicago MESA Press
Linacre 1 M amp Wright B D (1998b) Winsteps Chicago MESA Press
Merbitz C Morris 1 amp Grip 1 C (1989) Ordinal scales and foundashytions ofmisinference [see comments] Arch Phys Med Rehabil 70(4) 308-12
Miller H W (1973) Plan and operation ofthe Health and Nutrition Examination Survey United States- 1971-1973 Vital and Health Statistics Series 1(1 Oa) 1-42
Rasch G (1980) Probabilistic Models for Some Intelligence andAtshytainment Tests Chicago MESA Press
Reisine S amp Fifield 1 (1992) Expanding the definition ofdisability implications for planning policy and research Milbank Memorial
MEASURING DiSABILITY 863
Quarterly 70(3)491-509
Reisine S Fifield 1 amp Winkelman D K (2000) Characteristics of rheumatoid arthritis patients who participates in long-term research and who drops out Arthritis Care Res 13(1) 3-10
SAS Institute (1989) SAS (Version 60) Cary NC SAS Institute Inc
Sonn U (1996) Longitudinal studies ofdependence in daily life activities among elderly persons Scandinavian Journal of Rehabilitation Medicine S342-28
SPSS (1997) SPSS (Version 80) Chicago SPSS
SSI (1998) PRELIS (Version 220) Lincolnwood IL Scientific Softshyware International
Tennant A Hillman M Fear 1 Pickering A amp Chamberlain M A (1996) Are we making the most ofthe Stanford Health Assessment Questionnaire British Journal ofRheumatology 35574-578
Thorndike E L (1904) An Introduction to the Theory ofMental and Social Measurements New York Teachers College
Whalley D Griffiths B amp Tennant A (1997) The Stanford Health Assessment Questiom1aire a comparison ofdifferential item functionshying and responsiveness in the 8- and 20 item scoring systems Brit J Rheum 36(Supple 1) 148
Wright B (1997) A history ofsocial science measurement MESA Memo 62 Available httpMESAspcuchicagoedulmemo62htm [1998 Oct 29 1998]
Wright B D amp Linacre 1 M (1989) Observations are always ordinal measurements however must be interval Archives ofPhysical Medishycine and Rehabilitation 70857-867
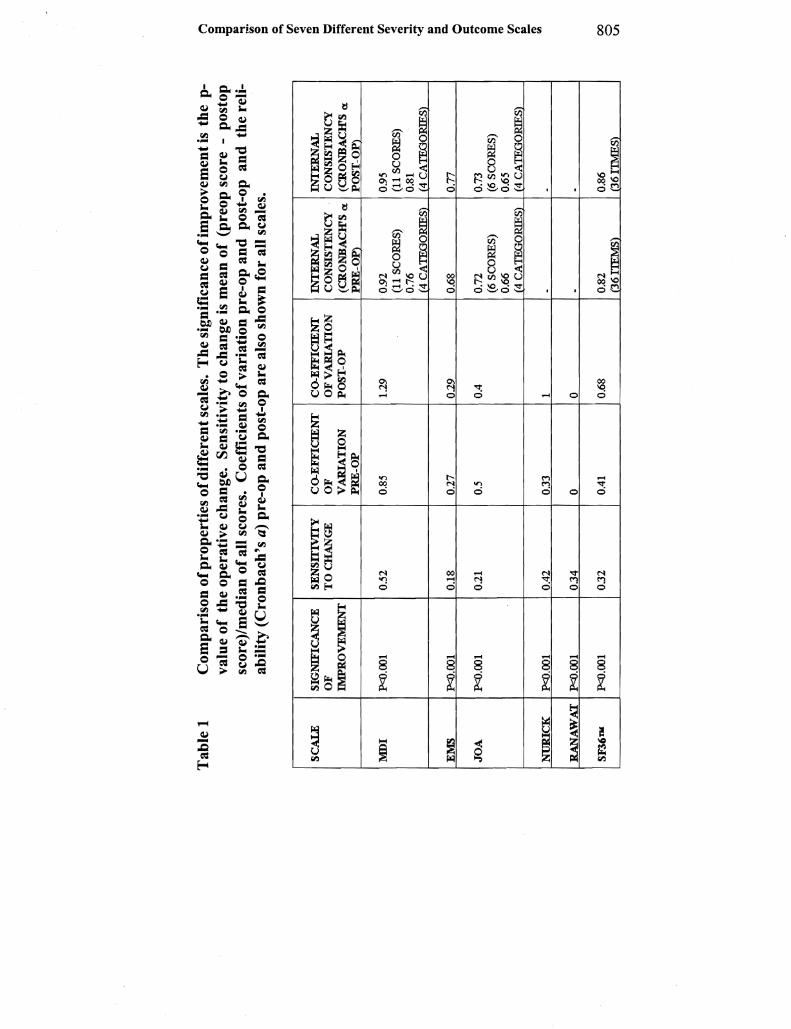
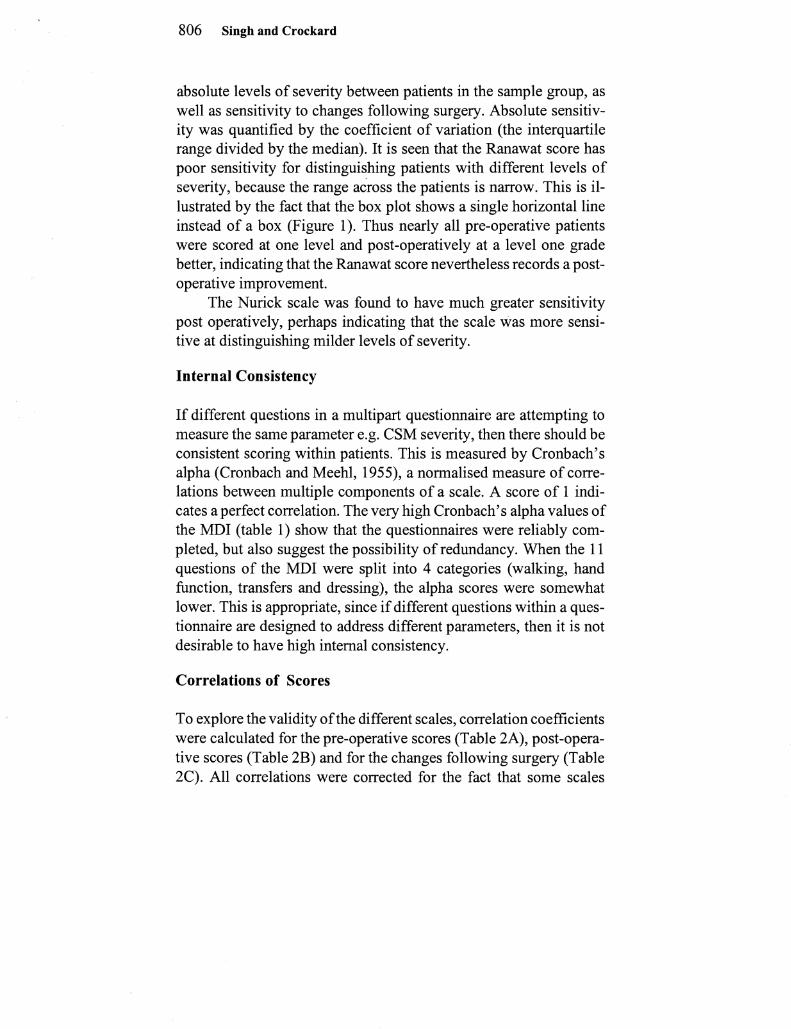
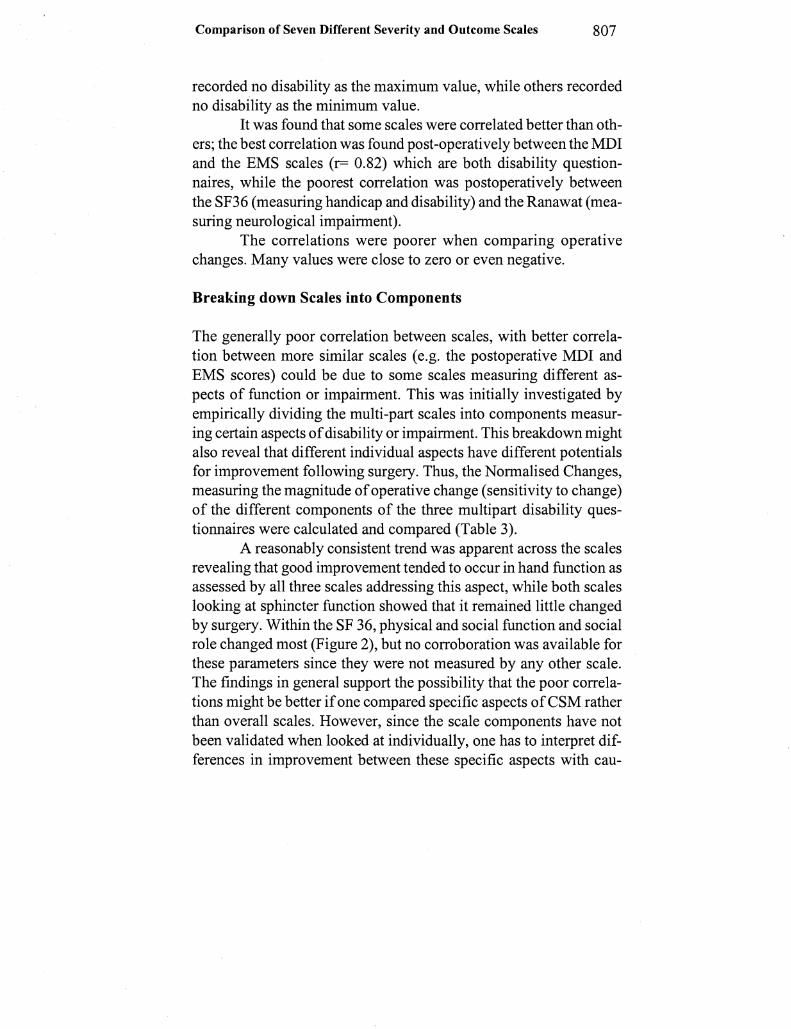
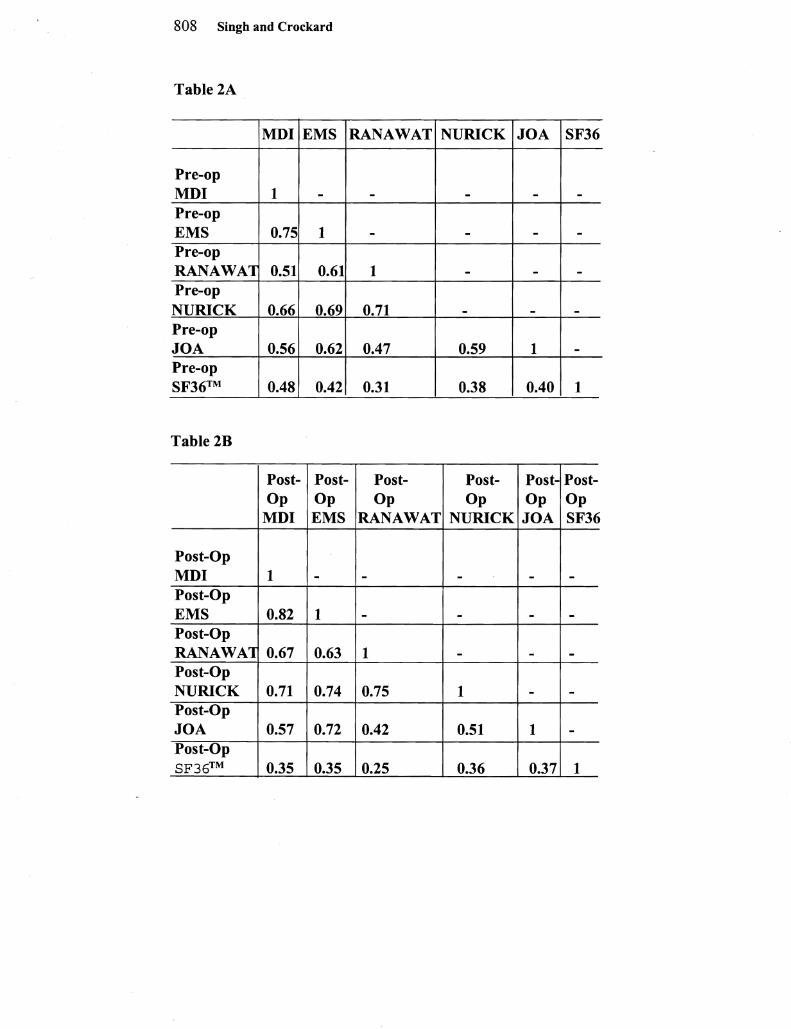
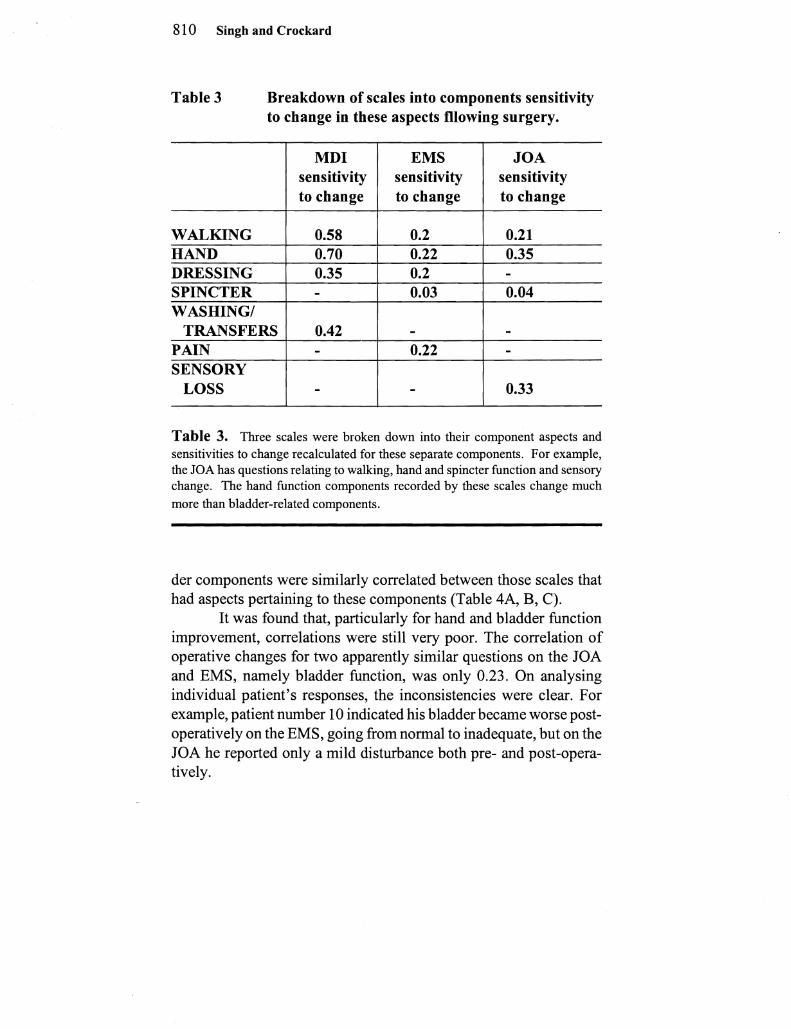
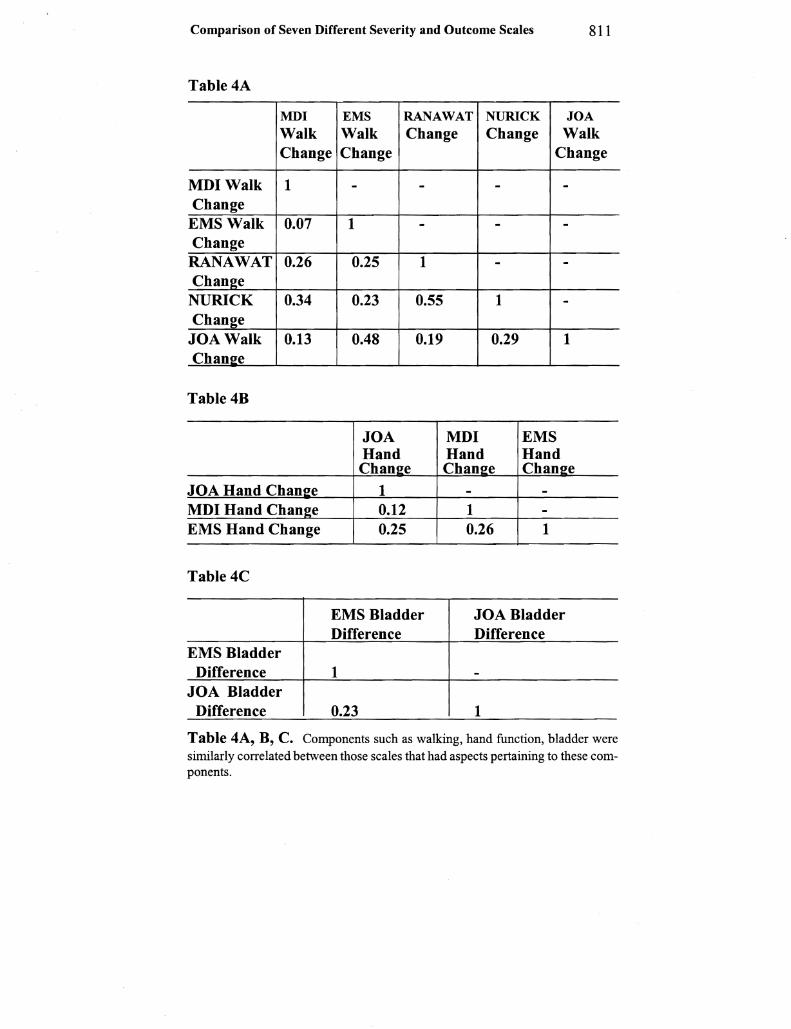
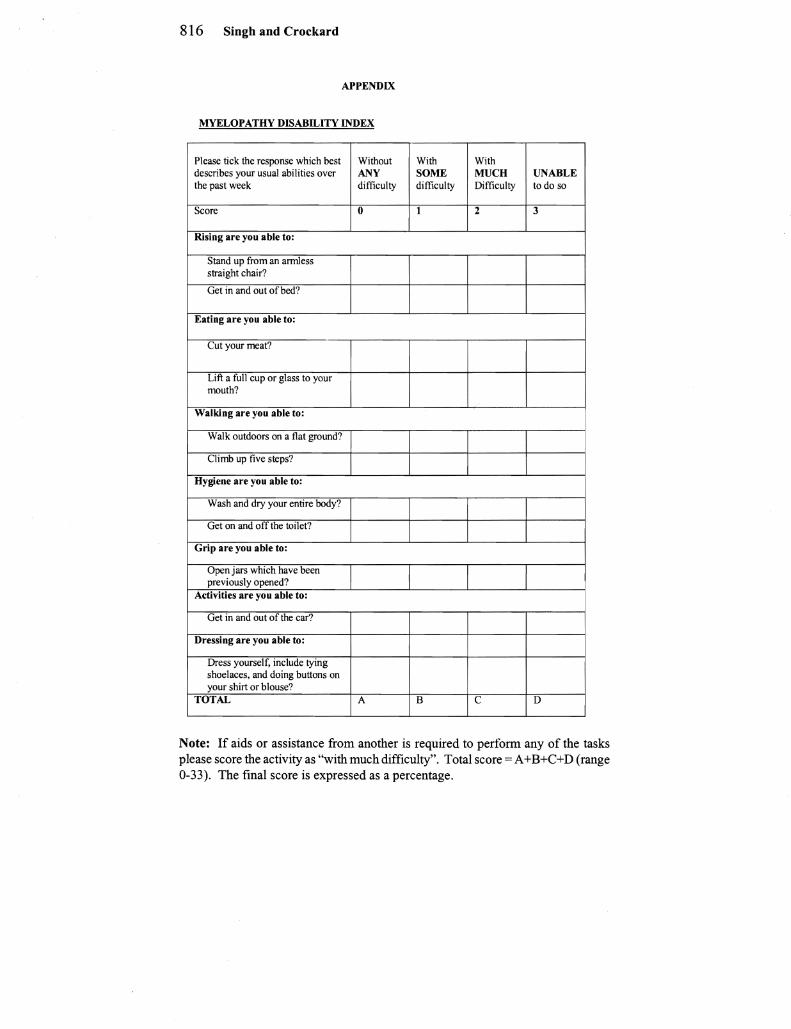
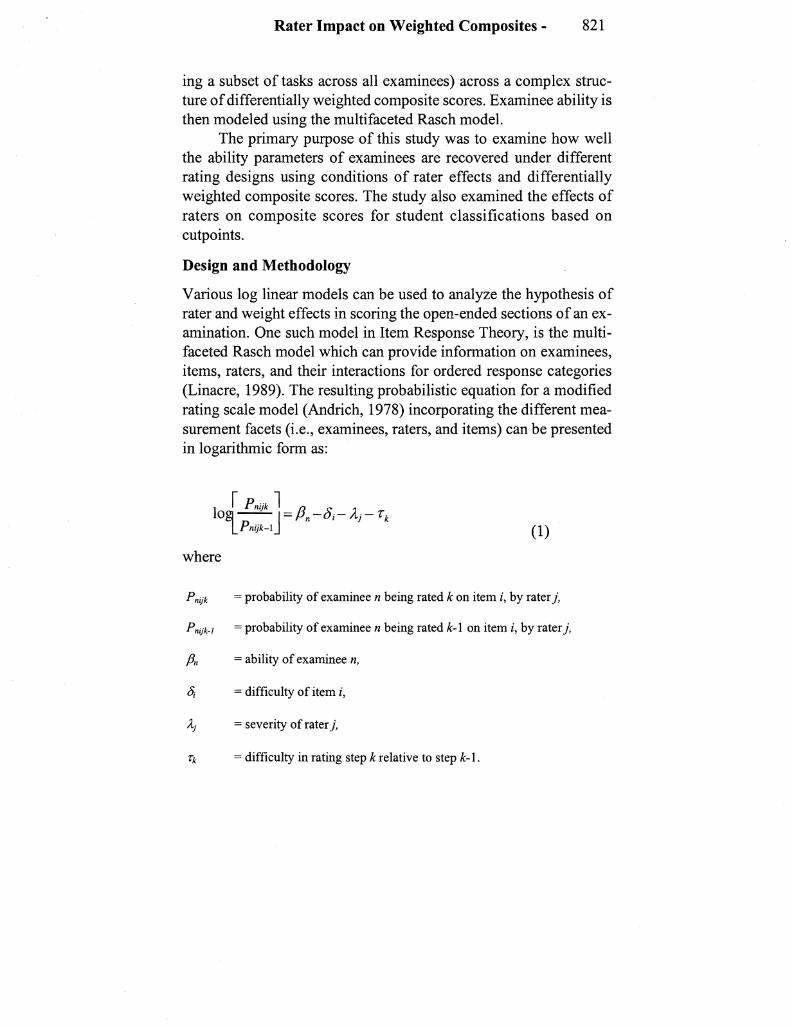
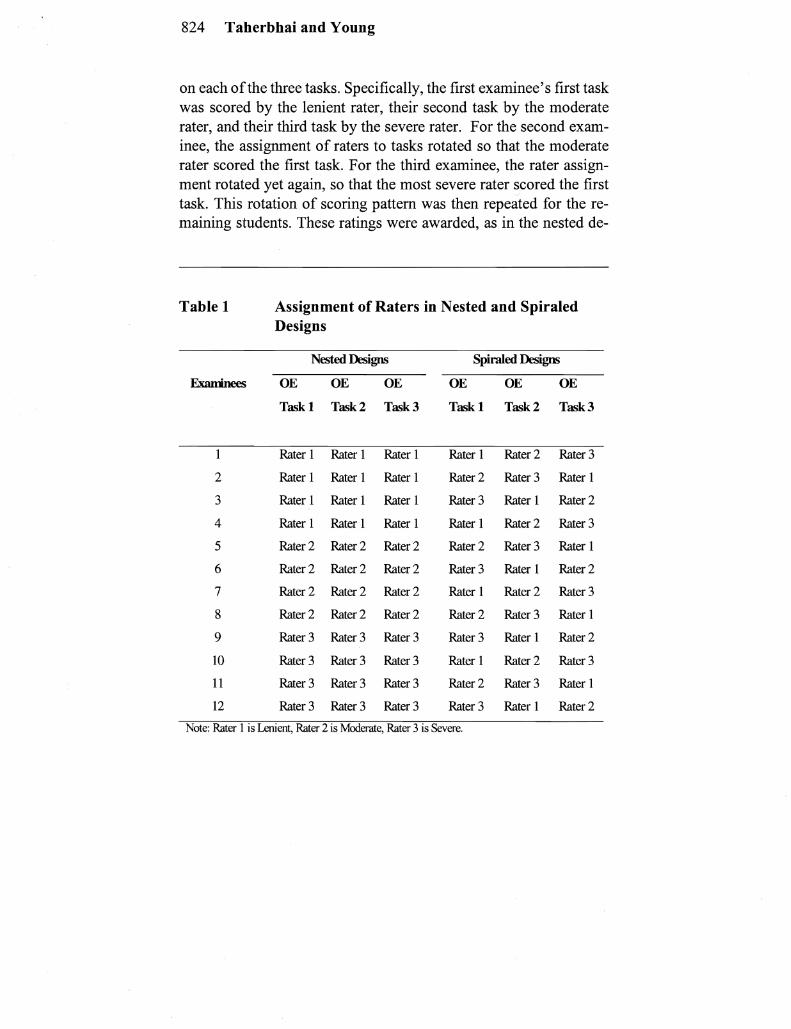
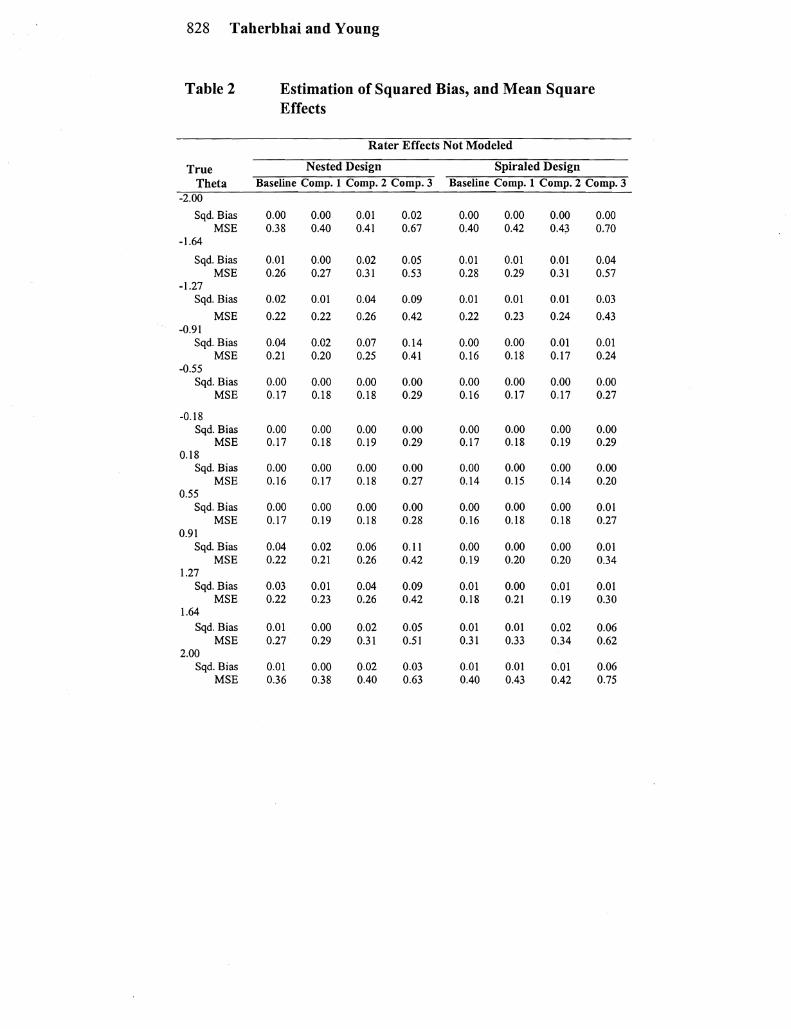
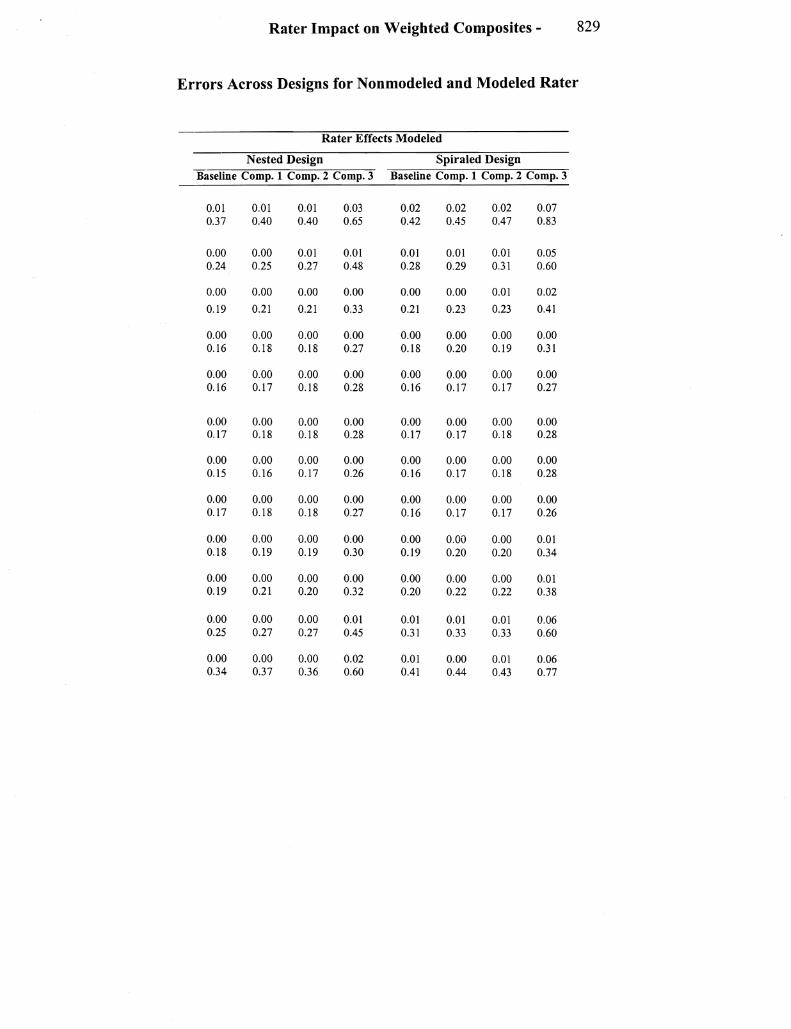
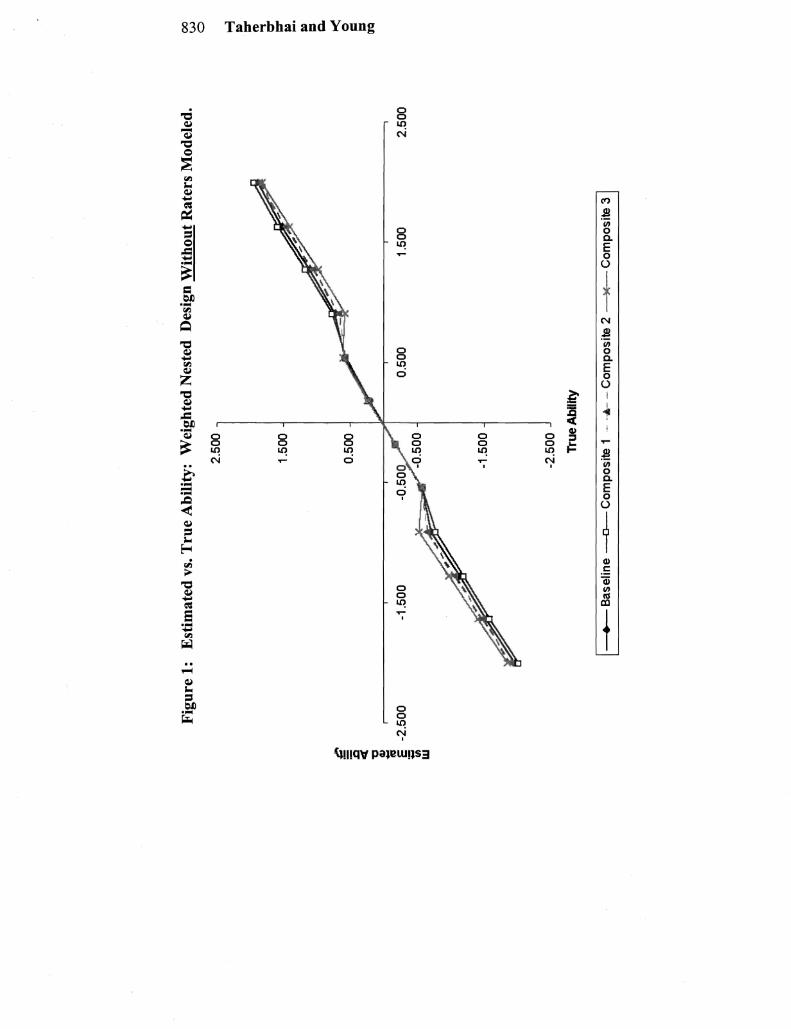
Fig
ure
2
Est
imat
ed v
s T
rue
Abi
lity
W
eigh
ted
Nes
ted
Des
igns
Wit
h R
ater
s M
odel
ed
250
c ~
I g ~
n o =
~
~ I1Q
250
0 =shy shy
l (j o 3 tl o til shy til
-25
0
Tru
e A
bili
ty
00
w
~
Bas
elin
e ~
Com
posi
te 1
-~
--
Com
posi
te 2
)(
C
ompo
site
3
g ~ tI ~ E
-25
00
-20
00
I
III
W
150
050
-15
00
-10
00
050
0 1
000
150
0 2
000
-15
0
832 Taherbhai and Young
Parameter Recovery for Weighted Composites
Across the weighted composites the mean squared errors increased as the weight assigned to the OE tasks increased This was true for both the nested and spiraled designs regardless of whether or not rater effects were modeled The squared bias on the other hand was fairly constant except for the ends of the ability distribution in Comshyposite 3
For the nested design when rater effects were not modeled and weights were included in the analysis the rater effects interacted with the weights assigned to the composite The composites with the highest OE task weights showed the greatest impact on the estimates ofexaminee ability at ends of the distribution (Figure 1) This is due to the effect of the extreme raters scoring exanlinees at the low and high ends of the ability distribution When rater effects are modeled the recovery of examinee abilities improves at the extreme ends of the ability distribution (Figure 2) Changes in OE task weights had little effect on the estimation of examinees of moderate abilities reshygardless of the modeling of raters since these were the examinees scored by moderate raters
Plots of the estimated vs the true abilities for the spiraled design composites are shown for the non-modeled rater effects in Figure 3 and for the modeled rater effects in Figure 4 With the exshyception of Composite 3 the recovery ofparameters was fairlyaccushyrate for the spiraled design regardless of whether the rater effects were modeled The modeling of raters in Figure 4 had the effect of straightening the plots in Figure 3 except for Composite 3 which has the greatest weight placed on OE tasks of all of the composites Contrary to the decrease in squared bias the mean square errors inshycreased slightly from the non-modeled rater condition to the modshyeled rater condition when the OE task weights in the composites inshycreased
Student Classification at the Quartiles for Different Composshyites
When cutpoints at the quartiles were examined (Table 3) under the two designs and the different weighting conditions the results did
Fig
ure
3
Est
imat
ed v
s T
rue
Abi
lity
W
eigh
ted
Spi
rale
d D
esig
ns W
itho
ut R
ater
s M
odel
s
250
0
200
0
150
0
euro c laquo C
IIgt
1U
E
t
w
-25
00
-15
00
100
0
050
0
-10
00
050
0
-15
00
-20
00
-25
00
Tru
e A
bilit
y
to
-B
ase
line
-0
--
Co
mp
osi
te 1
-
-shy--
Co
mp
osi
te 2
=c
~ (
) a C
~
f) o =
~
()
150
0 2
500
(JQ
=shy shy Q
()
o a C
o f- (
)
f-
00
J
)
)(
Co
mp
osi
te 3
J
)
00
g ~ CI
Ggt
1U
150
0
050
0
E
-25
00
-20
00
-15
00
-1
000
050
0 1
000
150
0 2
000
~
w
-15
00
Fig
ure
4
Est
imat
ed v
s T
rue
Abi
lity
W
eigh
ted
Spi
rale
d D
esig
ns W
ith
Rat
ers
Mod
els
w
Jgt
250
0 ~ =shy ~
I C =shy ~ ~ = ~ ~ Q
=
IJC =
250
0
-25
00
True
Abi
lity
-
Bas
elin
e --
O--
Co
mp
osit
e 1
bull
Com
posi
te 2
)0
( C
ompo
site
3
m
Rater Impact on Weighted Composites - 835
not differ much from Taherbhai and Youngs (2000) results Rere again there was little movement from one condition to another unshyder the two designs and consistency in examinee classification was very high
CONCLUSIONS
The impact of rater effects is well documented in the literature (Engelhard 1994 1996 Rombo et aI 2000 Linacre 1989 Lunz et aI 1990) The composite effect of weighing Me items and OE tasks differentially however has not received much attention
Under the nested design when very severe or lenient raters are paired with examinees at the ends of the ability distribution exshyaminee ability estimates can be systematically distorted As LUllZ Wright and Linacre (1990) point out ifraters are used to score tasks for assessments and their effects are not modeled it may lead to poor ability estimates especially if extreme raters are paired with examinshyees that are extreme in their abilities Furthermore weighing items and tasks differentially confounds rater effects and further complishycates the recovery of true ability estimates of examinees
The use of spiraled over nested designs when rater effects are not modeled was justified in Rombo et aI (2000) due to the deshycrease in bias that these designs provided in estimating examinees abilities This result is supported by our study The recovery of exshyaminee abilities and the overall MSEs was better for spiraled designs than nested designs when rater effects where not modeled The spishyraled design with unmodeled rater effects was also comparable to the modeled nested design except for the very slight increase in MSE
However any advantage that the spiraled design has in reshyducing the bias ofability estimates decreased when composite scores were used that placed much greater weights on open-ended tasks than those on the multiple-choice items In this situation the bias and the MSE increased not only for the unmodeled nested design but also for both the modeled and the unmodeled spiraled designs
As stated in the paper this study is not exhaustive of all the possible rater designs and weighted conditions that could be included Further research needs to be undertaken to examine the complex inshy
836 Taherbhai and Young
Table 3 Percent of Students Changing Classification with Respect to Quartiles
Nested Design Spiralled Design
Oassification Change Oassification Change
ConditionlCutpoint Up own Up Down
Baseline
Rater Effects Modeled vs Not
Modeled
Q3 3
Median
QI 2
Rater Effects Not Modeled
Baseline vs Corrposite I
Q3 2
Median
QI 2
Baseline vs Corrposite 2
Q3 3
Median
QI Baseline vs Corrposite 3
Q3 3
Median
QI
Rater Effects Modeled
Baseline vs Corrposite I
Q3 Median
QI Baseline vs Corrposite 2
Q3
Median
QI Baseline vs Corrposite 3
Q3
Median
QI
Rater Impact on Weighted Composites - 837
teraction of raters tasks and examinee abilities when creating spishyraled designs and applying them to assessments that use weighted composite scores It would also be interesting to obtain results under the spiral design when the number of raters are more than the tasks that have to be rated Under this condition a semi-nestedspiral deshysign would exist in which a sub-set of students would be rated by some raters while another sub-set would be rated by a different group of raters The raters within a subset however would be spiraled
This paper should serve as a warning for obtaining composite scores by increasing the weights ofOE tasks relative to the MC items for less than substantive reasons and also for unknowingly pairing extreme raters with extreme-ability-students when the spiraled deshysign is not used or under the nested design without modeling rater effects
REFERENCES
Andrich D (1978) A rating formulation for ordered response categories Psychometrika 43 561-563
College Board (1988) The College Board technical manual for the Advanced Placement Program New York NY College Entrance Examination Board
Engelhard G (1996) Evaluating rater accuracy in performance asshysessments Journal ofEducational Measurement 31 (1) 56-70
Engelhard G (1994) Examining rater errors in the assessment of written-composition with the many-faceted Rasch model Jour nal of Educational Measurement 31(2) 93-112
Hombo C M Thayer D T amp Donoghue 1 R (2000) A simulashytion study of the effect ofcrossed and nested rater designs on ability estimation Paper presented at the annual meeting ofthe National Council on Measurement in Education New Orleans LA
Linacre 1 M (1989) A users guide to FACETS Rasch measure ment program and Facform data formatting computer program Chicago IL MESA Press
838 Taherbhai and Young
Linacre1 M (1993) Many-facet Rasch measurement Chicago IL MESA Press
Lunz M E Wright B D amp Linacre 1 M (1990) Measuring the impact ofjudge severity on examination scores Applied Mea surement in Education 3(4) 331-345
Taherbhai H M amp Young M 1 (2000) An analysis ofrater impact on composite scores using the multifaceted Rasch model Pashyper presented at the annual meeting of the National Council on Measurement in Education New Orleans LA
JOURNAL OF OUTCOME MEASUREMENT7 5(1) 839-863
Copyright8 2000 Rehabilitation Foundation Inc
Measuring disability application of the Rasch model
to Activities of Daily Living (ADLIIADL)
T Joseph Sheehan PhD
Laurie M DeChello
Ramon Garcia
Judith FifieldPhD
Naomi Rothfield MD
Susan Reisine PhD
University ofConnecticut School ofMedicine amp
University ofConnecticut
Requests for reprints should be sent to T Josep Sheehan University of Connecticut School ofMedicine 263 Farmington Ave Farmington CT 06030
839
840 SHEEHAN et al
This paper describes a comparative analysis of (ADL) and (IADL) items administered to two samples 4430 persons representative of older Americans and 605 persons representative of patients with rheumatoid arthrisit (RA) Responses are scored separately using both Likert and Rasch measurement models While Likert scoring seems to provide information similar to Rasch the descriptive statistics are often contrary if not contradictory and estimates of reliability from Likert are inflated The test characteristic curves derived from Rasch are similar despite differences between the levels of disability with the two samples Correlations ofRasch item calibrations across three samples were 71 76 and 80 The fit between the items and the samples indicating the compatibility between the test and subjects is seen much more clearly with Rasch with more than half of the general population measuring the extremes Since research on disability depends on measures with known properties the superiority ofRasch over Likert is evident
INTRODUCTION Physical disability is a major variable in health related research Assessing the degree ofdifficulty in performing Activities ofDaily Living (ADL) and Instrumental Activities ofDaily Living (IADL) scales is a common way to measure physical disability Individuals are asked how much difficulty they have in performing activities ofdaily living such as dressing getting up from a chair or walking two blocks For each activity there are 4 possible responses no difficulty some difficulty much difficulty or unable to do Responses are scored from 1to 4 or from 0 to 3 summed across all items and averaged to yield a disability score the higher the average the greater the disability These well-validated scales are efficient and widely used but their ordinal scaling can result in distortion by masking ineffective treatments or hiding effective procedures (Merbitz Morris amp Grip 1989)
Ordinal scales do not have any obvious unit ofmeasurement so that addition and division ofunknown units is considered meaningless Wright and Linacre (Wright amp Linacre 1989) have argued that while all observations are ordinal all measurements must be interval ifthey are to be treated algebraically as they are in computing averages The Rasch (Rasch 1980) measurement model offers a way to create interval scales from ordinal data a necessary condition for averaging or analyzing in statistical models that assume interval data
MEASURING DiSABILITY 841
As Wright and Linacre (Wright amp Linacre 1989) maintain computing an average score implies a metric that is only available with an interval scale In addition those average scores are non-linear and thereby lack a fimdamental property assumed in all measurers from yardsticks to financial worth that the measures increase along a linear scale Recognition of this problem is not new Thorndike (Thorndike 1904) identified problems inherent in using measurements ofthis type such as the inequality ofthe units counted and the non-linearity ofraw scores This study demonstrates how the Rasch measurement model converts non-linear ordinal data to a linear interval scale that provides new information about the utility ofcommonly used measures ofdisability While demonstrating the application ofthe Rasch model is the main purpose ofthis study it also includes a number ofcomparisons Rasch person measures are compared to Lickert person scores Rasch item calibrations are compared to Lickert item scores Rasch item calibrations estimated on a sample of older Americans are compared to item measures estimated on a sample of American rheumatoid arthritis (RA) patients and to those same items estimated on a sample ofBritish RA patients These comparisons should enhance understanding ofthe strengths and perhaps limitations ofusing the Rasch model in practice
Background
Before considering Rasch there is an alternative to averaging ranked data and treating them as interval and that is to simply treat them as ranked data Responses to each ADL item can be rank ordered ie no difficulty is less than some difficulty is less than much difficulty is less than unable to do so that responses to the ADL tasks can be ordered Also the ADL tasks themselves can be ordered For instance for most people walking two blocks is more difficult than lifting a cup or a glass to ones mouth It is easy to imagine individuals who though completely unable to walk two blocks would have no difficulty lifting a full cup or glass Because items can be ordered according to a scale of inherent difficulty ADL items have been organized into hierarchies and disability status is determined by where a persons responses fall along the ordered
842 SHEEHAN et al
hard-to-easy hierarchy One such scoring scheme was proposed by Katz (Katz Downs Cash amp Grotz 1970) the creator ofthe original six item ADL scale Another step-wise scoring scheme was recently reported by S01111 (S01111 1996)
Lazaridis and his colleagues (Lazaridis Rudberg Furner amp Casse 1994) studied the scalabilityofselected ADL items using criteria associated with Guttman scales For Guttman (Guttman 1950) a set ofitems is a scale ifa person with a higher rank than another person is just as high or higher on every item than the other person Lazaridis found that the Katz scoring scheme fulfilled Guttmans scaling criteria Lazaridis and his colleagues went further however and showed that the Katz hierarchy was one of360 possible hierarchies based upon permutations ofsix ADL items Lazaridis tested all 360 ofthese hierarchies using the same Guttman scaling criteria and found four additional scoring schemes that performed equally as well as Katz and found a total of103 scoring hierarchies that satisfied minimum standards ofscalability according to Guttman
While Guttman scaling does not violate the ordinal nature ofthe scales neither does it produce measures suitable for outcomes analyses that assume interval scaled measures Also Guttmans measurement model is deterministic rather than probabilistic and assumes that responses fall along a single hierarchy in a fixed order The Guttman model would have difficulty WIth that rare individual who was able to walk two blocks but unable to lift a full cup to hislher mouth Daltroyet al tested a Guttman scale of ADL items to determine whether musculoskeletal function deteriorates in an orderly fashion (Daltroy Logigian Iversen amp Liang 1992) They recommended that lifting a cup be dropped because it was too easy We discuss the item later Furthermore the fact that there is not a single hierarchical scale but as many as 103 different hierarchies underlying Katz six original ADL items exposes the disadvantage ofa rigid and deterministic hierarchy Amore attractive approach would capture the probabilistic nature ofthe responses without losing the concept ofa hierarchical scoring function The Rasch measurement model provides such an alternative
Rasch a Danish statistician interested in measuring spelling ability created a probabilistic measurement function which simultaneously
MEASURING DiSABILITY 843
estimates the abilities ofpersons and the difficulty oftest items Rasch showed how the probability ofanswering a question correctly depended on two things the ability ofthe person and the difficulty ofthe test item His model estimates person ability and item difficulty simultaneously and shows that the two are independent (Rasch 1980 p 19) Moreover the model provides a common scale for assessing both persons and items The distribution ofitem difficulties can be examined and compared directly to the distribution ofperson abilities on the same scale permitting visual judgments about the appropriateness of these items for these people Furthermore the common scale turns out to be an interval scale that is linear in contrast to the non-interval and non-linear scale calculated from the sum ofthe ranks or the average rank
METHODS
There are two sets ofsubjects used in this study The first set includes 4430 persons who were between ages 50 and 77 during the first National Health And Nutrition Examination Survey (NHANES I) carried out between 1971 and 1975 and who provided complete or nearly complete answers to the 26 ADL items administered during the NHANES Followshyup Study (NHEFS) conducted between 1982 and 1984 There were no initial measures ofphysical disability administered during NHANES I comparable to the ADL items NHANES I was administered to a national probability sample ofthe civilian noninstitutionalized US popUlation (Hubert Bloch amp Fries 1993 Miller 1973)
The persons in the second study group are a nationally representative sample ofpatients with RA (Rei sine amp Fifield 1992) The patients were recruited in 1988 using a two-stage process to ensure that it represented RA patients cared for by board-certified rheumatologists First a sample of 116 board-certified rheumatologists was randomly selected from the membership ofthe American College ofRheumatology In the second stage patients with definite or classical RA were asked to participate as they visited the office over a defined recruitment period Nine hundred twenty-one (88) ofthe patients who initially expressed interest agreed to participate in the panel study Patients were interviewed
844 SHEEHAN et al
yearly by telephone regarding their social physical and emotional fimctioning including their fimctional ability using the Health Assessment Questionnaire (HAQ) (Fries Spitz Kraines amp Holman 1980) The data for the present analysis are from those patients who participated in the sixth year interview ofthe panel study (N=605 66 ofthe original panel) A recent study (Rei sine Fifield amp Winkelman 2000) indicates that those who continued to participate had a higher level ofeducation were more likely to be female had higher social support and fewer joint flares
For comparison ofitem calibrations data on a third set ofsubjects are included 174 from Great Britain diagnosed withRA (Whalley Griffiths amp Tennant 1997) The inclusion ofanotherRA group allows comparison ofitem calibration between groups ofpatients with the same diagnosis and between RA patients and the general popUlation ofolder Americans Person measures were not available for the British RA group
The NHEFS data were extracted from the tapes using SAS (SAS Institute 1989) Initial statistical analyses were performed using SPSS 80 (SPSS 1997) andPRELIS 212 (SSI 1998) Computations for the Rasch model were performed using WINSTEPS (Linacre amp Wright 1998b) a computer program written by Linacre and Wright (Linacre amp Wright 1998a)
Although Rasch created his model with test items which could be scored right orwrong Andrich (Andrich 1988) has extended the Rasch model to rating scales which include items with ordered response alternatives such as those found on the ADL scale Thus each item instead ofbeing scored right orwrong is considered to have two or more ordered steps between response categories The Andrich model estimates the thresholds for each item separating each ordered step from the next that point on a logit scale where a category 1 response changes to a category 2 response a category 2 response changes to a category 3 response or a category 3 response changes to a category 4 response The Andrich model also offers the user a choice between a model that assumes equal steps between categories the rating scale model or a model that actually estimates the distance between categories the partial credit model (Andrich 1978) the latter being used in this study to conform to the
MEASURING DiSABILITY 845
Whalley et al analysis The Rasch analysis estimates the difficulty level ofeach ADL item
and the ability level ofeach person along the same logit scale The Rasch analysis also produces a test characteristic curve which graphs the relationship between each person measure and the expected score based on the sum ofthe ranks the numerator used to compute a Likert score In
this study the test characteristic curve for 19 of26 ADL items from the
NHANES study is compared to the test characteristic curve estimated from 19 of20 parallel items in the Reisine study The 19 items used in the Reisine study are taken from the twenty item Health Assessment Questionnaire (HAQ) (Fries et aI 1980) The 19 HAQ items contain 15 exact matches and 4 items that are very similar to those used in the NHEFS The item abbreviations and full text for both ADL and HAQ are shown in Table 1 One of the 26 ADL items walkfrom one room to another on the same level had too many missing responses to be included in these analyses The parallel item from the HAQ walk outdoors on flat ground was dropped leaving 19 items to compute test characteristic
curves for comparison
RESULTS
The initial analyses showed skewed distributions ofresponses on all 25 ADL items for the NHEFS sample The category 1 responses ranged from a high of953 who had no difficulty lifting a cup to a low of 600 who had no difficulty with heavy chores The category 4 response unable to do an activity is uniformly low under 10 for most items with heavy chores being impossible for 174 A complete table of responses is available from the authors Skewness is also seen in the responses ofthe RA patients although their overall level ofdisability is higher
Figure 1 summarizes person disability measures horizontally and item difficulty level vertically for NHEFS Persons are distributed across the bottom with M marking the mean and S the standard deviation There are 102 persons at the mean (M) of-227 There are 2079 persons at the bottom end ofthe scale who have no difficulty with any ofthe ADL
846 SHEEHAN et al
Table 1
Item abbreviashytion Dresself
Shampoo Arisechr
Inoutbed Makefood Cutrneat Liftcup
Openmilk Wlk2b1ck
Wlk2step
Faucets Bathtub Washbody
Toilet Combhair Reach51b
Pkupclth
Cardoors Openjars
Write
Inoutcar Shop Ltchores
Liftbag
Hvchores
ADL
Dress yourself including tying shoes working zippers and doing buttons Shampoo your hair Stand up from an armless straight chair Get into and out of bed Prepare your own food Cut your own meat Lift a full cup or glass to your mouth Open a new milk carton Walk a quarter mile (2 or 3 blocks) Walk up and down at least two steps Turn faucets on or off Get in and out of the bathtub Wash and dry your whole body Get on and off the toilet Comb your hair Reach and get down a 51b Object (bag of sugar) from just above your head Bend down and pick up clothing from the floor Open push button car doors Open jars which have been previously opened Use a pen or pencil to write with Get in and out of a car Run errands and shop Do light chores such as vacuuming Lift and carry a full bag of groceries Do heavy chores around the house or yard or washing windows walls or floors
Activities ofDailyLivin~ (ADL) and Health Assessment QuestionnaIre items
close match modlfied
HAQ
Dress yourself including tying shoelaces and doing buttons
Shampoo your hair Stand up from an armless straight chair Get in and out of bed
Cut your meat Lift a full glass or cup to your mouth Open a new milk carton
Climb up five steps
Turn faucets on and off Take a tub bath Wash and dry your entire body
Get on and off the toilet
Reach and get down a 51b object from just above your head
Bend down and pick clothing up from the floor Open car doors Open jars which have been previously opened
Get in and out of a car Run errands and shop Do chores such as vacuuming and yard work
MEASURING DiSABILITY 847
items and 15 persons at the right end ofthe scale who were unable to perform any ofthe tasks When extreme persons are included the mean for persons drops from -227 to -393 and the standard deviation increases from 167 to 222 The presence ofso many atthe bottom of the scale draws attention to the floor effects ofthe test at least for the general population ofolder Americans
The right-hand column in Figure 1 orders items from easiest at the top to hardest at the bottom Items at the top ofthe Rasch scale such as lift a cup or turn afaucet on or off are easier than items below with the hardest items at the bottom lift and carry a full bag ofgroceries or do heavy chores around the house or yard To the left ofeach item the responses 123 and 4 are arranged at a location corresponding to the expected measure ofa person who chose that response to that item Thus the expected measure ofa person who responded with a 4 to the easiest item unable to lift afull cup or glass to ones mouth would be slightly greater than 4 or the most disabled end of the scale Whereas the expected measure ofa person who chose category 4 in response to the hardest item and was unable to perform heavy chores would be aboutshy08 almost a standard deviation above the mean person disability measure of -227
Figure 1 also shows a colon () separating the response categories for each item Those separation points are the thresholds between response categories estimated by the Andrich model mentioned earlier The mean item calibration is 00 and standard deviation is 111 It is noteworthy that the mean item calibration ofzero and standard deviation of111 suggests that the item distribution is far to the right ofthe person distribution Also the item standard deviation of 111 suggests far less dispersion among items than the dispersion among persons which reaches 222 when extreme measuring persons are included Such misalignment ofthe item andperson distributions signals serious limitations in using this measure for these persons The distribution of person measures is far lower than the distribution ofitem calibrations indicating a poor fit between this test and these persons at least at the time these items were administered that is the first ofseveral follow-up surveys on the same SUbjects For an ideal test the distribution ofitems and persons should show similar alignments
848 SHEEHAN at al
EXPECIED scxFE MEAN ( INDIaITES HALF-scxFE roINr) -5 -3 -1 1 3 5 7 I---+shy I ITEM 1 1 2 3 4 4 liftrnp 1 1 2 3 4 4 faucets 1 1 2 3 4 4 cxnbhair 1 1 2 3 4 4 toilet 1 1 2 3 4 4 arisEtecl 1 1 2 3 4 4 write 1 1 2 3 4 4 cpenjars 1 1 2 3 4 4 cutrreat 1 1 2 3 4 4 qenmilk 1 1 2 3 4 4 carctors 1 1 2 3 4 4 washIxxiy 1 1 2 3 4 4 dresself 1 1 2 3 4 4 inoutcar 1 1 2 3 4 4 rrekefcxxj 1 1 2 3 4 4 walk2ste 1 1 2 3 4 4 pkuplth 1 1 2 3 4 4 arisedrr 1 1 2 3 4 4 sharrpo 1 1 2 3 4 4 reach5Jb 1 1 2 3 4 4 bathtub 1 1 2 3 4 4 shcp 1 1 2 3 4 4 Itd10res 1 1 2 3 4 4 wlk2blck 1 1 2 3 4 4 lifttag 11 2 3 4 4 hvd10res I---+shy I I -+shy I I ITEM -5 -3 -1 1 3 5 7
2 o 3 211 111 7 5 1 8 3997010877675453322121 1 1 9 3883730403642918894807786977099501673 52 3 2 5 PERSN
S M S Q
Figure 1 Most probable responses items are ordered onthe right hand side with less difficult items on the top Persons are ordered on the bottom with more disabled persons on the right The figure answers the question which category is aperson ofaparticular person measure most likely to choose The distribution ofitem difficulties has amean ofzero and a standard deviation ofl04 The distribution of231 0 non-extreme person measures has amean of-218 and a standard deviation of168 There are 2079 extreme responses at the bottom ofthe scale and 15 extreme responses at the top ofthe scale
MEASURING DiSABILITY 849
The fit may improve as this population ages and becomes more disabled
In contrast the Rasch analysis ofthe RA sample shows a mean of-180 for 563 non-extreme persons indicating a higher level ofdisability than in the general population Also there are only 41 extreme measures 40 with no difficulty on any item and one person was unable to perform any ofthe ADL tasks The misalignment between the item and person distributions is not as severe for the RA patients but the item distribution centered about zero with a standard deviation of096 is still higher and more dispersed than the person distribution It is noteworthy that the mean for non-extreme NHEFS changes little from -227 to -212 when 19 rather than 25 ADL items are used likewise the mean changes little when extreme persons are included -393 to -386
Figure 2 graphs the relationship between person measures for the 25 ADL items and the Likert score the average ofthe sum ofthe ranks The graph demonstrates the non-interval and non-linear nature ofLikert scores Thus while the Rasch measures are linear and use the sanle invariant interval across the entire range ofmeasures the Likert scores are neither linear nor invariant Likert metric is about four times greater in the middle than toward the top or bottom ofthe scale a clear violation ofthe linearity assumption underlying all valid measurement There is a similar curve for the RA sample While Figure 2 shows the curve relating Rasch measures to observed Likert scores Winsteps also produces curves for a test based upon statistical expectations called the test characteristic curves
Figure 3 shows two test characteristic curves based upon a set of 19 ADL items One curve is estimated from the NHEFS sample the second curve from patients with Rheunlatoid Arthritis (RA) (Rei sine amp Fifield 1992) The NHEFS sample is slightly older on average than the RA sample 620 years versus 590 years and is more male 43 versus 22 Although the salllples differslightly in age and considerably in gender and disability with disability levels higher among the RA patients the test characteristic curves are similar
While the characteristic curves indicate that the two instruments process raw scores in much the same way it is helpful to examine the items themselves Table 2 contains the item calibrations for NHEFS for the RA sample and for the RA patients from Great Britain studied by
850 SHEEHAN et al
400rshyI
I o 300shy
~ laquo Q)
~ 2001
~
100 + I
-500
Rasch person measure on 25 ADL items
--r---- shy-250
I 000
I 250 500
Figure 2 Graph ofRasch measures for persons and ADL average scores based on the average rank assigned to each of25 ADL items
Whalley Griffiths and Tennant (Whalley et aI 1997) The item error varies from 03 to 08 for NHEFS from 06 to 09 for HAQ US and from 11 to 15 for HAQ UK Ideally infit root mean square standard errors should be at or near one Wash and dry body was the furthest from one in the NHEFS sample at 70 take a bath at 166 in HAQ US and wash and dry body at 58 in HAQ UK were those samples only extreme items These items do not fit the scales as well as all other items
MEASURING DiSABILITY 851
Wash and dry body in both the NHEFS and HAQ UK samples may indicate this item is dependent on the data but it is not so severe for NHEFS Take a bath in the HAQ US sample causes some noise in the scale however all other items are within 18 0 f one It appears that there
76 73
70 (f) 67 E 64 Q)
61 0 58 (J
55c 0 52 (f) 49Q)
46(f) c 430 0 40 (f)
37Q)
cr 34-0 31 E 28 -J () 25
NHEFS 22 -shy19
RA -8 -4 -2 0 2 4 6 8
Person Measure
Figure 3 Test characteristic curves for 19 similar ADL items administered to NHEFS and RA samples demonstrating the non-linear nature ofscores based upon the sum ofthe ranks and the similarity ofthe curves despite differences in the samples
Craquo
Tab
le 2
NH
EF
S H
AQ
US
and
HA
Q U
K it
em c
ompa
riso
n T
he it
em m
easu
res
are
from
the
part
ial c
redi
t II
)
UI
Ras
ch m
odel
en
I
m
m
Num
ber
Item
N
HE
FS
H
AQ
US
H
AQ
UK
N
HE
FS
H
AQ
US
H
AQ
UK
j
Mea
sure
s M
easu
res
Mea
sure
s R
ank
s R
ank
s R
ank
s _z
1
Lif
tcu
p
266
8
2 2
60
1 5
1 ~
2 F
auce
ts
156
9
9
70
2 3
5 shy
3 T
oil
et
71
153
1
44
3 2
2 4
Ari
seb
ed
56
154
7
8 4
1 3
5 O
pen
iars
3
6 2
0
-66
5
8 14
6
Cu
tmea
t 2
9 1
1 -
45
6 9
13
7 O
pen
mil
k
29
-11
0 -1
48
7 16
18
8
Car
do
ors
2
5 3
0
11
8
7 8
9 W
ash
bo
dy
1
2 3
8
-33
9
6 12
10
D
ress
elf
02
-01
1
1 10
11
9
11
In
ou
tcar
-
12
91
71
11
4 4
12
W
alk
2st
ep
-35
-
14
10
12
14
10
13
P
ku
pcl
th
-36
0
3 3
0 13
10
6
14
A
rise
chr
-42
-
07
2
6
14
12
7
15
Sh
amp
oo
-
45
-13
-
23
15
13
11
16
R
each
5lb
-1
15
-13
1 -1
86
16
1
7
19
17
B
ath
tub
-1
28
-18
7
-10
9 1
7
19
17
18
S
ho
p
-13
3 -
35
-7
2
18
15
15
19
L
tch
ore
s -1
37
-18
1 -1
01
19
18
16
Item
err
or
var
ies
from
03
to
08
forN
HE
FS
0
6 t
o 0
9 f
or
HA
Q U
S
and
11
to
15
for
HA
Q U
K
Th
e on
ly e
xtr
eme
infi
t ro
ot
mea
n s
qu
are
erro
rs a
re w
ash
an
d d
ry b
od
y at
7
0 a
nd
5
8 f
orN
HE
FS
an
d H
AQ
UK
re
spec
tiv
ely
an
d ta
ke
a ba
th a
t 1
66 f
orH
AQ
US
MEASURING DiSABILITY 853
are tasks which are ofdifferent difficulty for RA patients than for the general population ofolderAmericans Perhaps the most striking difference is the difficulty ofopening a milk carton where the difficulty for RA patients is -11 0 and -148 among their most difficult tasks as compared to 29 for the general public It also appears that getting in and out of cars is more difficult for the general public than for RA patients -12 versus 91 and71 respectively Likewise getting on and offofa toilet is easier for RA patients than for the general public 153 and 144 versus 71 Perhaps the most striking difference is that of lifting a full cup or glass to ones mouth where the American RA patients differ substantially from the British RA patients and from the US general public 82 versus 266 and 260 respectively The size ofthis difference does not seem spurious because follow-up ofUS RA patients one and two years later shows that item calibrations for lifting a cup were similar 55 And 85 Daltroy et al had earlier (1992) recommended replacing lift a cup with opening ajar based on an extreme Rasch Goodness ofFit t of72 Table 2 shows that opening ajaris more difficult for BritishRA patients than for the other two groups -66 versus 36 and 20 respectively
Figure 4 shows the two sets ofRA items are plotted against each other The numerals marking each point correspond to the item numbers in Table 2 The correlation between the two sets ofitems is 80 and ifthe most discrepant item lifting a cup is removed the correlation reaches 87 The correlation between the NHEFS item calibrations and the British RA calibrations are 76 and 71 with the American RA calibrations The correlation between the NHEFS and US RA items rises from 71 to 77 if the most discrepant item lifting a cup is removed
Another way to compare the hierarchical nature ofthe items is to tirst rank each item relative to its own sample and then to compare ranks across samples Where the relative difficulty ofopening a milk carton was 6th for NHEFS it was 16th and 18th for the RA samples Surprisingly getting in and out ofa car was 4th for both RA samples but 11 th for NHEFS Lifting a cup was first or easiest for NHEFS and the British RA samples but 5th for the US RA san1ple Then there are some AmericanshyBritish differences Picking up clothes from the floorwas 13th and 10th for the Americans while it was 6th for the British Similarly standing up from an armless chair was 14th and 12th for the Americans while it was
854 SHEEHAN et al
o 1
HAQ_G8 =-004 + 085 haCLUS Itn e R-Square =064
o 3I
tn m10
E 12 0 4
E (1) cP1 ~ 00 8CD 00
() 15 0 9 o 6
o 18 0 5~ J_10
o 7
o 16-20~
-200 -100 000 100
HAQ US item measures
Figure 4 The item measures from the British and US RA samples Item nwnbers correspond to Table 2
7th for the British Other than these 5 sets ofdifferences there do not appear to be major differences in the item hierarchical structure among these items Despite these limitations there is an overall similarity of hierarchical structure and especially with the similarity oftest characteristic
MEASURING DiSABILITY 855
curves it is interesting to compare the distribution ofNHEFS and US RA samples further
The theoretical independence ofperson and item estimates was shown early by Rasch (Rasch 1980) for dichotomous items and its extension to estimating thresholds between categories within each item has already been described by Andrich and van Schoubroeck (Andrich amp van Schoubroeck 1989) Andrich and van Schoubroeck also point out that no assumptions need to be made about the distribution of~n in the population (Andrich amp van Schoubroeck 1989 p 474) As shown below the person distributions are dramatically different for the NHEFS and RA samples
Figure 5 shows the distribution ofpersons and items for the RA and NHEFS samples based on Likert scoring To see how sample
dependent the item calibrations are for the Likert scoring compare the distribution of item averages in Figure 5 where they are much more bunched together for the NHEFS sample than they are forthe RA sample The pattern ofitem calibrations for Rasch measurement is more similar across samples as seen in Figure 6 It is clear from both figures that the distribution ofdisability is different in RA patients than in the general population Both figures show that the NHEFS sample has a much higher percentage of persons at the lower end of the scale Both Likert and Rasch also show the reversed J shape for the NHEFS sample and a flatter distribution ofRA patients It would appear at least at first that both Likert scores and Rasch calibrations provide similar infonnation about the distribution ofdisability in these two populations Important differences become apparent when the moment statistics mean standard deviation skewness and kurtosis shown in Table 3 enhance the infonnation available from the graphical images
The means show a higher level ofdisability in the RA sample but the differences seem greater on the Rasch scale The Likert means appear closer 124 and 175 than the Rasch means -387 and-2l0 although they are both about one standard deviation apart in either metric The standard deviations seem to show a much greater spread on the Rasch scale but are similar for both the Likert scoring and Rasch measurement for the two samples While the means and standard deviations appear to
60
856 SHEEHAN et al
NHEFS
Itchores ariseochr
kuPCllh wlk2step
40
~ampoo dre sse I degrisebed
wash body
penjars20 ardoors
tmeat bathtub pound6 let aop
fa~ Is ~aCh5lb bttc p om 8tcar
0 10 13 16 19 22 25 28 31 34 37 40
Awrage Score
RA
-
12
--
8 r--- sse I - 0 shy
oCu meat I- shy~ oarscia Q clth8ku I- shy
00ram i Qute r4 I- shy
fa eels ~lk step0
liftc P 0 enja 5 tcho s shy0 0
ras body J ris chr r ach5 b 0
0 toil toari ~bed shop
0 o e nm i k ba htub r----
0
I I0 I 10 13 16 19 22 25 28 31 34 37 4
Average Score
Figure 5 Distribution ofLikert scores for persons and items based on 19 common items for NHEFS and RA samples Means = 124 and 175 standard deviations = 52 and 54 skewness = 295 and 75 and kurtosis = 922 and72
MEASURING DiSABILITY 857
be different they are at least consistent in describing the two samples The skewness indices reflect the asymmetry ofthe distributions
The NHEFS skewness index for the Likert scores is nearly twice as large as the index for Rasch measures 295 versus 139 A normal distribution has a skewness index ofzero and a positive index describes a long tail to the right The skewness indices for the RA sample show a reversal of signs 075 to -045 With skewness therefore consistency is lost and the information conveyed by Rasch is both contrary and contradictory to information conveyed by the Likert scores
The indices of kurtosis describing how peaked or flat the distributions are show almost a 5 fold difference between Likert and Rasch for the NHEFS sample 922 and 189 while the indices are close for the RA sample 60 for Rasch and 72 for Likert Since normal theory statistics assume there are excesses neither in skewness nor kurtosis it is clear that the distributional properties ofthe Rasch measures are superior to those ofLikert The Likert scores provide information about skewness and kurtosis that is contrary ifnot contradictory to the information provided by the Rasch analysis The fact that the correlation between Likert scores and Rasch measures is extremely high obviously does not mean the measures are equivalent it simply means that persons are in the same rank order on both scales Furthermore high correlations distract from the real need ofa meaningful metric against which progress can be measured
Finally it is noteworthy that the Rasch reliability estimates are consistently lower than reliabilities estimated from Likert scoring The Rasch reliability ofthe person measures estimated from 25 ADL items is 86 for non-extreme persons and drops to 62 when the 2094 extreme person measures are included The person measure reliability for the RA patients based upon 19 HAQ items is 90 and drops slightly to 88 when 41 extreme person measures are included The coefficient alpha estimate ofreliability for these same items when scored as a Likert scale is 94 In the Rasch analysis the HAQ has greater precision and less measurement error in assessing patients with arthritis than the ADL has in the general population and both have more measurement errorassociated with person measures than suggested by coefficient alpha from a Likert scale
858 SHEEHAN et al
10
0
8hampoo doilel
erisechr Jrisebed b3ucets gftcup
NHEFS
50
40
oopenjars
8utmeat
30 8penm ilk
8ardOOrS~ gash bodya
dresself20 o
~alk2step
6each51b ~noulcar
ampalhtub Jkupclth
-5310 -4202 -3094 -1966 -0676 0230 1336 2446 3554 4662 577
Measure
RA
- r----shy
rshy12
- diftcup
jYashbody
oopenjars6
cutmeat
JWPll h
~ isech
cJen ilk ~ressel ~noutcar
4 I-shy ach Ib ~ mpo Jaucets
~tchO es OW lk2st p oarisebed
lgtatht b
e0 8a~rhf--_rl~_l--__-r-~__--j o shy-6580 -5253 -3926 -2599 -1272 0055 1362 2709 4036 5363 66
Measure
Figure 6 Distribution ofRasch measures for NHEFS and RA samples and items Means = -3_87 and -210 standard deviations = 197 for both skewness =139 and -045 and kurtosis = 189 and 60
MEASURING DiSABILITY 859
Table 3 Summary statistics to describe distribution ofdisability in NHEFS and RA samples using Likert scores and Rasch measures Means Standard Deviation Skewshyness (measure of symmetry and equals 00 for normal distribution tail to the right for posivite value and left for negative value) and Kurtosis (measure of peakness equals 00 for normal distribution)
Scale Sample Mean SD Skewness Kurtosis
Likert NHEFS 124 052 295 922
RA 175 054 075 072
Rasch NHEFS -387 197 139 189
RA -210 197 -045 OliO
CONCLUSIONS
Improved precision in the methods ofmeasuring disability is essential to disability research Thurstone set out the fundamentals ofmeasurement in the 1920s (Wright 1997) and described the universal characteristics of all measurement Measurements must be unidimensional and describe only one attribute of what is measured The Rasch model assumes a single dimension underlying the test items and provides measures offit so that the unidimensionality assumption can be examined Measurements must be linear because the act ofmeasuring assumes a linear continuum as for example length height weight price or volume The Rasch analysis
860 SHEEHAN et al
reveals the non-linear nature ofLikert scores Measurements must also be invariant and use a repeatable metric all along the measurement continuum the essence ofan interval scale The Rasch analysis reveals the lack ofa repeatable metric for Likert scores
While all ADL items showed adequate fit to the Rasch model and hence the unidimensionality requirement has been met further study may show that the single construct ofdisability may have more than one measurable feature In fact some HAQ users combine items into up to 8 subscales (Tennant Hillman Fear Pickering amp Chamberlain 1996) and report similarity in overall measures using either subscales or measures based on all ofthe items They also report large logit differences among items within a subscale Daltroy et al (Daltroy et aI 1992) grouped items into six subscales in search ofa sequential functional loss scale Their aim was to develop a Guttman scale offunction in the elderly They reported that 83 ofnon-arthritic subjects fit their scale compared to 65 ofarthritic subj ects Their Rasch analysis indicated that lifting a cup to the mouth did not fit the Guttman scale pattern In the Daltroy study getting in and out ofa car was grouped with doing chores and running errands as the most difficult subscale In the current study getting in and out ofa car was easier for US RA patients with a rank of 4th easiest compared to lifting a cup which was 5th bull Itwas also 4th easiest for British RA patients and 11 th easiest for the NHEFS sample The current study along with these findings maysignal cautions conceptualizing disability as a singleinvariant sequence orhierarchy The Rasch assumption ofunidimentionality seems intact and we have conducted confirmatory factor analysis using methods suitable for ordinal items and found that a single factor model adequately fit the ADL data Nonetheless the nature ofdisability may well vary within and between groups that even share the same diagnosis such as RA Such variation may be seen in the item calibrations for lifting a cup
The Rasch analysis also demonstrates that theADL based measures ofdisability provide a poor measurementtool for nearly halfofthe NHEFS sample who were entirely disability free during the 1982 to 1984 followshyup Certainly the fit between items and persons is better in a population with more disability such as RA patients However even for RA patients
MEASURING DiSABILITY 861
the estimate ofreliability for the Likert scale is inflated over that provided by the Rasch analysis and the infonnation provided by the Likert analysis about the distribution ofdisability in either the general population or among RA patients is different from and contradictory to the infonnation provided by the Rasch analysis
ACKNOWLEDGEMENTS
Supported in part by grants from the Arthritis Foundation and the Claude Pepper Older Americans Independence Center We thank Dr Alan Tennant from the University ofLeeds for his prompt response to our request for HAQ item data for RA patients from the UK
REFERENCES
Andrich D (1978) A rating fonnulation for ordered response categoshyries Psychometrika 43(4)561-573
Andrich D (1988) Rasch Models for Measurement Newbury Park CA Sage Publications Inc
Andrich D amp van Schoubroeck L (1989) The General Health Quesshytionnaire a psychometric analysis using latent trait theory PsycholMed 19(2)469-85
862 SHEEHAN et al
Daltroy L H Logigian M Iversen M D amp Liang M H (1992) Does musculoskeletal fimction deteriorate in a predictable sequence in the elderly Arthritis Care Res 5(3) 146-50
Fries1 F Spitz P Kraines R G amp Holman H R (1980) Measureshyment ofpatient outcome in arthritis Arthritis andRheumatism 23(2) 137-145
Guttman L (1950) The basis for scalogram analysis In Stouffer (Ed) Measurement and Prediction (Vol 4 pp 60-90) Princeton NJ Princeton University Press
Hubert H B Bloch D A amp Fries J F (1993) Risk factors for physishycal disability in an aging cohort the NHANES I Epidemiologic Followup Study [published erratum appears in J Rheumatol1994 Jan21 (1) 177] J Rheumatol 20(3) 480-8
Katz S Downs T D Cash H R amp Grotz R C (1970) Progress in development ofthe index ofADL Gerontologist 10(1)20-30
Lazaridis E N Rudberg M A Furner S E amp Casse C K (1994) Do activities ofdaily living have a hierarchical structure An analysis using the longitudinal study ofaging Journal ofGerontology 49(2 M47-M51) M47-M51
Linacre1 M amp Wright B D (1998a) A Users Guide to Bigsteps Winsteps Rasch-Model Computer Program Chicago MESA Press
Linacre 1 M amp Wright B D (1998b) Winsteps Chicago MESA Press
Merbitz C Morris 1 amp Grip 1 C (1989) Ordinal scales and foundashytions ofmisinference [see comments] Arch Phys Med Rehabil 70(4) 308-12
Miller H W (1973) Plan and operation ofthe Health and Nutrition Examination Survey United States- 1971-1973 Vital and Health Statistics Series 1(1 Oa) 1-42
Rasch G (1980) Probabilistic Models for Some Intelligence andAtshytainment Tests Chicago MESA Press
Reisine S amp Fifield 1 (1992) Expanding the definition ofdisability implications for planning policy and research Milbank Memorial
MEASURING DiSABILITY 863
Quarterly 70(3)491-509
Reisine S Fifield 1 amp Winkelman D K (2000) Characteristics of rheumatoid arthritis patients who participates in long-term research and who drops out Arthritis Care Res 13(1) 3-10
SAS Institute (1989) SAS (Version 60) Cary NC SAS Institute Inc
Sonn U (1996) Longitudinal studies ofdependence in daily life activities among elderly persons Scandinavian Journal of Rehabilitation Medicine S342-28
SPSS (1997) SPSS (Version 80) Chicago SPSS
SSI (1998) PRELIS (Version 220) Lincolnwood IL Scientific Softshyware International
Tennant A Hillman M Fear 1 Pickering A amp Chamberlain M A (1996) Are we making the most ofthe Stanford Health Assessment Questionnaire British Journal ofRheumatology 35574-578
Thorndike E L (1904) An Introduction to the Theory ofMental and Social Measurements New York Teachers College
Whalley D Griffiths B amp Tennant A (1997) The Stanford Health Assessment Questiom1aire a comparison ofdifferential item functionshying and responsiveness in the 8- and 20 item scoring systems Brit J Rheum 36(Supple 1) 148
Wright B (1997) A history ofsocial science measurement MESA Memo 62 Available httpMESAspcuchicagoedulmemo62htm [1998 Oct 29 1998]
Wright B D amp Linacre 1 M (1989) Observations are always ordinal measurements however must be interval Archives ofPhysical Medishycine and Rehabilitation 70857-867
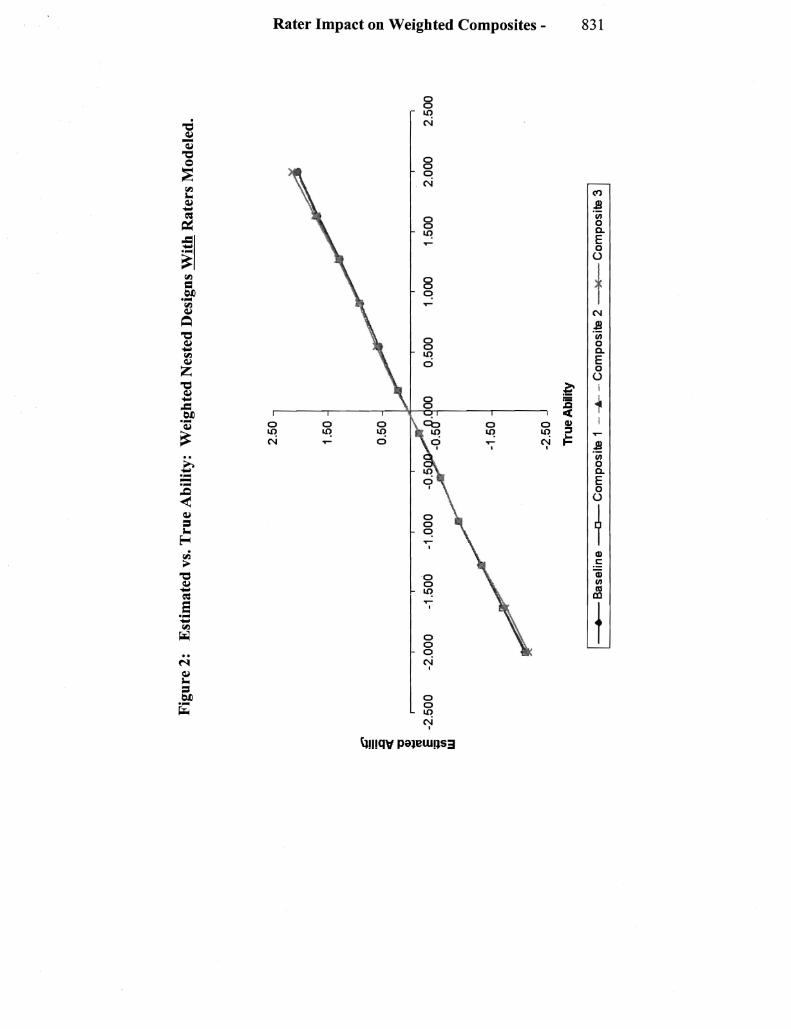
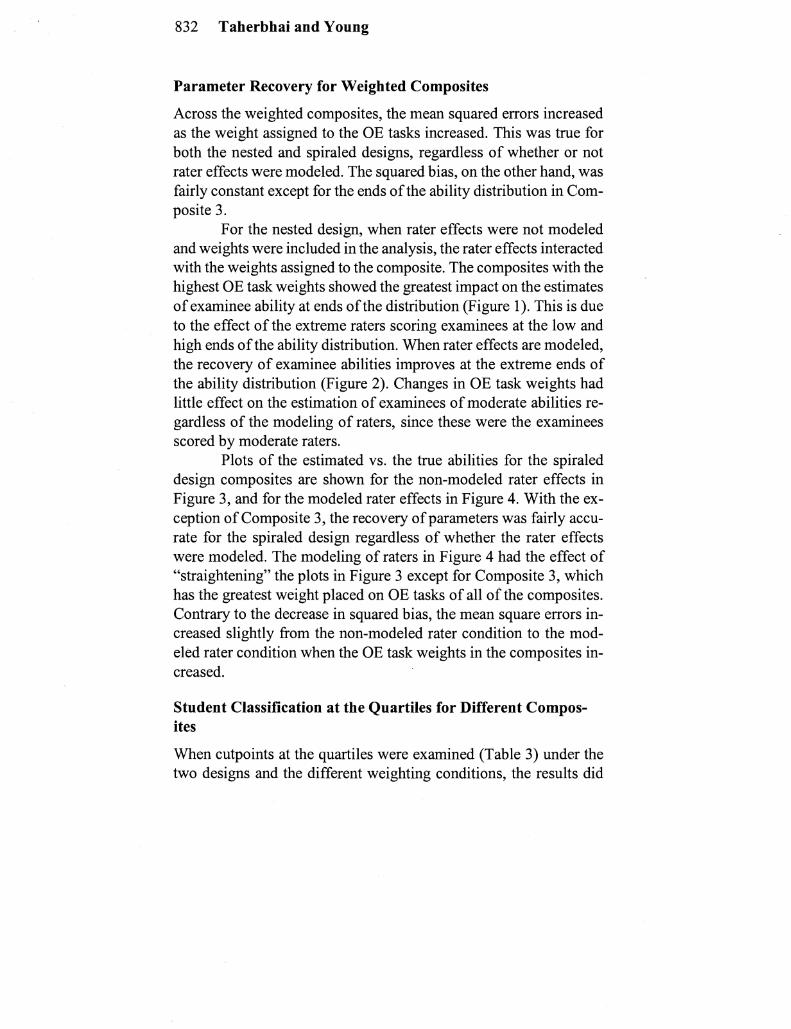
Fig
ure
3
Est
imat
ed v
s T
rue
Abi
lity
W
eigh
ted
Spi
rale
d D
esig
ns W
itho
ut R
ater
s M
odel
s
250
0
200
0
150
0
euro c laquo C
IIgt
1U
E
t
w
-25
00
-15
00
100
0
050
0
-10
00
050
0
-15
00
-20
00
-25
00
Tru
e A
bilit
y
to
-B
ase
line
-0
--
Co
mp
osi
te 1
-
-shy--
Co
mp
osi
te 2
=c
~ (
) a C
~
f) o =
~
()
150
0 2
500
(JQ
=shy shy Q
()
o a C
o f- (
)
f-
00
J
)
)(
Co
mp
osi
te 3
J
)
00
g ~ CI
Ggt
1U
150
0
050
0
E
-25
00
-20
00
-15
00
-1
000
050
0 1
000
150
0 2
000
~
w
-15
00
Fig
ure
4
Est
imat
ed v
s T
rue
Abi
lity
W
eigh
ted
Spi
rale
d D
esig
ns W
ith
Rat
ers
Mod
els
w
Jgt
250
0 ~ =shy ~
I C =shy ~ ~ = ~ ~ Q
=
IJC =
250
0
-25
00
True
Abi
lity
-
Bas
elin
e --
O--
Co
mp
osit
e 1
bull
Com
posi
te 2
)0
( C
ompo
site
3
m
Rater Impact on Weighted Composites - 835
not differ much from Taherbhai and Youngs (2000) results Rere again there was little movement from one condition to another unshyder the two designs and consistency in examinee classification was very high
CONCLUSIONS
The impact of rater effects is well documented in the literature (Engelhard 1994 1996 Rombo et aI 2000 Linacre 1989 Lunz et aI 1990) The composite effect of weighing Me items and OE tasks differentially however has not received much attention
Under the nested design when very severe or lenient raters are paired with examinees at the ends of the ability distribution exshyaminee ability estimates can be systematically distorted As LUllZ Wright and Linacre (1990) point out ifraters are used to score tasks for assessments and their effects are not modeled it may lead to poor ability estimates especially if extreme raters are paired with examinshyees that are extreme in their abilities Furthermore weighing items and tasks differentially confounds rater effects and further complishycates the recovery of true ability estimates of examinees
The use of spiraled over nested designs when rater effects are not modeled was justified in Rombo et aI (2000) due to the deshycrease in bias that these designs provided in estimating examinees abilities This result is supported by our study The recovery of exshyaminee abilities and the overall MSEs was better for spiraled designs than nested designs when rater effects where not modeled The spishyraled design with unmodeled rater effects was also comparable to the modeled nested design except for the very slight increase in MSE
However any advantage that the spiraled design has in reshyducing the bias ofability estimates decreased when composite scores were used that placed much greater weights on open-ended tasks than those on the multiple-choice items In this situation the bias and the MSE increased not only for the unmodeled nested design but also for both the modeled and the unmodeled spiraled designs
As stated in the paper this study is not exhaustive of all the possible rater designs and weighted conditions that could be included Further research needs to be undertaken to examine the complex inshy
836 Taherbhai and Young
Table 3 Percent of Students Changing Classification with Respect to Quartiles
Nested Design Spiralled Design
Oassification Change Oassification Change
ConditionlCutpoint Up own Up Down
Baseline
Rater Effects Modeled vs Not
Modeled
Q3 3
Median
QI 2
Rater Effects Not Modeled
Baseline vs Corrposite I
Q3 2
Median
QI 2
Baseline vs Corrposite 2
Q3 3
Median
QI Baseline vs Corrposite 3
Q3 3
Median
QI
Rater Effects Modeled
Baseline vs Corrposite I
Q3 Median
QI Baseline vs Corrposite 2
Q3
Median
QI Baseline vs Corrposite 3
Q3
Median
QI
Rater Impact on Weighted Composites - 837
teraction of raters tasks and examinee abilities when creating spishyraled designs and applying them to assessments that use weighted composite scores It would also be interesting to obtain results under the spiral design when the number of raters are more than the tasks that have to be rated Under this condition a semi-nestedspiral deshysign would exist in which a sub-set of students would be rated by some raters while another sub-set would be rated by a different group of raters The raters within a subset however would be spiraled
This paper should serve as a warning for obtaining composite scores by increasing the weights ofOE tasks relative to the MC items for less than substantive reasons and also for unknowingly pairing extreme raters with extreme-ability-students when the spiraled deshysign is not used or under the nested design without modeling rater effects
REFERENCES
Andrich D (1978) A rating formulation for ordered response categories Psychometrika 43 561-563
College Board (1988) The College Board technical manual for the Advanced Placement Program New York NY College Entrance Examination Board
Engelhard G (1996) Evaluating rater accuracy in performance asshysessments Journal ofEducational Measurement 31 (1) 56-70
Engelhard G (1994) Examining rater errors in the assessment of written-composition with the many-faceted Rasch model Jour nal of Educational Measurement 31(2) 93-112
Hombo C M Thayer D T amp Donoghue 1 R (2000) A simulashytion study of the effect ofcrossed and nested rater designs on ability estimation Paper presented at the annual meeting ofthe National Council on Measurement in Education New Orleans LA
Linacre 1 M (1989) A users guide to FACETS Rasch measure ment program and Facform data formatting computer program Chicago IL MESA Press
838 Taherbhai and Young
Linacre1 M (1993) Many-facet Rasch measurement Chicago IL MESA Press
Lunz M E Wright B D amp Linacre 1 M (1990) Measuring the impact ofjudge severity on examination scores Applied Mea surement in Education 3(4) 331-345
Taherbhai H M amp Young M 1 (2000) An analysis ofrater impact on composite scores using the multifaceted Rasch model Pashyper presented at the annual meeting of the National Council on Measurement in Education New Orleans LA
JOURNAL OF OUTCOME MEASUREMENT7 5(1) 839-863
Copyright8 2000 Rehabilitation Foundation Inc
Measuring disability application of the Rasch model
to Activities of Daily Living (ADLIIADL)
T Joseph Sheehan PhD
Laurie M DeChello
Ramon Garcia
Judith FifieldPhD
Naomi Rothfield MD
Susan Reisine PhD
University ofConnecticut School ofMedicine amp
University ofConnecticut
Requests for reprints should be sent to T Josep Sheehan University of Connecticut School ofMedicine 263 Farmington Ave Farmington CT 06030
839
840 SHEEHAN et al
This paper describes a comparative analysis of (ADL) and (IADL) items administered to two samples 4430 persons representative of older Americans and 605 persons representative of patients with rheumatoid arthrisit (RA) Responses are scored separately using both Likert and Rasch measurement models While Likert scoring seems to provide information similar to Rasch the descriptive statistics are often contrary if not contradictory and estimates of reliability from Likert are inflated The test characteristic curves derived from Rasch are similar despite differences between the levels of disability with the two samples Correlations ofRasch item calibrations across three samples were 71 76 and 80 The fit between the items and the samples indicating the compatibility between the test and subjects is seen much more clearly with Rasch with more than half of the general population measuring the extremes Since research on disability depends on measures with known properties the superiority ofRasch over Likert is evident
INTRODUCTION Physical disability is a major variable in health related research Assessing the degree ofdifficulty in performing Activities ofDaily Living (ADL) and Instrumental Activities ofDaily Living (IADL) scales is a common way to measure physical disability Individuals are asked how much difficulty they have in performing activities ofdaily living such as dressing getting up from a chair or walking two blocks For each activity there are 4 possible responses no difficulty some difficulty much difficulty or unable to do Responses are scored from 1to 4 or from 0 to 3 summed across all items and averaged to yield a disability score the higher the average the greater the disability These well-validated scales are efficient and widely used but their ordinal scaling can result in distortion by masking ineffective treatments or hiding effective procedures (Merbitz Morris amp Grip 1989)
Ordinal scales do not have any obvious unit ofmeasurement so that addition and division ofunknown units is considered meaningless Wright and Linacre (Wright amp Linacre 1989) have argued that while all observations are ordinal all measurements must be interval ifthey are to be treated algebraically as they are in computing averages The Rasch (Rasch 1980) measurement model offers a way to create interval scales from ordinal data a necessary condition for averaging or analyzing in statistical models that assume interval data
MEASURING DiSABILITY 841
As Wright and Linacre (Wright amp Linacre 1989) maintain computing an average score implies a metric that is only available with an interval scale In addition those average scores are non-linear and thereby lack a fimdamental property assumed in all measurers from yardsticks to financial worth that the measures increase along a linear scale Recognition of this problem is not new Thorndike (Thorndike 1904) identified problems inherent in using measurements ofthis type such as the inequality ofthe units counted and the non-linearity ofraw scores This study demonstrates how the Rasch measurement model converts non-linear ordinal data to a linear interval scale that provides new information about the utility ofcommonly used measures ofdisability While demonstrating the application ofthe Rasch model is the main purpose ofthis study it also includes a number ofcomparisons Rasch person measures are compared to Lickert person scores Rasch item calibrations are compared to Lickert item scores Rasch item calibrations estimated on a sample of older Americans are compared to item measures estimated on a sample of American rheumatoid arthritis (RA) patients and to those same items estimated on a sample ofBritish RA patients These comparisons should enhance understanding ofthe strengths and perhaps limitations ofusing the Rasch model in practice
Background
Before considering Rasch there is an alternative to averaging ranked data and treating them as interval and that is to simply treat them as ranked data Responses to each ADL item can be rank ordered ie no difficulty is less than some difficulty is less than much difficulty is less than unable to do so that responses to the ADL tasks can be ordered Also the ADL tasks themselves can be ordered For instance for most people walking two blocks is more difficult than lifting a cup or a glass to ones mouth It is easy to imagine individuals who though completely unable to walk two blocks would have no difficulty lifting a full cup or glass Because items can be ordered according to a scale of inherent difficulty ADL items have been organized into hierarchies and disability status is determined by where a persons responses fall along the ordered
842 SHEEHAN et al
hard-to-easy hierarchy One such scoring scheme was proposed by Katz (Katz Downs Cash amp Grotz 1970) the creator ofthe original six item ADL scale Another step-wise scoring scheme was recently reported by S01111 (S01111 1996)
Lazaridis and his colleagues (Lazaridis Rudberg Furner amp Casse 1994) studied the scalabilityofselected ADL items using criteria associated with Guttman scales For Guttman (Guttman 1950) a set ofitems is a scale ifa person with a higher rank than another person is just as high or higher on every item than the other person Lazaridis found that the Katz scoring scheme fulfilled Guttmans scaling criteria Lazaridis and his colleagues went further however and showed that the Katz hierarchy was one of360 possible hierarchies based upon permutations ofsix ADL items Lazaridis tested all 360 ofthese hierarchies using the same Guttman scaling criteria and found four additional scoring schemes that performed equally as well as Katz and found a total of103 scoring hierarchies that satisfied minimum standards ofscalability according to Guttman
While Guttman scaling does not violate the ordinal nature ofthe scales neither does it produce measures suitable for outcomes analyses that assume interval scaled measures Also Guttmans measurement model is deterministic rather than probabilistic and assumes that responses fall along a single hierarchy in a fixed order The Guttman model would have difficulty WIth that rare individual who was able to walk two blocks but unable to lift a full cup to hislher mouth Daltroyet al tested a Guttman scale of ADL items to determine whether musculoskeletal function deteriorates in an orderly fashion (Daltroy Logigian Iversen amp Liang 1992) They recommended that lifting a cup be dropped because it was too easy We discuss the item later Furthermore the fact that there is not a single hierarchical scale but as many as 103 different hierarchies underlying Katz six original ADL items exposes the disadvantage ofa rigid and deterministic hierarchy Amore attractive approach would capture the probabilistic nature ofthe responses without losing the concept ofa hierarchical scoring function The Rasch measurement model provides such an alternative
Rasch a Danish statistician interested in measuring spelling ability created a probabilistic measurement function which simultaneously
MEASURING DiSABILITY 843
estimates the abilities ofpersons and the difficulty oftest items Rasch showed how the probability ofanswering a question correctly depended on two things the ability ofthe person and the difficulty ofthe test item His model estimates person ability and item difficulty simultaneously and shows that the two are independent (Rasch 1980 p 19) Moreover the model provides a common scale for assessing both persons and items The distribution ofitem difficulties can be examined and compared directly to the distribution ofperson abilities on the same scale permitting visual judgments about the appropriateness of these items for these people Furthermore the common scale turns out to be an interval scale that is linear in contrast to the non-interval and non-linear scale calculated from the sum ofthe ranks or the average rank
METHODS
There are two sets ofsubjects used in this study The first set includes 4430 persons who were between ages 50 and 77 during the first National Health And Nutrition Examination Survey (NHANES I) carried out between 1971 and 1975 and who provided complete or nearly complete answers to the 26 ADL items administered during the NHANES Followshyup Study (NHEFS) conducted between 1982 and 1984 There were no initial measures ofphysical disability administered during NHANES I comparable to the ADL items NHANES I was administered to a national probability sample ofthe civilian noninstitutionalized US popUlation (Hubert Bloch amp Fries 1993 Miller 1973)
The persons in the second study group are a nationally representative sample ofpatients with RA (Rei sine amp Fifield 1992) The patients were recruited in 1988 using a two-stage process to ensure that it represented RA patients cared for by board-certified rheumatologists First a sample of 116 board-certified rheumatologists was randomly selected from the membership ofthe American College ofRheumatology In the second stage patients with definite or classical RA were asked to participate as they visited the office over a defined recruitment period Nine hundred twenty-one (88) ofthe patients who initially expressed interest agreed to participate in the panel study Patients were interviewed
844 SHEEHAN et al
yearly by telephone regarding their social physical and emotional fimctioning including their fimctional ability using the Health Assessment Questionnaire (HAQ) (Fries Spitz Kraines amp Holman 1980) The data for the present analysis are from those patients who participated in the sixth year interview ofthe panel study (N=605 66 ofthe original panel) A recent study (Rei sine Fifield amp Winkelman 2000) indicates that those who continued to participate had a higher level ofeducation were more likely to be female had higher social support and fewer joint flares
For comparison ofitem calibrations data on a third set ofsubjects are included 174 from Great Britain diagnosed withRA (Whalley Griffiths amp Tennant 1997) The inclusion ofanotherRA group allows comparison ofitem calibration between groups ofpatients with the same diagnosis and between RA patients and the general popUlation ofolder Americans Person measures were not available for the British RA group
The NHEFS data were extracted from the tapes using SAS (SAS Institute 1989) Initial statistical analyses were performed using SPSS 80 (SPSS 1997) andPRELIS 212 (SSI 1998) Computations for the Rasch model were performed using WINSTEPS (Linacre amp Wright 1998b) a computer program written by Linacre and Wright (Linacre amp Wright 1998a)
Although Rasch created his model with test items which could be scored right orwrong Andrich (Andrich 1988) has extended the Rasch model to rating scales which include items with ordered response alternatives such as those found on the ADL scale Thus each item instead ofbeing scored right orwrong is considered to have two or more ordered steps between response categories The Andrich model estimates the thresholds for each item separating each ordered step from the next that point on a logit scale where a category 1 response changes to a category 2 response a category 2 response changes to a category 3 response or a category 3 response changes to a category 4 response The Andrich model also offers the user a choice between a model that assumes equal steps between categories the rating scale model or a model that actually estimates the distance between categories the partial credit model (Andrich 1978) the latter being used in this study to conform to the
MEASURING DiSABILITY 845
Whalley et al analysis The Rasch analysis estimates the difficulty level ofeach ADL item
and the ability level ofeach person along the same logit scale The Rasch analysis also produces a test characteristic curve which graphs the relationship between each person measure and the expected score based on the sum ofthe ranks the numerator used to compute a Likert score In
this study the test characteristic curve for 19 of26 ADL items from the
NHANES study is compared to the test characteristic curve estimated from 19 of20 parallel items in the Reisine study The 19 items used in the Reisine study are taken from the twenty item Health Assessment Questionnaire (HAQ) (Fries et aI 1980) The 19 HAQ items contain 15 exact matches and 4 items that are very similar to those used in the NHEFS The item abbreviations and full text for both ADL and HAQ are shown in Table 1 One of the 26 ADL items walkfrom one room to another on the same level had too many missing responses to be included in these analyses The parallel item from the HAQ walk outdoors on flat ground was dropped leaving 19 items to compute test characteristic
curves for comparison
RESULTS
The initial analyses showed skewed distributions ofresponses on all 25 ADL items for the NHEFS sample The category 1 responses ranged from a high of953 who had no difficulty lifting a cup to a low of 600 who had no difficulty with heavy chores The category 4 response unable to do an activity is uniformly low under 10 for most items with heavy chores being impossible for 174 A complete table of responses is available from the authors Skewness is also seen in the responses ofthe RA patients although their overall level ofdisability is higher
Figure 1 summarizes person disability measures horizontally and item difficulty level vertically for NHEFS Persons are distributed across the bottom with M marking the mean and S the standard deviation There are 102 persons at the mean (M) of-227 There are 2079 persons at the bottom end ofthe scale who have no difficulty with any ofthe ADL
846 SHEEHAN et al
Table 1
Item abbreviashytion Dresself
Shampoo Arisechr
Inoutbed Makefood Cutrneat Liftcup
Openmilk Wlk2b1ck
Wlk2step
Faucets Bathtub Washbody
Toilet Combhair Reach51b
Pkupclth
Cardoors Openjars
Write
Inoutcar Shop Ltchores
Liftbag
Hvchores
ADL
Dress yourself including tying shoes working zippers and doing buttons Shampoo your hair Stand up from an armless straight chair Get into and out of bed Prepare your own food Cut your own meat Lift a full cup or glass to your mouth Open a new milk carton Walk a quarter mile (2 or 3 blocks) Walk up and down at least two steps Turn faucets on or off Get in and out of the bathtub Wash and dry your whole body Get on and off the toilet Comb your hair Reach and get down a 51b Object (bag of sugar) from just above your head Bend down and pick up clothing from the floor Open push button car doors Open jars which have been previously opened Use a pen or pencil to write with Get in and out of a car Run errands and shop Do light chores such as vacuuming Lift and carry a full bag of groceries Do heavy chores around the house or yard or washing windows walls or floors
Activities ofDailyLivin~ (ADL) and Health Assessment QuestionnaIre items
close match modlfied
HAQ
Dress yourself including tying shoelaces and doing buttons
Shampoo your hair Stand up from an armless straight chair Get in and out of bed
Cut your meat Lift a full glass or cup to your mouth Open a new milk carton
Climb up five steps
Turn faucets on and off Take a tub bath Wash and dry your entire body
Get on and off the toilet
Reach and get down a 51b object from just above your head
Bend down and pick clothing up from the floor Open car doors Open jars which have been previously opened
Get in and out of a car Run errands and shop Do chores such as vacuuming and yard work
MEASURING DiSABILITY 847
items and 15 persons at the right end ofthe scale who were unable to perform any ofthe tasks When extreme persons are included the mean for persons drops from -227 to -393 and the standard deviation increases from 167 to 222 The presence ofso many atthe bottom of the scale draws attention to the floor effects ofthe test at least for the general population ofolder Americans
The right-hand column in Figure 1 orders items from easiest at the top to hardest at the bottom Items at the top ofthe Rasch scale such as lift a cup or turn afaucet on or off are easier than items below with the hardest items at the bottom lift and carry a full bag ofgroceries or do heavy chores around the house or yard To the left ofeach item the responses 123 and 4 are arranged at a location corresponding to the expected measure ofa person who chose that response to that item Thus the expected measure ofa person who responded with a 4 to the easiest item unable to lift afull cup or glass to ones mouth would be slightly greater than 4 or the most disabled end of the scale Whereas the expected measure ofa person who chose category 4 in response to the hardest item and was unable to perform heavy chores would be aboutshy08 almost a standard deviation above the mean person disability measure of -227
Figure 1 also shows a colon () separating the response categories for each item Those separation points are the thresholds between response categories estimated by the Andrich model mentioned earlier The mean item calibration is 00 and standard deviation is 111 It is noteworthy that the mean item calibration ofzero and standard deviation of111 suggests that the item distribution is far to the right ofthe person distribution Also the item standard deviation of 111 suggests far less dispersion among items than the dispersion among persons which reaches 222 when extreme measuring persons are included Such misalignment ofthe item andperson distributions signals serious limitations in using this measure for these persons The distribution of person measures is far lower than the distribution ofitem calibrations indicating a poor fit between this test and these persons at least at the time these items were administered that is the first ofseveral follow-up surveys on the same SUbjects For an ideal test the distribution ofitems and persons should show similar alignments
848 SHEEHAN at al
EXPECIED scxFE MEAN ( INDIaITES HALF-scxFE roINr) -5 -3 -1 1 3 5 7 I---+shy I ITEM 1 1 2 3 4 4 liftrnp 1 1 2 3 4 4 faucets 1 1 2 3 4 4 cxnbhair 1 1 2 3 4 4 toilet 1 1 2 3 4 4 arisEtecl 1 1 2 3 4 4 write 1 1 2 3 4 4 cpenjars 1 1 2 3 4 4 cutrreat 1 1 2 3 4 4 qenmilk 1 1 2 3 4 4 carctors 1 1 2 3 4 4 washIxxiy 1 1 2 3 4 4 dresself 1 1 2 3 4 4 inoutcar 1 1 2 3 4 4 rrekefcxxj 1 1 2 3 4 4 walk2ste 1 1 2 3 4 4 pkuplth 1 1 2 3 4 4 arisedrr 1 1 2 3 4 4 sharrpo 1 1 2 3 4 4 reach5Jb 1 1 2 3 4 4 bathtub 1 1 2 3 4 4 shcp 1 1 2 3 4 4 Itd10res 1 1 2 3 4 4 wlk2blck 1 1 2 3 4 4 lifttag 11 2 3 4 4 hvd10res I---+shy I I -+shy I I ITEM -5 -3 -1 1 3 5 7
2 o 3 211 111 7 5 1 8 3997010877675453322121 1 1 9 3883730403642918894807786977099501673 52 3 2 5 PERSN
S M S Q
Figure 1 Most probable responses items are ordered onthe right hand side with less difficult items on the top Persons are ordered on the bottom with more disabled persons on the right The figure answers the question which category is aperson ofaparticular person measure most likely to choose The distribution ofitem difficulties has amean ofzero and a standard deviation ofl04 The distribution of231 0 non-extreme person measures has amean of-218 and a standard deviation of168 There are 2079 extreme responses at the bottom ofthe scale and 15 extreme responses at the top ofthe scale
MEASURING DiSABILITY 849
The fit may improve as this population ages and becomes more disabled
In contrast the Rasch analysis ofthe RA sample shows a mean of-180 for 563 non-extreme persons indicating a higher level ofdisability than in the general population Also there are only 41 extreme measures 40 with no difficulty on any item and one person was unable to perform any ofthe ADL tasks The misalignment between the item and person distributions is not as severe for the RA patients but the item distribution centered about zero with a standard deviation of096 is still higher and more dispersed than the person distribution It is noteworthy that the mean for non-extreme NHEFS changes little from -227 to -212 when 19 rather than 25 ADL items are used likewise the mean changes little when extreme persons are included -393 to -386
Figure 2 graphs the relationship between person measures for the 25 ADL items and the Likert score the average ofthe sum ofthe ranks The graph demonstrates the non-interval and non-linear nature ofLikert scores Thus while the Rasch measures are linear and use the sanle invariant interval across the entire range ofmeasures the Likert scores are neither linear nor invariant Likert metric is about four times greater in the middle than toward the top or bottom ofthe scale a clear violation ofthe linearity assumption underlying all valid measurement There is a similar curve for the RA sample While Figure 2 shows the curve relating Rasch measures to observed Likert scores Winsteps also produces curves for a test based upon statistical expectations called the test characteristic curves
Figure 3 shows two test characteristic curves based upon a set of 19 ADL items One curve is estimated from the NHEFS sample the second curve from patients with Rheunlatoid Arthritis (RA) (Rei sine amp Fifield 1992) The NHEFS sample is slightly older on average than the RA sample 620 years versus 590 years and is more male 43 versus 22 Although the salllples differslightly in age and considerably in gender and disability with disability levels higher among the RA patients the test characteristic curves are similar
While the characteristic curves indicate that the two instruments process raw scores in much the same way it is helpful to examine the items themselves Table 2 contains the item calibrations for NHEFS for the RA sample and for the RA patients from Great Britain studied by
850 SHEEHAN et al
400rshyI
I o 300shy
~ laquo Q)
~ 2001
~
100 + I
-500
Rasch person measure on 25 ADL items
--r---- shy-250
I 000
I 250 500
Figure 2 Graph ofRasch measures for persons and ADL average scores based on the average rank assigned to each of25 ADL items
Whalley Griffiths and Tennant (Whalley et aI 1997) The item error varies from 03 to 08 for NHEFS from 06 to 09 for HAQ US and from 11 to 15 for HAQ UK Ideally infit root mean square standard errors should be at or near one Wash and dry body was the furthest from one in the NHEFS sample at 70 take a bath at 166 in HAQ US and wash and dry body at 58 in HAQ UK were those samples only extreme items These items do not fit the scales as well as all other items
MEASURING DiSABILITY 851
Wash and dry body in both the NHEFS and HAQ UK samples may indicate this item is dependent on the data but it is not so severe for NHEFS Take a bath in the HAQ US sample causes some noise in the scale however all other items are within 18 0 f one It appears that there
76 73
70 (f) 67 E 64 Q)
61 0 58 (J
55c 0 52 (f) 49Q)
46(f) c 430 0 40 (f)
37Q)
cr 34-0 31 E 28 -J () 25
NHEFS 22 -shy19
RA -8 -4 -2 0 2 4 6 8
Person Measure
Figure 3 Test characteristic curves for 19 similar ADL items administered to NHEFS and RA samples demonstrating the non-linear nature ofscores based upon the sum ofthe ranks and the similarity ofthe curves despite differences in the samples
Craquo
Tab
le 2
NH
EF
S H
AQ
US
and
HA
Q U
K it
em c
ompa
riso
n T
he it
em m
easu
res
are
from
the
part
ial c
redi
t II
)
UI
Ras
ch m
odel
en
I
m
m
Num
ber
Item
N
HE
FS
H
AQ
US
H
AQ
UK
N
HE
FS
H
AQ
US
H
AQ
UK
j
Mea
sure
s M
easu
res
Mea
sure
s R
ank
s R
ank
s R
ank
s _z
1
Lif
tcu
p
266
8
2 2
60
1 5
1 ~
2 F
auce
ts
156
9
9
70
2 3
5 shy
3 T
oil
et
71
153
1
44
3 2
2 4
Ari
seb
ed
56
154
7
8 4
1 3
5 O
pen
iars
3
6 2
0
-66
5
8 14
6
Cu
tmea
t 2
9 1
1 -
45
6 9
13
7 O
pen
mil
k
29
-11
0 -1
48
7 16
18
8
Car
do
ors
2
5 3
0
11
8
7 8
9 W
ash
bo
dy
1
2 3
8
-33
9
6 12
10
D
ress
elf
02
-01
1
1 10
11
9
11
In
ou
tcar
-
12
91
71
11
4 4
12
W
alk
2st
ep
-35
-
14
10
12
14
10
13
P
ku
pcl
th
-36
0
3 3
0 13
10
6
14
A
rise
chr
-42
-
07
2
6
14
12
7
15
Sh
amp
oo
-
45
-13
-
23
15
13
11
16
R
each
5lb
-1
15
-13
1 -1
86
16
1
7
19
17
B
ath
tub
-1
28
-18
7
-10
9 1
7
19
17
18
S
ho
p
-13
3 -
35
-7
2
18
15
15
19
L
tch
ore
s -1
37
-18
1 -1
01
19
18
16
Item
err
or
var
ies
from
03
to
08
forN
HE
FS
0
6 t
o 0
9 f
or
HA
Q U
S
and
11
to
15
for
HA
Q U
K
Th
e on
ly e
xtr
eme
infi
t ro
ot
mea
n s
qu
are
erro
rs a
re w
ash
an
d d
ry b
od
y at
7
0 a
nd
5
8 f
orN
HE
FS
an
d H
AQ
UK
re
spec
tiv
ely
an
d ta
ke
a ba
th a
t 1
66 f
orH
AQ
US
MEASURING DiSABILITY 853
are tasks which are ofdifferent difficulty for RA patients than for the general population ofolderAmericans Perhaps the most striking difference is the difficulty ofopening a milk carton where the difficulty for RA patients is -11 0 and -148 among their most difficult tasks as compared to 29 for the general public It also appears that getting in and out of cars is more difficult for the general public than for RA patients -12 versus 91 and71 respectively Likewise getting on and offofa toilet is easier for RA patients than for the general public 153 and 144 versus 71 Perhaps the most striking difference is that of lifting a full cup or glass to ones mouth where the American RA patients differ substantially from the British RA patients and from the US general public 82 versus 266 and 260 respectively The size ofthis difference does not seem spurious because follow-up ofUS RA patients one and two years later shows that item calibrations for lifting a cup were similar 55 And 85 Daltroy et al had earlier (1992) recommended replacing lift a cup with opening ajar based on an extreme Rasch Goodness ofFit t of72 Table 2 shows that opening ajaris more difficult for BritishRA patients than for the other two groups -66 versus 36 and 20 respectively
Figure 4 shows the two sets ofRA items are plotted against each other The numerals marking each point correspond to the item numbers in Table 2 The correlation between the two sets ofitems is 80 and ifthe most discrepant item lifting a cup is removed the correlation reaches 87 The correlation between the NHEFS item calibrations and the British RA calibrations are 76 and 71 with the American RA calibrations The correlation between the NHEFS and US RA items rises from 71 to 77 if the most discrepant item lifting a cup is removed
Another way to compare the hierarchical nature ofthe items is to tirst rank each item relative to its own sample and then to compare ranks across samples Where the relative difficulty ofopening a milk carton was 6th for NHEFS it was 16th and 18th for the RA samples Surprisingly getting in and out ofa car was 4th for both RA samples but 11 th for NHEFS Lifting a cup was first or easiest for NHEFS and the British RA samples but 5th for the US RA san1ple Then there are some AmericanshyBritish differences Picking up clothes from the floorwas 13th and 10th for the Americans while it was 6th for the British Similarly standing up from an armless chair was 14th and 12th for the Americans while it was
854 SHEEHAN et al
o 1
HAQ_G8 =-004 + 085 haCLUS Itn e R-Square =064
o 3I
tn m10
E 12 0 4
E (1) cP1 ~ 00 8CD 00
() 15 0 9 o 6
o 18 0 5~ J_10
o 7
o 16-20~
-200 -100 000 100
HAQ US item measures
Figure 4 The item measures from the British and US RA samples Item nwnbers correspond to Table 2
7th for the British Other than these 5 sets ofdifferences there do not appear to be major differences in the item hierarchical structure among these items Despite these limitations there is an overall similarity of hierarchical structure and especially with the similarity oftest characteristic
MEASURING DiSABILITY 855
curves it is interesting to compare the distribution ofNHEFS and US RA samples further
The theoretical independence ofperson and item estimates was shown early by Rasch (Rasch 1980) for dichotomous items and its extension to estimating thresholds between categories within each item has already been described by Andrich and van Schoubroeck (Andrich amp van Schoubroeck 1989) Andrich and van Schoubroeck also point out that no assumptions need to be made about the distribution of~n in the population (Andrich amp van Schoubroeck 1989 p 474) As shown below the person distributions are dramatically different for the NHEFS and RA samples
Figure 5 shows the distribution ofpersons and items for the RA and NHEFS samples based on Likert scoring To see how sample
dependent the item calibrations are for the Likert scoring compare the distribution of item averages in Figure 5 where they are much more bunched together for the NHEFS sample than they are forthe RA sample The pattern ofitem calibrations for Rasch measurement is more similar across samples as seen in Figure 6 It is clear from both figures that the distribution ofdisability is different in RA patients than in the general population Both figures show that the NHEFS sample has a much higher percentage of persons at the lower end of the scale Both Likert and Rasch also show the reversed J shape for the NHEFS sample and a flatter distribution ofRA patients It would appear at least at first that both Likert scores and Rasch calibrations provide similar infonnation about the distribution ofdisability in these two populations Important differences become apparent when the moment statistics mean standard deviation skewness and kurtosis shown in Table 3 enhance the infonnation available from the graphical images
The means show a higher level ofdisability in the RA sample but the differences seem greater on the Rasch scale The Likert means appear closer 124 and 175 than the Rasch means -387 and-2l0 although they are both about one standard deviation apart in either metric The standard deviations seem to show a much greater spread on the Rasch scale but are similar for both the Likert scoring and Rasch measurement for the two samples While the means and standard deviations appear to
60
856 SHEEHAN et al
NHEFS
Itchores ariseochr
kuPCllh wlk2step
40
~ampoo dre sse I degrisebed
wash body
penjars20 ardoors
tmeat bathtub pound6 let aop
fa~ Is ~aCh5lb bttc p om 8tcar
0 10 13 16 19 22 25 28 31 34 37 40
Awrage Score
RA
-
12
--
8 r--- sse I - 0 shy
oCu meat I- shy~ oarscia Q clth8ku I- shy
00ram i Qute r4 I- shy
fa eels ~lk step0
liftc P 0 enja 5 tcho s shy0 0
ras body J ris chr r ach5 b 0
0 toil toari ~bed shop
0 o e nm i k ba htub r----
0
I I0 I 10 13 16 19 22 25 28 31 34 37 4
Average Score
Figure 5 Distribution ofLikert scores for persons and items based on 19 common items for NHEFS and RA samples Means = 124 and 175 standard deviations = 52 and 54 skewness = 295 and 75 and kurtosis = 922 and72
MEASURING DiSABILITY 857
be different they are at least consistent in describing the two samples The skewness indices reflect the asymmetry ofthe distributions
The NHEFS skewness index for the Likert scores is nearly twice as large as the index for Rasch measures 295 versus 139 A normal distribution has a skewness index ofzero and a positive index describes a long tail to the right The skewness indices for the RA sample show a reversal of signs 075 to -045 With skewness therefore consistency is lost and the information conveyed by Rasch is both contrary and contradictory to information conveyed by the Likert scores
The indices of kurtosis describing how peaked or flat the distributions are show almost a 5 fold difference between Likert and Rasch for the NHEFS sample 922 and 189 while the indices are close for the RA sample 60 for Rasch and 72 for Likert Since normal theory statistics assume there are excesses neither in skewness nor kurtosis it is clear that the distributional properties ofthe Rasch measures are superior to those ofLikert The Likert scores provide information about skewness and kurtosis that is contrary ifnot contradictory to the information provided by the Rasch analysis The fact that the correlation between Likert scores and Rasch measures is extremely high obviously does not mean the measures are equivalent it simply means that persons are in the same rank order on both scales Furthermore high correlations distract from the real need ofa meaningful metric against which progress can be measured
Finally it is noteworthy that the Rasch reliability estimates are consistently lower than reliabilities estimated from Likert scoring The Rasch reliability ofthe person measures estimated from 25 ADL items is 86 for non-extreme persons and drops to 62 when the 2094 extreme person measures are included The person measure reliability for the RA patients based upon 19 HAQ items is 90 and drops slightly to 88 when 41 extreme person measures are included The coefficient alpha estimate ofreliability for these same items when scored as a Likert scale is 94 In the Rasch analysis the HAQ has greater precision and less measurement error in assessing patients with arthritis than the ADL has in the general population and both have more measurement errorassociated with person measures than suggested by coefficient alpha from a Likert scale
858 SHEEHAN et al
10
0
8hampoo doilel
erisechr Jrisebed b3ucets gftcup
NHEFS
50
40
oopenjars
8utmeat
30 8penm ilk
8ardOOrS~ gash bodya
dresself20 o
~alk2step
6each51b ~noulcar
ampalhtub Jkupclth
-5310 -4202 -3094 -1966 -0676 0230 1336 2446 3554 4662 577
Measure
RA
- r----shy
rshy12
- diftcup
jYashbody
oopenjars6
cutmeat
JWPll h
~ isech
cJen ilk ~ressel ~noutcar
4 I-shy ach Ib ~ mpo Jaucets
~tchO es OW lk2st p oarisebed
lgtatht b
e0 8a~rhf--_rl~_l--__-r-~__--j o shy-6580 -5253 -3926 -2599 -1272 0055 1362 2709 4036 5363 66
Measure
Figure 6 Distribution ofRasch measures for NHEFS and RA samples and items Means = -3_87 and -210 standard deviations = 197 for both skewness =139 and -045 and kurtosis = 189 and 60
MEASURING DiSABILITY 859
Table 3 Summary statistics to describe distribution ofdisability in NHEFS and RA samples using Likert scores and Rasch measures Means Standard Deviation Skewshyness (measure of symmetry and equals 00 for normal distribution tail to the right for posivite value and left for negative value) and Kurtosis (measure of peakness equals 00 for normal distribution)
Scale Sample Mean SD Skewness Kurtosis
Likert NHEFS 124 052 295 922
RA 175 054 075 072
Rasch NHEFS -387 197 139 189
RA -210 197 -045 OliO
CONCLUSIONS
Improved precision in the methods ofmeasuring disability is essential to disability research Thurstone set out the fundamentals ofmeasurement in the 1920s (Wright 1997) and described the universal characteristics of all measurement Measurements must be unidimensional and describe only one attribute of what is measured The Rasch model assumes a single dimension underlying the test items and provides measures offit so that the unidimensionality assumption can be examined Measurements must be linear because the act ofmeasuring assumes a linear continuum as for example length height weight price or volume The Rasch analysis
860 SHEEHAN et al
reveals the non-linear nature ofLikert scores Measurements must also be invariant and use a repeatable metric all along the measurement continuum the essence ofan interval scale The Rasch analysis reveals the lack ofa repeatable metric for Likert scores
While all ADL items showed adequate fit to the Rasch model and hence the unidimensionality requirement has been met further study may show that the single construct ofdisability may have more than one measurable feature In fact some HAQ users combine items into up to 8 subscales (Tennant Hillman Fear Pickering amp Chamberlain 1996) and report similarity in overall measures using either subscales or measures based on all ofthe items They also report large logit differences among items within a subscale Daltroy et al (Daltroy et aI 1992) grouped items into six subscales in search ofa sequential functional loss scale Their aim was to develop a Guttman scale offunction in the elderly They reported that 83 ofnon-arthritic subjects fit their scale compared to 65 ofarthritic subj ects Their Rasch analysis indicated that lifting a cup to the mouth did not fit the Guttman scale pattern In the Daltroy study getting in and out ofa car was grouped with doing chores and running errands as the most difficult subscale In the current study getting in and out ofa car was easier for US RA patients with a rank of 4th easiest compared to lifting a cup which was 5th bull Itwas also 4th easiest for British RA patients and 11 th easiest for the NHEFS sample The current study along with these findings maysignal cautions conceptualizing disability as a singleinvariant sequence orhierarchy The Rasch assumption ofunidimentionality seems intact and we have conducted confirmatory factor analysis using methods suitable for ordinal items and found that a single factor model adequately fit the ADL data Nonetheless the nature ofdisability may well vary within and between groups that even share the same diagnosis such as RA Such variation may be seen in the item calibrations for lifting a cup
The Rasch analysis also demonstrates that theADL based measures ofdisability provide a poor measurementtool for nearly halfofthe NHEFS sample who were entirely disability free during the 1982 to 1984 followshyup Certainly the fit between items and persons is better in a population with more disability such as RA patients However even for RA patients
MEASURING DiSABILITY 861
the estimate ofreliability for the Likert scale is inflated over that provided by the Rasch analysis and the infonnation provided by the Likert analysis about the distribution ofdisability in either the general population or among RA patients is different from and contradictory to the infonnation provided by the Rasch analysis
ACKNOWLEDGEMENTS
Supported in part by grants from the Arthritis Foundation and the Claude Pepper Older Americans Independence Center We thank Dr Alan Tennant from the University ofLeeds for his prompt response to our request for HAQ item data for RA patients from the UK
REFERENCES
Andrich D (1978) A rating fonnulation for ordered response categoshyries Psychometrika 43(4)561-573
Andrich D (1988) Rasch Models for Measurement Newbury Park CA Sage Publications Inc
Andrich D amp van Schoubroeck L (1989) The General Health Quesshytionnaire a psychometric analysis using latent trait theory PsycholMed 19(2)469-85
862 SHEEHAN et al
Daltroy L H Logigian M Iversen M D amp Liang M H (1992) Does musculoskeletal fimction deteriorate in a predictable sequence in the elderly Arthritis Care Res 5(3) 146-50
Fries1 F Spitz P Kraines R G amp Holman H R (1980) Measureshyment ofpatient outcome in arthritis Arthritis andRheumatism 23(2) 137-145
Guttman L (1950) The basis for scalogram analysis In Stouffer (Ed) Measurement and Prediction (Vol 4 pp 60-90) Princeton NJ Princeton University Press
Hubert H B Bloch D A amp Fries J F (1993) Risk factors for physishycal disability in an aging cohort the NHANES I Epidemiologic Followup Study [published erratum appears in J Rheumatol1994 Jan21 (1) 177] J Rheumatol 20(3) 480-8
Katz S Downs T D Cash H R amp Grotz R C (1970) Progress in development ofthe index ofADL Gerontologist 10(1)20-30
Lazaridis E N Rudberg M A Furner S E amp Casse C K (1994) Do activities ofdaily living have a hierarchical structure An analysis using the longitudinal study ofaging Journal ofGerontology 49(2 M47-M51) M47-M51
Linacre1 M amp Wright B D (1998a) A Users Guide to Bigsteps Winsteps Rasch-Model Computer Program Chicago MESA Press
Linacre 1 M amp Wright B D (1998b) Winsteps Chicago MESA Press
Merbitz C Morris 1 amp Grip 1 C (1989) Ordinal scales and foundashytions ofmisinference [see comments] Arch Phys Med Rehabil 70(4) 308-12
Miller H W (1973) Plan and operation ofthe Health and Nutrition Examination Survey United States- 1971-1973 Vital and Health Statistics Series 1(1 Oa) 1-42
Rasch G (1980) Probabilistic Models for Some Intelligence andAtshytainment Tests Chicago MESA Press
Reisine S amp Fifield 1 (1992) Expanding the definition ofdisability implications for planning policy and research Milbank Memorial
MEASURING DiSABILITY 863
Quarterly 70(3)491-509
Reisine S Fifield 1 amp Winkelman D K (2000) Characteristics of rheumatoid arthritis patients who participates in long-term research and who drops out Arthritis Care Res 13(1) 3-10
SAS Institute (1989) SAS (Version 60) Cary NC SAS Institute Inc
Sonn U (1996) Longitudinal studies ofdependence in daily life activities among elderly persons Scandinavian Journal of Rehabilitation Medicine S342-28
SPSS (1997) SPSS (Version 80) Chicago SPSS
SSI (1998) PRELIS (Version 220) Lincolnwood IL Scientific Softshyware International
Tennant A Hillman M Fear 1 Pickering A amp Chamberlain M A (1996) Are we making the most ofthe Stanford Health Assessment Questionnaire British Journal ofRheumatology 35574-578
Thorndike E L (1904) An Introduction to the Theory ofMental and Social Measurements New York Teachers College
Whalley D Griffiths B amp Tennant A (1997) The Stanford Health Assessment Questiom1aire a comparison ofdifferential item functionshying and responsiveness in the 8- and 20 item scoring systems Brit J Rheum 36(Supple 1) 148
Wright B (1997) A history ofsocial science measurement MESA Memo 62 Available httpMESAspcuchicagoedulmemo62htm [1998 Oct 29 1998]
Wright B D amp Linacre 1 M (1989) Observations are always ordinal measurements however must be interval Archives ofPhysical Medishycine and Rehabilitation 70857-867
00
g ~ CI
Ggt
1U
150
0
050
0
E
-25
00
-20
00
-15
00
-1
000
050
0 1
000
150
0 2
000
~
w
-15
00
Fig
ure
4
Est
imat
ed v
s T
rue
Abi
lity
W
eigh
ted
Spi
rale
d D
esig
ns W
ith
Rat
ers
Mod
els
w
Jgt
250
0 ~ =shy ~
I C =shy ~ ~ = ~ ~ Q
=
IJC =
250
0
-25
00
True
Abi
lity
-
Bas
elin
e --
O--
Co
mp
osit
e 1
bull
Com
posi
te 2
)0
( C
ompo
site
3
m
Rater Impact on Weighted Composites - 835
not differ much from Taherbhai and Youngs (2000) results Rere again there was little movement from one condition to another unshyder the two designs and consistency in examinee classification was very high
CONCLUSIONS
The impact of rater effects is well documented in the literature (Engelhard 1994 1996 Rombo et aI 2000 Linacre 1989 Lunz et aI 1990) The composite effect of weighing Me items and OE tasks differentially however has not received much attention
Under the nested design when very severe or lenient raters are paired with examinees at the ends of the ability distribution exshyaminee ability estimates can be systematically distorted As LUllZ Wright and Linacre (1990) point out ifraters are used to score tasks for assessments and their effects are not modeled it may lead to poor ability estimates especially if extreme raters are paired with examinshyees that are extreme in their abilities Furthermore weighing items and tasks differentially confounds rater effects and further complishycates the recovery of true ability estimates of examinees
The use of spiraled over nested designs when rater effects are not modeled was justified in Rombo et aI (2000) due to the deshycrease in bias that these designs provided in estimating examinees abilities This result is supported by our study The recovery of exshyaminee abilities and the overall MSEs was better for spiraled designs than nested designs when rater effects where not modeled The spishyraled design with unmodeled rater effects was also comparable to the modeled nested design except for the very slight increase in MSE
However any advantage that the spiraled design has in reshyducing the bias ofability estimates decreased when composite scores were used that placed much greater weights on open-ended tasks than those on the multiple-choice items In this situation the bias and the MSE increased not only for the unmodeled nested design but also for both the modeled and the unmodeled spiraled designs
As stated in the paper this study is not exhaustive of all the possible rater designs and weighted conditions that could be included Further research needs to be undertaken to examine the complex inshy
836 Taherbhai and Young
Table 3 Percent of Students Changing Classification with Respect to Quartiles
Nested Design Spiralled Design
Oassification Change Oassification Change
ConditionlCutpoint Up own Up Down
Baseline
Rater Effects Modeled vs Not
Modeled
Q3 3
Median
QI 2
Rater Effects Not Modeled
Baseline vs Corrposite I
Q3 2
Median
QI 2
Baseline vs Corrposite 2
Q3 3
Median
QI Baseline vs Corrposite 3
Q3 3
Median
QI
Rater Effects Modeled
Baseline vs Corrposite I
Q3 Median
QI Baseline vs Corrposite 2
Q3
Median
QI Baseline vs Corrposite 3
Q3
Median
QI
Rater Impact on Weighted Composites - 837
teraction of raters tasks and examinee abilities when creating spishyraled designs and applying them to assessments that use weighted composite scores It would also be interesting to obtain results under the spiral design when the number of raters are more than the tasks that have to be rated Under this condition a semi-nestedspiral deshysign would exist in which a sub-set of students would be rated by some raters while another sub-set would be rated by a different group of raters The raters within a subset however would be spiraled
This paper should serve as a warning for obtaining composite scores by increasing the weights ofOE tasks relative to the MC items for less than substantive reasons and also for unknowingly pairing extreme raters with extreme-ability-students when the spiraled deshysign is not used or under the nested design without modeling rater effects
REFERENCES
Andrich D (1978) A rating formulation for ordered response categories Psychometrika 43 561-563
College Board (1988) The College Board technical manual for the Advanced Placement Program New York NY College Entrance Examination Board
Engelhard G (1996) Evaluating rater accuracy in performance asshysessments Journal ofEducational Measurement 31 (1) 56-70
Engelhard G (1994) Examining rater errors in the assessment of written-composition with the many-faceted Rasch model Jour nal of Educational Measurement 31(2) 93-112
Hombo C M Thayer D T amp Donoghue 1 R (2000) A simulashytion study of the effect ofcrossed and nested rater designs on ability estimation Paper presented at the annual meeting ofthe National Council on Measurement in Education New Orleans LA
Linacre 1 M (1989) A users guide to FACETS Rasch measure ment program and Facform data formatting computer program Chicago IL MESA Press
838 Taherbhai and Young
Linacre1 M (1993) Many-facet Rasch measurement Chicago IL MESA Press
Lunz M E Wright B D amp Linacre 1 M (1990) Measuring the impact ofjudge severity on examination scores Applied Mea surement in Education 3(4) 331-345
Taherbhai H M amp Young M 1 (2000) An analysis ofrater impact on composite scores using the multifaceted Rasch model Pashyper presented at the annual meeting of the National Council on Measurement in Education New Orleans LA
JOURNAL OF OUTCOME MEASUREMENT7 5(1) 839-863
Copyright8 2000 Rehabilitation Foundation Inc
Measuring disability application of the Rasch model
to Activities of Daily Living (ADLIIADL)
T Joseph Sheehan PhD
Laurie M DeChello
Ramon Garcia
Judith FifieldPhD
Naomi Rothfield MD
Susan Reisine PhD
University ofConnecticut School ofMedicine amp
University ofConnecticut
Requests for reprints should be sent to T Josep Sheehan University of Connecticut School ofMedicine 263 Farmington Ave Farmington CT 06030
839
840 SHEEHAN et al
This paper describes a comparative analysis of (ADL) and (IADL) items administered to two samples 4430 persons representative of older Americans and 605 persons representative of patients with rheumatoid arthrisit (RA) Responses are scored separately using both Likert and Rasch measurement models While Likert scoring seems to provide information similar to Rasch the descriptive statistics are often contrary if not contradictory and estimates of reliability from Likert are inflated The test characteristic curves derived from Rasch are similar despite differences between the levels of disability with the two samples Correlations ofRasch item calibrations across three samples were 71 76 and 80 The fit between the items and the samples indicating the compatibility between the test and subjects is seen much more clearly with Rasch with more than half of the general population measuring the extremes Since research on disability depends on measures with known properties the superiority ofRasch over Likert is evident
INTRODUCTION Physical disability is a major variable in health related research Assessing the degree ofdifficulty in performing Activities ofDaily Living (ADL) and Instrumental Activities ofDaily Living (IADL) scales is a common way to measure physical disability Individuals are asked how much difficulty they have in performing activities ofdaily living such as dressing getting up from a chair or walking two blocks For each activity there are 4 possible responses no difficulty some difficulty much difficulty or unable to do Responses are scored from 1to 4 or from 0 to 3 summed across all items and averaged to yield a disability score the higher the average the greater the disability These well-validated scales are efficient and widely used but their ordinal scaling can result in distortion by masking ineffective treatments or hiding effective procedures (Merbitz Morris amp Grip 1989)
Ordinal scales do not have any obvious unit ofmeasurement so that addition and division ofunknown units is considered meaningless Wright and Linacre (Wright amp Linacre 1989) have argued that while all observations are ordinal all measurements must be interval ifthey are to be treated algebraically as they are in computing averages The Rasch (Rasch 1980) measurement model offers a way to create interval scales from ordinal data a necessary condition for averaging or analyzing in statistical models that assume interval data
MEASURING DiSABILITY 841
As Wright and Linacre (Wright amp Linacre 1989) maintain computing an average score implies a metric that is only available with an interval scale In addition those average scores are non-linear and thereby lack a fimdamental property assumed in all measurers from yardsticks to financial worth that the measures increase along a linear scale Recognition of this problem is not new Thorndike (Thorndike 1904) identified problems inherent in using measurements ofthis type such as the inequality ofthe units counted and the non-linearity ofraw scores This study demonstrates how the Rasch measurement model converts non-linear ordinal data to a linear interval scale that provides new information about the utility ofcommonly used measures ofdisability While demonstrating the application ofthe Rasch model is the main purpose ofthis study it also includes a number ofcomparisons Rasch person measures are compared to Lickert person scores Rasch item calibrations are compared to Lickert item scores Rasch item calibrations estimated on a sample of older Americans are compared to item measures estimated on a sample of American rheumatoid arthritis (RA) patients and to those same items estimated on a sample ofBritish RA patients These comparisons should enhance understanding ofthe strengths and perhaps limitations ofusing the Rasch model in practice
Background
Before considering Rasch there is an alternative to averaging ranked data and treating them as interval and that is to simply treat them as ranked data Responses to each ADL item can be rank ordered ie no difficulty is less than some difficulty is less than much difficulty is less than unable to do so that responses to the ADL tasks can be ordered Also the ADL tasks themselves can be ordered For instance for most people walking two blocks is more difficult than lifting a cup or a glass to ones mouth It is easy to imagine individuals who though completely unable to walk two blocks would have no difficulty lifting a full cup or glass Because items can be ordered according to a scale of inherent difficulty ADL items have been organized into hierarchies and disability status is determined by where a persons responses fall along the ordered
842 SHEEHAN et al
hard-to-easy hierarchy One such scoring scheme was proposed by Katz (Katz Downs Cash amp Grotz 1970) the creator ofthe original six item ADL scale Another step-wise scoring scheme was recently reported by S01111 (S01111 1996)
Lazaridis and his colleagues (Lazaridis Rudberg Furner amp Casse 1994) studied the scalabilityofselected ADL items using criteria associated with Guttman scales For Guttman (Guttman 1950) a set ofitems is a scale ifa person with a higher rank than another person is just as high or higher on every item than the other person Lazaridis found that the Katz scoring scheme fulfilled Guttmans scaling criteria Lazaridis and his colleagues went further however and showed that the Katz hierarchy was one of360 possible hierarchies based upon permutations ofsix ADL items Lazaridis tested all 360 ofthese hierarchies using the same Guttman scaling criteria and found four additional scoring schemes that performed equally as well as Katz and found a total of103 scoring hierarchies that satisfied minimum standards ofscalability according to Guttman
While Guttman scaling does not violate the ordinal nature ofthe scales neither does it produce measures suitable for outcomes analyses that assume interval scaled measures Also Guttmans measurement model is deterministic rather than probabilistic and assumes that responses fall along a single hierarchy in a fixed order The Guttman model would have difficulty WIth that rare individual who was able to walk two blocks but unable to lift a full cup to hislher mouth Daltroyet al tested a Guttman scale of ADL items to determine whether musculoskeletal function deteriorates in an orderly fashion (Daltroy Logigian Iversen amp Liang 1992) They recommended that lifting a cup be dropped because it was too easy We discuss the item later Furthermore the fact that there is not a single hierarchical scale but as many as 103 different hierarchies underlying Katz six original ADL items exposes the disadvantage ofa rigid and deterministic hierarchy Amore attractive approach would capture the probabilistic nature ofthe responses without losing the concept ofa hierarchical scoring function The Rasch measurement model provides such an alternative
Rasch a Danish statistician interested in measuring spelling ability created a probabilistic measurement function which simultaneously
MEASURING DiSABILITY 843
estimates the abilities ofpersons and the difficulty oftest items Rasch showed how the probability ofanswering a question correctly depended on two things the ability ofthe person and the difficulty ofthe test item His model estimates person ability and item difficulty simultaneously and shows that the two are independent (Rasch 1980 p 19) Moreover the model provides a common scale for assessing both persons and items The distribution ofitem difficulties can be examined and compared directly to the distribution ofperson abilities on the same scale permitting visual judgments about the appropriateness of these items for these people Furthermore the common scale turns out to be an interval scale that is linear in contrast to the non-interval and non-linear scale calculated from the sum ofthe ranks or the average rank
METHODS
There are two sets ofsubjects used in this study The first set includes 4430 persons who were between ages 50 and 77 during the first National Health And Nutrition Examination Survey (NHANES I) carried out between 1971 and 1975 and who provided complete or nearly complete answers to the 26 ADL items administered during the NHANES Followshyup Study (NHEFS) conducted between 1982 and 1984 There were no initial measures ofphysical disability administered during NHANES I comparable to the ADL items NHANES I was administered to a national probability sample ofthe civilian noninstitutionalized US popUlation (Hubert Bloch amp Fries 1993 Miller 1973)
The persons in the second study group are a nationally representative sample ofpatients with RA (Rei sine amp Fifield 1992) The patients were recruited in 1988 using a two-stage process to ensure that it represented RA patients cared for by board-certified rheumatologists First a sample of 116 board-certified rheumatologists was randomly selected from the membership ofthe American College ofRheumatology In the second stage patients with definite or classical RA were asked to participate as they visited the office over a defined recruitment period Nine hundred twenty-one (88) ofthe patients who initially expressed interest agreed to participate in the panel study Patients were interviewed
844 SHEEHAN et al
yearly by telephone regarding their social physical and emotional fimctioning including their fimctional ability using the Health Assessment Questionnaire (HAQ) (Fries Spitz Kraines amp Holman 1980) The data for the present analysis are from those patients who participated in the sixth year interview ofthe panel study (N=605 66 ofthe original panel) A recent study (Rei sine Fifield amp Winkelman 2000) indicates that those who continued to participate had a higher level ofeducation were more likely to be female had higher social support and fewer joint flares
For comparison ofitem calibrations data on a third set ofsubjects are included 174 from Great Britain diagnosed withRA (Whalley Griffiths amp Tennant 1997) The inclusion ofanotherRA group allows comparison ofitem calibration between groups ofpatients with the same diagnosis and between RA patients and the general popUlation ofolder Americans Person measures were not available for the British RA group
The NHEFS data were extracted from the tapes using SAS (SAS Institute 1989) Initial statistical analyses were performed using SPSS 80 (SPSS 1997) andPRELIS 212 (SSI 1998) Computations for the Rasch model were performed using WINSTEPS (Linacre amp Wright 1998b) a computer program written by Linacre and Wright (Linacre amp Wright 1998a)
Although Rasch created his model with test items which could be scored right orwrong Andrich (Andrich 1988) has extended the Rasch model to rating scales which include items with ordered response alternatives such as those found on the ADL scale Thus each item instead ofbeing scored right orwrong is considered to have two or more ordered steps between response categories The Andrich model estimates the thresholds for each item separating each ordered step from the next that point on a logit scale where a category 1 response changes to a category 2 response a category 2 response changes to a category 3 response or a category 3 response changes to a category 4 response The Andrich model also offers the user a choice between a model that assumes equal steps between categories the rating scale model or a model that actually estimates the distance between categories the partial credit model (Andrich 1978) the latter being used in this study to conform to the
MEASURING DiSABILITY 845
Whalley et al analysis The Rasch analysis estimates the difficulty level ofeach ADL item
and the ability level ofeach person along the same logit scale The Rasch analysis also produces a test characteristic curve which graphs the relationship between each person measure and the expected score based on the sum ofthe ranks the numerator used to compute a Likert score In
this study the test characteristic curve for 19 of26 ADL items from the
NHANES study is compared to the test characteristic curve estimated from 19 of20 parallel items in the Reisine study The 19 items used in the Reisine study are taken from the twenty item Health Assessment Questionnaire (HAQ) (Fries et aI 1980) The 19 HAQ items contain 15 exact matches and 4 items that are very similar to those used in the NHEFS The item abbreviations and full text for both ADL and HAQ are shown in Table 1 One of the 26 ADL items walkfrom one room to another on the same level had too many missing responses to be included in these analyses The parallel item from the HAQ walk outdoors on flat ground was dropped leaving 19 items to compute test characteristic
curves for comparison
RESULTS
The initial analyses showed skewed distributions ofresponses on all 25 ADL items for the NHEFS sample The category 1 responses ranged from a high of953 who had no difficulty lifting a cup to a low of 600 who had no difficulty with heavy chores The category 4 response unable to do an activity is uniformly low under 10 for most items with heavy chores being impossible for 174 A complete table of responses is available from the authors Skewness is also seen in the responses ofthe RA patients although their overall level ofdisability is higher
Figure 1 summarizes person disability measures horizontally and item difficulty level vertically for NHEFS Persons are distributed across the bottom with M marking the mean and S the standard deviation There are 102 persons at the mean (M) of-227 There are 2079 persons at the bottom end ofthe scale who have no difficulty with any ofthe ADL
846 SHEEHAN et al
Table 1
Item abbreviashytion Dresself
Shampoo Arisechr
Inoutbed Makefood Cutrneat Liftcup
Openmilk Wlk2b1ck
Wlk2step
Faucets Bathtub Washbody
Toilet Combhair Reach51b
Pkupclth
Cardoors Openjars
Write
Inoutcar Shop Ltchores
Liftbag
Hvchores
ADL
Dress yourself including tying shoes working zippers and doing buttons Shampoo your hair Stand up from an armless straight chair Get into and out of bed Prepare your own food Cut your own meat Lift a full cup or glass to your mouth Open a new milk carton Walk a quarter mile (2 or 3 blocks) Walk up and down at least two steps Turn faucets on or off Get in and out of the bathtub Wash and dry your whole body Get on and off the toilet Comb your hair Reach and get down a 51b Object (bag of sugar) from just above your head Bend down and pick up clothing from the floor Open push button car doors Open jars which have been previously opened Use a pen or pencil to write with Get in and out of a car Run errands and shop Do light chores such as vacuuming Lift and carry a full bag of groceries Do heavy chores around the house or yard or washing windows walls or floors
Activities ofDailyLivin~ (ADL) and Health Assessment QuestionnaIre items
close match modlfied
HAQ
Dress yourself including tying shoelaces and doing buttons
Shampoo your hair Stand up from an armless straight chair Get in and out of bed
Cut your meat Lift a full glass or cup to your mouth Open a new milk carton
Climb up five steps
Turn faucets on and off Take a tub bath Wash and dry your entire body
Get on and off the toilet
Reach and get down a 51b object from just above your head
Bend down and pick clothing up from the floor Open car doors Open jars which have been previously opened
Get in and out of a car Run errands and shop Do chores such as vacuuming and yard work
MEASURING DiSABILITY 847
items and 15 persons at the right end ofthe scale who were unable to perform any ofthe tasks When extreme persons are included the mean for persons drops from -227 to -393 and the standard deviation increases from 167 to 222 The presence ofso many atthe bottom of the scale draws attention to the floor effects ofthe test at least for the general population ofolder Americans
The right-hand column in Figure 1 orders items from easiest at the top to hardest at the bottom Items at the top ofthe Rasch scale such as lift a cup or turn afaucet on or off are easier than items below with the hardest items at the bottom lift and carry a full bag ofgroceries or do heavy chores around the house or yard To the left ofeach item the responses 123 and 4 are arranged at a location corresponding to the expected measure ofa person who chose that response to that item Thus the expected measure ofa person who responded with a 4 to the easiest item unable to lift afull cup or glass to ones mouth would be slightly greater than 4 or the most disabled end of the scale Whereas the expected measure ofa person who chose category 4 in response to the hardest item and was unable to perform heavy chores would be aboutshy08 almost a standard deviation above the mean person disability measure of -227
Figure 1 also shows a colon () separating the response categories for each item Those separation points are the thresholds between response categories estimated by the Andrich model mentioned earlier The mean item calibration is 00 and standard deviation is 111 It is noteworthy that the mean item calibration ofzero and standard deviation of111 suggests that the item distribution is far to the right ofthe person distribution Also the item standard deviation of 111 suggests far less dispersion among items than the dispersion among persons which reaches 222 when extreme measuring persons are included Such misalignment ofthe item andperson distributions signals serious limitations in using this measure for these persons The distribution of person measures is far lower than the distribution ofitem calibrations indicating a poor fit between this test and these persons at least at the time these items were administered that is the first ofseveral follow-up surveys on the same SUbjects For an ideal test the distribution ofitems and persons should show similar alignments
848 SHEEHAN at al
EXPECIED scxFE MEAN ( INDIaITES HALF-scxFE roINr) -5 -3 -1 1 3 5 7 I---+shy I ITEM 1 1 2 3 4 4 liftrnp 1 1 2 3 4 4 faucets 1 1 2 3 4 4 cxnbhair 1 1 2 3 4 4 toilet 1 1 2 3 4 4 arisEtecl 1 1 2 3 4 4 write 1 1 2 3 4 4 cpenjars 1 1 2 3 4 4 cutrreat 1 1 2 3 4 4 qenmilk 1 1 2 3 4 4 carctors 1 1 2 3 4 4 washIxxiy 1 1 2 3 4 4 dresself 1 1 2 3 4 4 inoutcar 1 1 2 3 4 4 rrekefcxxj 1 1 2 3 4 4 walk2ste 1 1 2 3 4 4 pkuplth 1 1 2 3 4 4 arisedrr 1 1 2 3 4 4 sharrpo 1 1 2 3 4 4 reach5Jb 1 1 2 3 4 4 bathtub 1 1 2 3 4 4 shcp 1 1 2 3 4 4 Itd10res 1 1 2 3 4 4 wlk2blck 1 1 2 3 4 4 lifttag 11 2 3 4 4 hvd10res I---+shy I I -+shy I I ITEM -5 -3 -1 1 3 5 7
2 o 3 211 111 7 5 1 8 3997010877675453322121 1 1 9 3883730403642918894807786977099501673 52 3 2 5 PERSN
S M S Q
Figure 1 Most probable responses items are ordered onthe right hand side with less difficult items on the top Persons are ordered on the bottom with more disabled persons on the right The figure answers the question which category is aperson ofaparticular person measure most likely to choose The distribution ofitem difficulties has amean ofzero and a standard deviation ofl04 The distribution of231 0 non-extreme person measures has amean of-218 and a standard deviation of168 There are 2079 extreme responses at the bottom ofthe scale and 15 extreme responses at the top ofthe scale
MEASURING DiSABILITY 849
The fit may improve as this population ages and becomes more disabled
In contrast the Rasch analysis ofthe RA sample shows a mean of-180 for 563 non-extreme persons indicating a higher level ofdisability than in the general population Also there are only 41 extreme measures 40 with no difficulty on any item and one person was unable to perform any ofthe ADL tasks The misalignment between the item and person distributions is not as severe for the RA patients but the item distribution centered about zero with a standard deviation of096 is still higher and more dispersed than the person distribution It is noteworthy that the mean for non-extreme NHEFS changes little from -227 to -212 when 19 rather than 25 ADL items are used likewise the mean changes little when extreme persons are included -393 to -386
Figure 2 graphs the relationship between person measures for the 25 ADL items and the Likert score the average ofthe sum ofthe ranks The graph demonstrates the non-interval and non-linear nature ofLikert scores Thus while the Rasch measures are linear and use the sanle invariant interval across the entire range ofmeasures the Likert scores are neither linear nor invariant Likert metric is about four times greater in the middle than toward the top or bottom ofthe scale a clear violation ofthe linearity assumption underlying all valid measurement There is a similar curve for the RA sample While Figure 2 shows the curve relating Rasch measures to observed Likert scores Winsteps also produces curves for a test based upon statistical expectations called the test characteristic curves
Figure 3 shows two test characteristic curves based upon a set of 19 ADL items One curve is estimated from the NHEFS sample the second curve from patients with Rheunlatoid Arthritis (RA) (Rei sine amp Fifield 1992) The NHEFS sample is slightly older on average than the RA sample 620 years versus 590 years and is more male 43 versus 22 Although the salllples differslightly in age and considerably in gender and disability with disability levels higher among the RA patients the test characteristic curves are similar
While the characteristic curves indicate that the two instruments process raw scores in much the same way it is helpful to examine the items themselves Table 2 contains the item calibrations for NHEFS for the RA sample and for the RA patients from Great Britain studied by
850 SHEEHAN et al
400rshyI
I o 300shy
~ laquo Q)
~ 2001
~
100 + I
-500
Rasch person measure on 25 ADL items
--r---- shy-250
I 000
I 250 500
Figure 2 Graph ofRasch measures for persons and ADL average scores based on the average rank assigned to each of25 ADL items
Whalley Griffiths and Tennant (Whalley et aI 1997) The item error varies from 03 to 08 for NHEFS from 06 to 09 for HAQ US and from 11 to 15 for HAQ UK Ideally infit root mean square standard errors should be at or near one Wash and dry body was the furthest from one in the NHEFS sample at 70 take a bath at 166 in HAQ US and wash and dry body at 58 in HAQ UK were those samples only extreme items These items do not fit the scales as well as all other items
MEASURING DiSABILITY 851
Wash and dry body in both the NHEFS and HAQ UK samples may indicate this item is dependent on the data but it is not so severe for NHEFS Take a bath in the HAQ US sample causes some noise in the scale however all other items are within 18 0 f one It appears that there
76 73
70 (f) 67 E 64 Q)
61 0 58 (J
55c 0 52 (f) 49Q)
46(f) c 430 0 40 (f)
37Q)
cr 34-0 31 E 28 -J () 25
NHEFS 22 -shy19
RA -8 -4 -2 0 2 4 6 8
Person Measure
Figure 3 Test characteristic curves for 19 similar ADL items administered to NHEFS and RA samples demonstrating the non-linear nature ofscores based upon the sum ofthe ranks and the similarity ofthe curves despite differences in the samples
Craquo
Tab
le 2
NH
EF
S H
AQ
US
and
HA
Q U
K it
em c
ompa
riso
n T
he it
em m
easu
res
are
from
the
part
ial c
redi
t II
)
UI
Ras
ch m
odel
en
I
m
m
Num
ber
Item
N
HE
FS
H
AQ
US
H
AQ
UK
N
HE
FS
H
AQ
US
H
AQ
UK
j
Mea
sure
s M
easu
res
Mea
sure
s R
ank
s R
ank
s R
ank
s _z
1
Lif
tcu
p
266
8
2 2
60
1 5
1 ~
2 F
auce
ts
156
9
9
70
2 3
5 shy
3 T
oil
et
71
153
1
44
3 2
2 4
Ari
seb
ed
56
154
7
8 4
1 3
5 O
pen
iars
3
6 2
0
-66
5
8 14
6
Cu
tmea
t 2
9 1
1 -
45
6 9
13
7 O
pen
mil
k
29
-11
0 -1
48
7 16
18
8
Car
do
ors
2
5 3
0
11
8
7 8
9 W
ash
bo
dy
1
2 3
8
-33
9
6 12
10
D
ress
elf
02
-01
1
1 10
11
9
11
In
ou
tcar
-
12
91
71
11
4 4
12
W
alk
2st
ep
-35
-
14
10
12
14
10
13
P
ku
pcl
th
-36
0
3 3
0 13
10
6
14
A
rise
chr
-42
-
07
2
6
14
12
7
15
Sh
amp
oo
-
45
-13
-
23
15
13
11
16
R
each
5lb
-1
15
-13
1 -1
86
16
1
7
19
17
B
ath
tub
-1
28
-18
7
-10
9 1
7
19
17
18
S
ho
p
-13
3 -
35
-7
2
18
15
15
19
L
tch
ore
s -1
37
-18
1 -1
01
19
18
16
Item
err
or
var
ies
from
03
to
08
forN
HE
FS
0
6 t
o 0
9 f
or
HA
Q U
S
and
11
to
15
for
HA
Q U
K
Th
e on
ly e
xtr
eme
infi
t ro
ot
mea
n s
qu
are
erro
rs a
re w
ash
an
d d
ry b
od
y at
7
0 a
nd
5
8 f
orN
HE
FS
an
d H
AQ
UK
re
spec
tiv
ely
an
d ta
ke
a ba
th a
t 1
66 f
orH
AQ
US
MEASURING DiSABILITY 853
are tasks which are ofdifferent difficulty for RA patients than for the general population ofolderAmericans Perhaps the most striking difference is the difficulty ofopening a milk carton where the difficulty for RA patients is -11 0 and -148 among their most difficult tasks as compared to 29 for the general public It also appears that getting in and out of cars is more difficult for the general public than for RA patients -12 versus 91 and71 respectively Likewise getting on and offofa toilet is easier for RA patients than for the general public 153 and 144 versus 71 Perhaps the most striking difference is that of lifting a full cup or glass to ones mouth where the American RA patients differ substantially from the British RA patients and from the US general public 82 versus 266 and 260 respectively The size ofthis difference does not seem spurious because follow-up ofUS RA patients one and two years later shows that item calibrations for lifting a cup were similar 55 And 85 Daltroy et al had earlier (1992) recommended replacing lift a cup with opening ajar based on an extreme Rasch Goodness ofFit t of72 Table 2 shows that opening ajaris more difficult for BritishRA patients than for the other two groups -66 versus 36 and 20 respectively
Figure 4 shows the two sets ofRA items are plotted against each other The numerals marking each point correspond to the item numbers in Table 2 The correlation between the two sets ofitems is 80 and ifthe most discrepant item lifting a cup is removed the correlation reaches 87 The correlation between the NHEFS item calibrations and the British RA calibrations are 76 and 71 with the American RA calibrations The correlation between the NHEFS and US RA items rises from 71 to 77 if the most discrepant item lifting a cup is removed
Another way to compare the hierarchical nature ofthe items is to tirst rank each item relative to its own sample and then to compare ranks across samples Where the relative difficulty ofopening a milk carton was 6th for NHEFS it was 16th and 18th for the RA samples Surprisingly getting in and out ofa car was 4th for both RA samples but 11 th for NHEFS Lifting a cup was first or easiest for NHEFS and the British RA samples but 5th for the US RA san1ple Then there are some AmericanshyBritish differences Picking up clothes from the floorwas 13th and 10th for the Americans while it was 6th for the British Similarly standing up from an armless chair was 14th and 12th for the Americans while it was
854 SHEEHAN et al
o 1
HAQ_G8 =-004 + 085 haCLUS Itn e R-Square =064
o 3I
tn m10
E 12 0 4
E (1) cP1 ~ 00 8CD 00
() 15 0 9 o 6
o 18 0 5~ J_10
o 7
o 16-20~
-200 -100 000 100
HAQ US item measures
Figure 4 The item measures from the British and US RA samples Item nwnbers correspond to Table 2
7th for the British Other than these 5 sets ofdifferences there do not appear to be major differences in the item hierarchical structure among these items Despite these limitations there is an overall similarity of hierarchical structure and especially with the similarity oftest characteristic
MEASURING DiSABILITY 855
curves it is interesting to compare the distribution ofNHEFS and US RA samples further
The theoretical independence ofperson and item estimates was shown early by Rasch (Rasch 1980) for dichotomous items and its extension to estimating thresholds between categories within each item has already been described by Andrich and van Schoubroeck (Andrich amp van Schoubroeck 1989) Andrich and van Schoubroeck also point out that no assumptions need to be made about the distribution of~n in the population (Andrich amp van Schoubroeck 1989 p 474) As shown below the person distributions are dramatically different for the NHEFS and RA samples
Figure 5 shows the distribution ofpersons and items for the RA and NHEFS samples based on Likert scoring To see how sample
dependent the item calibrations are for the Likert scoring compare the distribution of item averages in Figure 5 where they are much more bunched together for the NHEFS sample than they are forthe RA sample The pattern ofitem calibrations for Rasch measurement is more similar across samples as seen in Figure 6 It is clear from both figures that the distribution ofdisability is different in RA patients than in the general population Both figures show that the NHEFS sample has a much higher percentage of persons at the lower end of the scale Both Likert and Rasch also show the reversed J shape for the NHEFS sample and a flatter distribution ofRA patients It would appear at least at first that both Likert scores and Rasch calibrations provide similar infonnation about the distribution ofdisability in these two populations Important differences become apparent when the moment statistics mean standard deviation skewness and kurtosis shown in Table 3 enhance the infonnation available from the graphical images
The means show a higher level ofdisability in the RA sample but the differences seem greater on the Rasch scale The Likert means appear closer 124 and 175 than the Rasch means -387 and-2l0 although they are both about one standard deviation apart in either metric The standard deviations seem to show a much greater spread on the Rasch scale but are similar for both the Likert scoring and Rasch measurement for the two samples While the means and standard deviations appear to
60
856 SHEEHAN et al
NHEFS
Itchores ariseochr
kuPCllh wlk2step
40
~ampoo dre sse I degrisebed
wash body
penjars20 ardoors
tmeat bathtub pound6 let aop
fa~ Is ~aCh5lb bttc p om 8tcar
0 10 13 16 19 22 25 28 31 34 37 40
Awrage Score
RA
-
12
--
8 r--- sse I - 0 shy
oCu meat I- shy~ oarscia Q clth8ku I- shy
00ram i Qute r4 I- shy
fa eels ~lk step0
liftc P 0 enja 5 tcho s shy0 0
ras body J ris chr r ach5 b 0
0 toil toari ~bed shop
0 o e nm i k ba htub r----
0
I I0 I 10 13 16 19 22 25 28 31 34 37 4
Average Score
Figure 5 Distribution ofLikert scores for persons and items based on 19 common items for NHEFS and RA samples Means = 124 and 175 standard deviations = 52 and 54 skewness = 295 and 75 and kurtosis = 922 and72
MEASURING DiSABILITY 857
be different they are at least consistent in describing the two samples The skewness indices reflect the asymmetry ofthe distributions
The NHEFS skewness index for the Likert scores is nearly twice as large as the index for Rasch measures 295 versus 139 A normal distribution has a skewness index ofzero and a positive index describes a long tail to the right The skewness indices for the RA sample show a reversal of signs 075 to -045 With skewness therefore consistency is lost and the information conveyed by Rasch is both contrary and contradictory to information conveyed by the Likert scores
The indices of kurtosis describing how peaked or flat the distributions are show almost a 5 fold difference between Likert and Rasch for the NHEFS sample 922 and 189 while the indices are close for the RA sample 60 for Rasch and 72 for Likert Since normal theory statistics assume there are excesses neither in skewness nor kurtosis it is clear that the distributional properties ofthe Rasch measures are superior to those ofLikert The Likert scores provide information about skewness and kurtosis that is contrary ifnot contradictory to the information provided by the Rasch analysis The fact that the correlation between Likert scores and Rasch measures is extremely high obviously does not mean the measures are equivalent it simply means that persons are in the same rank order on both scales Furthermore high correlations distract from the real need ofa meaningful metric against which progress can be measured
Finally it is noteworthy that the Rasch reliability estimates are consistently lower than reliabilities estimated from Likert scoring The Rasch reliability ofthe person measures estimated from 25 ADL items is 86 for non-extreme persons and drops to 62 when the 2094 extreme person measures are included The person measure reliability for the RA patients based upon 19 HAQ items is 90 and drops slightly to 88 when 41 extreme person measures are included The coefficient alpha estimate ofreliability for these same items when scored as a Likert scale is 94 In the Rasch analysis the HAQ has greater precision and less measurement error in assessing patients with arthritis than the ADL has in the general population and both have more measurement errorassociated with person measures than suggested by coefficient alpha from a Likert scale
858 SHEEHAN et al
10
0
8hampoo doilel
erisechr Jrisebed b3ucets gftcup
NHEFS
50
40
oopenjars
8utmeat
30 8penm ilk
8ardOOrS~ gash bodya
dresself20 o
~alk2step
6each51b ~noulcar
ampalhtub Jkupclth
-5310 -4202 -3094 -1966 -0676 0230 1336 2446 3554 4662 577
Measure
RA
- r----shy
rshy12
- diftcup
jYashbody
oopenjars6
cutmeat
JWPll h
~ isech
cJen ilk ~ressel ~noutcar
4 I-shy ach Ib ~ mpo Jaucets
~tchO es OW lk2st p oarisebed
lgtatht b
e0 8a~rhf--_rl~_l--__-r-~__--j o shy-6580 -5253 -3926 -2599 -1272 0055 1362 2709 4036 5363 66
Measure
Figure 6 Distribution ofRasch measures for NHEFS and RA samples and items Means = -3_87 and -210 standard deviations = 197 for both skewness =139 and -045 and kurtosis = 189 and 60
MEASURING DiSABILITY 859
Table 3 Summary statistics to describe distribution ofdisability in NHEFS and RA samples using Likert scores and Rasch measures Means Standard Deviation Skewshyness (measure of symmetry and equals 00 for normal distribution tail to the right for posivite value and left for negative value) and Kurtosis (measure of peakness equals 00 for normal distribution)
Scale Sample Mean SD Skewness Kurtosis
Likert NHEFS 124 052 295 922
RA 175 054 075 072
Rasch NHEFS -387 197 139 189
RA -210 197 -045 OliO
CONCLUSIONS
Improved precision in the methods ofmeasuring disability is essential to disability research Thurstone set out the fundamentals ofmeasurement in the 1920s (Wright 1997) and described the universal characteristics of all measurement Measurements must be unidimensional and describe only one attribute of what is measured The Rasch model assumes a single dimension underlying the test items and provides measures offit so that the unidimensionality assumption can be examined Measurements must be linear because the act ofmeasuring assumes a linear continuum as for example length height weight price or volume The Rasch analysis
860 SHEEHAN et al
reveals the non-linear nature ofLikert scores Measurements must also be invariant and use a repeatable metric all along the measurement continuum the essence ofan interval scale The Rasch analysis reveals the lack ofa repeatable metric for Likert scores
While all ADL items showed adequate fit to the Rasch model and hence the unidimensionality requirement has been met further study may show that the single construct ofdisability may have more than one measurable feature In fact some HAQ users combine items into up to 8 subscales (Tennant Hillman Fear Pickering amp Chamberlain 1996) and report similarity in overall measures using either subscales or measures based on all ofthe items They also report large logit differences among items within a subscale Daltroy et al (Daltroy et aI 1992) grouped items into six subscales in search ofa sequential functional loss scale Their aim was to develop a Guttman scale offunction in the elderly They reported that 83 ofnon-arthritic subjects fit their scale compared to 65 ofarthritic subj ects Their Rasch analysis indicated that lifting a cup to the mouth did not fit the Guttman scale pattern In the Daltroy study getting in and out ofa car was grouped with doing chores and running errands as the most difficult subscale In the current study getting in and out ofa car was easier for US RA patients with a rank of 4th easiest compared to lifting a cup which was 5th bull Itwas also 4th easiest for British RA patients and 11 th easiest for the NHEFS sample The current study along with these findings maysignal cautions conceptualizing disability as a singleinvariant sequence orhierarchy The Rasch assumption ofunidimentionality seems intact and we have conducted confirmatory factor analysis using methods suitable for ordinal items and found that a single factor model adequately fit the ADL data Nonetheless the nature ofdisability may well vary within and between groups that even share the same diagnosis such as RA Such variation may be seen in the item calibrations for lifting a cup
The Rasch analysis also demonstrates that theADL based measures ofdisability provide a poor measurementtool for nearly halfofthe NHEFS sample who were entirely disability free during the 1982 to 1984 followshyup Certainly the fit between items and persons is better in a population with more disability such as RA patients However even for RA patients
MEASURING DiSABILITY 861
the estimate ofreliability for the Likert scale is inflated over that provided by the Rasch analysis and the infonnation provided by the Likert analysis about the distribution ofdisability in either the general population or among RA patients is different from and contradictory to the infonnation provided by the Rasch analysis
ACKNOWLEDGEMENTS
Supported in part by grants from the Arthritis Foundation and the Claude Pepper Older Americans Independence Center We thank Dr Alan Tennant from the University ofLeeds for his prompt response to our request for HAQ item data for RA patients from the UK
REFERENCES
Andrich D (1978) A rating fonnulation for ordered response categoshyries Psychometrika 43(4)561-573
Andrich D (1988) Rasch Models for Measurement Newbury Park CA Sage Publications Inc
Andrich D amp van Schoubroeck L (1989) The General Health Quesshytionnaire a psychometric analysis using latent trait theory PsycholMed 19(2)469-85
862 SHEEHAN et al
Daltroy L H Logigian M Iversen M D amp Liang M H (1992) Does musculoskeletal fimction deteriorate in a predictable sequence in the elderly Arthritis Care Res 5(3) 146-50
Fries1 F Spitz P Kraines R G amp Holman H R (1980) Measureshyment ofpatient outcome in arthritis Arthritis andRheumatism 23(2) 137-145
Guttman L (1950) The basis for scalogram analysis In Stouffer (Ed) Measurement and Prediction (Vol 4 pp 60-90) Princeton NJ Princeton University Press
Hubert H B Bloch D A amp Fries J F (1993) Risk factors for physishycal disability in an aging cohort the NHANES I Epidemiologic Followup Study [published erratum appears in J Rheumatol1994 Jan21 (1) 177] J Rheumatol 20(3) 480-8
Katz S Downs T D Cash H R amp Grotz R C (1970) Progress in development ofthe index ofADL Gerontologist 10(1)20-30
Lazaridis E N Rudberg M A Furner S E amp Casse C K (1994) Do activities ofdaily living have a hierarchical structure An analysis using the longitudinal study ofaging Journal ofGerontology 49(2 M47-M51) M47-M51
Linacre1 M amp Wright B D (1998a) A Users Guide to Bigsteps Winsteps Rasch-Model Computer Program Chicago MESA Press
Linacre 1 M amp Wright B D (1998b) Winsteps Chicago MESA Press
Merbitz C Morris 1 amp Grip 1 C (1989) Ordinal scales and foundashytions ofmisinference [see comments] Arch Phys Med Rehabil 70(4) 308-12
Miller H W (1973) Plan and operation ofthe Health and Nutrition Examination Survey United States- 1971-1973 Vital and Health Statistics Series 1(1 Oa) 1-42
Rasch G (1980) Probabilistic Models for Some Intelligence andAtshytainment Tests Chicago MESA Press
Reisine S amp Fifield 1 (1992) Expanding the definition ofdisability implications for planning policy and research Milbank Memorial
MEASURING DiSABILITY 863
Quarterly 70(3)491-509
Reisine S Fifield 1 amp Winkelman D K (2000) Characteristics of rheumatoid arthritis patients who participates in long-term research and who drops out Arthritis Care Res 13(1) 3-10
SAS Institute (1989) SAS (Version 60) Cary NC SAS Institute Inc
Sonn U (1996) Longitudinal studies ofdependence in daily life activities among elderly persons Scandinavian Journal of Rehabilitation Medicine S342-28
SPSS (1997) SPSS (Version 80) Chicago SPSS
SSI (1998) PRELIS (Version 220) Lincolnwood IL Scientific Softshyware International
Tennant A Hillman M Fear 1 Pickering A amp Chamberlain M A (1996) Are we making the most ofthe Stanford Health Assessment Questionnaire British Journal ofRheumatology 35574-578
Thorndike E L (1904) An Introduction to the Theory ofMental and Social Measurements New York Teachers College
Whalley D Griffiths B amp Tennant A (1997) The Stanford Health Assessment Questiom1aire a comparison ofdifferential item functionshying and responsiveness in the 8- and 20 item scoring systems Brit J Rheum 36(Supple 1) 148
Wright B (1997) A history ofsocial science measurement MESA Memo 62 Available httpMESAspcuchicagoedulmemo62htm [1998 Oct 29 1998]
Wright B D amp Linacre 1 M (1989) Observations are always ordinal measurements however must be interval Archives ofPhysical Medishycine and Rehabilitation 70857-867
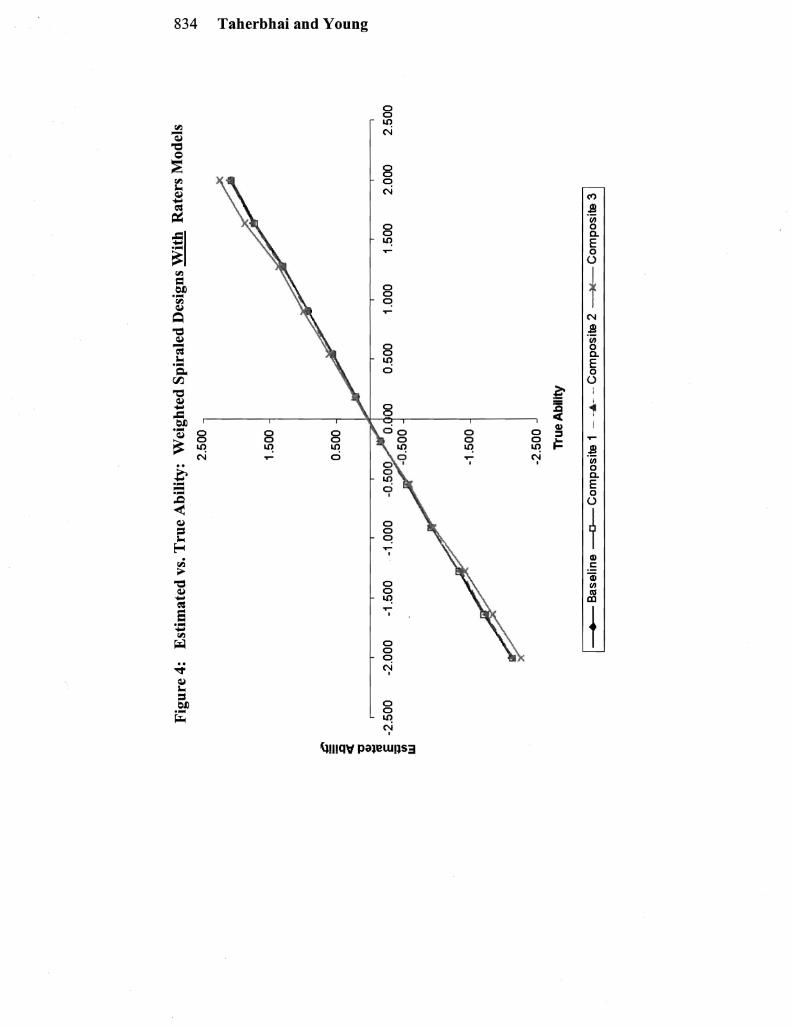
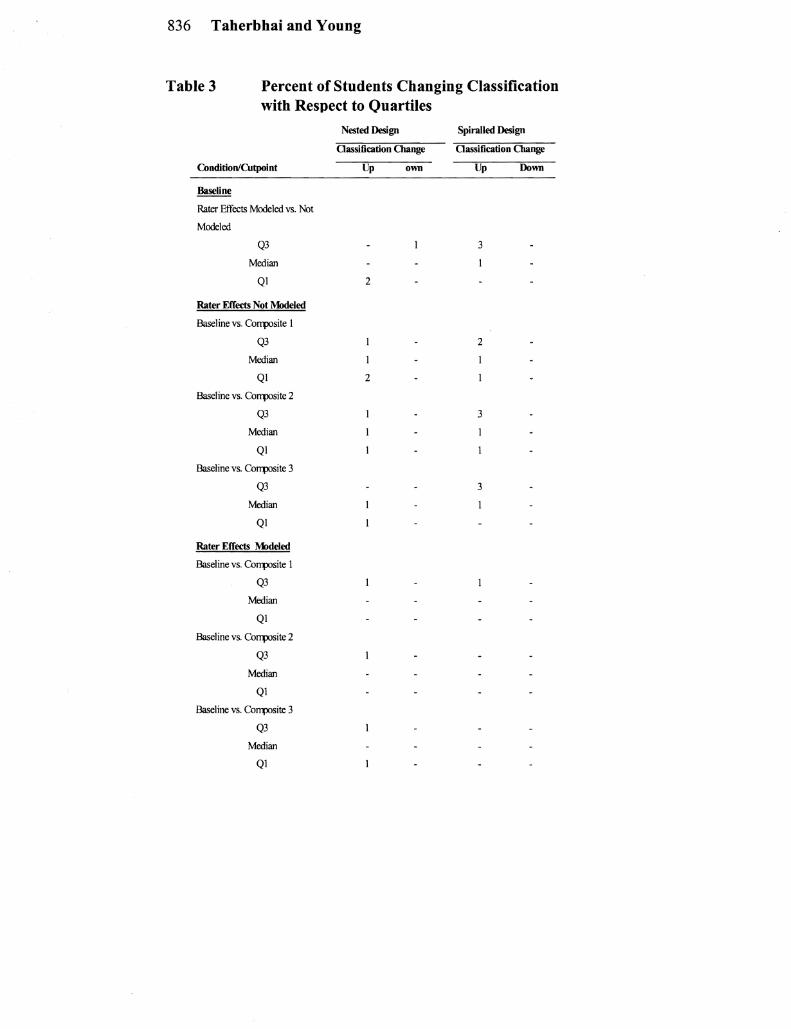
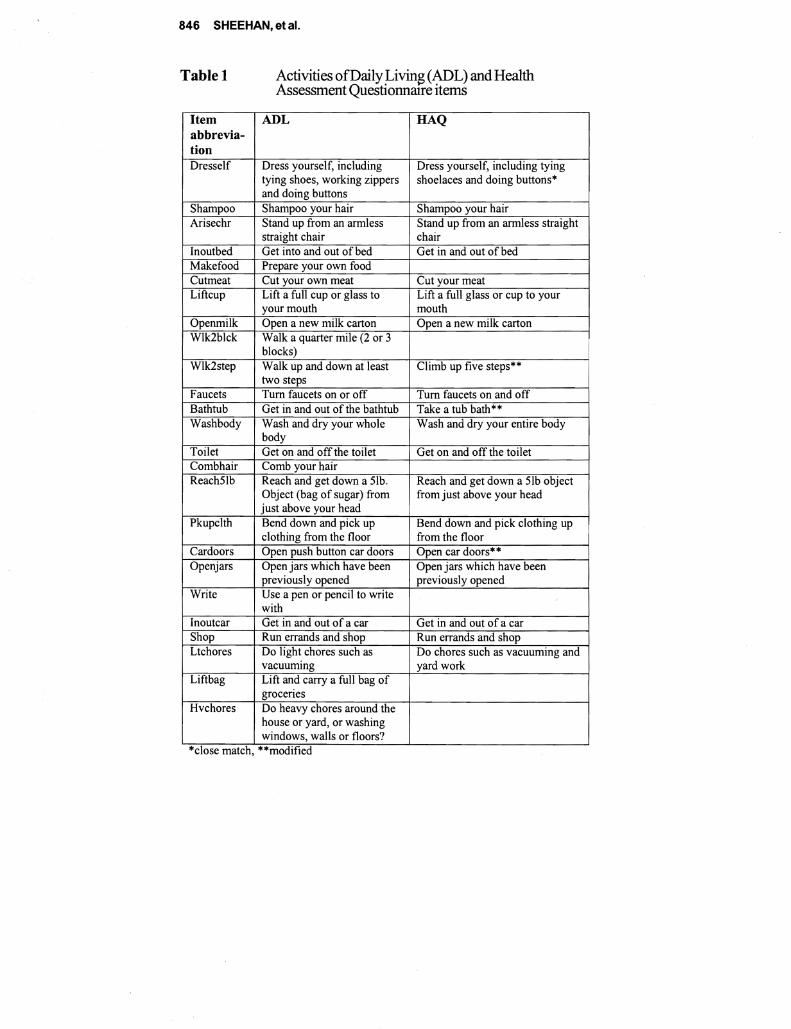
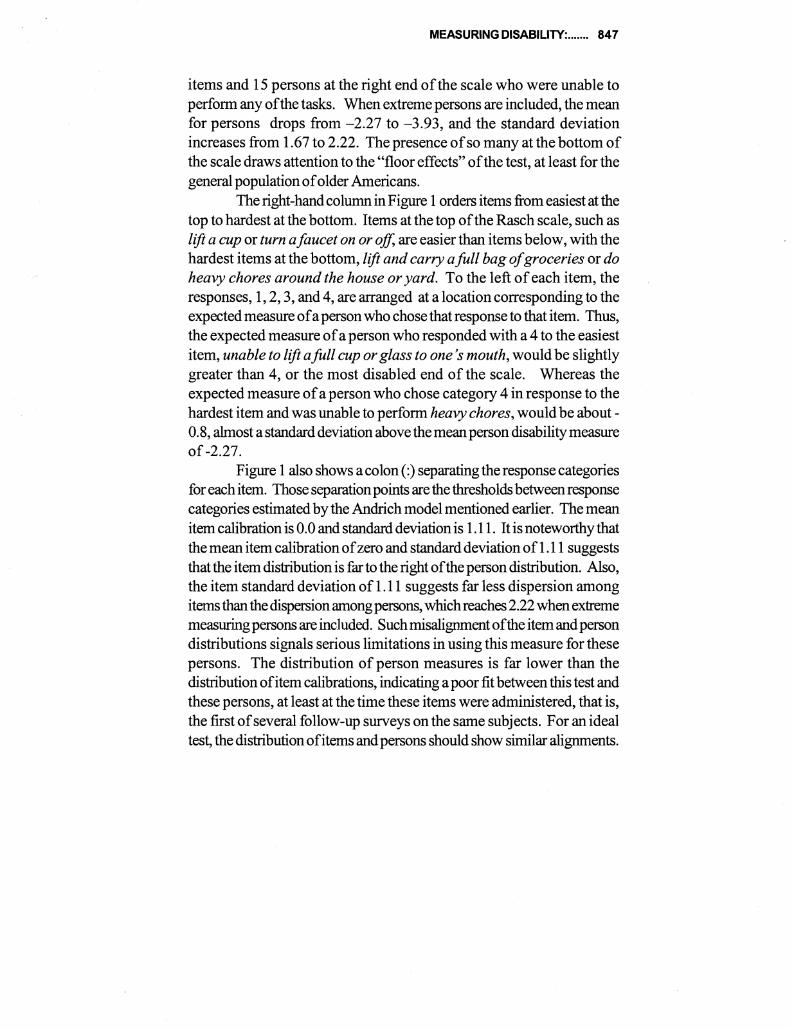
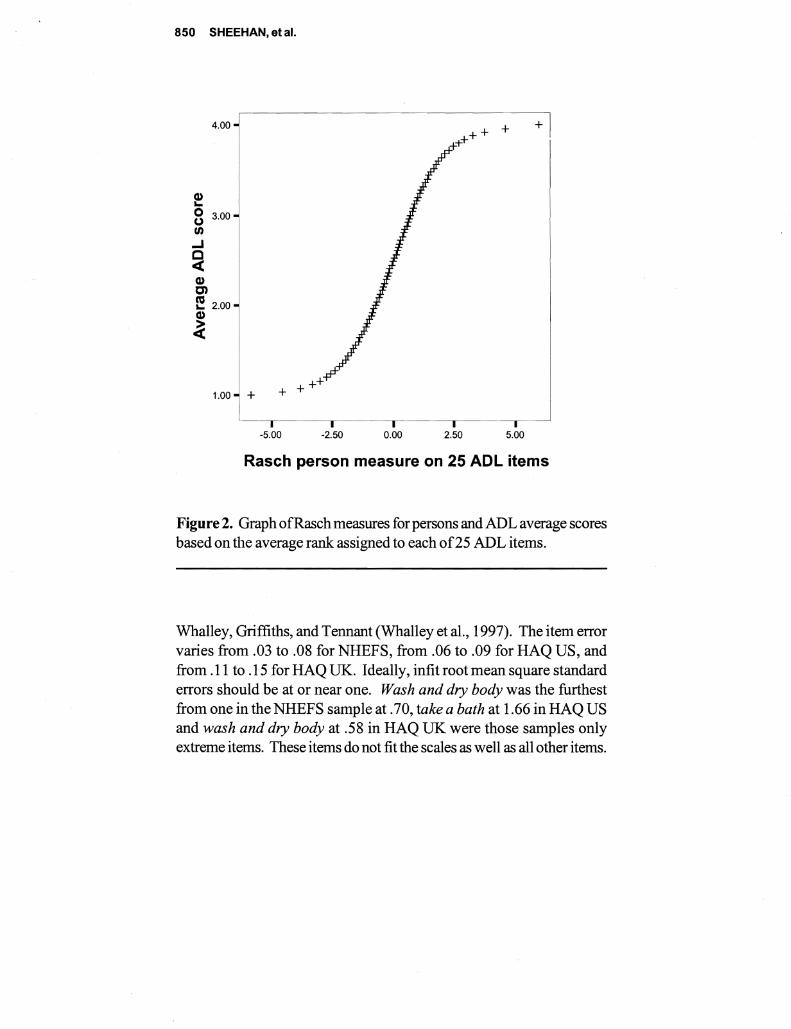
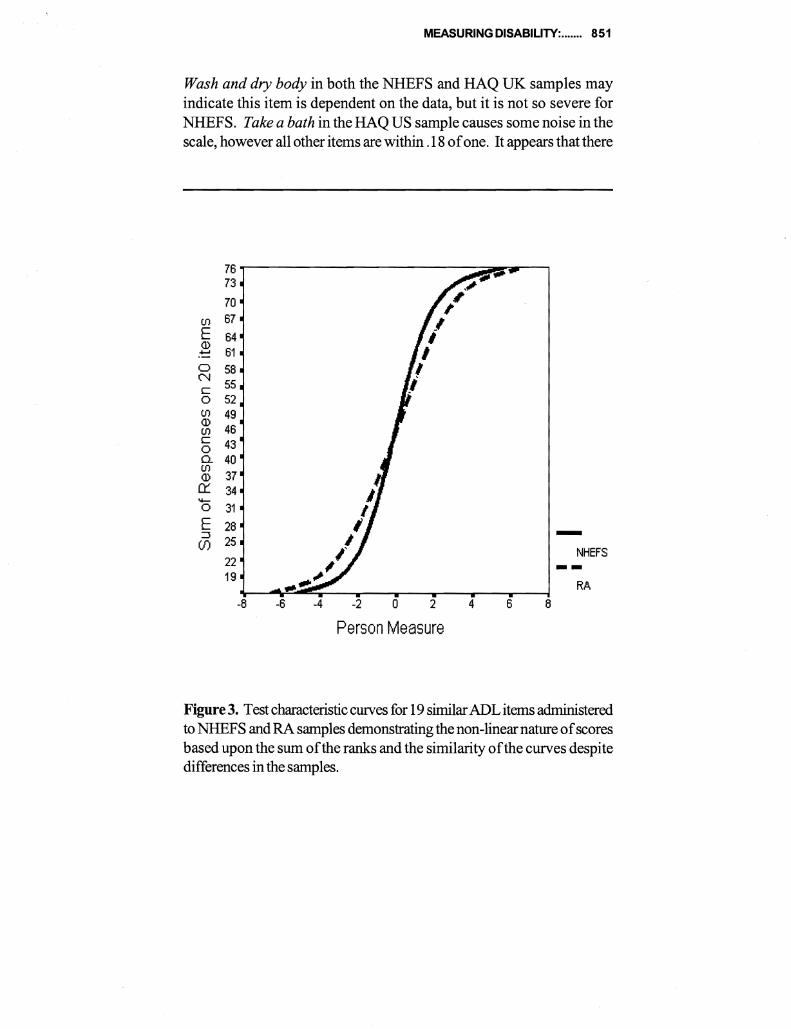
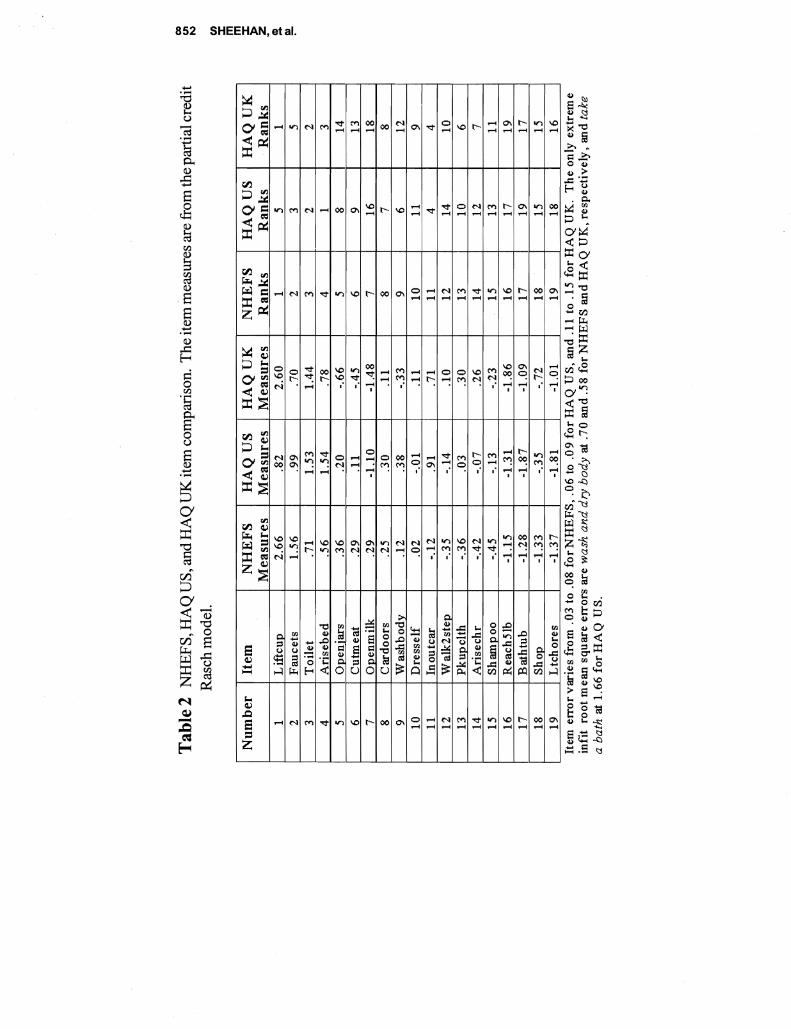
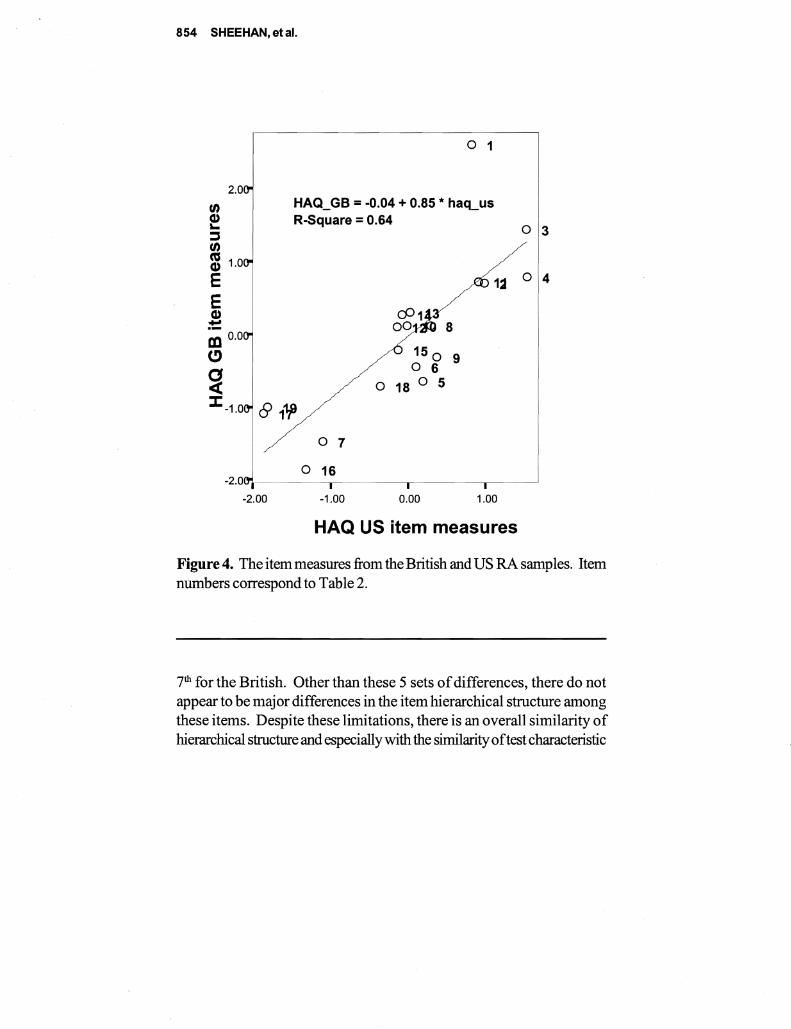
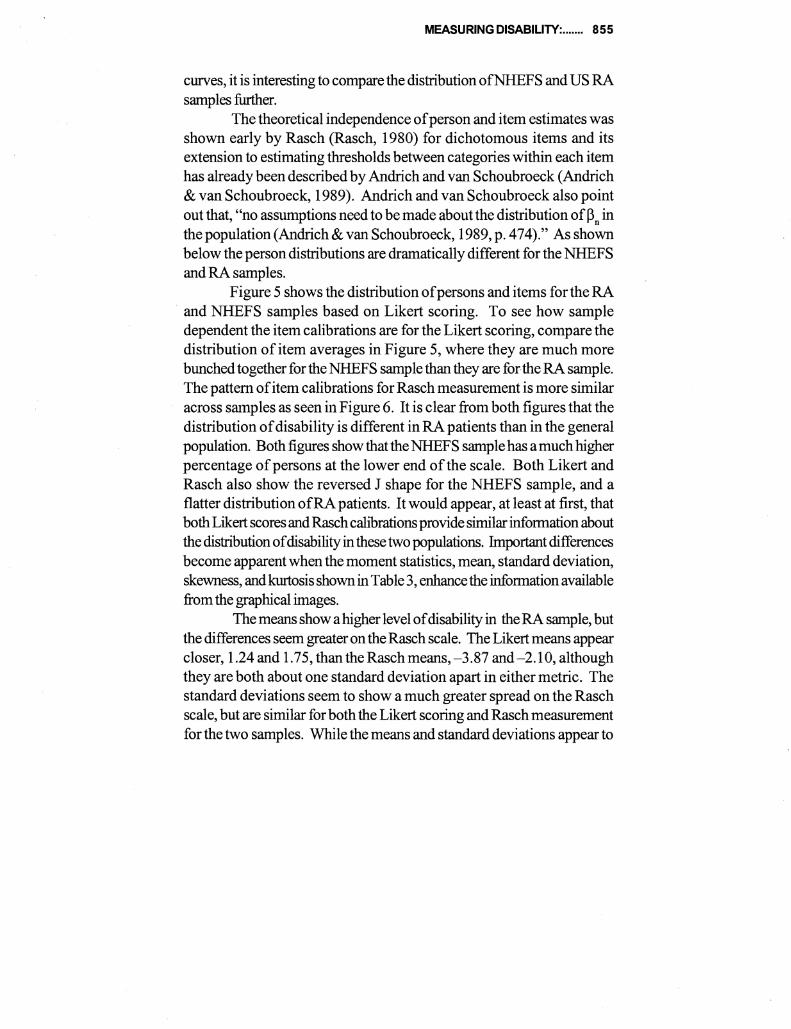
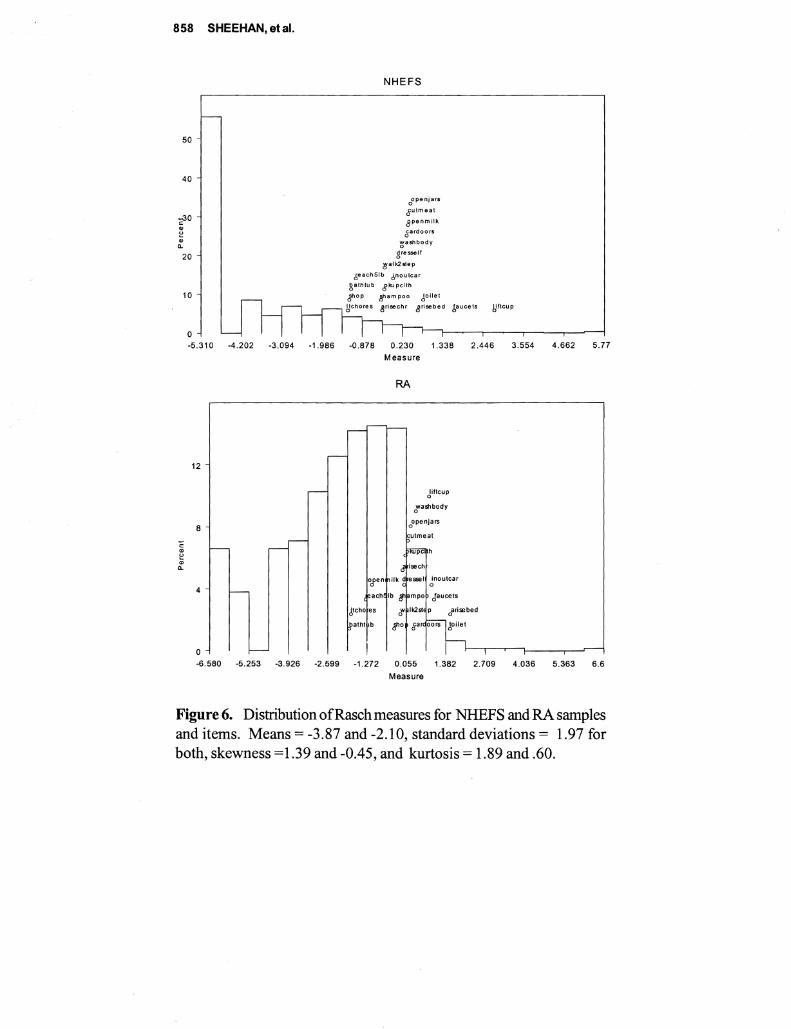
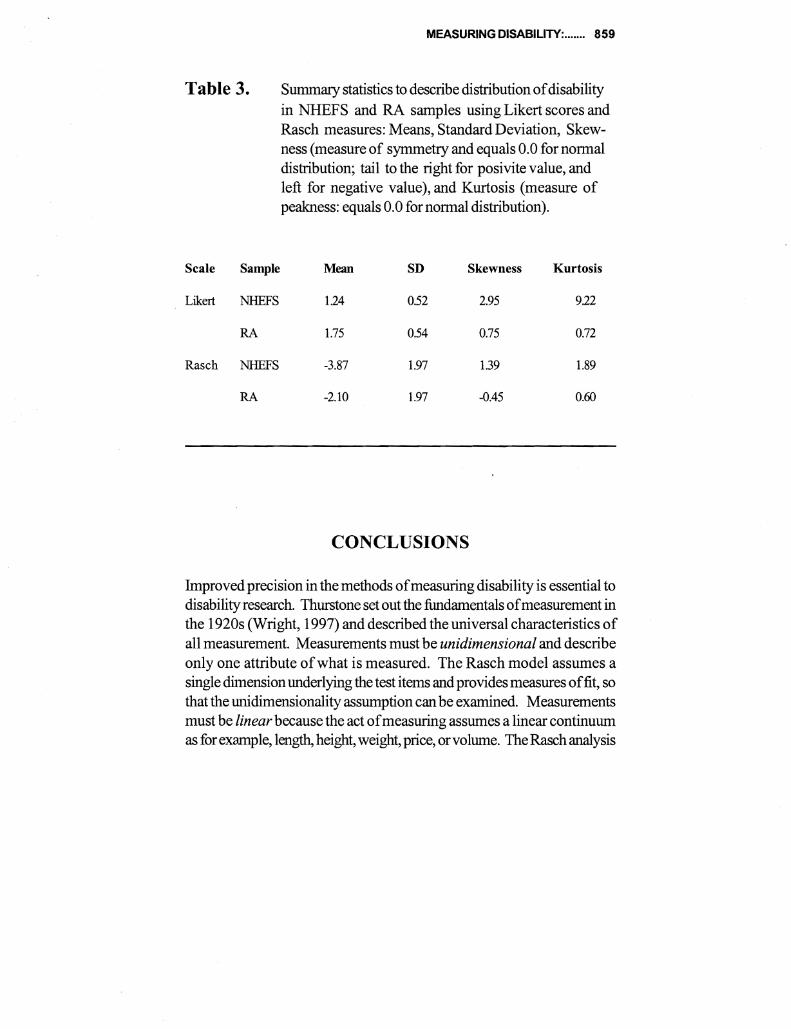
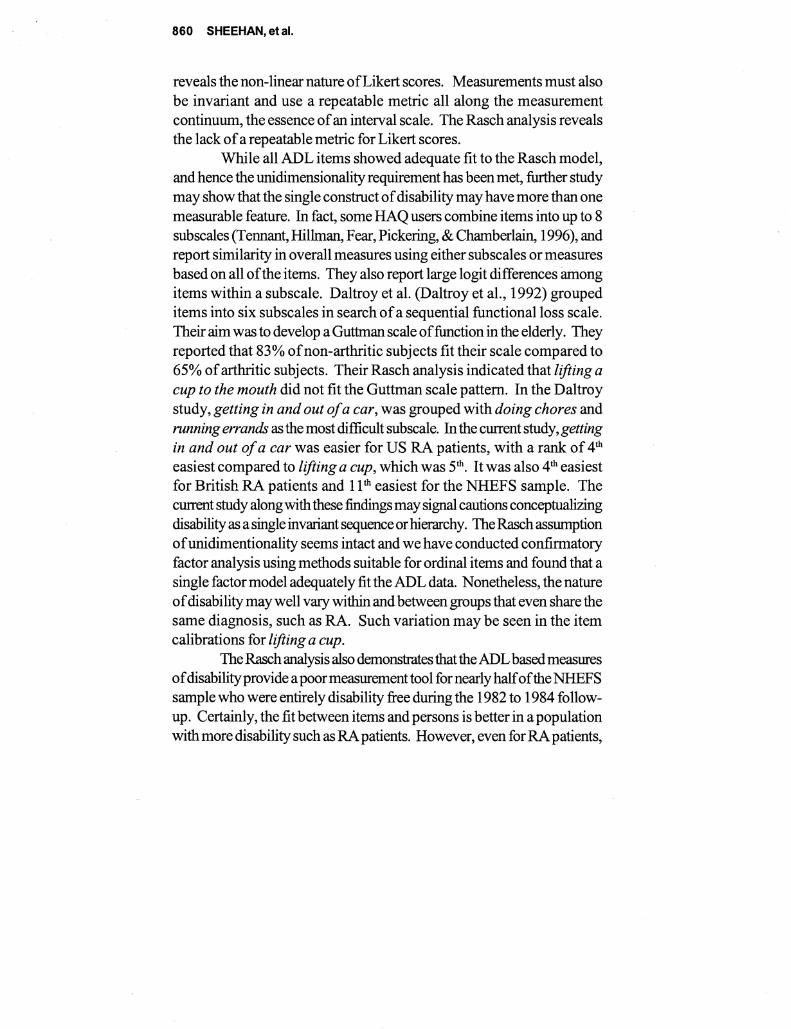
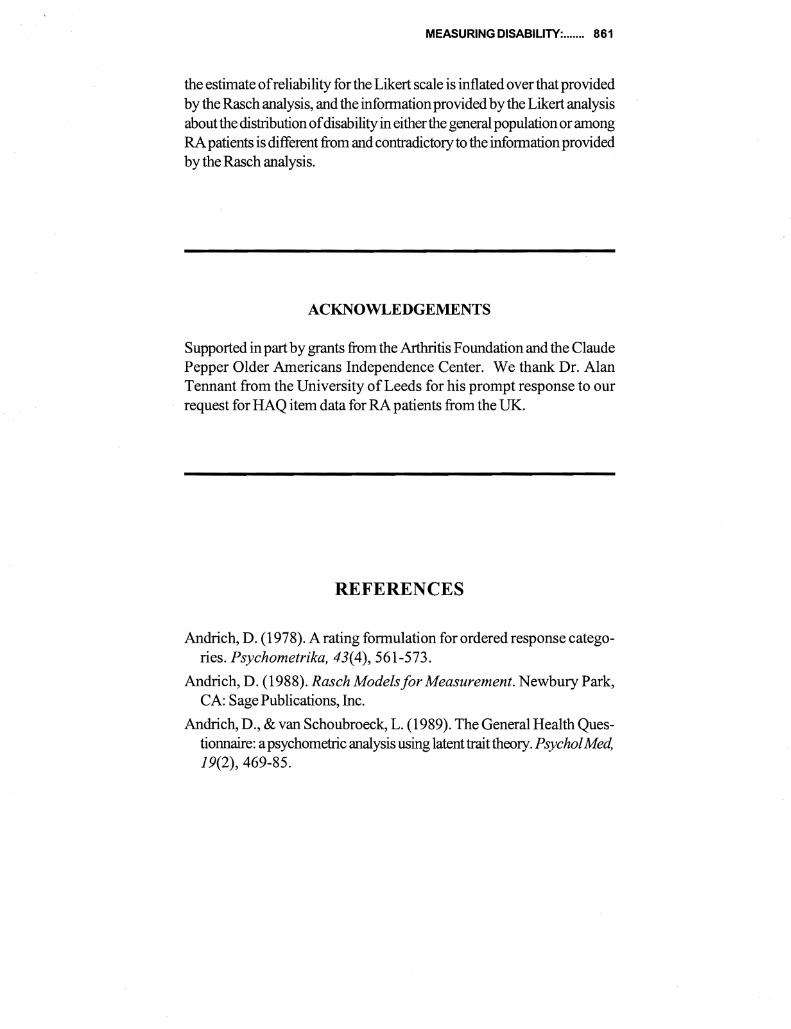