third quarter 2007 results presentation
TRANSCRIPT

Coca-Cola West Holdings(2579)
October 30, 2007
Third Quarter 2007
Results Presentation
Contact PR・IR GroupTEL 81-(0)92-283-5718 FAX +81-(0)92-283-5729
URL http://www.ccwh.co.jp/english/ E-mail [email protected]
1
Ⅰ.3Q Results
Ⅱ.9 months results
Ⅲ.4Q Business Plan
Ⅳ.Initiatives for the next generation[Reference]
Sales volume by packages
Results by brand and channel
Overview of group companies
Performance trend
Coca-Cola West Group Structure
Our group companies-principal business
Coca-Cola system in Japan
Glossary
Contents

2
Summary
Ⅰ.Ⅰ.33Q results(from July to September)Q results(from July to September)
① ①Sales volume: The third consecutive quarter of sales volume growSales volume: The third consecutive quarter of sales volume growth.th.
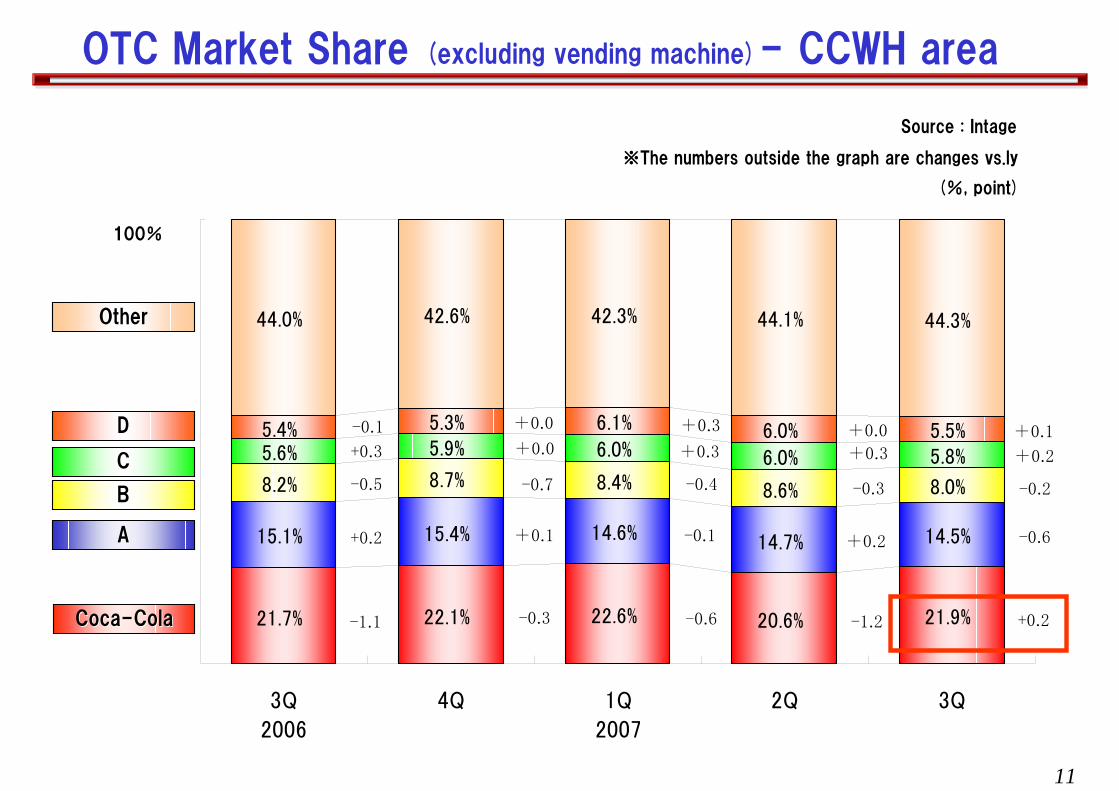
OTC share increased 0.2 percentOTC share increased 0.2 percent
② ②Financial resultsFinancial results: Total revenues increased 1%, operating income increased 29%,: Total revenues increased 1%, operating income increased 29%,
recurring income increased 31%, net income increased 33%recurring income increased 31%, net income increased 33%
Ⅱ.Ⅱ.4Q business plan(from October to December) 4Q business plan(from October to December)
① ①Sales volume: +1.7%Sales volume: +1.7%
② ②Strengthen the marketing activities of hot drinksStrengthen the marketing activities of hot drinks
③③Launch the high quality green tea Launch the high quality green tea ‘‘AyatakaAyataka’’
Ⅲ.Ⅲ.Initiatives for the next generationInitiatives for the next generation
① ①We have started two projects toward the world leading bottlerWe have started two projects toward the world leading bottler
・ ・Marketing next generation model projectMarketing next generation model project
・ ・Vending next generation model projectVending next generation model project
3
ⅠⅠ. 3. 3Q results(3 months)Q results(3 months)

4
3Q Highlight(from July to September)-Sales volume
((thousand cases except %thousand cases except %))
20063Q
actual change % change %
53,663 55,847 55,413 -433 -0.8 +1,750 +3.3
2007 3Qvs. plan vs. last year
plan actual
<Sales Volume by quarter (vs. last year)>
+3.3+2.3
-4.0
+1.3 +1.7
-5
0
5
3Q
2006
4Q 1Q
2007
2Q 3Q
(%)

5
3Q Highlight -Brand
Actual sales volume by brandActual sales volume by brand ReviewReview
change % change %
Coca-Cola 5,813 +572 +10.9 +1,152 +24.7
Georgia 9,616 -840 -8.0 -365 -3.7
Soukenbicha 5,388 +213 +4.1 +437 +8.8
Aquarius 8,275 -72 -0.9 -51 -0.6
Priority 4,757 +615 +14.8 +1,542 +48.0
Complement 7,324 -761 -9.4 -1,106 -13.1
Other 14,240 -160 -1.1 +141 +1.0
55,413 -433 -0.8 +1,750 +3.3
Core
Total
3Q 2007
actualvs. plan vs. last year
*Priority brand : Sprite, Karada Meguricha, Mineral Water,
Minute Maid
*Complement brand : Hajime, Fanta, Qoo, Koucha Kaden,
Canada Dry, Hung Oolong Tea
((thousand cases except %thousand cases except %)) <Core Brand>
■Coca-Cola TM・ The forth consecutive quarter of sales volume growth(3Q: +24.7%) -Continued success of Coca-Cola Zero
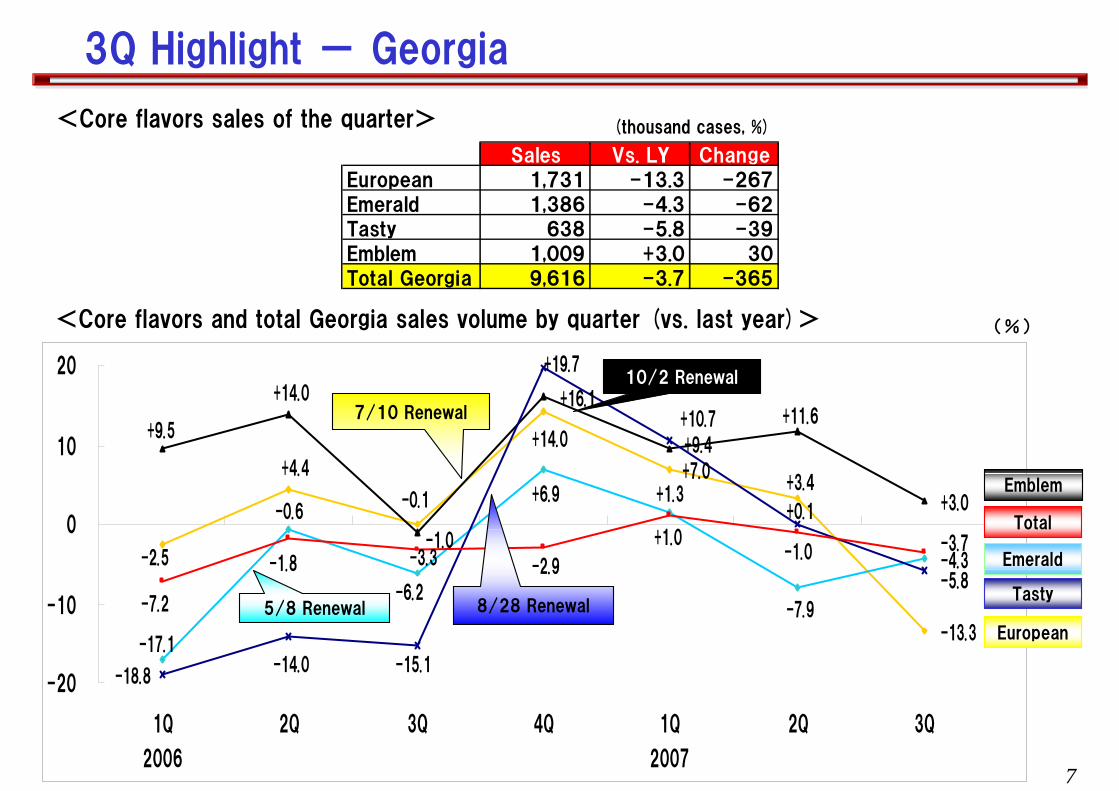
■Georgia・Declined 3.7%, reflecting softness in the category due to prolonged warm weather・Reaction of renewals(Emerald, Tasty, European)
■Soukenbicha・High single digit growth due to success of seasonable flavors (3Q: +8.8%)
■Aquarius・Declined 0.6% as a reaction of launching new product, Free Style, last year.
<Priority Brand>・Mineral Water increased 56.0%
・Minute Maid increased 39.8%

6※compare to Diet Coca-Cola
100.0
22.2
10.7
67.1
Component(%)
Age25+, ManAge25+, Man
Age25+, FemaleAge25+, Female
Age16Age16--24, M/F24, M/F
Target
+24.7
-
-14.6
+5.1
Vs. last year(%)
1,780
397
203
1,180
Volume(thousand C/S)
RedRed ((Coca-Cola)
Silver(Silver(NoNo--Calorie CocaCalorie Coca--ColaCola))
0000000000000000
Coca-Cola TM
Black(Black(Coca-Cola Zero)
(%)
+3.4+2.3
-12.5
+13.1 +24.7
-15
-5
5
15
25
3Q
2006
4Q 1Q
2007
2Q 3Q
CocaCoca--Cola TMCola TMNoNo--Calorie CocaCalorie Coca--ColaCola
4/2 launched4/2 launched
CocaCoca--Cola ZeroCola Zero6/4 launched6/4 launched
3Q Highlight - Coca-Cola
<Sales Volume by quarter (vs. last year)>
<Ref. Sales Volume of the quarter>
※
7
構成比(%) Sales Vs. LY Change
European 1,731 -13.3 -267
Emerald 1,386 -4.3 -62
Tasty 638 -5.8 -39
Emblem 1,009 +3.0 30
Total Georgia 9,616 -3.7 -365
<Core flavors sales of the quarter> (thousand cases, %)
-13.3
-4.3
+16.1
+3.0+3.4
+7.0
-0.1
+4.4
-2.5
+14.0
-7.9
+1.3-0.6
-6.2
+6.9
-17.1
+11.6
+9.4
+14.0
-1.0
+9.5
-5.8
-15.1
+0.1
+10.7
+19.7
-14.0-18.8
-3.7-2.9
+1.0-3.3 -1.0
-7.2
-1.8
-20
-10
0
10
20
1Q
2006
2Q 3Q 4Q 1Q
2007
2Q 3Q
(%)
Tasty
Emblem
European
Emerald
Total
7/10 Renewal
5/8 Renewal
10/2 Renewal
8/28 Renewal
3Q Highlight - Georgia
<Core flavors and total Georgia sales volume by quarter (vs. last year)>
8
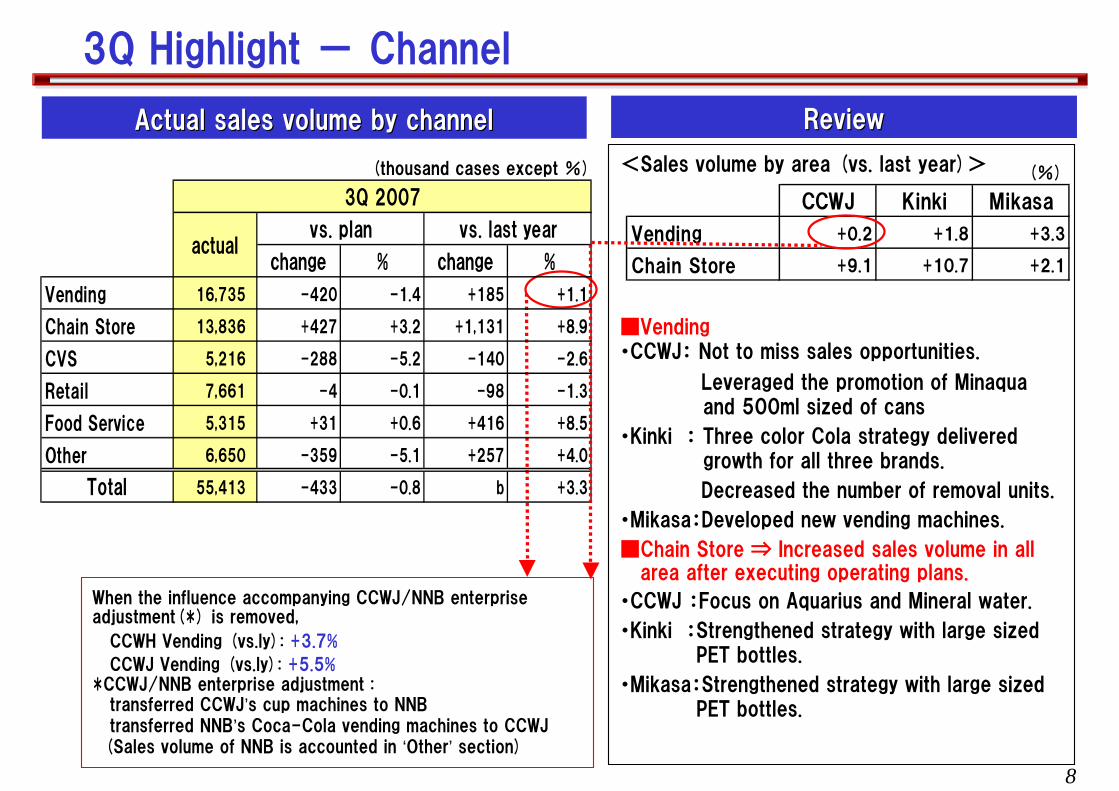
<Sales volume by area (vs. last year)>
■Vending・CCWJ: Not to miss sales opportunities.
Leveraged the promotion of Minaqua and 500ml sized of cans
・Kinki : Three color Cola strategy delivered growth for all three brands.
Decreased the number of removal units.
・Mikasa:Developed new vending machines.
■Chain Store ⇒ Increased sales volume in all area after executing operating plans.
・CCWJ :Focus on Aquarius and Mineral water.
・Kinki :Strengthened strategy with large sized PET bottles.
・Mikasa:Strengthened strategy with large sized PET bottles.
change % change %
Vending 16,735 -420 -1.4 +185 +1.1
Chain Store 13,836 +427 +3.2 +1,131 +8.9
CVS 5,216 -288 -5.2 -140 -2.6
Retail 7,661 -4 -0.1 -98 -1.3
Food Service 5,315 +31 +0.6 +416 +8.5
Other 6,650 -359 -5.1 +257 +4.0
Total 55,413 -433 -0.8 b +3.3
vs. last yearvs. planactual
3Q 2007
Actual sales volume by channelActual sales volume by channel ReviewReview
3Q Highlight - Channel
When the influence accompanying CCWJ/NNB enterprise adjustment(*) is removed,
CCWH Vending (vs.ly): +3.7%
CCWJ Vending (vs.ly): +5.5%*CCWJ/NNB enterprise adjustment :
transferred CCWJ’s cup machines to NNBtransferred NNB’s Coca-Cola vending machines to CCWJ
(Sales volume of NNB is accounted in ‘Other’ section)
(thousand cases except %)
CCWJ Kinki Mikasa
Vending +0.2 +1.8 +3.3
Chain Store +9.1 +10.7 +2.1
(%)

9
+0.7
-0.7-2.1
-7.7
+2.4 +1.2
+2.2 +1.7
+0.6-0.1
+1.4+2.4
+0.6
+0.2-0.5
-10
-5
0
5
3Q2006
4Q 1Q2007
2Q 3Q
<VPM by area (vs. last year)> ※VPM…Volume Per Machine
3Q Highlight - Vending
CCWJ
Kinki
Mikasa
(%)

10
<Sales volume by packages(Vs. last year>
Gross profit +4.7 +4.3 +0.0CCWJ Kinki Mikasa
Vs. last year
(%)
※( ): Vs. last year
<Gross profit(Vs. last year) >
305 318
20 17
232 233
651 675
261 255
32 35
1,009 1,19056 43741
855
2,6373,002
705
598120
143
1,127 1,265
72 46
964 990
2,7163,119
910
883148
169
Can
2.0LPET
-500ml PET
1.5LPET
1.0LPET
Other
CCWJCCWJ KinkiKinki MikasaMikasa
(+12.3%)
(+14.8%)
(+17.9%)
(+13.8%)
(+4.2%)
(+3.8%)
2006 200620062007 2007 2007
5,935
6,473
5,268
5,830 1,502 1,533
(thousand cases)
3Q Highlight - Chain Store
11
21.7% 22.1% 22.6% 20.6% 21.9%
15.1% 15.4% 14.6% 14.7% 14.5%
8.2% 8.7% 8.4% 8.6% 8.0%
5.6% 5.9% 6.0% 6.0% 5.8%5.4% 5.3% 6.1% 6.0% 5.5%
44.0% 42.6% 42.3% 44.1% 44.3%
3Q2006
4Q 1Q2007
2Q 3Q
100%
-0.1
+0.3
-0.4
-0.6
+0.3
+0.1
+0.0
-0.7
-0.3
+0.0
+0.2
-0.1
-0.5
-1.1
+0.3
+0.2
+0.0
-0.3
-1.2
+0.3
-0.6
+0.1
-0.2
+0.2
+0.2
OTC Market Share (excluding vending machine)- CCWH area
※The numbers outside the graph are changes vs.ly
Source : Intage
(%, point)
CocaCoca--ColaCola
OtherOther
DD
CC
BB
AA

12
plan actual※ change % change %
Revenues 116,497 118,000 117,653 -346 -0.3 1,156 1.0Cost of goods sold 67,272 68,100 68,111 11 0.0 839 1.2
Gross profit 49,225 49,900 49,541 -358 -0.7 316 0.6SG&A 43,520 43,400 42,181 -1,218 -2.8 -1,339 -3.1
Operating income 5,704 6,500 7,360 860 13.2 1,656 29.0Non-operating income 476 600 628 28 4.7 151 31.8
Non-operating expenses 272 200 230 30 15.4 -41 -15.2Recurring income 5,909 6,900 7,758 858 12.4 1,849 31.3
Extraodinary income 28 - - - - -28 -Extraodinary losses 542 200 185 -14 -7.3 -356 -65.8
Income beforeincome taxes,
minority interests5,395 6,700 7,572 872 13.0 2,177 40.3
Income taxes 1,936 2,594 2,965 371 14.3 1,029 53.2Minority interests 4 6 5 0 -13.3 0 19.0
Net income 3,455 4,100 4,602 502 12.3 1,147 33.2
20063Q
actualvs. plan vs. last year
2007 3Q
actualchange %
Operating Income 5,704 6,850 1,145 20.1Recurring Income 5,909 7,247 1,338 22.7
20063Q
acutalVs. last year
2007 3Q
Impact onImpact onMK CCBCMK CCBC::
+199 million+199 millionyenyen
Impact on review of depreciation method: +510 million yenImpact on review of depreciation method: +510 million yen
<Ref. : In case of not reviewing of depreciation method>
※The above plan is based on the performance forecast announced as of August 9, 2007.
(million yen except %)
3Q Highlights - Consolidated P/L

13
Increase sales volume +0.6
+0.1
-1.0
49.5
49.92007 3Q gross profit plan
2007 3Q gross profit actual
Other
Decrease of sales mix
Decrease in profit from toll fee -0.1
(million yen)Revenues COGS Gross profit
CCWJ Sales volume(+417,000C/S) 815 442 373Sales mix -689 -124 -565
Subtotal 126 318 -192Kinki Sales volume(+269,000C/S) 491 223 268
Sales mix -632 -241 -391Subtotal -141 -18 -123
Mikasa Sales volume(-9,000C/S) -15 -9 -6Sales mix -110 -21 -89
Subtotal -125 -30 -95Profit from toll fee -72 9 -81Impact on other group companies -185 -210 25Other 51 -58 109
Total -346 11 -358
3Q Gross Profit Change Factors (vs. plan)(billion yen)

14
2007 3Q operating income plan
2007 3Q operating income actual
Decrease of advertising cost
Decrease of sales commission
Decrease of depreciation cost
Decrease of gross profit
6.5
-0.4
+0.8
+0.3
+0.1
7.3
(billion yen)
3Q Operating Income Change Factors (vs. plan)

15
2006 3Q gross profit
Decrease in profit from toll fee
2007 3Q gross profit
Increase from other group companies
Other
Decrease of sales mix
Increase sales volume
49.2
+1.4
+0.1
+0.1
-1.0
-0.3
49.5
(million yen)Revenues COGS Gross profit
CCWJ Sales volume(+952,000C/S) 1,881 1,030 851Sales mix -1,214 -563 -651
Subtotal 667 467 200Kinki Sales volume(+793,000C/S) 1,358 768 590
Sales mix -865 -524 -341Subtotal 493 244 249
Mikasa Sales volume(+6,000C/S) 10 6 4Sales mix -107 -93 -14
Subtotal -97 -87 -10Profit from toll fee -24 296 -320Other group companies 117 48 69Other - -129 129
Total 1,156 839 316
3Q Gross Profit Change Factors (vs. last year)(billion yen)

16
2006 3Q operating income
Other
2007 3Q operating income
Review of depreciation method
Decrease of depreciation cost
Decrease of sales equipment cost
Increase gross profit
5.7
+0.3
+0.5
+0.3
+0.2
+0.3
7.3
3Q Operating Income Change Factors (vs. last year)
(billion yen)

17
ⅡⅡ. . 9 9 months resultsmonths results
18
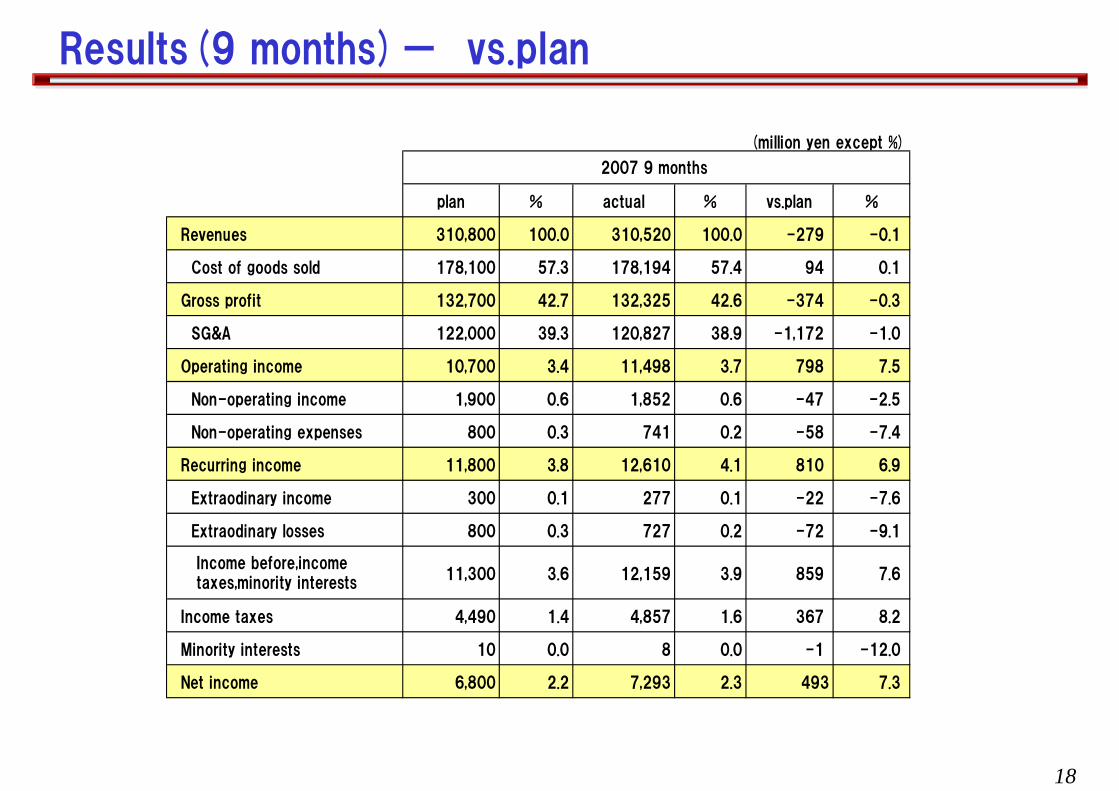
Results(9 months)- vs.plan
(million yen except %)
plan % actual % vs.plan %
Revenues 310,800 100.0 310,520 100.0 -279 -0.1
Cost of goods sold 178,100 57.3 178,194 57.4 94 0.1
Gross profit 132,700 42.7 132,325 42.6 -374 -0.3
SG&A 122,000 39.3 120,827 38.9 -1,172 -1.0
Operating income 10,700 3.4 11,498 3.7 798 7.5
Non-operating income 1,900 0.6 1,852 0.6 -47 -2.5
Non-operating expenses 800 0.3 741 0.2 -58 -7.4
Recurring income 11,800 3.8 12,610 4.1 810 6.9
Extraodinary income 300 0.1 277 0.1 -22 -7.6
Extraodinary losses 800 0.3 727 0.2 -72 -9.1
11,300 3.6 12,159 3.9 859 7.6
Income taxes 4,490 1.4 4,857 1.6 367 8.2
Minority interests 10 0.0 8 0.0 -1 -12.0
Net income 6,800 2.2 7,293 2.3 493 7.3
Income before,incometaxes,minority interests
2007 9 months
19
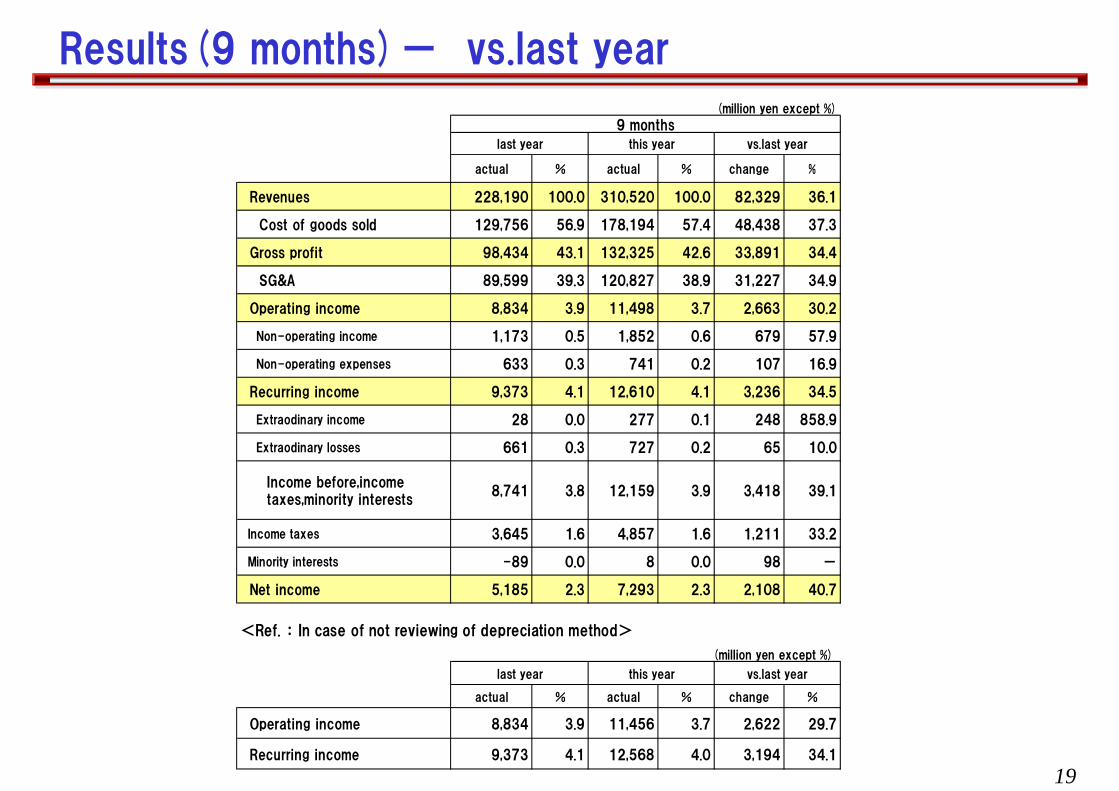
Results(9 months)- vs.last year(million yen except %)
last year this year vs.last year
actual % actual % change %
228,190 100.0 310,520 100.0 82,329 36.1
129,756 56.9 178,194 57.4 48,438 37.3
98,434 43.1 132,325 42.6 33,891 34.4
89,599 39.3 120,827 38.9 31,227 34.9
Operating income 8,834 3.9 11,498 3.7 2,663 30.2
Non-operating income 1,173 0.5 1,852 0.6 679 57.9
Non-operating expenses 633 0.3 741 0.2 107 16.9
Recurring income 9,373 4.1 12,610 4.1 3,236 34.5
Extraodinary income 28 0.0 277 0.1 248 858.9
Extraodinary losses 661 0.3 727 0.2 65 10.0
8,741 3.8 12,159 3.9 3,418 39.1
Income taxes 3,645 1.6 4,857 1.6 1,211 33.2
Minority interests -89 0.0 8 0.0 98 -
Net income 5,185 2.3 7,293 2.3 2,108 40.7
<Ref. : In case of not reviewing of depreciation method>
(million yen except %)
last year this year vs.last year
actual % actual % change %
Operating income 8,834 3.9 11,456 3.7 2,622 29.7
Recurring income 9,373 4.1 12,568 4.0 3,194 34.1
Income before,incometaxes,minority interests
Cost of goods sold
SG&A
Gross profit
9 months
Revenues
20
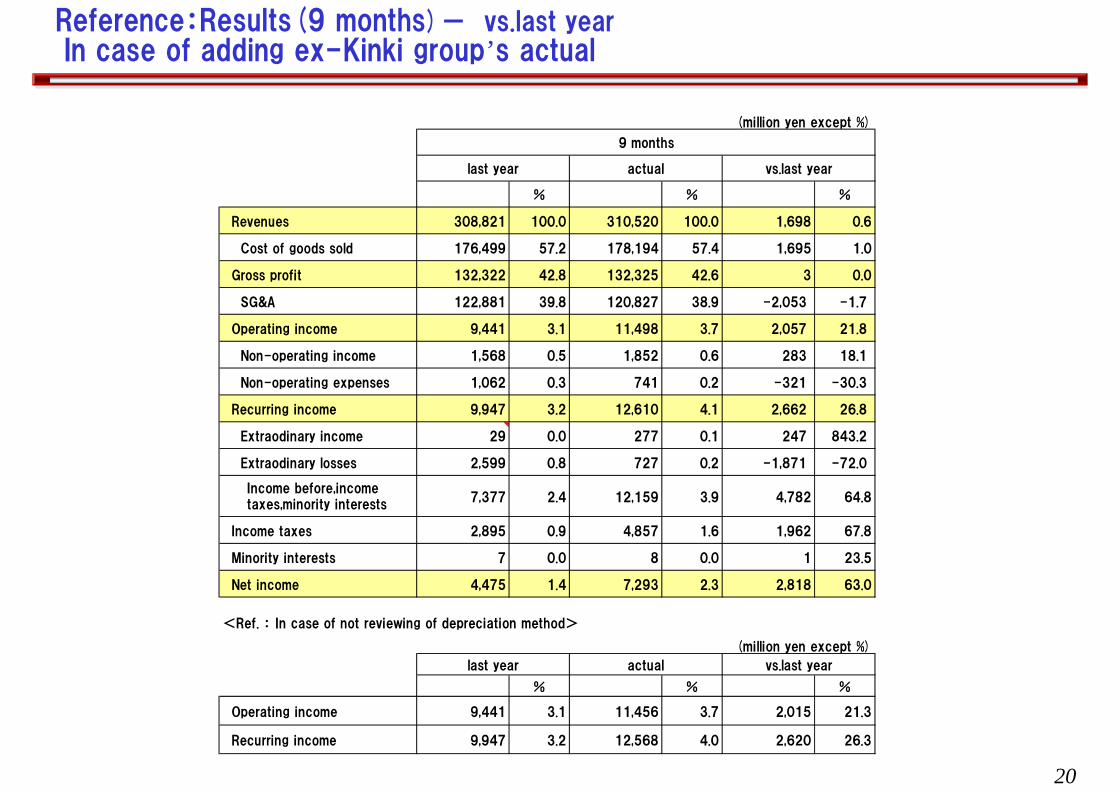
Reference:Results(9 months)- vs.last yearIn case of adding ex-Kinki group’s actual
(million yen except %)
last year actual vs.last year
% % %
Revenues 308,821 100.0 310,520 100.0 1,698 0.6
Cost of goods sold 176,499 57.2 178,194 57.4 1,695 1.0
Gross profit 132,322 42.8 132,325 42.6 3 0.0
SG&A 122,881 39.8 120,827 38.9 -2,053 -1.7
Operating income 9,441 3.1 11,498 3.7 2,057 21.8
Non-operating income 1,568 0.5 1,852 0.6 283 18.1
Non-operating expenses 1,062 0.3 741 0.2 -321 -30.3
Recurring income 9,947 3.2 12,610 4.1 2,662 26.8
Extraodinary income 29 0.0 277 0.1 247 843.2
Extraodinary losses 2,599 0.8 727 0.2 -1,871 -72.0
7,377 2.4 12,159 3.9 4,782 64.8
Income taxes 2,895 0.9 4,857 1.6 1,962 67.8
Minority interests 7 0.0 8 0.0 1 23.5
Net income 4,475 1.4 7,293 2.3 2,818 63.0
<Ref. : In case of not reviewing of depreciation method>
(million yen except %)
last year actual vs.last year
% % %
Operating income 9,441 3.1 11,456 3.7 2,015 21.3
Recurring income 9,947 3.2 12,568 4.0 2,620 26.3
Income before,incometaxes,minority interests
9 months

21
ⅢⅢ. 4. 4Q Business PlanQ Business Plan
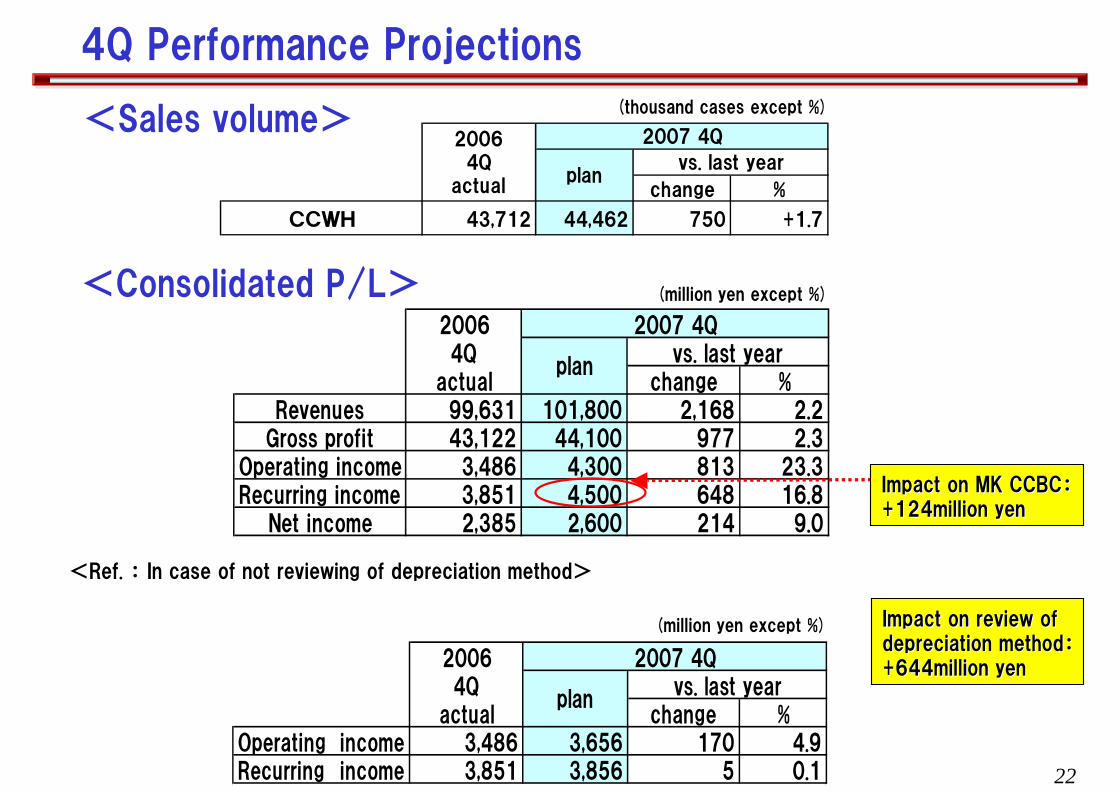
22
20064Q
actual change %Operating income 3,486 3,656 170 4.9Recurring income 3,851 3,856 5 0.1
vs. last year2007 4Q
plan
change %
CCWH 43,712 44,462 750 +1.7
20064Q
actual
2007 4Q
planvs. last year
20064Q
actual change %Revenues 99,631 101,800 2,168 2.2
Gross profit 43,122 44,100 977 2.3Operating income 3,486 4,300 813 23.3Recurring income 3,851 4,500 648 16.8
Net income 2,385 2,600 214 9.0
vs. last year2007 4Q
plan
Impact on review of Impact on review of depreciation methoddepreciation method::+644million yen+644million yen
Impact on MK CCBCImpact on MK CCBC::+124million yen+124million yen
4Q Performance Projections
<Consolidated P/L>
(thousand cases except %)<Sales volume>
(million yen except %)
<Ref. : In case of not reviewing of depreciation method>
(million yen except %)

23
<Gross profit>(billion yen)
Vs. last year : +1.0
*Main factors for increase
・Sales volume 0.6
・Sales mix 0.2
・Other group companies 0.1
2006 4Q gross profit
2007 4Q gross profit
Increase by sales mix
Other group companies
Other
Increase sales volume
43.1
+0.6
+0.2
+0.1
+0.1
44.1
<Operating income>2006 4Q operating income
2007 4Q operating income
Increase of gross profit
Decrease of depreciation cost
Review of depreciation method
Decrease of sales equipment cost
Increase of advertising cost
Increase of sales commission
Decrease of personnel cost
3.5
4.3
+0.7
+1.0
+0.6
+0.3
+0.2
-0.8
Vs. last year : +0.8
*Main factors for increase
・Gross profit 1.0
・Review of depreciation
method 0.7
・Personnel cost 0.6
・Sales equipment cost 0.3
・Depreciation cost 0.2
*Main factors for decrease
・Advertising cost -0.8
・Sales commission -0.5
・Service fee -0.1
-0.5
-0.6Other
-0.1Increase of service fee
4Q Consolidated Profit Factors (vs. last year)

24
○
○
○
Other
○
○
○
○
○
○
○
○
○
○
○
○
○○○○ ○OTC
VD
HOT DRINKIDS
SportsBlack teaGreen teaBlend teaCoffee
Strengthen marketing activities of hot drinks
①Vending channel
・Focus on main flavors of coffee (standard/bitter/black/cafe au lait)
・Launch various categories(teas/sports/soup/cocoa)
②OTC channel
・ ・Expand product line of category and make it attractiveExpand product line of category and make it attractive
・Install the sales equipment for hot drinks
4Q Point of marketing activities
25
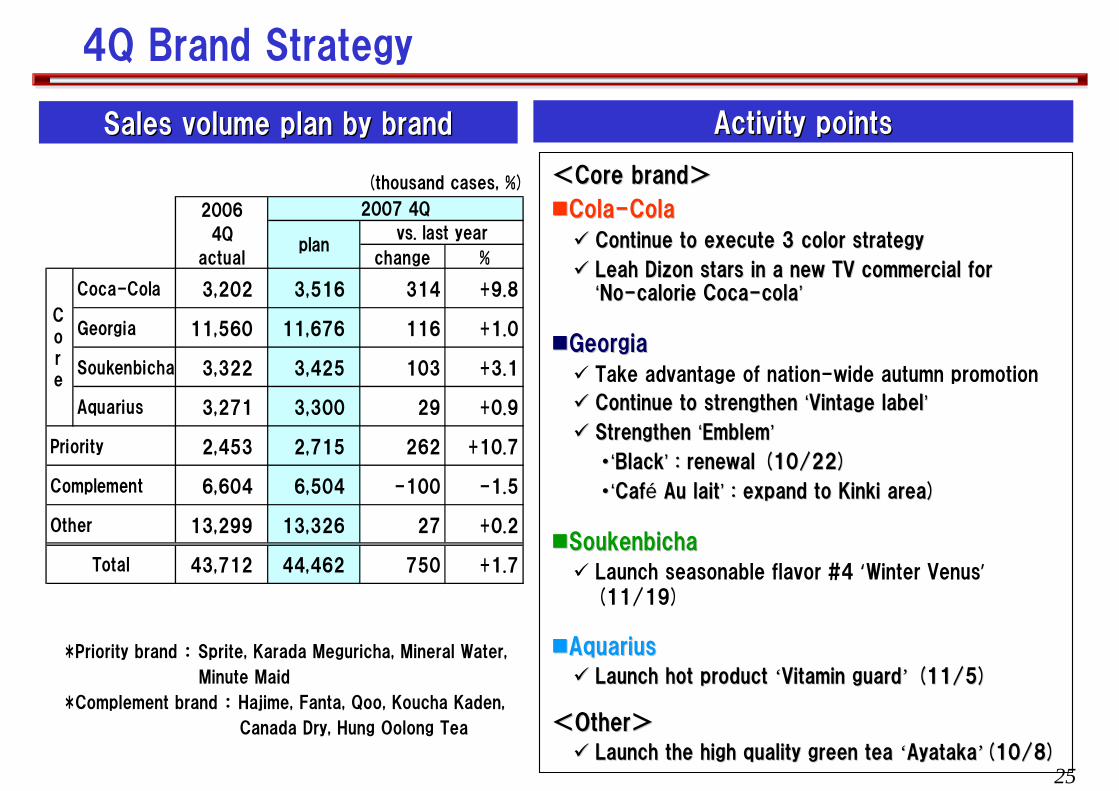
(thousand cases, %)
Sales volume plan by brandSales volume plan by brand Activity pointsActivity points
<<Core brandCore brand>>
ColaCola--ColaCola
Continue to execute 3 color strategyContinue to execute 3 color strategy
Leah Leah Dizon Dizon stars in a new TV commercial for stars in a new TV commercial for ‘‘NoNo--calorie Cocacalorie Coca--colacola’’
GeorgiaGeorgia
Take advantage of nation-wide autumn promotion
Continue to strengthen Continue to strengthen ‘‘Vintage labelVintage label’’Strengthen Strengthen ‘‘EmblemEmblem’’
・ ・‘‘BlackBlack’’ : renewal (10/22): renewal (10/22)
・ ・‘‘CafCaféé Au Au laitlait’’ : expand to Kinki area): expand to Kinki area)
SoukenbichaSoukenbicha
Launch seasonable flavor #4 ‘Winter Venus’(11/19)
AquariusAquarius
Launch hot product Launch hot product ‘‘Vitamin guardVitamin guard’’ (11/5)(11/5)
<<OtherOther>>
Launch the high quality green tea Launch the high quality green tea ‘‘AyatakaAyataka’’(10/8)(10/8)
2006
4Q
actual change %
Coca-Cola 3,202 3,516 314 +9.8
Georgia 11,560 11,676 116 +1.0
Soukenbicha 3,322 3,425 103 +3.1
Aquarius 3,271 3,300 29 +0.9
Priority 2,453 2,715 262 +10.7
6,604 6,504 -100 -1.5
Other 13,299 13,326 27 +0.2
43,712 44,462 750 +1.7Total
2007 4Q
planvs. last year
Core
Complement
4Q Brand Strategy
*Priority brand : Sprite, Karada Meguricha, Mineral Water,
Minute Maid
*Complement brand : Hajime, Fanta, Qoo, Koucha Kaden,
Canada Dry, Hung Oolong Tea

26
PackagePackage
ChannelChannel
Small and middle sizeSmall and middle size
Vending, CVSVending, CVS
Premium pricePremium pricePricePrice
Creation of new valueCreation of new valuePurposePurpose
Launch the high quality green tea ‘Ayataka’(10/8~)
2 brands(Ayataka/Hajime)- focused approach aimed at both creating new
values and increasing share
4Q Brand Strategy - Green tea
<Features of Ayataka>
Cloudy tea originating from authentic green tea offers deep flavor that lingers on the tongue
Abundant use of premium tea leaf supplied by a venerable tea company ‘Kanbayashi Syunshou Honten’which was established 450 years ago
Specially prepared bottle that invokes faceted glass

27
2006
4Q
actual change %
Vending 14,229 14,681 +451 +3.2
Chain store 7,920 8,128 +209 +2.6
CVS 4,731 4,743 +12 +0.3
Retail 6,259 6,081 -178 -2.8
Food service 4,406 4,618 +212 +4.8
Other 6,167 6,211 +44 +0.7
Total 43,712 44,462 +750 +1.7
2007 4Q
planvs. last year
(thousand cases except %)
Sales volume plan by channelSales volume plan by channel Activity pointsActivity points
<Sales volume plan by area(vs. last year>
■VendingCCWJ:・Convert to HOT according to temperature
・Improve the units with low sales volume
Kinki :・Secure prime location(generate earnings)
・Strengthen Georgia, and improve VPM by launching ‘Minutes Maid Acerola’
Mikasa :・Install IT-enable vending machines(300 units)
■Chain store
CCWJ :・Expand product line of small sized-packages
Kinki :・Continue to focus on Georgia, Aquarius and carbonated drinks
Mikasa :・Expand product line of small sized-packages
CCWJ Kinki Mikasa
Vending +2.2 +3.2 +8.5
Chain store +0.9 +6.0 -2.5
(%)
4Q Channel Strategy
When the influence accompanying CCWJ/NNB enterprise adjustment(*) is removed,
CCWH Vending (vs.ly): +4.2%
CCWJ Vending (vs.ly): +4.3%*CCWJ/NNB enterprise adjustment :
transferred CCWJ’s cup machines to NNBtransferred NNB’s Coca-Cola vending machines to CCWJ
(Sales volume of NNB is accounted in ‘Other’ section)

28
(thousand cases)
Sales volume
43,712
Sales volume
44,462+451
Vending(vs. last year +3.2%)
Increase the number of VM:+247
Improve VPM :+342
Transaction of CVM :-138
(CCWJ⇒NNB)
Vending(vs. last year +3.2%)
Increase the number of VM:+247
Improve VPM :+342
Transaction of CVM :-138
(CCWJ⇒NNB)+209 △178
+268
Chain store(vs. last year +2.6%)
CCWJ :+32(vs. last year +0.9%)
Kinki :+199(vs. last year +6.0%)
Mikasa :- 22(vs. last year -2.5%)
Chain store(vs. last year +2.6%)
CCWJ :+32(vs. last year +0.9%)
Kinki :+199(vs. last year +6.0%)
Mikasa :- 22(vs. last year -2.5%)
Retail(vs. last year -2.8%)Retail(vs. last year -2.8%)
Other channel
CVS : +12(vs. ly +0.3%)
Food service:+212(vs. ly +4.8%)
Other : +44(vs. ly +0.7%)
Other channel
CVS : +12(vs. ly +0.3%)
Food service:+212(vs. ly +4.8%)
Other : +44(vs. ly +0.7%)
2006 4Q actual 2007 4Q plan
※VPM…Volume Per Machine
4Q Scenario for achieving sales volume

29
4Q Scenario for achieving operating income
+340
Vending
3,500
4,300
2006 42006 4QQ
Operating incomeOperating income2007 42007 4QQ
Operating incomeOperating income
+40-130
+450
Chain store Retail
Cost reduction (fixed cost)
・Review of depreciation method +700
・Personnel cost +600
・Sales equipment cost +300
・Depreciation cost +200
・Advertising cost -800
・Other fixed cost -550
+100
Other channel
Other channel
CVS : +40
Food service: +60
Other channel
CVS : +40
Food service: +60
(million yen)

30
Performance Projections for the fiscal 2007
2006actual
※ change %Revenues 327,821 412,600 84,778 25.9
Gross profit 141,556 176,800 35,244 24.9Operating income 12,321 15,000 2,678 21.7Recurring income 13,225 16,300 3,074 23.2
Net income 7,570 9,400 1,829 24.2
vs. last year2007
plan
(million yen except %)
2006actual
※ change %Operating income 12,321 14,314 1,993 16.2Recurring income 13,225 15,614 2,389 18.1
vs. last year2007
plan
(million yen except %)
Impact on MK CCBC: +477 million yen
※ 2006 actual is CCWH consolidated P/L.(EX-CCWJ consolidated P/L (1H) + CCWH consolidated P/L (2H))
Impact on review of depreciation method:+686 million yen
<Ref. : In case of not reviewing of depreciation method>

31
change %Revenues 408,452 412,600 4,148 1.0
Gross profit 175,444 176,800 1,356 0.8Operating income 12,927 15,000 2,073 16.0Recurring income 13,799 16,300 2,501 18.1
Net income 6,860 9,400 2,540 37.0
vs. last year2007
plan2006
actual ※
(million yen except %)
※ 2006 actual are adjusted based on a total of ex-CCWJ and ex- Kinki CCBC,eliminating inter-company transaction.
(million yen except %)
Reference:Performance Projections for the fiscal 2007In case of adding ex-Kinki group’s actual
<In case of not reviewing of depreciation method>
change %Operating income 12,927 14,314 1,387 10.7Recurring income 13,799 15,614 1,815 13.2
vs. last year2007
2006actual ※ plan
32
ⅣⅣ.. Initiatives for next generationInitiatives for next generation
33
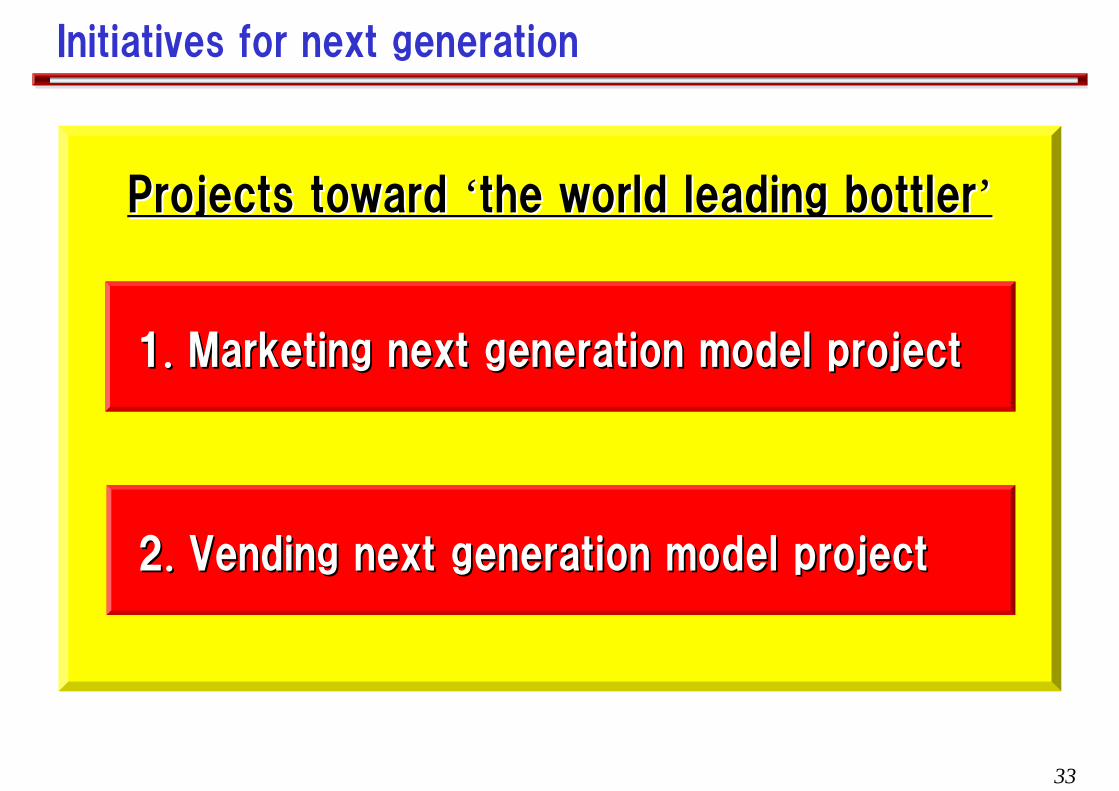
Initiatives for next generation
Projects toward Projects toward ‘‘the world leading bottlerthe world leading bottler’’
2. 2. Vending next generation model projectVending next generation model project
1. 1. Marketing next generation model projectMarketing next generation model project

34
Projects for next generation(1)
1. 1. Marketing next generation model projectMarketing next generation model project
Realization of highRealization of high--quality marketing execution quality marketing execution based on based on ‘‘Consumer viewConsumer view’’
RouteRoute--ToTo--Market : Market : strengthen merchandise strengthen merchandise and consumer/customer and consumer/customer serviceservice
Integration : develop the Integration : develop the support functionsupport function
Global consulting company Global consulting company which has various which has various experiences in Cocaexperiences in Coca--Cola Cola business supports the business supports the projectproject
Corporate with TCCC/CCJCCorporate with TCCC/CCJC
35
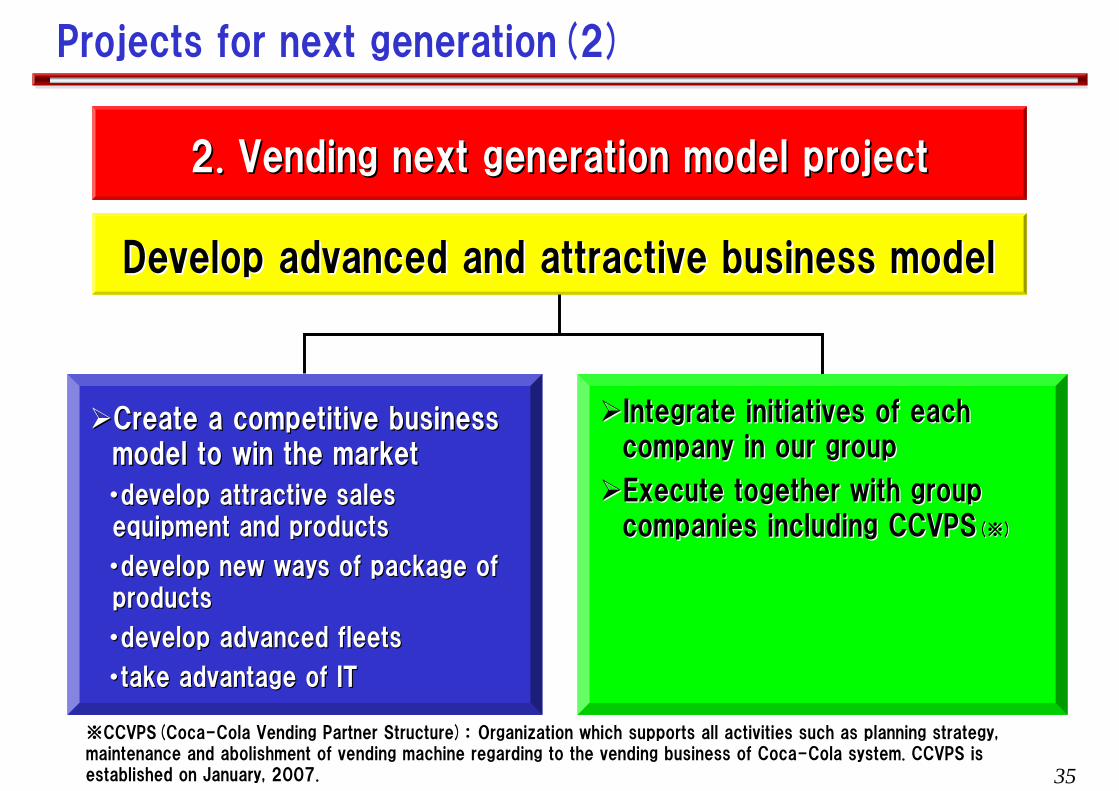
※CCVPS(Coca-Cola Vending Partner Structure): Organization which supports all activities such as planning strategy, maintenance and abolishment of vending machine regarding to the vending business of Coca-Cola system. CCVPS is established on January, 2007.
2. 2. Vending next generation model projectVending next generation model project
Develop advanced and attractive business modelDevelop advanced and attractive business model
Create a competitive business Create a competitive business model to win the marketmodel to win the market
・ ・develop attractive sales develop attractive sales equipment and productsequipment and products
・ ・develop new ways of package of develop new ways of package of productsproducts
・ ・develop advanced fleetsdevelop advanced fleets
・ ・take advantage of ITtake advantage of IT
Integrate initiatives of each Integrate initiatives of each company in our groupcompany in our group
Execute together with group Execute together with group companies including CCVPScompanies including CCVPS((※※))
Projects for next generation(2)
36
[ [ Reference Reference ] ]

37
change % change %RTB 432 +22 +5.4 +19 +4.7
Bottle OWB 144 -14 - 8.6 -59 - 29.2Subtotal 577 +9 +1.5 -40 - 6.5~350ml 2,399 -219 - 8.3 -89 - 3.6~500ml 10,784 +246 +2.3 +1,096 +11.3
PET ~1.0L 825 -38 - 4.4 -12 - 1.41.5L 2,496 -47 - 1.9 +132 +5.62.0L 8,302 +676 +8.9 +877 +11.8
Subtotal 24,807 +617 +2.6 +2,005 +8.8~190ml 8,306 -910 - 9.9 -8 - 0.1~250ml 1,717 -102 - 5.6 -146 - 7.9
Can ~350ml 3,354 +253 +8.2 +471 +16.3~500ml 903 -53 - 5.6 -19 - 2.0Subtotal 14,280 -812 - 5.4 +297 +2.1
2,307 -8 - 0.3 -890 - 27.81,940 -10 - 0.5 +113 +6.2
11,503 -228 - 1.9 +265 +2.455,413 -433 - 0.8 +1,750 +3.3
ActualVs. plan Vs. last year
2007 3Q
Bottle can
Other
Syrup, powder, food
Total
Sales volume by package - 3Q
(thousand cases except %)

38
VendingVending
Chain storeChain store
CVSCVS
Food serviceFood service
RetailRetail
OtherOther
31%
4%
10%
16%
17%
47%
12%
9%
15%
10%
23%
3%
7%
15%
6%
9%
61%
30%
5%4%
10%
16%
18%
47%
12%
10%
5%
14%
9%
25%
14%
7%10%
62%
2%5%
Channel
Channel
100%
Sales volume Revenues Gross profit
Hajime/Hajime/MarochaMarocha
SoukenbichaSoukenbicha
CocaCoca--ColaCola
AquariusAquarius
GeorgiaGeorgia
OtherOther
100% 2006 3Q 2007 3Q
9%
29%
6%8%
13%
35%
9%
29%
8%
7%
14%
32%
10%
37%
9%
15%
6%
24%
11%
27%
6%
12%
8%
35%
12%
27%
6%9%
14%
32%
12%
38%
5%9%
15%
22%
Bra
nd
Bra
nd
2006 3Q 2007 3Q
Sales volume Revenues Gross profit
Sales volume Revenues Gross profit Sales volume Revenues Gross profit
By Brand/Channel Sales Volume/Revenue/Gross Profit - 3Q
39
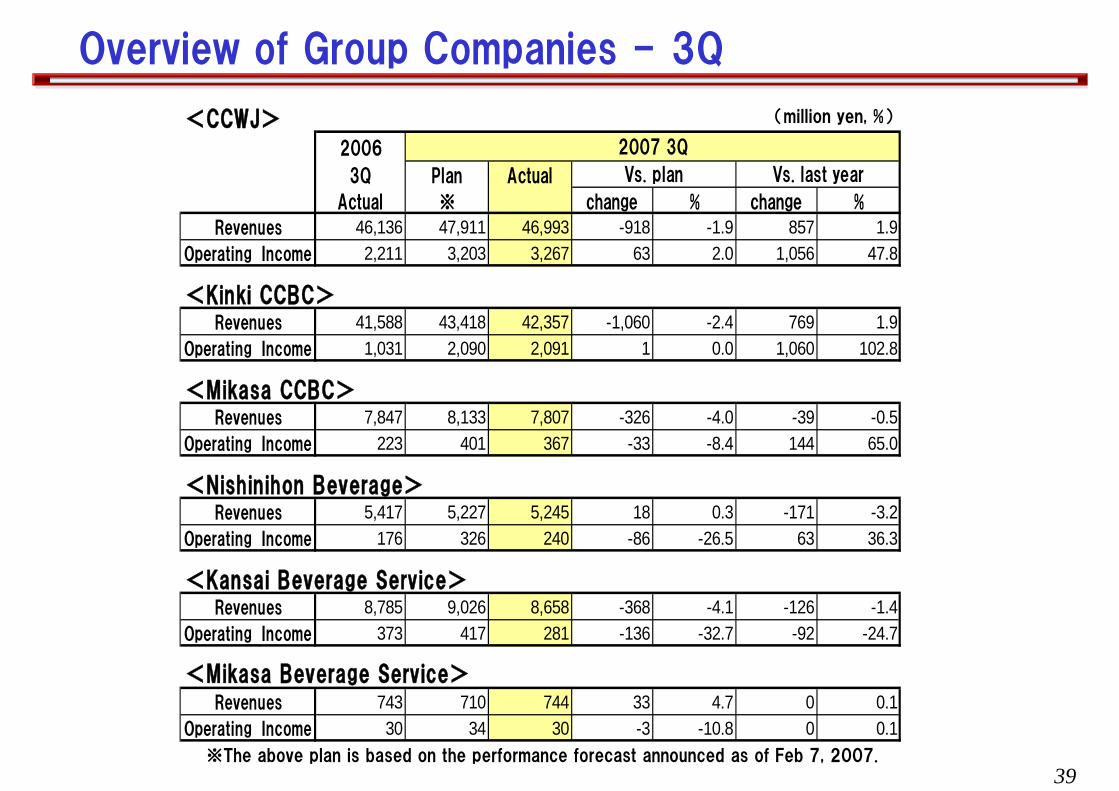
<CCWJ> 2006
3Q Plan Actual
Actual ※ change % change %
Revenues 46,136 47,911 46,993 -918 -1.9 857 1.9Operating Income 2,211 3,203 3,267 63 2.0 1,056 47.8
<Kinki CCBC>Revenues 41,588 43,418 42,357 -1,060 -2.4 769 1.9
Operating Income 1,031 2,090 2,091 1 0.0 1,060 102.8
<Mikasa CCBC>Revenues 7,847 8,133 7,807 -326 -4.0 -39 -0.5
Operating Income 223 401 367 -33 -8.4 144 65.0
<Nishinihon Beverage>Revenues 5,417 5,227 5,245 18 0.3 -171 -3.2
Operating Income 176 326 240 -86 -26.5 63 36.3
<Kansai Beverage Service>Revenues 8,785 9,026 8,658 -368 -4.1 -126 -1.4
Operating Income 373 417 281 -136 -32.7 -92 -24.7
<Mikasa Beverage Service>Revenues 743 710 744 33 4.7 0 0.1
Operating Income 30 34 30 -3 -10.8 0 0.1
Vs. last year
2007 3Q
Vs. plan
Overview of Group Companies - 3Q
(million yen, %)
※The above plan is based on the performance forecast announced as of Feb 7, 2007.

40
Performance Trend
0
50,000
100,000
150,000
200,000
250,000
300,000
350,000
400,000
450,000
96 97 98 99 00 01 02 03 04 05 06 07plan
0
5,000
10,000
15,000
20,000
25,000
OperatingIncome
Net Revenues
7,305
2005
245,874
11,830
12,256
7,570
2006
327,821
12,321
13,22517,065
8,564
2004
253,248
16,860
2002 2003
247,737
16,704
17,005
7,086
19,895
164,731 207,827 240,825
17,449 19,638
117,991
10,737
15,889 18,516
226,111
16,634
5,428 9,3805,872 6,823 5,700
115,408
1997
11,054
1996 1998 1999 2001
12,533 15,160
12,510
2000
113,490
10,481
NetRevenuesOperatingIncomeRecuringIncomeNetIncome
16,021
1,420
11,273
5,721
2007(plan)
412,600
15,000
16,300
9,400
1999/7/1: Merged with Sanyo CCBC
2006/7/1 Integration with Kinki CCBC
2001/4/5 Make Mikasa CCBC subsidiary
(million yen)
(million yen)
2007/4/3 Capital/Business alliance with Minami Kyushu CCBC
(million yen)
41
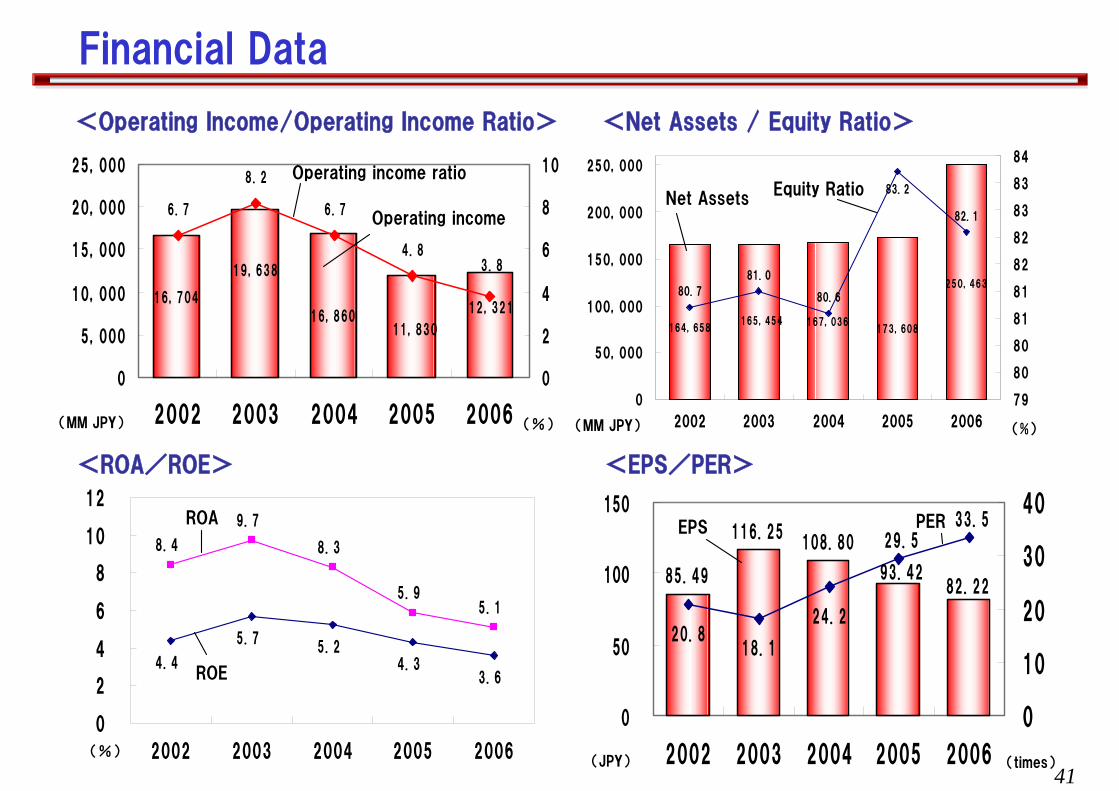
Financial Data
16,704
19,638
16,86011,830
12,321
6.7
3.84.8
6.7
8.2
0
5,000
10,000
15,000
20,000
25,000
2002 2003 2004 2005 2006
0
2
4
6
8
10
85.49
116.25108.80
93.4282.22
20.8
33.529.5
24.2
18.1
0
50
100
150
2002 2003 2004 2005 2006
0
10
20
30
40
(%)
250,463
173,608167,036165,454
164,658
82.1
83.2
80.6
81.0
80.7
0
50,000
100,000
150,000
200,000
250,000
2002 2003 2004 2005 2006
79
80
80
81
81
82
82
83
83
84
(%)
3.6
5.7
4.35.2
4.4
5.95.1
8.3
9.7
8.4
0
2
4
6
8
10
12
2002 2003 2004 2005 2006
ROA
ROE
PEREPS
(%)
<Operating Income/Operating Income Ratio> <Net Assets / Equity Ratio>
<ROA/ROE> <EPS/PER>
(times)
Operating income
Operating income ratioEquity Ratio
Net Assets
(MM JPY) (MM JPY)
(JPY)

42
Coca-Cola West Group-Structure
<CCWJ area> <Kinki area> <Mikasa area> <Distribution><Production>
Kansa
i Beve
rage
Servic
e
Nesc
o
Kin
ki C
oca-Cola
Pro
ducts
Cadia
c
Nish
inih
on B
eve
rage
CCW
J Pro
ducts
CCW
J Vendin
g
CCW
Logistic
s
Mika
sa B
eve
rage
Servic
e
CCW
Daise
n P
roducts
CocaCoca--Cola West HoldingsCola West Holdings
CCW
J Custo
mer
Servic
e
Mika
sa S
ervic
e
<Non-Coca-Cola Business>Nic
hib
ei
Kinki CCBCCCWJ Mikasa CCBC
Takam
asa
mune
West Ja
pan S
ervic
e
Rex E
state
Seiko
Corp
ora
te Ja
pan
C&
C
Akiyo
shi S
ystem
s
(1)
(2) (3) (4)
(5) (6) (7) (8) (17) (19) (21) (23)(18) (20) (22)
(9) (10) (15) (11) (13) (14) (12) (16)
Min
am
i Kyu
shu C
oca-Cola
Gro
up

43
Our Group Companies - Principal Business
Our Group Companies Principal Business
(1) Coca-Cola West Holdings (CCWH) Management of group companies, Manufacture and Sales of bevarege
(2) Coca-Cola West Japan (CCWJ) Beverage sales
(3) Kinki Coca-Cola Bottling Beverage sales
(4) Mikasa Coca-Cola Bottling Beverage sales
(5) CCWJ Products Beverage production
(6) Kinki Coca-Cola Products Beverage production
(7) Coca-Cola West Daisen Products Beverage production (mineral water)
(8) Coca-Cola West Logistics Freight transport-operations
(9) Coca-Cola West Japan Vending Vending machine operations (Coca-Cola products)
(10) Nishinihon Beverage Vending machine sales and servicing
(11) Kansai Beverage Service Vending machine sales and servicing
(12) Mikasa Beverage Service Vending machine sales and servicing
(13) Nesco Vending machine operations
(14) KADIAC Vending machine operations (in the Kansai Air Port)
(15) Coca-Cola West Japan Customer Service Vending machine-related businesses
(16) Mikasa Service Vending machine-related businesses
(17) Nichibei Manufacture of processed foods
(18) Takamasamune Production and sales of alcoholic beverages
(19) West Japan Service Insurance, leasing, and business machine sales
(20) Rex Estate Real estate business
(21) Seiko Corporate Japan Maintenance and repair of motor vehicle
(22) C&C Sales and manufacturing of food, Chain restaurant business
(23) Akiyoshi Systems Chain restaurant business

44
Investment(percentage of shares)
Coca-Cola(Japan)Co., Ltd
(CCJC) ③
Coca-ColaNational BeveragesCo., Ltd
(CCNBC) ⑥
Coca-ColaIBS Co., Ltd
(CCIBS) ⑦
Coca-ColaCustomerMarketing Company
(CCCMC) ⑧
FV Corporation(FVC)
⑨
(100%)
Joint companies of TCCC/CCJC and bottlers
Coca-ColaTokyo Research& DevelopmentCo., Ltd
(CCTR&D) ④
The Coca-Cola Company (TCCC) ②
(100%)
Coca-Cola Bottling8 Companies(CCBC)
Coca-Cola WestHoldings Co., Ltd
(CCWH) ①
⑤
Minami KyushuCoca-Cola BottlingCo., Ltd
(20.0%)
Coca-Cola System in Japan
(3.9%)
(25.0%)
(15.0%)
(20.0%)
(21.7%)
(as of July, 2007)
Tokyo Coca-ColaBottling Co., Ltd
Coca-Cola Central Japan Co., Ltd

45
1. Coca-Cola West Holdings Co., Ltd. (CCWH)
In July, 2006, Coca-Cola West Japan Company, Limited and Kinki Coca-Cola Bottling Company, Limited merged the management of both companies by establishing a joint holding company CCWH.
2. The Coca-Cola Company (TCCC)
Established 1919 in Atlanta, Georgia. Carries the rights to grant a license to manufacture and sell Coca-Cola products to the bottlers. TCCC (or its subsidiary) makes franchise agreements with the bottlers.
3. Coca-Cola (Japan) Co., Ltd. (CCJC)
Established 1957 in Tokyo, as “Nihon Inryo Kogyo K.K.,” a wholly-owned subsidiary of The Coca-Cola Company. The company name was changed in 1958 to Coca-Cola (Japan) Company, Limited. CCJC is responsible for marketing planning as well as manufacturing and distribution of concentrate in Japan.
4. Coca-Cola Tokyo Research & Development Co., Ltd. (CCTR&D)
Established in January 1993 as a wholly-owned subsidiary of The Coca-Cola Company. Since January 1995, carries out product development and technical support to respond to the needs of the Asian region.
5. Coca-Cola bottlers (CCBCs)
There are 12 bottlers in Japan, which are responsible for selling Coca-Cola products in the respective territories.
6. Coca-Cola National Beverages Co., Ltd. (CCNBC)
Jointly established in April 2003 by TCCC and CCBCs for the purpose of creating an optimal nationwide supply chain. It started operation in October 2003. CCNBC procures raw materials, coordinates manufacturing and supply/demand plans on a nationwide basis, and supply products to the bottlers.
7. Coca-Cola IBS Co., Ltd (CCIBS)
Established through joint investment by The Coca-Cola Company and its bottling partners in Japan, and the company began operations on January 1, 2007. It is charged with providing business consulting services to the Coca-Cola system in Japan, as well as developing and generally maintaining the information systems to support such work.
8. Coca-Cola Customer Marketing Company (CCCMC)
Established through joint investment by Coca-Cola (Japan) Co., Ltd. and all of its bottling partners in Japan, and the company began operations on January 1, 2007. It is charged with holding business negotiations with major retailer outlets, such as nationwide convenience stores and supermarket chains, as well as developing proposals for sales promotions and storefront activities.
9. FV Corporation (FVC)
Jointly established in May 2001 by CCBCs and CCJC. FVC carries out sales negotiations with national chain vending operators, and deals with non-KO products as well as KO products.
Coca-Cola Related Companies and Their Roles

46
Vending:
Retail sale business to distribute products through vending machines to consumers
Chain store:
Wholesale business for supermarket chains
Convenience Store:
Wholesale business for convenience store chains
Retail:
Wholesale business for grocery stores, liquor shops, and other over-the-counter outlets
Food Service:
Syrup sale business for fast food restaurants, movie theaters, sports arenas, “family restaurants,” and theme parks
Distributor:
Middleman who work for Coca-Cola to handle our products in remote areas and islands.
1. Channel (Business Unit)
Glossary (1)

47
2. Vending
Regular vending machine:
A vending machine offered free of charge to a customer who supervises its operation and uses it to sell products purchased from us.
Full service vending machine:
A vending machine installed and managed directly by us (product supply, collection of proceeds etc.).
Fees are paid to the location proprietors.
Out-market vending machine:
An outdoor machine whose users are relatively unspecific
In-market vending machine:
An indoor machine whose users are relatively specific
VPM
Sales volume per vending machine
Glossary (2)

48
3. Chain StoreNational chain:
National chain supermarket that CCNSC are responsible for negotiating
Regional chain:
Chain supermarket that owns its stores in the two or more bottlers’ territories
Local chain:
Chain supermarket that owns its stores in the single bottler’s territory
RGM:
RGM(Revenue Growth Management) involves joining forces with customers to deliver stronger earnings through sustained sales increases by offering value to consumers
4. OtherSales mix
Composite of products by brand, channel, package, etc. The difference between budget and actual sales or cost of sales might be affected by a change in product sales mix as well as a change in unit price
Glossary (3)
49
The plans, performance forecasts, and strategies appearingin this material are based on the judgment of the managementin view of data obtained as of the date this material was released. Please note that these forecasts may differ materially from actualperformance due to risks and uncertain factors such as those listed below.- Intensification of market price competition- Change in economic trends affecting business climate- Major fluctuations in capital markets- Uncertain factors other than those above
Forward-Looking Statement