think smaller for big growth · 2 think smaller for big growth • nearly half of global...
TRANSCRIPT

1Copyright © 2016 The Nielsen Company
Think Smaller for Big growThHow to tHrive in tHe new retail landscape
June 2016
2 Think Smaller for Big growTh
• Nearlyhalfofglobalrespondents(46%)saygroceryshoppingisachorethatthey
trytospendaslittletimeonaspossible.Thislowlevelofsatisfactionprimarily
stemsfromabeliefthatretailersdon’tunderstandanddeliverontheirneeds.
• Valueisaboutmorethanjustthelowestprice.Infact,consumersratehigh-quality
produce(57%),convenientlocation(56%)andproductavailability(54%)asmore
influentialinstore-selectiondecisionsthanthelowestprice.
• Manufacturersandretailersaredependentonpromotions.Tobreakthecycle,they
needtoknowwhichcategoriesaremoreorlesspricesensitive.Notsurprisingly,
discretionarycategoriesaremoresensitivetopriceincreasesthanstapleproducts.
SentimentinLatinAmericaandEuropesuggeststhatconsumerstherearemore
sensitivetopriceincreases,whileNorthAmericanrespondentsaretheleast
sensitive.
• Healthandwellnessisatoppriorityforconsumersaroundtheworld.Two-thirdsof
globalrespondents(67%)saytheyactivelyseekproductswithhealthfulingredients.
• Consumerscraveconvenienceandspeed;qualityprepared-mealoptionsandin-
storediningexperiencescanbeakeydifferentiatorforwhereconsumersdecide
toshop.Astheroleofthephysicalstoreevolves,in-storeadd-onservicesmay
drivesatisfactionandvisits.In-storebanking(42%),fastfood(40%),prepared
food(40%)andpharmacy(39%)arethemostwidelyavailableandusedin-store
services,butinterestinseveralothersishigh.
• Assortmentandproductavailabilityarebasicrequirementsinstore-selection
decisions,butwithlimitedshelfspaceinsmallformatsandanincreasing
expectationforcustomizedproductofferingsandrecommendations,gettingthe
assortmentpiecerightincreasinglymeansshiftingfromapushtoapullmind-set,
drivenbyconsumerdemand.
around The world
2
reTail evoluTion: why markeTing To The middle doeSn’T work anymore
3Copyright © 2016 The Nielsen Company 3
About the GlobAl Survey MethodoloGy
Thefindingsinthissurvey
arebasedonrespondents
withonlineaccessin61
countries(unlessotherwise
noted).Whileanonline
surveymethodologyallows
fortremendousscaleand
globalreach,itprovidesa
perspectiveonthehabitsof
onlyexistingInternetusers,
nottotalpopulations.In
developingmarketswhere
onlinepenetrationisstill
growing,respondentsmaybe
youngerandmoreaffluent
thanthegeneralpopulation
ofthatcountry.Inaddition,
surveyresponsesarebased
onclaimedbehavior,rather
thanactualmetereddata.
Culturaldifferencesin
reportingsentimentarelikely
factorsintheoutlookacross
countries.Thereportedresults
donotattempttocontrolor
correctforthesedifferences;
therefore,cautionshouldbe
exercisedwhencomparing
acrosscountriesandregions,
particularlyacrossregional
boundaries.
Modernretailhaslongbeenguidedbyapowerfulpremise:thebigger,the
better.Bigwasbetterforretailersbecausescaledrovedownunitcostand
soraisedreturnoninvestment(ROI).Itwasalsobetterforconsumers,who
gainedaccesstogreaterassortment,betterpricesandconvenientone-stop
shopping.Andbigwasbetterforsuppliers,whobenefitedfromgreatershelf
spacetodeploybrandandcategoryportfoliostrategies.
Overthepast10to15years,however,themodernretailstoremodelhas
evolved.Supplychainprocessimprovementshavemadeitpossibletoachieve
similarorevenhigherlevelsofprofitabilitywithsmallerstores,pavingtheway
forsmallerretailchainstoexpandandtakesharefromlargercompetitorsin
manymarkets.Shoppers,whoareabletomatchtheirpreferredstoreformat
morepreciselytotheirshoppingneedsandpreferencesondifferentpurchase
occasions,havebenefitedgreatlyfromthisincreaseinstoreformats.
Butformanybig-boxretailerstheshifthasn’tbeensuchaboon.Theresult
isthattoday’sretailenvironmentismorefragmentedthanever.Fierce
competitionforshoppershasledtoanincreasingdependencyonpromotions
amonglargeretailers.
Inaddition,fallingbirthrates,risingfoodprices,andstagnantwagesare
makingvolumegrowthindevelopedmarketsdifficulttoachieve.Meanwhile,
developingmarkets,whichwereexpectedtofollowthesameretailevolution
blueprintasdevelopedmarkets,haveforgedtheirownpath.Inseveral
markets,includingChina,Indonesia,PolandandTurkey,small-formatstores
havedriventhetransitiontomodernretail.Manyothermarketsarestill
undergoingtheshifttomodernretail—andit’slikelythatsomeofthese
developingmarketswillpartiallyskipthebrick-and-mortarphasebymoving
onlineearly.
“Perhapsthenewretailmantrashouldbe‘Gosmallorgohome,’asthe
‘Biggerisbetter’paradigmhasbeenchallengedvirtuallyeverywhere,”said
SteveMatthesen,globalpresidentofRetail,Nielsen“Hyper-localizationand
specializationarefuelingtoday’sretailgrowth.Aslifestyleandconsumption
habitschange,we’reseeingastructuralshiftinwhereconsumersshopand
whattheybuy,andsomesmallformatsaredrivingbiggrowth.Mass-market
strategiesarealsolosingrelevanceasconsumerslookforuniqueexperiences
thatmeettheirpersonaldemands.”
TheNielsenGlobalRetail-GrowthStrategiesSurveypolledmorethan30,000
onlinerespondentsin61countriestounderstandthepainandthepleasure
pointsabouttheshoppingexperience.Weexaminedhowwellretailers
arecurrentlymeetingconsumers’needsandwhyconsumerschooseone
storeoveranother.Wealsoreviewedaselectionof19productcategoriesto
determinetheproductattributesthataremostimportant.Lastly,wetooka
lookatconsumers’willingnesstouseadditionalin-storeservicesandtheir
preferredapproachtodealingwithpriceincreases,inordertoidentifyareasfor
developmentorimprovement.
4 Think Smaller for Big growTh
adapTing To ShifTing demographicSWanttoanticipateemergingtrendsinstoreformatpreferences?Startby
lookingatthedemographicandsocioeconomictrendsaffectingtheretail
landscape.Theshopofthefutureshouldbeareflectionoftheshopperofthe
future,anddemographicshiftsareshapingconsumers’preferences.Considera
fewofthem:
• Risingmiddleclass.TheOrganizationforEconomicCooperationand
Developmentpredictstheglobalmiddleclasswillincreaseto3.2billionby
2020andto4.9billionby2030.Economicprosperitywilllikelybeagrowth
engineforconsumption,especiallyinChinaandIndia,ashistoryhas
shownthatthoseinthemiddleclassenthusiasticallyacquirebothphysical
andhumancapital.Atthesametime,however,fallingrealincomesin
somedevelopedmarketsmaydrivethegrowthofvalueformatsthere.
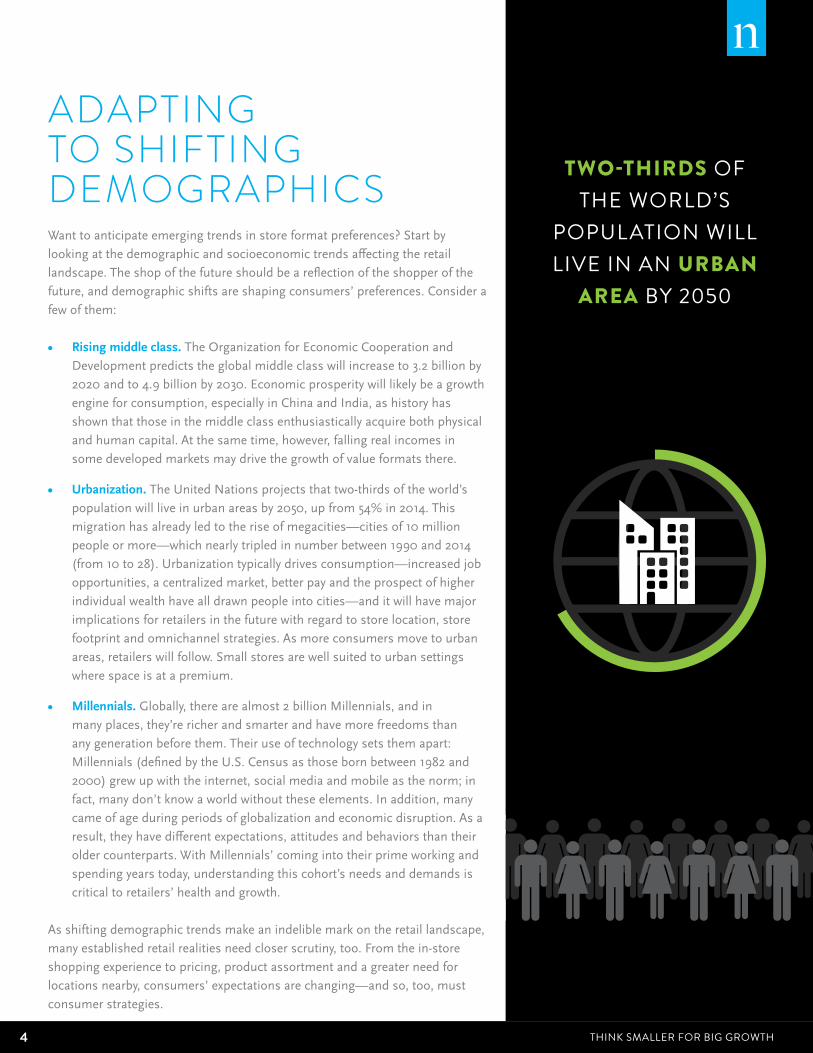
• Urbanization.TheUnitedNationsprojectsthattwo-thirdsoftheworld’spopulationwillliveinurbanareasby2050,upfrom54%in2014.This
migrationhasalreadyledtotheriseofmegacities—citiesof10million
peopleormore—whichnearlytripledinnumberbetween1990and2014
(from10to28).Urbanizationtypicallydrivesconsumption—increasedjob
opportunities,acentralizedmarket,betterpayandtheprospectofhigher
individualwealthhavealldrawnpeopleintocities—anditwillhavemajor
implicationsforretailersinthefuturewithregardtostorelocation,store
footprintandomnichannelstrategies.Asmoreconsumersmovetourban
areas,retailerswillfollow.Smallstoresarewellsuitedtourbansettings
wherespaceisatapremium.
• Millennials.Globally,therearealmost2billionMillennials,andin
manyplaces,they’rericherandsmarterandhavemorefreedomsthan
anygenerationbeforethem.Theiruseoftechnologysetsthemapart:
Millennials(definedbytheU.S.Censusasthosebornbetween1982and
2000)grewupwiththeinternet,socialmediaandmobileasthenorm;in
fact,manydon’tknowaworldwithouttheseelements.Inaddition,many
cameofageduringperiodsofglobalizationandeconomicdisruption.Asa
result,theyhavedifferentexpectations,attitudesandbehaviorsthantheir
oldercounterparts.WithMillennials’comingintotheirprimeworkingand
spendingyearstoday,understandingthiscohort’sneedsanddemandsis
criticaltoretailers’healthandgrowth.
Asshiftingdemographictrendsmakeanindeliblemarkontheretaillandscape,
manyestablishedretailrealitiesneedcloserscrutiny,too.Fromthein-store
shoppingexperiencetopricing,productassortmentandagreaterneedfor
locationsnearby,consumers’expectationsarechanging—andso,too,must
consumerstrategies.
two-tHirds of the world’s
population will live in an urban
area by 2050

5Copyright © 2016 The Nielsen Company
ShoPPING IS A Chore For hAlF ArouNd the World
PerCeNtAGe Who StroNGly/SoMeWhAt AGree ShoPPING IS
A Chore
Source:NielsenGlobalRetail-GrowthStrategiesSurvey,Q32015
Latin america
46%
asia-Pacific
48%
euroPe
38%
africa/middLe
east
53%
GLoBaL
46%
iS iT poSSiBle To Turn choreS inTo cheerS?Howcanretailersstayaheadintherapidlychanginglandscape?Theycan
startbyassessinghowwellthey’redoingnow.Whatdoconsumersthink
abouttheshoppingexperience,andhowwelldotheythinktheirneedsare
currentlybeingmet?
Formany,groceryshoppingisachore.Infact,nearlyhalf(46%)of
respondentsaroundtheworldsaygroceryshoppingissomethingtheytry
tospendaslittletimeaspossibledoing.Sowhatisitabouttheshopping
experiencethatisparticularlyunpleasant?
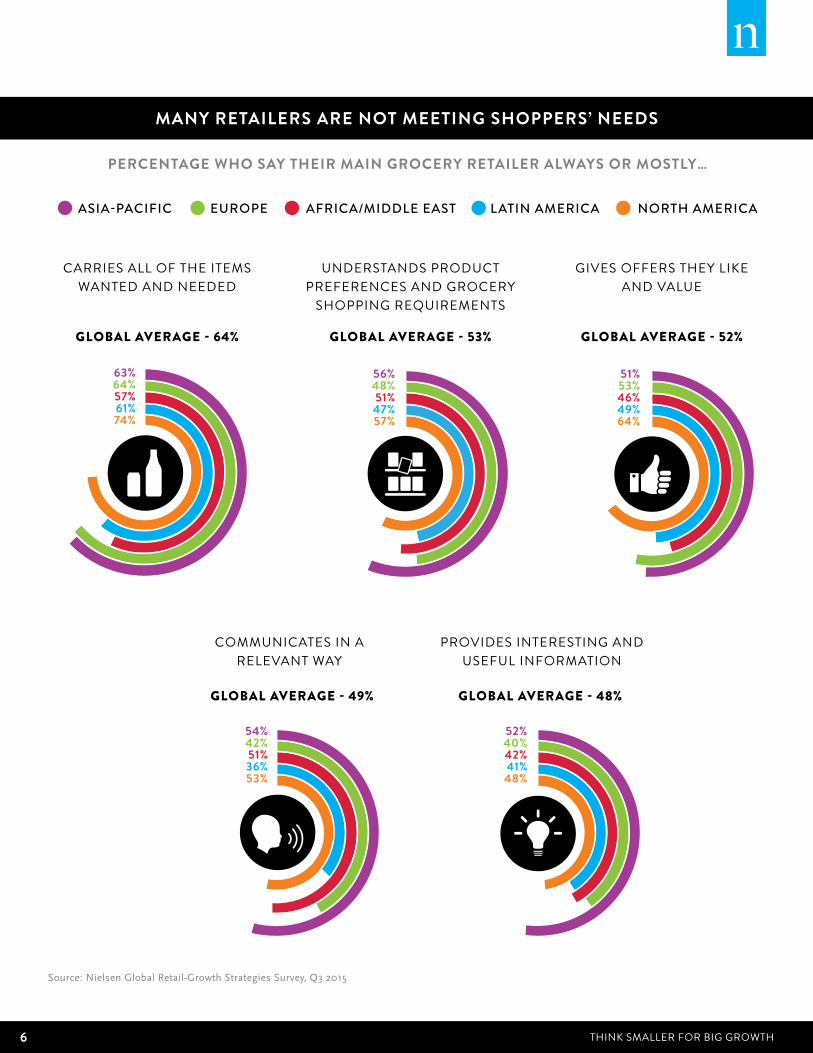
Perhapsthebiggestpainpointforconsumersisthatmanythinkretailers
don’tunderstandanddeliverontheirneeds.Lessthanhalfofglobal
respondents(49%)believetheirmaingroceryretaileralwaysormostly
communicateswiththeminarelevantway.Justoverhalfbelieveretailers
alwaysormostlyunderstandtheirgroceryrequirement(53%)andprovide
offerstheylikeandvalue(52%).Globally,retailersaredoingbetteronthe
productassortmentfront:64%saytheirmaingroceryretaileralwaysor
mostlycarriestheitemstheywant.
Butsentimentisn’tthesameeverywhere.RetailersinNorthAmerica—
and,toalesserdegree,Asia-Pacific—seemtobedoingabetterjobthan
theircounterpartsinEuropeandLatinAmerica.NorthAmericanretailers
particularlystandoutwhenitcomestoproductassortmentandproviding
valuedoffers.Roughlythree-quartersofNorthAmericanrespondents
(74%)saytheirmaingroceryretaileralwaysormostlycarriestheitemsthey
want,10percentagepointsabovetheglobalaverage(64%),andalmost
two-thirds(64%)saytheirmaingroceryretailerprovidesthemwithoffers
theylikeandvalue(comparedwith52%globally).Ofcourse,it’simportant
tonotethatNorthAmericanretailersmayberatedmorepositivelyinterms
ofassortmentbecausetheyhavemoreshelfspacetoworkwith.Inthe
U.S.,theaveragesellingspaceisabout25,000squarefeet.
north america
46%
6 Think Smaller for Big growTh
MANy retAIlerS Are Not MeetING ShoPPerS’ NeedS
PerCeNtAGe Who SAy theIr MAIN GroCery retAIler AlWAyS or MoStly…
asia-Pacific
Global averaGe - 64% Global averaGe - 53%
Global averaGe - 49%
Global averaGe - 52%
Global averaGe - 48%
euroPe africa/middLe east Latin america north america
understands product preferences and grocery
shopping requirements
gives offers they like and value
communicates in a relevant way
carries all of the items wanted and needed
56%48%51%47%57%
51%53%46%49%64%
63%64%57%61%74%
provides interesting and useful information
54%42%51%36%53%
52%40%42%41%48%
Source:NielsenGlobalRetail-GrowthStrategiesSurvey,Q32015
7Copyright © 2016 The Nielsen Company
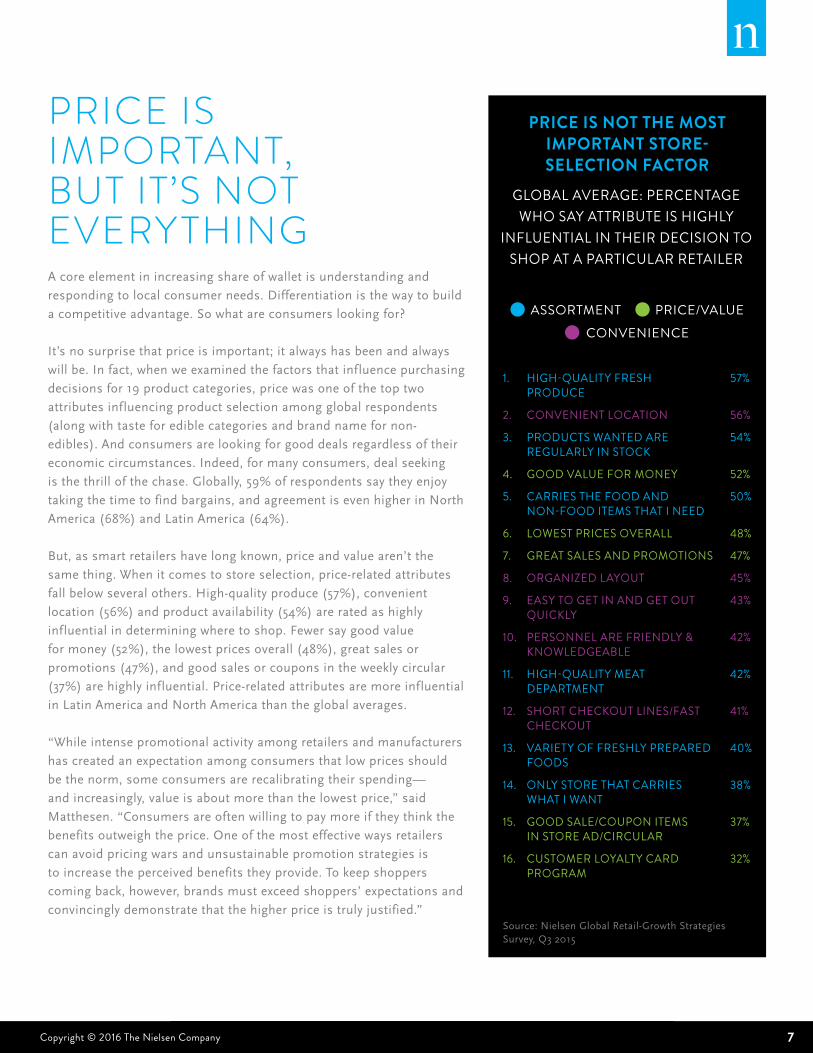
price iS imporTanT, BuT iT’S noT everyThingAcoreelementinincreasingshareofwalletisunderstandingand
respondingtolocalconsumerneeds.Differentiationisthewaytobuild
acompetitiveadvantage.Sowhatareconsumerslookingfor?
It’snosurprisethatpriceisimportant;italwayshasbeenandalways
willbe.Infact,whenweexaminedthefactorsthatinfluencepurchasing
decisionsfor19productcategories,pricewasoneofthetoptwo
attributesinfluencingproductselectionamongglobalrespondents
(alongwithtasteforediblecategoriesandbrandnamefornon-
edibles).Andconsumersarelookingforgooddealsregardlessoftheir
economiccircumstances.Indeed,formanyconsumers,dealseeking
isthethrillofthechase.Globally,59%ofrespondentssaytheyenjoy
takingthetimetofindbargains,andagreementisevenhigherinNorth
America(68%)andLatinAmerica(64%).
But,assmartretailershavelongknown,priceandvaluearen’tthe
samething.Whenitcomestostoreselection,price-relatedattributes
fallbelowseveralothers.High-qualityproduce(57%),convenient
location(56%)andproductavailability(54%)areratedashighly
influentialindeterminingwheretoshop.Fewersaygoodvalue
formoney(52%),thelowestpricesoverall(48%),greatsalesor
promotions(47%),andgoodsalesorcouponsintheweeklycircular
(37%)arehighlyinfluential.Price-relatedattributesaremoreinfluential
inLatinAmericaandNorthAmericathantheglobalaverages.
“Whileintensepromotionalactivityamongretailersandmanufacturers
hascreatedanexpectationamongconsumersthatlowpricesshould
bethenorm,someconsumersarerecalibratingtheirspending—
andincreasingly,valueisaboutmorethanthelowestprice,”said
Matthesen.“Consumersareoftenwillingtopaymoreiftheythinkthe
benefitsoutweightheprice.Oneofthemosteffectivewaysretailers
canavoidpricingwarsandunsustainablepromotionstrategiesis
toincreasetheperceivedbenefitstheyprovide.Tokeepshoppers
comingback,however,brandsmustexceedshoppers’expectationsand
convincinglydemonstratethatthehigherpriceistrulyjustified.”
PrICe IS Not the MoSt IMPortANt Store-SeleCtIoN FACtor
global average: percentage who say attribute is highly
influential in their decision to shop at a particular retailer
1. high-quality fresh 57% produce
2. convenient location 56%
3. products wanted are 54% regularly in stock
4. good value for money 52%
5. carries the food and 50% non-food items that i need
6. lowest prices overall 48%
7. great sales and promotions 47%
8. organized layout 45%
9. easy to get in and get out 43% quickly
10. personnel are friendly & 42% knowledgeable
11. high-quality meat 42% department
12. short checkout lines/fast 41% checkout
13. variety of freshly prepared 40% foods
14. only store that carries 38% what i want
15. good sale/coupon items 37% in store ad/circular
16. customer loyalty card 32% program
Source:NielsenGlobalRetail-GrowthStrategiesSurvey,Q32015
assortment price/valueconvenience

8 Think Smaller for Big growTh
Indeed,inSoutheastAsia,aNielsenretailsalesanalysisof16categories
insixmarketsshowsdollarsalesinthepremiumsegmentgrewat
twicetherate(21%)ofthevalueandmainstreamtiers(10%and8%,
respectively)betweenOctober2012and2014.Chinashowsasimilar
trend,withevengreatergrowth(23%)inthepremiumtier.Andinmany
places,theretailersthatarewinningarepositionedatoppositeends
ofthepricespectrum.Whilemanyconsumersremainpriceconscious,
drivinggrowthinvaluechannels,someconsumersaretradingup
forwhattheyperceivetobeadditionalvalueandquality.IntheU.S.,
aNielsenanalysisofsupermarketvaluesalesrevealsthattwoniche
retailersappealingtoverydifferentcustomerbases—discountersand
natural/gourmetsupermarketchains—areexpandingstorecountsand
grabbingsharefrommainstreamsupermarkets.Between2015and
2020,growthintheseoutlets(projectedat2.6%and6.8%annually,
respectively)isexpectedtooutpacethatofmainstreamsupermarkets
(projectedat1.4%annually).Together,thesetrendshaveputpressure
onbig-boxretailers.

9Copyright © 2016 The Nielsen Company
49%
49%56
% 59%
56%
44% 48
%
45%
59%
54%
45% 48
%
47%
58%
55%
36%
36%
32%
45%
46%
33% 35%
28%
30% 34
%
PrICe-relAted AttrIbuteS Are MoSt IMPortANt IN lAtIN AMerICA ANd North AMerICA
PerCeNtAGe Who SAy AttrIbute IS hIGhly INFlueNtIAl IN theIr deCISIoN to ShoP At A PArtICulAr retAIler
asia-Pacific euroPe africa/middLe east Latin america north america
Source:NielsenGlobalRetail-GrowthStrategiesSurvey,Q32015
there were Good saLe/couPon items in Last week’s store ad/circuLar
the store has Great saLes and Promotions
the store has a customer LoyaLty card ProGram
i discover Good vaLue for my money when shoPPinG there
the store has the Lowest Prices overaLL
10 Think Smaller for Big growTh
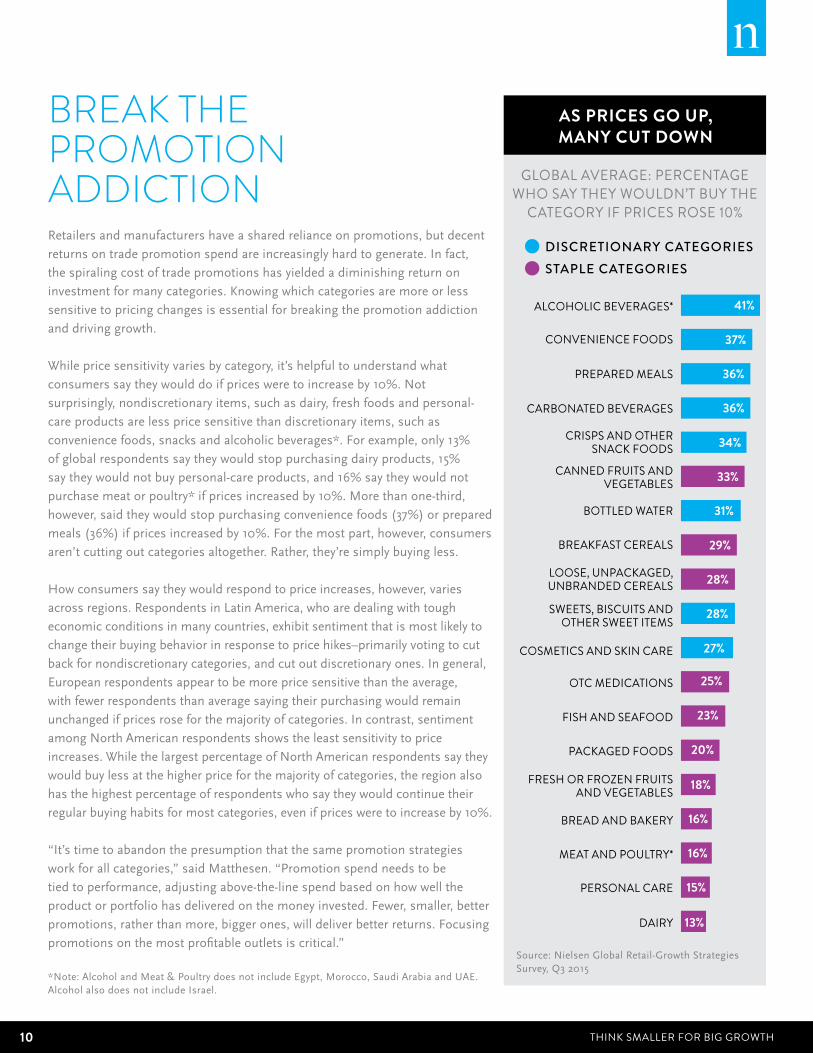
AS PrICeS Go uP, MANy Cut doWN
global average: percentage who say they wouldn’t buy the
category if prices rose 10%
Break The promoTion addicTion Retailersandmanufacturershaveasharedrelianceonpromotions,butdecent
returnsontradepromotionspendareincreasinglyhardtogenerate.Infact,
thespiralingcostoftradepromotionshasyieldedadiminishingreturnon
investmentformanycategories.Knowingwhichcategoriesaremoreorless
sensitivetopricingchangesisessentialforbreakingthepromotionaddiction
anddrivinggrowth.
Whilepricesensitivityvariesbycategory,it’shelpfultounderstandwhat
consumerssaytheywoulddoifpricesweretoincreaseby10%.Not
surprisingly,nondiscretionaryitems,suchasdairy,freshfoodsandpersonal-
careproductsarelesspricesensitivethandiscretionaryitems,suchas
conveniencefoods,snacksandalcoholicbeverages*.Forexample,only13%
ofglobalrespondentssaytheywouldstoppurchasingdairyproducts,15%
saytheywouldnotbuypersonal-careproducts,and16%saytheywouldnot
purchasemeatorpoultry*ifpricesincreasedby10%.Morethanone-third,
however,saidtheywouldstoppurchasingconveniencefoods(37%)orprepared
meals(36%)ifpricesincreasedby10%.Forthemostpart,however,consumers
aren’tcuttingoutcategoriesaltogether.Rather,they’resimplybuyingless.
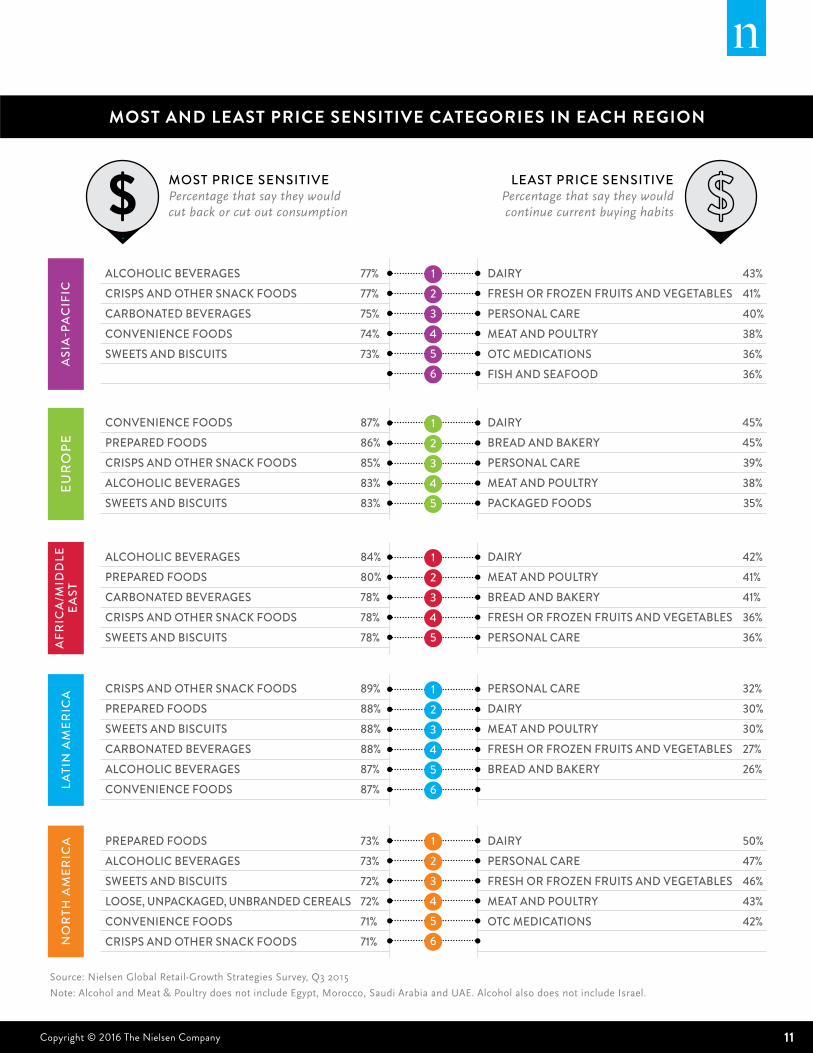
Howconsumerssaytheywouldrespondtopriceincreases,however,varies
acrossregions.RespondentsinLatinAmerica,whoaredealingwithtough
economicconditionsinmanycountries,exhibitsentimentthatismostlikelyto
changetheirbuyingbehaviorinresponsetopricehikes–primarilyvotingtocut
backfornondiscretionarycategories,andcutoutdiscretionaryones.Ingeneral,
Europeanrespondentsappeartobemorepricesensitivethantheaverage,
withfewerrespondentsthanaveragesayingtheirpurchasingwouldremain
unchangedifpricesroseforthemajorityofcategories.Incontrast,sentiment
amongNorthAmericanrespondentsshowstheleastsensitivitytoprice
increases.WhilethelargestpercentageofNorthAmericanrespondentssaythey
wouldbuylessatthehigherpriceforthemajorityofcategories,theregionalso
hasthehighestpercentageofrespondentswhosaytheywouldcontinuetheir
regularbuyinghabitsformostcategories,evenifpricesweretoincreaseby10%.
“It’stimetoabandonthepresumptionthatthesamepromotionstrategies
workforallcategories,”saidMatthesen.“Promotionspendneedstobe
tiedtoperformance,adjustingabove-the-linespendbasedonhowwellthe
productorportfoliohasdeliveredonthemoneyinvested.Fewer,smaller,better
promotions,ratherthanmore,biggerones,willdeliverbetterreturns.Focusing
promotionsonthemostprofitableoutletsiscritical.”Source:NielsenGlobalRetail-GrowthStrategiesSurvey,Q32015
*Note:AlcoholandMeat&PoultrydoesnotincludeEgypt,Morocco,SaudiArabiaandUAE.AlcoholalsodoesnotincludeIsrael.
discretionary cateGoriesstaPLe cateGories
alcoholic beverages*
loose, unpackaged, unbranded cereals
meat and poultry*
crisps and other snack foods
fish and seafood
prepared meals
cosmetics and skin care
dairy
bottled water
fresh or frozen fruits and vegetables
convenience foods
sweets, biscuits and other sweet items
personal care
canned fruits and vegetables
packaged foods
carbonated beverages
otc medications
breakfast cereals
bread and bakery
41%
36%
31%
28%
23%
37%
34%
29%
27%
20%
18%
16%
16%
15%
13%
36%
33%
28%
25%
11Copyright © 2016 The Nielsen Company
MoSt ANd leASt PrICe SeNSItIve CAteGorIeS IN eACh reGIoN
Least Price sensitivePercentage that say they would continue current buying habits
most Price sensitivePercentage that say they would cut back or cut out consumption
Source:NielsenGlobalRetail-GrowthStrategiesSurvey,Q32015
Note:AlcoholandMeat&PoultrydoesnotincludeEgypt,Morocco,SaudiArabiaandUAE.AlcoholalsodoesnotincludeIsrael.
asi
a-P
ac
ific
dairy 43%fresh or frozen fruits and veGetaBLes 41%PersonaL care 40%meat and PouLtry 38%otc medications 36%fish and seafood 36%
aLcohoLic BeveraGes 77%crisPs and other snack foods 77%carBonated BeveraGes 75%convenience foods 74%sweets and Biscuits 73%
1
3
5
2
4
6
Lati
n a
mer
ica crisPs and other snack foods 89%
PrePared foods 88%sweets and Biscuits 88%carBonated BeveraGes 88%aLcohoLic BeveraGes 87%convenience foods 87%
PersonaL care 32%dairy 30%meat and PouLtry 30%fresh or frozen fruits and veGetaBLes 27%Bread and Bakery 26%
1
3
5
2
4
6
afr
ica
/mid
dLe
ea
st
aLcohoLic BeveraGes 84%PrePared foods 80%carBonated BeveraGes 78%crisPs and other snack foods 78%sweets and Biscuits 78%
dairy 42%meat and PouLtry 41%Bread and Bakery 41%fresh or frozen fruits and veGetaBLes 36%PersonaL care 36%
1
3
5
2
4
eur
oPe
convenience foods 87%PrePared foods 86%crisPs and other snack foods 85%aLcohoLic BeveraGes 83%sweets and Biscuits 83%
dairy 45%Bread and Bakery 45%PersonaL care 39%meat and PouLtry 38% PackaGed foods 35%
1
3
5
2
4
no
rth
am
eric
a PrePared foods 73%aLcohoLic BeveraGes 73%sweets and Biscuits 72%Loose, unPackaGed, unBranded cereaLs 72%convenience foods 71%crisPs and other snack foods 71%
dairy 50%PersonaL care 47%fresh or frozen fruits and veGetaBLes 46%meat and PouLtry 43%otc medications 42%
1
3
5
2
4
6
12 Think Smaller for Big growTh
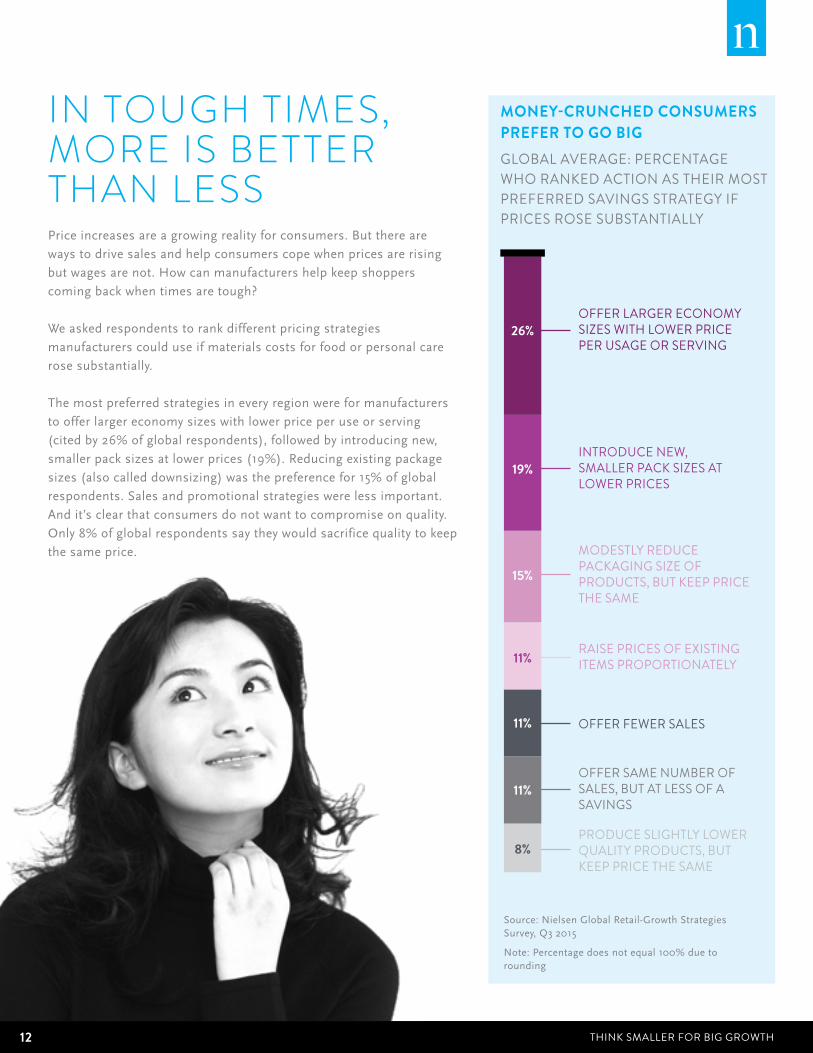
in Tough TimeS, more iS BeTTer Than leSS Priceincreasesareagrowingrealityforconsumers.Butthereare
waystodrivesalesandhelpconsumerscopewhenpricesarerising
butwagesarenot.Howcanmanufacturershelpkeepshoppers
comingbackwhentimesaretough?
Weaskedrespondentstorankdifferentpricingstrategies
manufacturerscoulduseifmaterialscostsforfoodorpersonalcare
rosesubstantially.
Themostpreferredstrategiesineveryregionwereformanufacturers
toofferlargereconomysizeswithlowerpriceperuseorserving
(citedby26%ofglobalrespondents),followedbyintroducingnew,
smallerpacksizesatlowerprices(19%).Reducingexistingpackage
sizes(alsocalleddownsizing)wasthepreferencefor15%ofglobal
respondents.Salesandpromotionalstrategieswerelessimportant.
Andit’sclearthatconsumersdonotwanttocompromiseonquality.
Only8%ofglobalrespondentssaytheywouldsacrificequalitytokeep
thesameprice.
MoNey-CruNChed CoNSuMerS PreFer to Go bIGglobal average: percentage who ranked action as their most preferred savings strategy if prices rose substantially
Source:NielsenGlobalRetail-GrowthStrategiesSurvey,Q32015
Note:Percentagedoesnotequal100%duetorounding
offer larger economy sizes with lower price per usage or serving
introduce new, smaller pack sizes at lower prices
modestly reduce packaging size of products, but keep price the same
raise prices of existing items proportionately
offer fewer sales
offer same number of sales, but at less of a savings
produce slightly lower quality products, but keep price the same
26%
19%
15%
11%
11%
11%
8%
13Copyright © 2016 The Nielsen Company
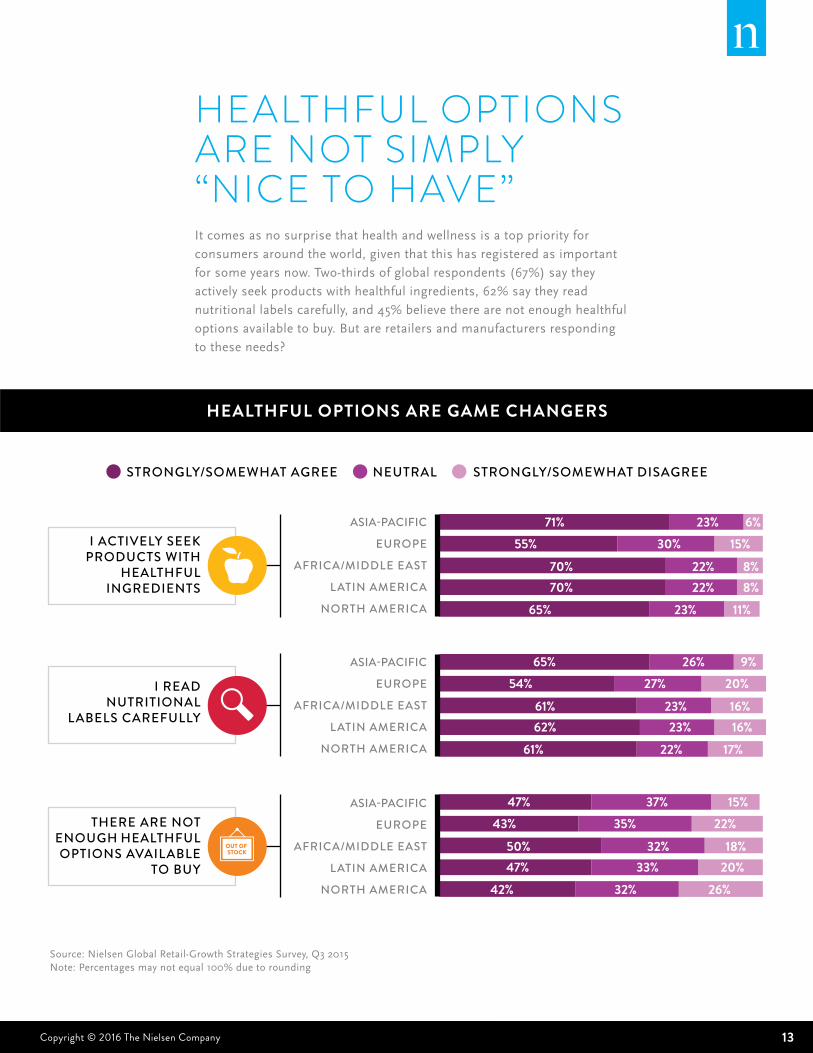
healThful opTionS are noT Simply “nice To have” Itcomesasnosurprisethathealthandwellnessisatoppriorityfor
consumersaroundtheworld,giventhatthishasregisteredasimportant
forsomeyearsnow.Two-thirdsofglobalrespondents(67%)saythey
activelyseekproductswithhealthfulingredients,62%saytheyread
nutritionallabelscarefully,and45%believetherearenotenoughhealthful
optionsavailabletobuy.Butareretailersandmanufacturersresponding
totheseneeds?
heAlthFul oPtIoNS Are GAMe ChANGerS
stronGLy/somewhat aGree neutraL stronGLy/somewhat disaGree
Source:NielsenGlobalRetail-GrowthStrategiesSurvey,Q32015Note:Percentagesmaynotequal100%duetorounding
asia-Pacific
euroPe
africa/middLe east
Latin america
north america
i read nutritionaL
LaBeLs carefuLLy
asia-Pacific
euroPe
africa/middLe east
Latin america
north america
i activeLy seek Products with
heaLthfuL inGredients
asia-Pacific
euroPe
africa/middLe east
Latin america
north america
65%54%
61%62%
61%
26%27%
23%23%
22%
9%20%16%16%
17%
71%55%
70%70%
65%
23%30%
22%22%
23%
6%15%
8%8%
11%
47%43%
50%47%
42%
37%35%
32%33%
32%
15%22%
18%20%
26%
there are not enouGh heaLthfuL oPtions avaiLaBLe
to Buy
14 Think Smaller for Big growTh
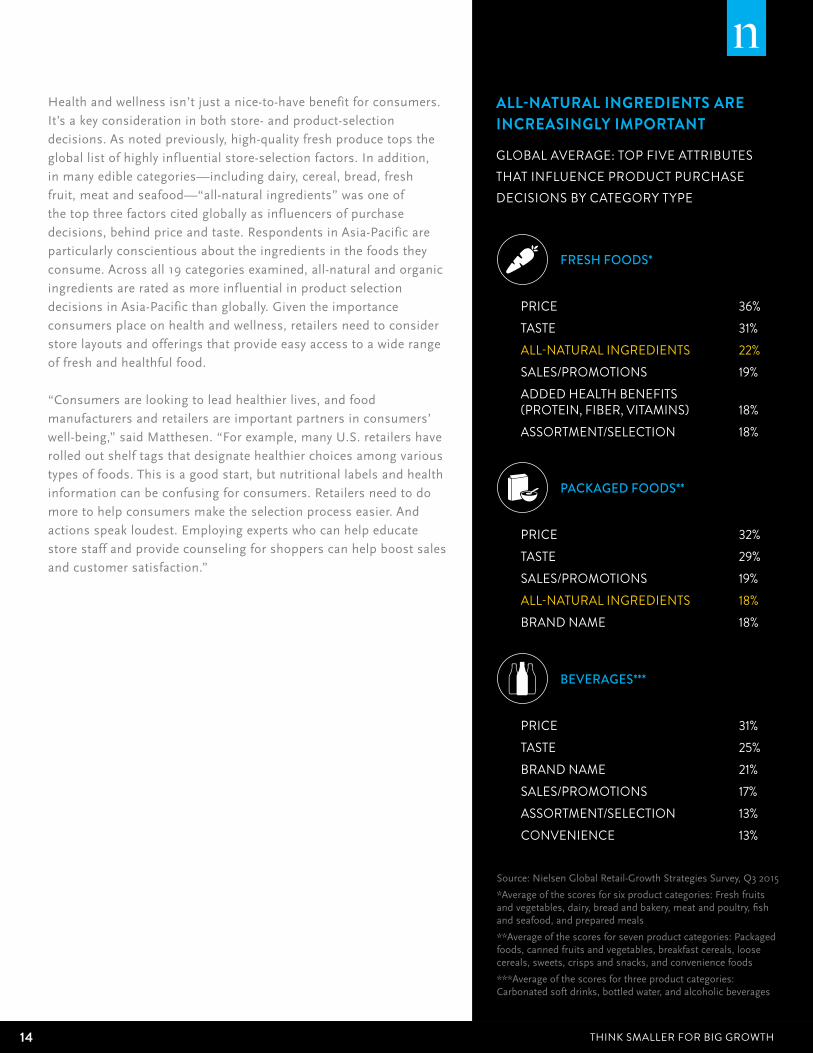
Healthandwellnessisn’tjustanice-to-havebenefitforconsumers.
It’sakeyconsiderationinbothstore-andproduct-selection
decisions.Asnotedpreviously,high-qualityfreshproducetopsthe
globallistofhighlyinfluentialstore-selectionfactors.Inaddition,
inmanyediblecategories—includingdairy,cereal,bread,fresh
fruit,meatandseafood—“all-naturalingredients”wasoneof
thetopthreefactorscitedgloballyasinfluencersofpurchase
decisions,behindpriceandtaste.RespondentsinAsia-Pacificare
particularlyconscientiousabouttheingredientsinthefoodsthey
consume.Acrossall19categoriesexamined,all-naturalandorganic
ingredientsareratedasmoreinfluentialinproductselection
decisionsinAsia-Pacificthanglobally.Giventheimportance
consumersplaceonhealthandwellness,retailersneedtoconsider
storelayoutsandofferingsthatprovideeasyaccesstoawiderange
offreshandhealthfulfood.
“Consumersarelookingtoleadhealthierlives,andfood
manufacturersandretailersareimportantpartnersinconsumers’
well-being,”saidMatthesen.“Forexample,manyU.S.retailershave
rolledoutshelftagsthatdesignatehealthierchoicesamongvarious
typesoffoods.Thisisagoodstart,butnutritionallabelsandhealth
informationcanbeconfusingforconsumers.Retailersneedtodo
moretohelpconsumersmaketheselectionprocesseasier.And
actionsspeakloudest.Employingexpertswhocanhelpeducate
storestaffandprovidecounselingforshopperscanhelpboostsales
andcustomersatisfaction.”
All-NAturAl INGredIeNtS Are INCreASINGly IMPortANt
global average: top five attributes that influence product purchase decisions by category type
fresh foods*
PackaGed foods**
BeveraGes***
price 36%taste 31%all-natural ingredients 22%sales/promotions 19%added health benefits (protein, fiber, vitamins) 18%assortment/selection 18%
price 32%taste 29%sales/promotions 19%all-natural ingredients 18%brand name 18%
price 31%taste 25%brand name 21%sales/promotions 17%assortment/selection 13%convenience 13%
Source:NielsenGlobalRetail-GrowthStrategiesSurvey,Q32015
*Averageofthescoresforsixproductcategories:Freshfruitsandvegetables,dairy,breadandbakery,meatandpoultry,fishandseafood,andpreparedmeals
**Averageofthescoresforsevenproductcategories:Packagedfoods,cannedfruitsandvegetables,breakfastcereals,loosecereals,sweets,crispsandsnacks,andconveniencefoods
***Averageofthescoresforthreeproductcategories:Carbonatedsoftdrinks,bottledwater,andalcoholicbeverages
15Copyright © 2016 The Nielsen Company
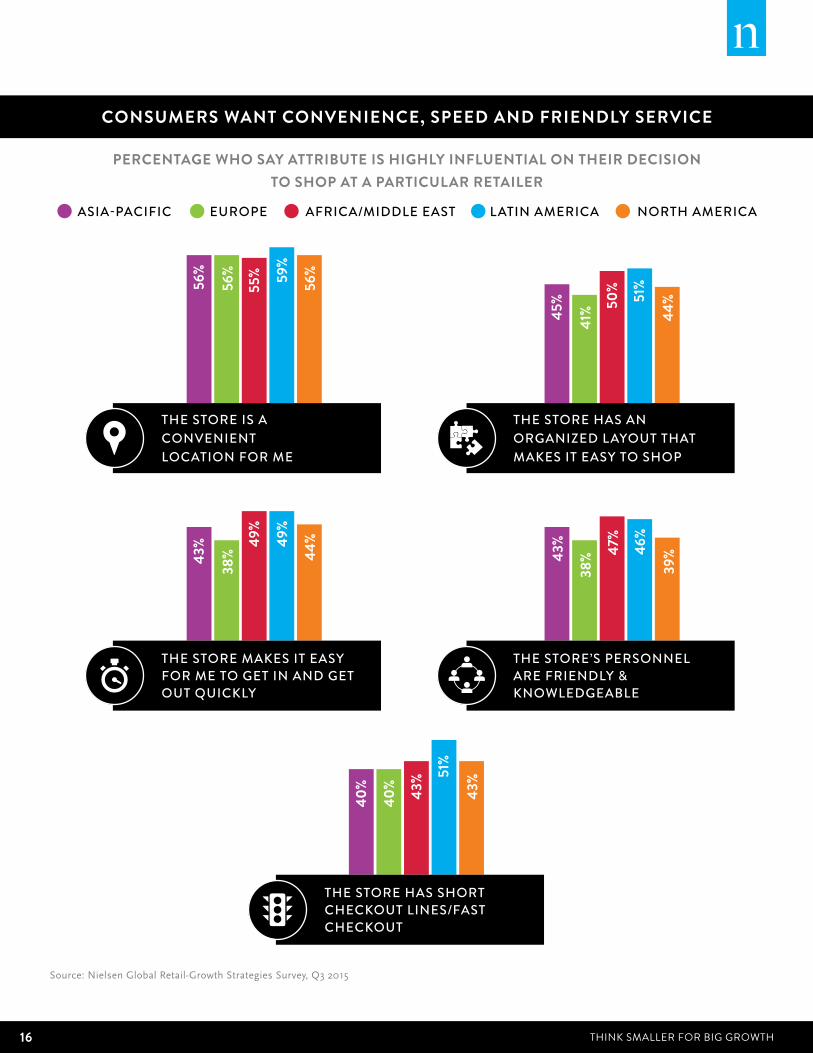
caTer To convenience Withlifemovingathyperspeed,consumerscraveconveniencefor
everythingfromchoosingthestorestheyshopintobuyingthefoods
theyeat.Fifty-sixpercentofglobalrespondentssayaconvenient
locationishighlyinfluentialintheirdecisiontoshopataparticular
retailer.Forty-fivepercentofglobalrespondentssaytheirstoreselection
decisionishighlyinfluencedbyanorganizedlayoutthatmakesiteasy
toshop;slightlyfeweridentifytheabilitytogetinandoutquickly(43%)
orfastcheckout(41%)ashighlyinfluential.Theseattributesaremore
influentialinLatinAmericaandAfrica/MiddleEastthanglobally.
Thisconveniencemind-sethasclearimplicationsforconsumers’eating
habits—andforgroceryretailers.On-the-goconsumersareeatingfewer
mealsathomeandinsteadlookingforconvenientmealsolutionsthatfit
intotheirdailyroutines.TheU.S.marketisaprimeexampleofhowthe
conveniencetrendistransformingwhatandwherefoodispurchased.
AccordingtodatafromtheU.S.CommerceDepartment,spendingat
restaurantsandbarseclipsedthatatgrocerystoresforthefirsttime
everinMarch2015.AnddatafromNielsenPerishablesGroupinthe
U.S.suggeststhat,eveningrocerystores,shoppersareincreasingly
choosingmealsandmealcomponentsoveringredients.Deli-prepared
foods,suchassoups,sushiandpizza,aredoingparticularlywell,with
valuesalesrising7%overthe52weeksendingFebruary2016.Having
avarietyoffreshlypreparedfoodsisahighlyinfluentialstore-selection
factorfor40%ofglobalrespondents,whileonly15%sayithasno
influenceonwheretheyshop.
“Affordable,qualitymealoptionsandin-storediningexperiencescan
beanimportantdifferentiatorforwhereconsumersdecidetoshop,”
saidMatthesen.“Competitioninthisspaceisextremelytough,however,
asretailersmustcontendwithnotonlytheirfellowgrocersand
restaurants,butnewentrantssuchasmealdeliveryservicesthatsend
mealingredients,inpremeasuredproportions,straighttoconsumers’
doorsteps.Tostandapart,retailersmustidentifyandfocusonunmet
needsorunderservedconsumersegments,suchasthepremium
segment,health-consciousshoppers,orseniorsandsmallhouseholds.
Andtheyshouldhighlightthesebenefitsintheirmarketingefforts—for
example,within-storetastingsandendcapdisplaysorbyhighlighting
themealoftheweekinweeklycirculars.”
16 Think Smaller for Big growTh
56%
55%
56% 59
%
56%
45% 50
%
41%
51%
44%
43% 49
%
38%
49%
44%
43% 47%
38% 46
%
39%
40% 43%
40%
51%
43%
CoNSuMerS WANt CoNveNIeNCe, SPeed ANd FrIeNdly ServICe
PerCeNtAGe Who SAy AttrIbute IS hIGhly INFlueNtIAl oN theIr deCISIoN to ShoP At A PArtICulAr retAIler
asia-Pacific euroPe africa/middLe east Latin america north america
Source:NielsenGlobalRetail-GrowthStrategiesSurvey,Q32015
the store is a convenient Location for me
the store has an orGanized Layout that makes it easy to shoP
the store makes it easy for me to Get in and Get out quickLy
the store’s PersonneL are friendLy & knowLedGeaBLe
the store has short checkout Lines/fast checkout
17Copyright © 2016 The Nielsen Company
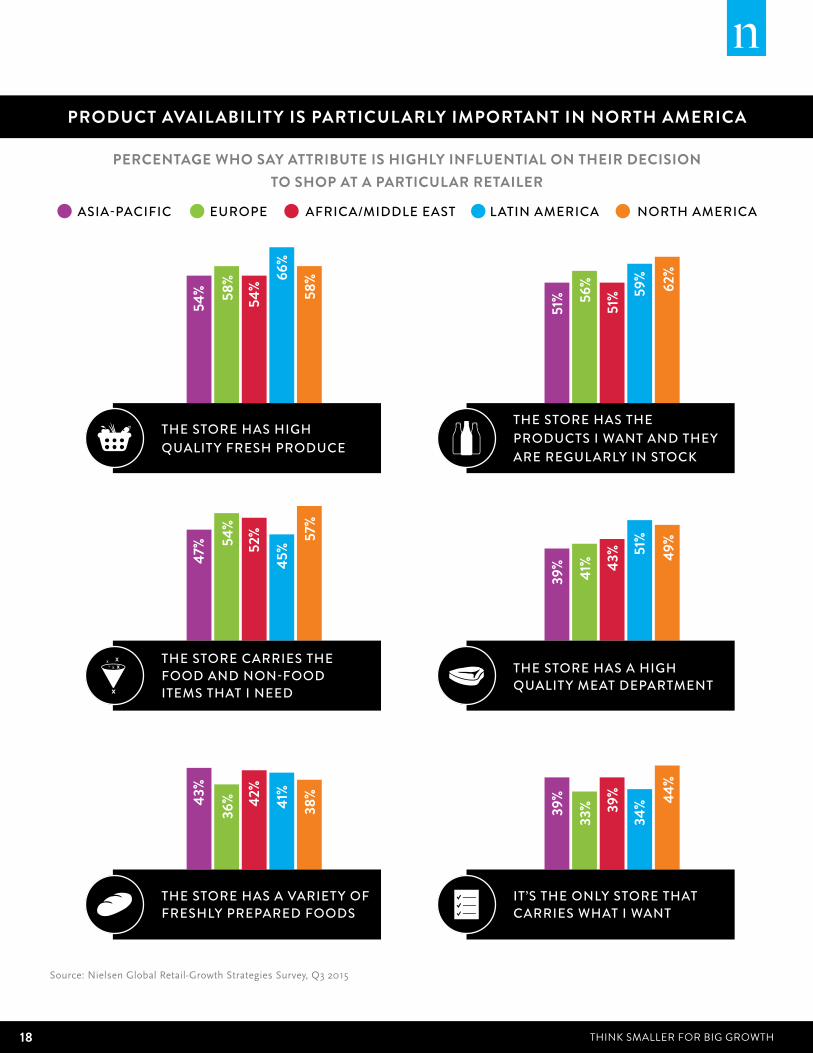
Supply meeTS Specific demand Theconceptofsupplyanddemandissimpletounderstandyetcan
bedifficulttoachieve—especiallywhenconsumerchoiceisseemingly
limitlessanddemandforspecificproductsisgreaterthaneveratthe
sametime.Butassortmentisoneofthetopthreeinfluentialreasons
whyconsumerspickaparticularstoretoshop.Infact,morethanhalf
ofglobalrespondents(54%)saytheirstore-selectiondecisionishighly
influencedbywhetherthestorehastheproductstheywantregularly
instock,andslightlyfewer(50%)saytheyshopataparticularretailer
becausethestorecarriesthefoodandnonfooditemstheywant.Both
oftheseattributesareratedasmoreinfluentialinNorthAmericathan
globally.Inaddition,nearlyfourin10globalrespondents(38%)saythey
shopataparticularretailerbecauseitistheonlystorethatcarrieswhat
theywant.Onceagain,thisismoreinfluentialinNorthAmerica(44%)
thanglobally.
Carryingtherightselectionofproducts,however,isacarefulbalancing
act,asconsumersarelookingformorethanjusttheirfavoritego-to
products.Fifty-onepercentofglobalrespondentssaytheyoftentrynew
brandsbecausetheylikevarietyandgetboredwiththesameoldthings.
ThissentimentisparticularlystronginLatinAmerica(56%),while
Europetrailstheglobalaverage(42%).Butsometimesmoreissimply
toomuch.Forexample,respondentsinAfrica/MiddleEastandAsia-
Pacificaremorelikelytobelievetherearetoomanychoicesonstore
shelves(60%and58%,respectively)thanthoseinEurope(44%)and
NorthAmerica(41%).
“Doneright,assortmentcanhelpdrivegrowth,butasconsumers
demandhyper-localization,retailersneedtorethinkexistingstrategies,”
saidMatthesen.“Assortmentdecisionsneedtobeguidedmorebythe
shoppingmissionandconsumerdemand.Thatis,retailersmustshift
fromapushtoapullapproachbymakingiteasierforconsumerswith
differentmissionstofulfilltheirtrippurpose.It’shardtobeeverything
toeveryone,butyoucanenhance‘shopability’bymovingessentialsto
thefrontofthestoretobetterservequick-trip,grab-and-goshoppers.”
Retailerscanreduceseeminglyinfinitechoicesbycarefullycurating
selectionsbasedonconsumers’interestsandpreviouspurchasing
behaviors.Thispracticeisrelativelycommononline(thoughthereis
certainlyroomforimprovement),butretailersneedtodoabetterjob
ofleveragingdigitaltoolssuchasbeaconsorinteractivescreensto
guideconsumerstorelevantcategoriesorproductsandelicitdesired
shoppingbehaviorsinstore.
18 Think Smaller for Big growTh
54%
54%58% 66
%
58%
51%
51%56
% 59%
62%
47% 52
%54%
45%
57%
39% 43
%
41%
51%
49%
43%
42%
36% 41
%
38%
39%
39%
33%
34% 44
%
ProduCt AvAIlAbIlIty IS PArtICulArly IMPortANt IN North AMerICA
PerCeNtAGe Who SAy AttrIbute IS hIGhly INFlueNtIAl oN theIr deCISIoN to ShoP At A PArtICulAr retAIler
asia-Pacific euroPe africa/middLe east Latin america north america
Source:NielsenGlobalRetail-GrowthStrategiesSurvey,Q32015
the store has hiGh quaLity fresh Produce
the store has the Products i want and they are reGuLarLy in stock
the store carries the food and non-food items that i need
the store has a hiGh quaLity meat dePartment
the store has a variety of freshLy PrePared foods
it’s the onLy store that carries what i want
19Copyright © 2016 The Nielsen Company
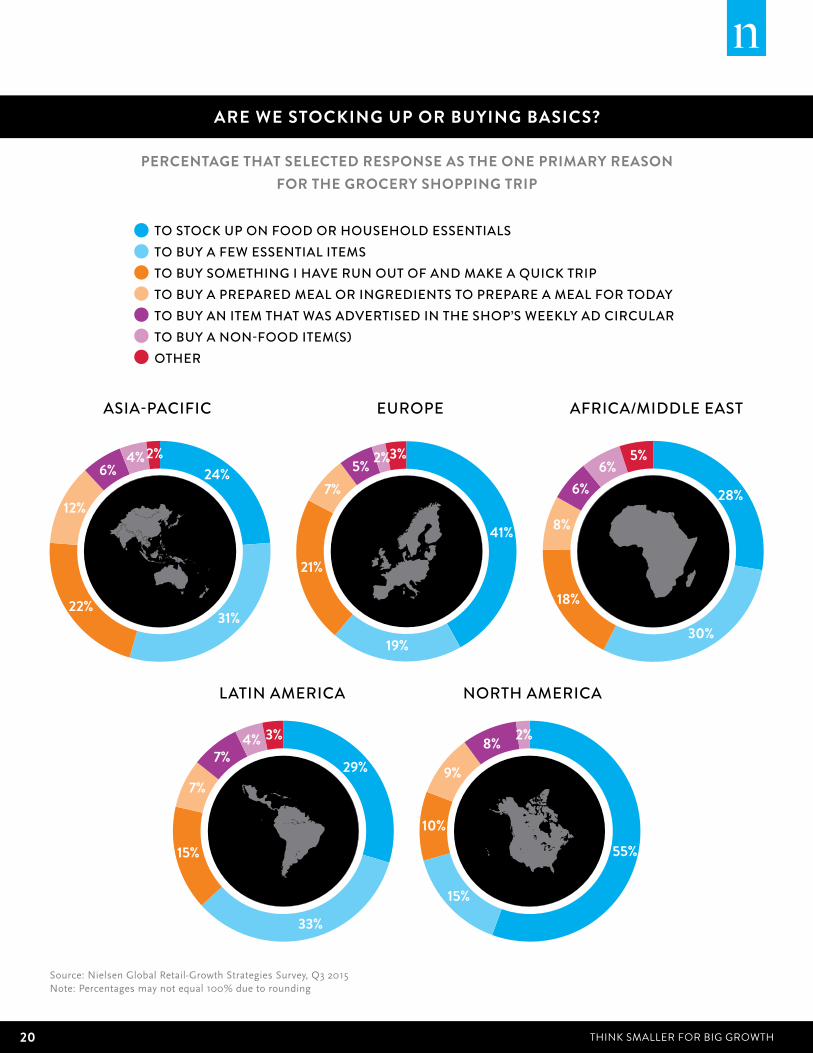
proximiTy reTailing: Buying Big or BaSicTrippurposelargelydependsonwhereyoulive.Ifyouliveina
developedmarketinNorthAmericaandEurope,stock-uptripsarethe
primaryreasonforshopping—byawidemargin.Fifty-fivepercentof
NorthAmericanrespondentssaythey’reshoppingprimarilytostock
uponfoodandhouseholdessentials,40percentagepointsabovethe
next-closestoption(buyingafewessentials).InEurope,thegapis20
percentagepoints(41%arestockingup,while21%aremakingaquick
triptofillanimmediateneed).
InthelargelydevelopingmarketsofLatinAmerica,Asia-Pacificand
Africa/MiddleEast,thereasonsforshoppingaremixed.Inallthree
regions,thelargestpercentagesaythey’reshoppingforafewessential
items(33%,31%and30%,respectively),butnearlyasmany(29%,24%
and28%,respectively)saythey’restockingup.
Thesedifferencesaredriveninpartbydifferencesinhouseholdstorage
space,transportationaccessandincome.EuropeandNorthAmerica
havesomeofthehighestaveragehouseholdincomesintheworld,and
manyconsumersintheseregionscanaffordtostockuponhousehold
essentials,cantransportthepurchaseswitheaseandhaveample
capacityforstorage,whileconsumersindevelopingmarketstypically
shopfortheday,buyingtheproductsthatareabsolutelyessential.
“Theidealformatdependsontheshoppers’missionandtheir
preferences,andretailerflexibilityiscritical,”saidMatthesen.“Store
formatsaren’tshoppedthesameway;thereissignificantvariationeven
withinsimilarlysizedformats.Therefore,retailersmustunderstand
whichattributesareconsideredessentialforeachformatandexcelin
deliveringonthosethatdriveequity.Oncethey’vemasteredthebasics,
theycanstrivefordifferentiation.Andasconsumers’needschange,
retailersmustreevaluateandreinventtostayrelevant.”
20 Think Smaller for Big growTh
Are We StoCkING uP or buyING bASICS?
PerCeNtAGe thAt SeleCted reSPoNSe AS the oNe PrIMAry reASoN For the GroCery ShoPPING trIP
to stock uP on food or househoLd essentiaLsto Buy a few essentiaL itemsto Buy somethinG i have run out of and make a quick triPto Buy a PrePared meaL or inGredients to PrePare a meaL for todayto Buy an item that was advertised in the shoP’s weekLy ad circuLarto Buy a non-food item(s)other
Source:NielsenGlobalRetail-GrowthStrategiesSurvey,Q32015Note:Percentagesmaynotequal100%duetorounding
24%
31%22%
12%
6%4%2%
29%
33%
15%
7%
7%4% 3%
55%
15%
10%
9%
8% 2%
41%
19%
21%
7%5% 2%3%
28%
30%
18%
8%
6%6%
5%
asia-Pacific
Latin america
euroPe
north america
africa/middLe east
21Copyright © 2016 The Nielsen Company
find pockeTS of unSaTiSfied demandConsumersareneversatisfiedwiththestatusquo,asthegrowth
ofnicheretailingoptionsandpremiumproductofferingsclearly
demonstrates.Thewaytostayrelevantandconnectedtoever-changing
consumerdemandistocontinuallylisten,learnandadapttoprovide
theproductsandservicesthatwillkeepconsumerssatisfiedandcoming
backtimeaftertime.Notallin-storeservicesareequallyvalued,so
understandingwheretherearepocketsofunsatisfieddemandcanhelp
buildtheservicesthatconsumerswant.
Whichonesaremostpopularwithconsumers?
Globally,thein-storeservicesmostwidelyavailableandusedare
convenientoptionsthatcatertoon-the-golifestyles.Roughlyfourin
10globalrespondentssaytheyusein-storebanking(42%),fastfood
(40%),preparedfood(40%)orpharmacy(39%)services.Inaddition,
36%saytheyusein-storecoffeeservices.Andaboutone-fifthof
consumerswouldusetheseservicesiftheywereavailable.
Otherservicesthatarelesswidelyavailableandused—suchascooking
classes(17%),healthclinics(27%),beautycare(27%)andpostal
services(29%)—havestrongpotential.Aboutoneinfourrespondents
saytheywouldusetheseservicesiftheywereavailable.
“Offeringmultiplefunctionsunderoneroofissmartastheadditionof
newin-storeservicesmayhelpdrawconsumersin,prolongtheirtime
spentinstoreandencouragerepeatvisits,”saidMatthesen.“Andthey
mayhelpretailersmaximizereturnsontheirreal-estateinvestmentsas
theywilllikelyhaveexcesssquarefeet.Insomecases,however,itmay
bebetterforretailerstopartnerwithanexperttoprovidetheseservices
ratherthantrytodoitthemselves.”
22 Think Smaller for Big growTh
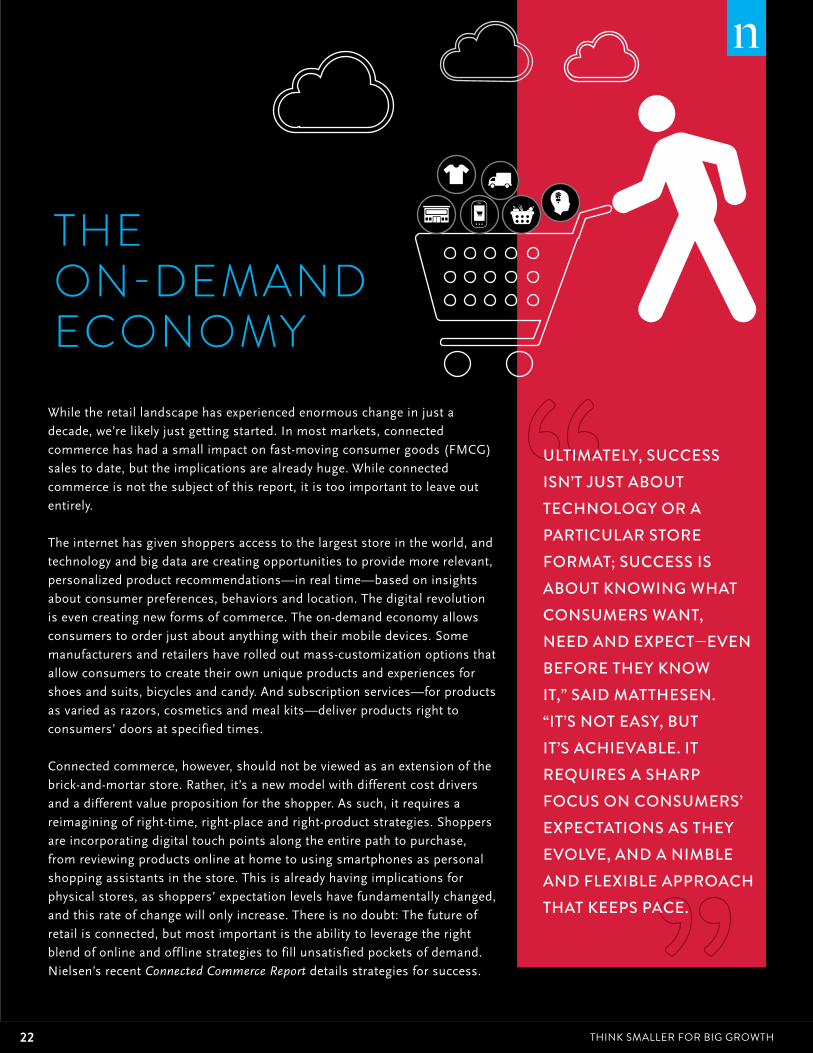
Whiletheretaillandscapehasexperiencedenormouschangeinjusta
decade,we’relikelyjustgettingstarted.Inmostmarkets,connected
commercehashadasmallimpactonfast-movingconsumergoods(FMCG)
salestodate,buttheimplicationsarealreadyhuge.Whileconnected
commerceisnotthesubjectofthisreport,itistooimportanttoleaveout
entirely.
Theinternethasgivenshoppersaccesstothelargeststoreintheworld,and
technologyandbigdataarecreatingopportunitiestoprovidemorerelevant,
personalizedproductrecommendations—inrealtime—basedoninsights
aboutconsumerpreferences,behaviorsandlocation.Thedigitalrevolution
isevencreatingnewformsofcommerce.Theon-demandeconomyallows
consumerstoorderjustaboutanythingwiththeirmobiledevices.Some
manufacturersandretailershaverolledoutmass-customizationoptionsthat
allowconsumerstocreatetheirownuniqueproductsandexperiencesfor
shoesandsuits,bicyclesandcandy.Andsubscriptionservices—forproducts
asvariedasrazors,cosmeticsandmealkits—deliverproductsrightto
consumers’doorsatspecifiedtimes.
Connectedcommerce,however,shouldnotbeviewedasanextensionofthe
brick-and-mortarstore.Rather,it’sanewmodelwithdifferentcostdrivers
andadifferentvaluepropositionfortheshopper.Assuch,itrequiresa
reimaginingofright-time,right-placeandright-productstrategies.Shoppers
areincorporatingdigitaltouchpointsalongtheentirepathtopurchase,
fromreviewingproductsonlineathometousingsmartphonesaspersonal
shoppingassistantsinthestore.Thisisalreadyhavingimplicationsfor
physicalstores,asshoppers’expectationlevelshavefundamentallychanged,
andthisrateofchangewillonlyincrease.Thereisnodoubt:Thefutureof
retailisconnected,butmostimportantistheabilitytoleveragetheright
blendofonlineandofflinestrategiestofillunsatisfiedpocketsofdemand.
Nielsen’srecentConnected Commerce Reportdetailsstrategiesforsuccess.
The on-demand economy
uLtimateLy, success isn’t Just aBout technoLoGy or a ParticuLar store format; success is aBout knowinG what consumers want, need and exPect—even Before they know it,” said matthesen. “it’s not easy, But it’s achievaBLe. it requires a sharP focus on consumers’ exPectations as they evoLve, and a nimBLe and fLexiBLe aPProach that keePs Pace.
23Copyright © 2016 The Nielsen Company
navigaTing The new reTail landScapeTheonlyconstantintheretailenvironmentischange.Asretailers
considerwheretogofromhere,thereareafewtruthstokeepinmind.
• Differentiationandafocusontheconsumerwilldrivegrowth.Theretaillandscapeisincrediblycrowded,andtechnologyhasgiven
consumersaccesstomoreinformationandgreaterpoweroverthe
shoppingexperiencethaneverbefore.Retailersmustgiveshoppers
areasontochoosethemovertheircompetitors,anditcan’tjust
beaboutprice.Todifferentiate,retailersmustevolveandchange
withtheneedstatesoftheircustomers—whetherit’sadigitaltool
thatmakesshoppingeasierormoreconvenientorastaffwithdeep
expertisethatcanhelpconsumersselectthebestproductfortheir
lifestyleandpreferences.Andthisprocessmustbeongoing,with
retailerscontinuouslymonitoringandadjustingtoevolvingneeds.
• Thinkingsmallcanyieldbigrewards.Consumersaredictatinghow,
whenandwheretheyshop.Andthey’reincreasinglylookingfor
controlnotjustovertheshoppingexperience,butoverthefeatures
oftheproductsandservices,too.We’vealreadyseensomebrands
experimentwithmasspersonalizationforshoes,computersand
otherproducts.Inthefuture,wemayseeconsumersmoredirectly
involvedintheproductdevelopmentandinnovationprocessas
somebrandsrelyoncrowdsourcingandcocreationtoaddvalue,
differentiatethemselvesandengenderloyalty.Greaterlocalization
isalsolikelyintermsofhowretailerscommunicatewithandmarket
toconsumers.Retailerscannowleveragevastamountsofdata
totailorrecommendationsandprovidemorerelevantadvertising
andoffers—deliveredinrealtime—basedonconsumers’past
purchasingbehavior,theirpreferencesandtheshoppingoccasion.
24 Think Smaller for Big growTh
• Theroleofthephysicalstorewillchange.Storesaren’tgoingtodisappearanytimesoon,buttheywillundergoadramatic
transformationase-commercegrowsandshopperexpectations
change.Retailersneedtoconsiderwhatrolephysicalstoreswill
playintheiromnichannelstrategyandhowtheycanusethem
tostrengthentheirofferingsanddelivervalueeachtrip.Someof
thekeyquestionsbrick-and-mortarretailersneedtocontemplate
includethefollowing:
• Howwillweoperateinahyperlocalizedworld?
• Howdowecreateameaningfulconnectionwithourshoppers?
Whatservicesorexperiencescanweprovidetodifferentiate
ourselvesandmakeconsumerswantourbrandversusjust
fulfillinganeed?
• AmImaximizingreturnonmyreal-estateinvestment,ordoI
needtoreassess(andpossiblyreduce)myfootprint?
• Willourchildrenorgrandchildrenfinditcustomarytowaitin
linetopay?
• Howdoesthelevelofserviceprovidedinstorecomparewith
thelevelsprovidedonline?
• Howcanwematchtheabundanceofchoiceavailableonline
withouttheburdenofinventories?
• Shouldstoresbecomepickuppointsforalle-commerce
deliveries?
• Howwillweoperatewithcompletepricetransparency,given
consumers’increasedaccesstoinformation?
• Analyticscanenablegrowth.Bigdatahasenormousimplications
formarketers,butitspotentialgoesbeyondprovidingrelevantads
andoffers.Ithasthepowertohelpretailerssolvetheirbiggest
businessproblemsandidentifypromisingopportunities.Winning
retailersleverageadvancedanalyticsandinvestsignificanthuman
andfinancialcapitalinthesecapabilities,usingdatatooptimize
assortment,inventoryandsupplychainsandtomakepricing
decisionsthatreducecostsandmaximizeprofitsinrealtime.
25Copyright © 2016 The Nielsen Company
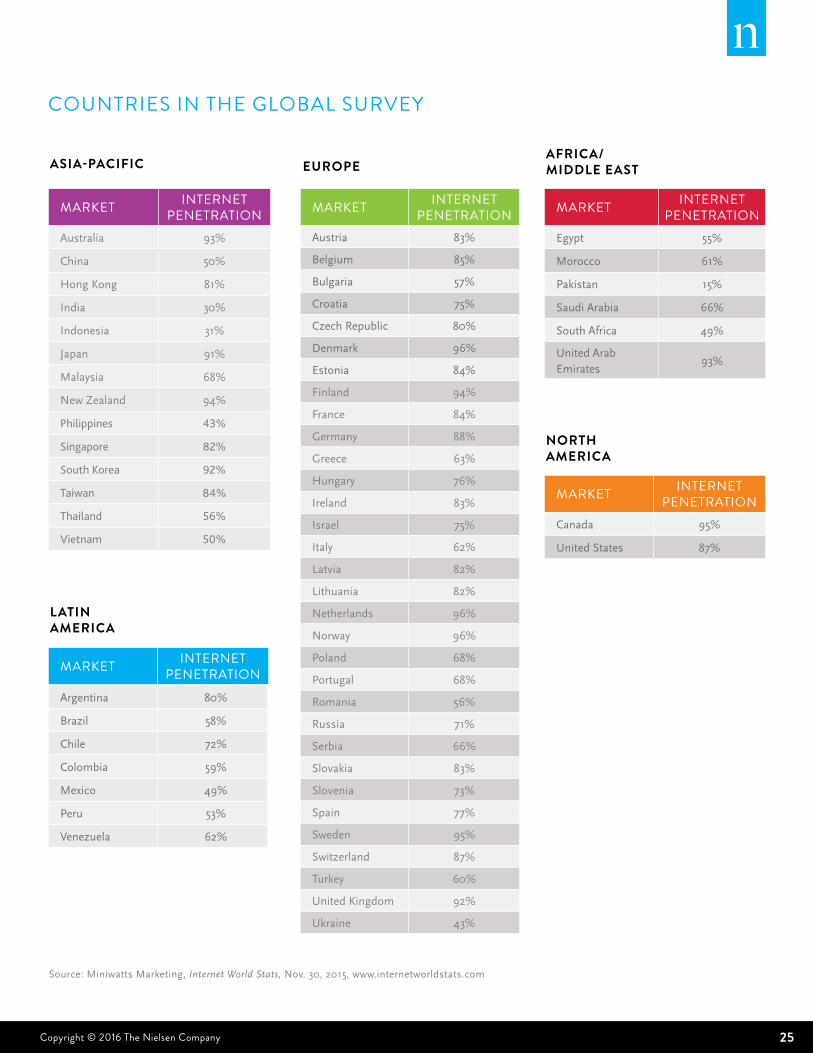
market internet penetration
Australia 93%
China 50%
HongKong 81%
India 30%
Indonesia 31%
Japan 91%
Malaysia 68%
NewZealand 94%
Philippines 43%
Singapore 82%
South Korea 92%
Taiwan 84%
Thailand 56%
Vietnam 50%
countries in the global survey
ASIA-PACIFIC
market internet penetration
Egypt 55%
Morocco 61%
Pakistan 15%
SaudiArabia 66%
SouthAfrica 49%
UnitedArabEmirates
93%
AFrICA/MIddle eASt
Source:MiniwattsMarketing,Internet World Stats,Nov.30,2015,www.internetworldstats.com
market internet penetration
Canada 95%
UnitedStates 87%
North AMerICA
euroPe
market internet penetration
Austria 83%
Belgium 85%
Bulgaria 57%
Croatia 75%
CzechRepublic 80%
Denmark 96%
Estonia 84%
Finland 94%
France 84%
Germany 88%
Greece 63%
Hungary 76%
Ireland 83%
Israel 75%
Italy 62%
Latvia 82%
Lithuania 82%
Netherlands 96%
Norway 96%
Poland 68%
Portugal 68%
Romania 56%
Russia 71%
Serbia 66%
Slovakia 83%
Slovenia 73%
Spain 77%
Sweden 95%
Switzerland 87%
Turkey 60%
UnitedKingdom 92%
Ukraine 43%
lAtIN AMerICA
market internet penetration
Argentina 80%
Brazil 58%
Chile 72%
Colombia 59%
Mexico 49%
Peru 53%
Venezuela 62%
26 Think Smaller for Big growTh
about the nielsen global survey TheNielsenGlobalRetail-GrowthStrategiesSurveywasconductedAug.
10–Sept.4,2015,andpolledmorethan30,000onlineconsumersin61
countriesthroughoutAsia-Pacific,Europe,LatinAmerica,theMiddle
East/AfricaandNorthAmerica.ThesampleincludesInternetuserswho
agreedtoparticipateinthissurveyandhasquotasbasedonageandsex
foreachcountry.ItisweightedtoberepresentativeofInternetconsumers
bycountry.Becausethesampleisbasedonthosewhoagreedto
participate,noestimatesoftheoreticalsamplingerrorcanbecalculated.
However,aprobabilitysampleofequivalentsizewouldhaveamargin
oferrorof±0.6%atthegloballevel.ThisNielsensurveyisbasedonly
onthebehaviorofrespondentswithonlineaccess.Internetpenetration
ratesvarybycountry.Nielsenusesaminimumreportingstandardof
60%Internetpenetrationoranonlinepopulationof10millionforsurvey
inclusion.
about nielsen NielsenHoldingsplc(NYSE:NLSN)isaglobalperformancemanagement
companythatprovidesacomprehensiveunderstandingofwhat
consumerswatchandbuy.Nielsen’sWatchsegmentprovidesmedia
andadvertisingclientswithTotalAudiencemeasurementservicesfor
alldevicesonwhichcontent—video,audioandtext—isconsumed.
TheBuysegmentoffersconsumerpackagedgoodsmanufacturers
andretailerstheindustry’sonlyglobalviewofretailperformance
measurement.ByintegratinginformationfromitsWatchandBuy
segmentsandotherdatasources,Nielsenalsoprovidesitsclientswith
analyticsthathelpimproveperformance.Nielsen,anS&P500company,
hasoperationsinover100countries,coveringmorethan90%ofthe
world’spopulation.
Formoreinformation,visitwww.nielsen.com.
Copyright©2016TheNielsenCompany.Allrightsreserved.Nielsenand
theNielsenlogoaretrademarksorregisteredtrademarksofCZT/ACN
Trademarks,L.L.C.Otherproductandservicenamesaretrademarksor
registeredtrademarksoftheirrespectivecompanies.16/10048

27Copyright © 2016 The Nielsen Company