thermophilic and mesophilic anaerobic fermentation of swine manure
TRANSCRIPT
Agricultural Wastes 6 (1983) 175-191
Thermophilic and Mesophilic Anaerobic Fermentation of Swine Manure*
Andrew G. Hashimoto
Roman L. Hruska US Meat Animal Research Center, Agricultural Research Service, US Department of Agriculture,
Clay Center, Nebraska 68933, USA
A BSTRA CT
The effects of temperature (35 ° and 55°C), influent Volatile Solids (VS) concentration (S O = 50.4 and 62.5 kg VS m- 3) and hydraulic retention time (HRT = 5, 10, 15 and 25 days) on methane (CH4) production from swine manure were evaluated using 3-dm 3 laboratory scale fermentors. The highest CH 4 production rate achieved was 3.12m 3 CH 4 per m 3
fermentor per day at 55°C, 5-day HRT and S O = 50.4 kg VS m- 3. Batch fermentations showed an ultimate CH 4 yieM (Bo) of 0.49 m 3 C H 4 kg VS fed. Extreme fermentation instability was experienced by the thermo- philic ( 55°C) fermentors at 25-day HRT and S O = 62.5 kg VS m- 3. This instability was attributed to free-ammonia and influent-substrate inhibitions. After a significant period for adaptation (over 170 days), the thermophilic fermentors adapted to the high free-ammonia concentra- tions and operated satisfactorily.
I N T R O D U C T I O N
The digest ibi l i ty o f swine m a n u r e , as m e a s u r e d b y the u l t ima te m e t h a n e (CH4) yield (B 0 expressed as m 3 C H 4 per kg VS fed at infinite r e ten t ion
* Mention of commercial or proprietary products in this paper does not constitute recommendation or endorsement of these products by the US Department of Agriculture.
175
176 Andrew G. Hashimoto
time), is significantly higher (0.50 + 0.05 m a CH 4 per kg VS fed) than the B o for beef cattle manure (0.35 + 0.05m a CH 4 per kg VS fed) or dairy cattle manure (0-20 + 0.05 m 3 CH 4 per kg VS fed) (Hashimoto et al., 1981a). However, about four times higher CH 4 production rates have been achieved by fermenting cattle manure compared with swine manure (Hashimoto et al., 1981a). The primary reason for the higher CH 4 production rates from cattle manure was the higher loading rates used for the cattle manure fermentations (16 to 20kg VS m - 3 at thermophilic conditions). Design, or opt imum, swine fermentor loading rates were reported to be: 4kg Total Solids (TS) m - 3 day -1 at 30 to 35°C (van Velsen et al., 1979); 4kg VS m -3 day -1 at 35°C (Fischer et al., 1979); 3.84kg VS m - 3 day -1 at 35°C (Gramms et al., 1971); 2.24kg VS m - 3
day- 1 at 35 °C (Sievers & Brune, 1978) and 2.5 kg VS m - 3 day- 1 at 35 °C (Huang et al., 1978). These loading rates were for mesophilic fermentations and were a quarter to a fifth the loading rate achieved for cattle manure fermented at thermophilic temperatures. Hashimoto (1981) showed that, for beef-cattle manure, much higher loading rates could be used at thermophilic temperatures (about 20 kg VS m - 3 day - 1) compared with mesophilic temperatures (about 7kg VS m - 3 day- l ) . However, van Velsen et al. (1979) showed that, for swine manure at the same loading rate and hydraulic retention time (HRT), mesophilic fermentations produced about 259/0 more CH 4 than thermophilic fermentations.
Ammonia inhibition is considered to be the primary factor limiting the loading rate to swine manure fermentors. McCarty & McKinney (1961) showed that ammonia toxicity occurs at a free-ammonia concentration of 0"15 kg m-3. McCarty (1964) later reported general guidelines stating that ammonia inhibition occurred at ammonia (free ammonia + ammonium) concentrations between 1.5 and 3.0kg N m -a at pH above 7.4 to 7.6, and ammonia toxicity occurred at concentrations above 3.0 kg N m - 3 at all pH levels. Hobson & Shaw (1976) confirmed these guidelines, showing that Methanobacter ium formic icum was partially inhibited in producing CH 4 at an ammonia concentration of 2.5 kg N m - a and pH of 7.1, and was completely inhibited at an ammonia concentration of 3.3 kg N m - a. Similarly, Kroeker et al. (1979) using urea and acetic acid, concluded that CH 4 production was progressively inhibited as the ammonia concentration increased above 2 kg N m-3 , although complete cessation of CH 4 production did not occur even at an ammonia concentration of 7 kg N m-a . However, several researchers
Anaerobic fermentation of swine manure 177
have recently reported stable fermentor operation at ammonia concentra- tions in excess of 2 k g N m -3 (Gramms et al., 1971; Lapp et al., 1975; Fischer et al., 1979; Stevens & Schulte, 1979; Converse et al., 1981).
The stable operation of mesophilic, anaerobic fermentors at ammonia concentrations greater than 2 kg N m - 3 was attributed to the acclimation of methanogens to high ammonia concentrations. Inhibition of CH4 production occurred at about 1.7 kg N m - 3, but this inhibition was only temporary when methanogenic organisms were allowed to acclimate, and organisms acclimated to 1.7 kg N m - a were also acclimated to ammonia concentrations up to 2-7kg N m -3 (van Velsen, 1979a). Further, organisms acclimated to 2.4 kg N m - 3 were also acclimated to ammonia concentrations up to 3.1 kg N m - 3, and methanogens present in sewage sludge acclimated to ammonia concentrations as high as 5 kg N m - 3 (van Velsen, 1979b). However, van Velsen et al. (1979) reported that ammonia acclimation was not apparent for thermophilic (55°C) fermentation of swine manure.
Swine manure fermentations at 55 °C (van Velsen et al., 1979) and 40 °C (Stevens & Schulte, 1979) resulted in lower gas production than fermentations at 35°C. Both references attributed the lower gas production to free-ammonia inhibition. Since the free-ammonia con- centration increases as temperature and pH increase, it is expected that more free-ammonia would be present at higher temperatures. For example, at a total ammonia concentration of 3.5 kg N m - 3 and a pH of 8, the free-ammonia concentration would be 0.97kg N m -3 at 55°C compared with 0.26kg N m -3 at 35°C (van Velsen et al., 1979).
This study was initiated to study the effects of temperature (35 ° and 55 °C), influent VS concentration and hydraulic retention time on CH4 production from swine manure.
M E T H O D S
Batch and daily fed (once a day) fermentors were used in this study. The batch fermentors were used to determine B 0 of the swine manure and the daily fed fermentors were used to evaluate the effects of temperature, influent concentration and HRT on CH 4 production. The batch and daily fed fermentors were 4-dm 3 aspirator bottles with working volumes of 3 dm 3, as described previously (Hashimoto et al., 1981 b). The fermentors were mixed using a platform shaker rotating at 140 revolutions per
178 Andrew G. Hashimoto
minute. The fermentors were housed in a constant temperature chamber and temperatures were controlled within 1 °C using heating tapes wrapped around the fermentors.
Swine manure (faeces and urine) was collected from pigs (weighing 80 to 90 kg) confined in metabolism stalls and fed a ration consisting of 82" 1 ~o corn (No. 2 yellow dent), 14.0 ~o soybean meal, 2.4 ~o dicalcium phosphate, 0"5~o ground limestone, 0 . 4 ~ iodised salt, 0"4~o vitamin premix and 0.4 ~o trace minerals. This ration contained approximately 14 ~o protein, 0.8 ~o calcium, 0.8 ~o phosphorus and metabolisable energy of 13 MJ kg - 1. Antibiotics were not used in the ration.
One-day old manure was diluted to about 14 ~o dry matter, placed in plastic bags (about 5 kg per bag) and frozen at - 20 °C. Periodically, a bag of manure was removed from the freezer, allowed to thaw overnight in a regrigerator, and appropriate amounts of slurry were weighed into polyethylene bottles. The bottles were then refrozen until used. Before use, the bottles were placed in a refrigerator to thaw overnight, and the slurry was diluted with hot tap water to the desired VS concentration and volume.
Eight batch fermentors were started by placing 1 dm 3 of inoculum from stable fermentors operating at 35 ° and 55°C, and l dm 3 of mineral solution (Hashimoto et al., 1981 b) in each fermentor. Four fermentors were maintained at 55°C and four at 35°C for 21 days to allow temperature equilibration and utilisation of substrate contained in the inoculum. Two of the fermentors at each temperature were each fed manure containing 25 g VS in dm 3 over a period of 7 days. The other two fermentors at each temperature were each fed I dm 3 of the mineral solution and served as controls. These batch fermentors were operated for 146 days, during which gas volume and composition (CH 4 and CO2) were measured periodically. At the end of the study, the total volume of CH 4 produced, including the CH 4 present in the fermentor headspace, was calculated. B 0 was calculated by subtracting the total CH 4 produced in the control from that produced in the manure fermentors and dividing by 25 g VS.
The daily fed fermentors (two fermentors at 35 °C and 2 at 55 °C) were started by placing 3 dm 3 of acclimated inoculum in each fermentor. The fermentors were fed manure slurries containing 62.5 kg VS m - 3 at 25-day HRT. Steady state was assumed after four volume turnovers, and C H 4
production and effluent characteristics were analysed for five consecutive days. The influent concentration was then reduced to 50.4 kg VS m - 3 and
Anaerobic fermentation of swine manure 179
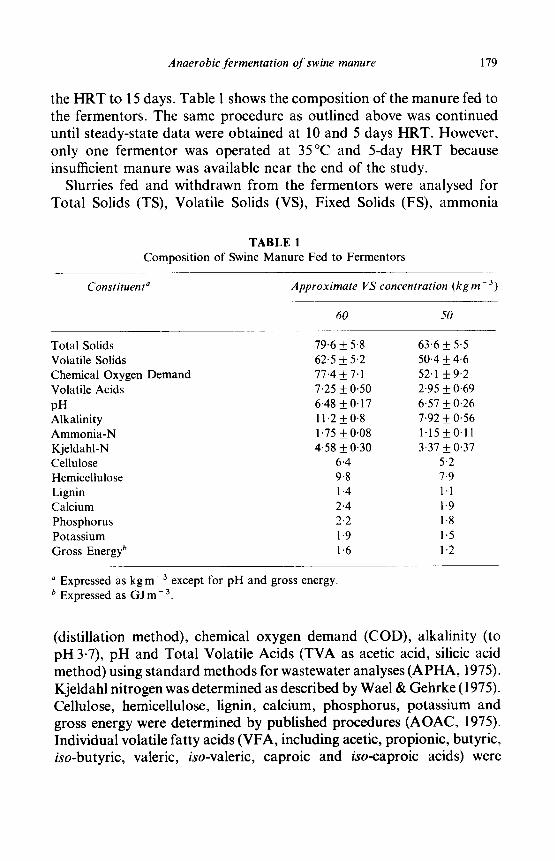
the HRT to 15 days. Table 1 shows the composition of the manure fed to the fermentors. The same procedure as outlined above was continued until steady-state data were obtained at 10 and 5 days HRT. However, only one fermentor was operated at 35°C and 5-day HRT because insufficient manure was available near the end of the study.
Slurries fed and withdrawn from the fermentors were analysed for Total Solids (TS), Volatile Solids (VS), Fixed Solids (FS), ammonia
T A B L E 1 Compos i t ion of Swine M a n u r e Fed to Fermentors
Constituent" Approximate VS concentration (kgm- 3)
60 50
Tota l Solids 79.6 + 5.8 63'6 + 5.5 Volatile Solids 62-5 ___ 5.2 50-4 ___ 4.6 Chemical Oxygen D e m a n d 77.4 ___ 7.1 52.1 + 9.2 Volatile Acids 7.25 _ 0.50 2.95 _ 0.69 p H 6.48 + 0.17 6.57 + 0.26 Alkal ini ty 11.2 -I- 0.8 7.92 _ 0.56 A m m o n i a - N 1-75 + 0.08 1-15 + 0.11 Kjeldahl-N 4.58 + 0.30 3-37 + 0.37 Cellulose 6.4 5.2 Hemicellulose 9.8 7.9 Lignin 1.4 1.1 Calcium 2.4 1-9 Phosphorus 2.2 1.8 Potass ium 1.9 1.5 Gross Energy b 1.6 1.2
" Expressed as kg m - 3 except for pH and gross energy. b Expressed as GJ m - 3
(distillation method), chemical oxygen demand (COD), alkalinity (to pH 3.7), pH and Total Volatile Acids (TVA as acetic acid, silicic acid method) using standard methods for wastewater analyses (APHA, 1975). Kjeldahl nitrogen was determined as described by Wael & Gehrke (1975). Cellulose, hemicellulose, lignin, calcium, phosphorus, potassium and gross energy were determined by published procedures (AOAC, 1975). Individual volatile fatty acids (VFA, including acetic, propionic, butyric, iso-butyric, valeric, iso-valeric, caproic and iso-caproic acids) were
180 Andrew G. Hashimoto
measured by gas chromatography as described previously (Hashimoto et al., 1981b).
The free-ammonia concentration was calculated using the following equation:
[NH3] = [T-NH3]/(1 + [H +]/Ka) (1)
Where [NH3] = free-ammonia concentration (kg m - 3), [T-NH3] = total-ammonia concentration (kg m - 3),
[H ÷ ]~ = hydrogen ion concentration (moles litre-1), KR = acid ionisation constant of ammonia (moles litre- 1).
Values for K a at 35 ° and 55 °C were calculated using the values for the dissociation constants (Kb) of aqueous ammonia and the ionisation constants (Kw) for water given in the Handbook o f Chemistry and Phys&s (CRC, 1968). K a was calculated to be 11.295 moles litre-1 at 35 °C and approximately 38.29 moles litre-1 at 55 °C by extrapolation.
Biogas produced in the fermentors was collected in gas-impermeable bags and analysed for gas volume and CH 4 concentrations. The gas volumes were meausred by a solution-displacement method, and the CH 4 content was measured by gas chromatography as described previously (Hashimoto et al., 1981b). Data were analysed by least-squares procedures outlined by Harvey (1975). The main effects were temperature and HRT.
RESULTS
B o for the 35 °C batch fermentors were 0.490 and 0-503 m 3 CH 4 per kg VS fed and 0.464m 3 per kg VS fed for the 55 °C fermentor. The other batch fermentor at 55 °C developed a leak in the gas collection bag; therefore, a replicate at 55 °C was not obtained. Since fermentation temperature does not affect the B o of a given substrate (Hashimoto et al., 1981b), the mean B o was calculated to be 0.49m 3 CH 4 per kg VS fed, with a standard deviation of 0.02 m 3 CH4 per kg VS fed. This B o value for swine manure is within the range of 0.50 _ 0.05 m 3 CH 4 per kg VS fed reported previously (Hashimoto et al., 1981a).
The original experimental design called for the fermentors to receive ca. 60kg VS m -3 at 25-, 15-, 10- and 5-day HRT. However, stable fermentation could not be achieved by the 55 °C fermentors at 25-day HRT. Therefore, the influent concentration was reduced to ca. 50 kg VS m - 3 for the trials at 15-, 10- and 5-day HRT.
Anaerobic fermentation o f swine manure 181
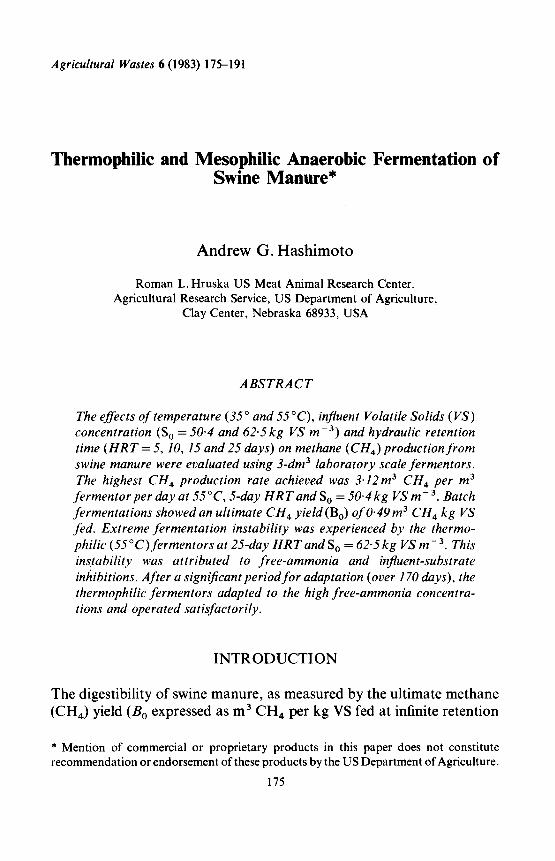
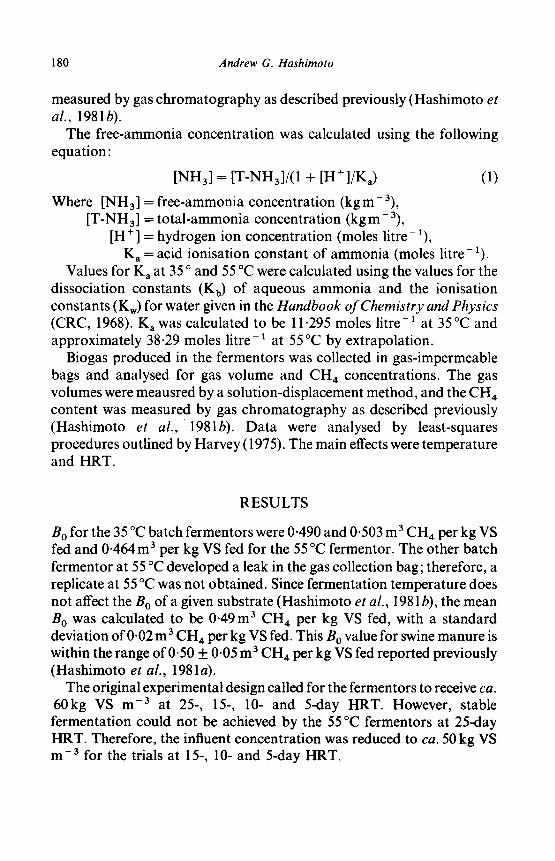
Figures 1 and 2 show the changes in TVA and methane production rate (? v, m 3 CH 4 per m 3 fermentor per day), respectively, during the operation of the fermentors at an influent concentration of 62-5 kg VS m - 3 and 25- day HRT. The TVA for the 35 °C fermentors remained fairly constant at about 1 kg m-3 throughout the trial. In contrast, the TVA in the 55 °C fermentors continued to increase throughout the trial. The decrease in TVA after day 38 resulted from the addition of 1 dm 3 of active,
8
t D
2
I I g, s, ,o6
TIME (DAYS)
Fig. 1. Change in Total Volatile Acids (TVA) during fermentation of swine manure at an influent Volatile Solids content of 62.5 kgm-3 and at 35 ° ( I ) and 55°C (0) .
thermophilic inoculum. This was effective in temporarily reducing the TVA from ca .4kg m -3 to ca. 2kg m -3. However, within 25 days (1 HRT), the TVA was above 4 kg m-3 and continued to increase to ca. 9 kg m -3 between days 104 and 108.
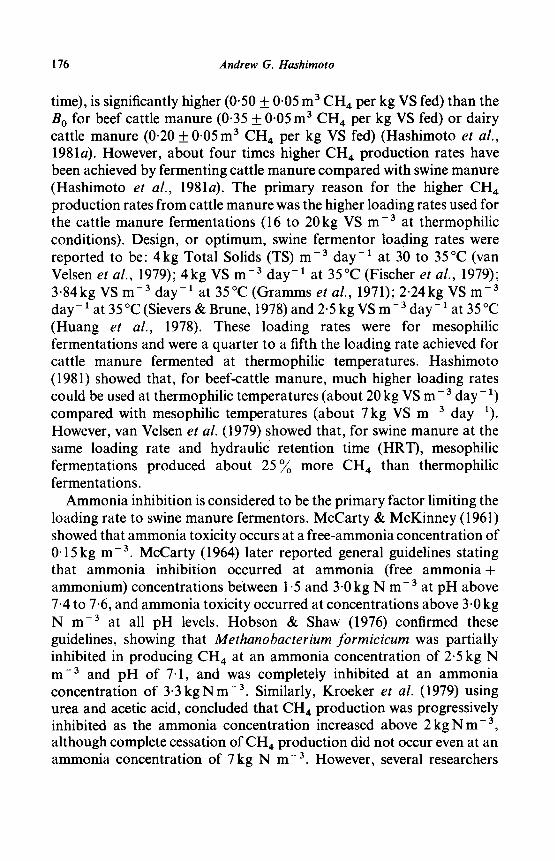
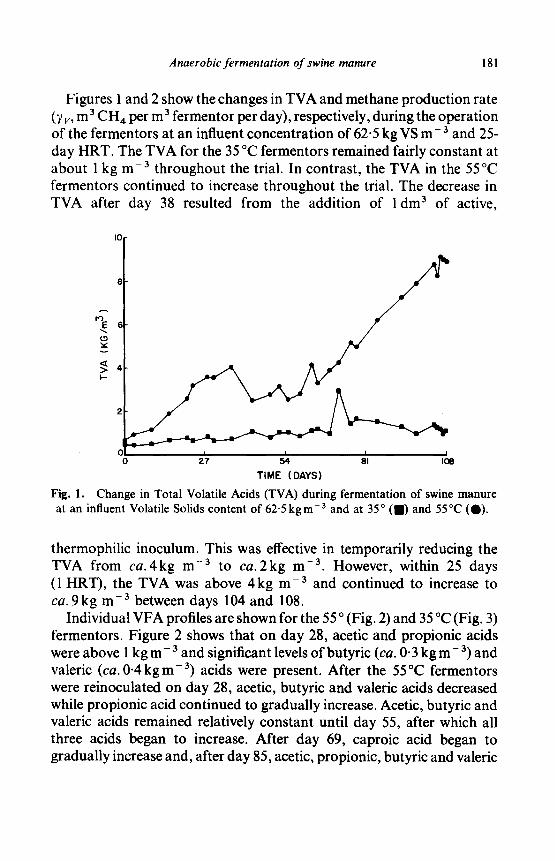
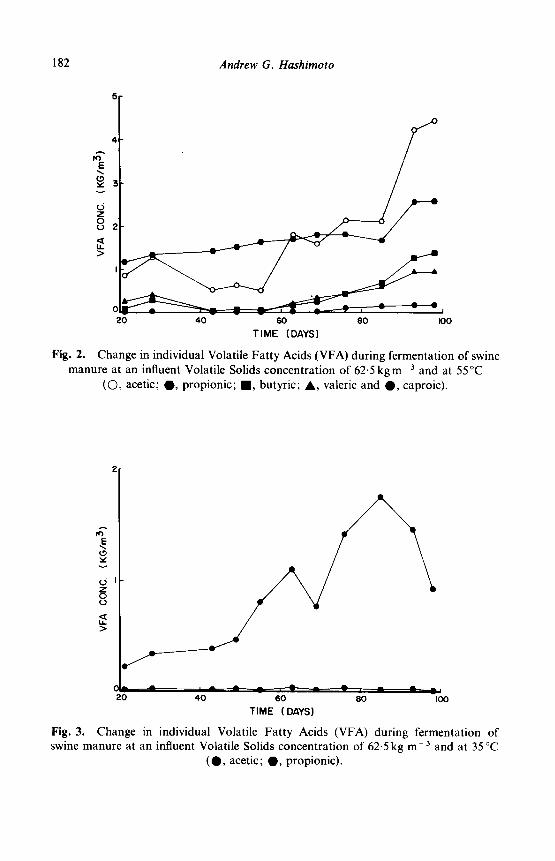
Individual VFA profiles are shown for the 55 o (Fig. 2) and 35 °C (Fig. 3) fermentors. Figure 2 shows that on day 28, acetic and propionic acids were above 1 kg m-3 and significant levels of butyric (ca. 0.3 kg m-3) and valeric (ca. 0.4kgm -3) acids were present. After the 55°C fermentors were reinoculated on day 28, acetic, butyric and valeric acids decreased while propionic acid continued to gradually increase. Acetic, butyric and valeric acids remained relatively constant until day 55, after which all three acids began to increase. After day 69, caproic acid began to gradually increase and, after day 85, acetic, propionic, butyric and valeric
182 Andrew G. Hashimoto
5
4
t3 Z 0
2 <~ IJ. >
I
Cl j w
20 40 60 80 I00
TIME (DAYS]
Fig. 2. Change in individual Volatile Fatty Acids ~(VFA) during fermentation of swine manure at an influent Volatile Solids concentration of 62.5 kg m - ~ and at 55 °C
(C), acetic; 0 , propionic; I , butyric; A , valeric and O, caproic).
>
(.9
d Z O t.3
20 4O 60 80 I00
TIME (DAYS)
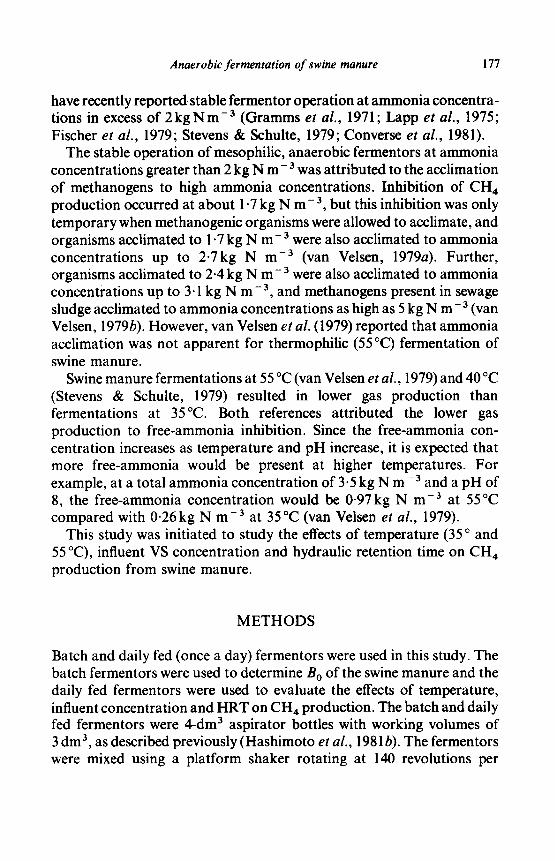
Fig. 3. Change in individual Volatile Fatty Acids (VFA) during fermentation of swine manure at an influent Volatile Solids concentration of 62.5 kg m-3 and at 35 °C
(O, acetic; 0 , propionic).
1.2
.8,
% v
I1.
ii IOe
TIME (DAYS)
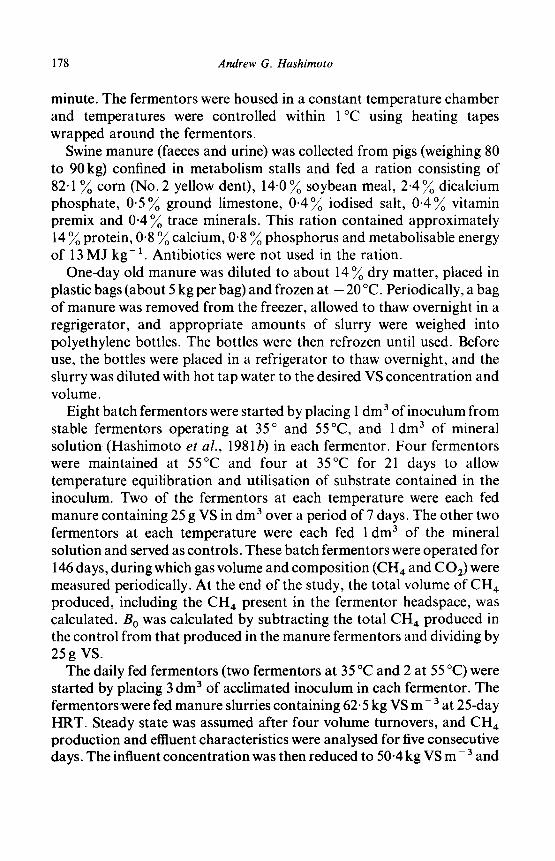
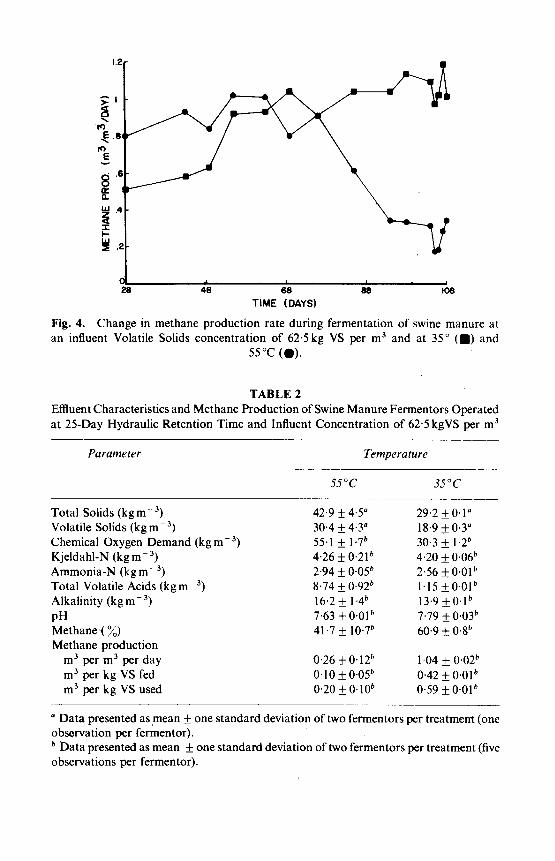
Fig. 4. Change in methane product ion rate during fermentat ion of swine manure at an influent Volatile Solids concentra t ion o f 62.5kg VS per m 3 and at 35 ° ( I ) and
55 °C (O).
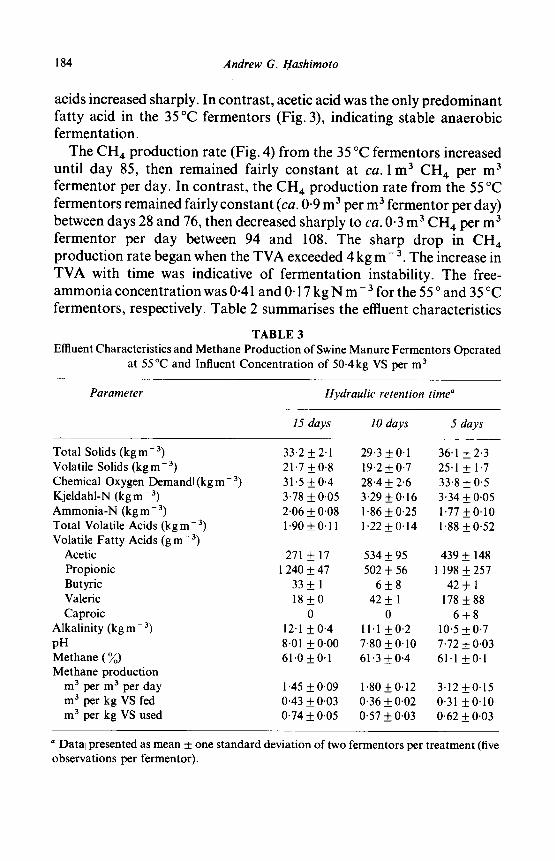
TABLE 2 Effluent Characteristics and Methane Product ion of Swine Manure Fermentors Operated
at 25-Day Hydraulic Retent ion Time and Influent Concentra t ion of 62.5 kgVS per m 3
Parameter Temperature
55°C 35°C
Total Solids (kg m - 3) Volatile Solids (kg m - 3)
Chemical Oxygen Demand (kg m - 3)
Kjeldahl-N (kg m - 3)
Ammonia -N (kg m - 3)
Total Volatile Acids (kg m - 3) Alkalinity (kg m - 3)
pH Methane-(%) Methane product ion
m 3 per m 3 per day
m 3 per kg VS fed
m 3 per kg VS used
42'9 _ 4"5 a 29"2 + 0' 1" 30"4 + 4"M 18'9 + 0'3 a 55"1 + 1"7 b 30-3 + 1'2 b
4"26 _ 0"21 b 4'20 ___ 0"06 b 2"94 ___ 0"05 b 2"56 + 0'01 b 8"74 + 0"92 b 1"15 + 0"01 b 16'2 + 1"4 b 13"9 + 0'1 b
7"63 +0"01 b 7'79 ___ 0'03 b 41 "7 + 10"7 b 60"9 ___ 0'8 b
0'26 ___ 0"12 b 1'04 ___ 0'02 b 0"10 + 0"05 b 0'42 + 0'01 b 0"20 + 0"10 b 0"59 + 0"01 b
a Data presented as mean _+ one s tandard deviation of two fermentors per t reatment (one observat ion per fermentor) . b Data presented as mean _+ one s tandard deviation of two fermentors per t reatment (five observations per fermentor).
184 Andrew G. Hashimoto
acids increased sharply. In contrast, acetic acid was the only predominant fatty acid in the 35 °C fermentors (Fig. 3), indicating stable anaerobic fermentation.
The CH4 production rate (Fig. 4) from the 35 °C fermentors increased until day 85, then remained fairly constant at ca. 1 m 3 c n 4 per m 3 fermentor per day. In contrast, the CH 4 production rate from the 55 °C fermentors remained fairly constant (ca. 0-9 m 3 per m 3 fermentor per day) between days 28 and 76, then decreased sharply to ca. 0.3 m 3 CH 4 per m 3 fermentor per day between 94 and 108. The sharp drop in CH 4 production rate began when the TVA exceeded 4 kg m - 3. The increase in TVA with time was indicative of fermentation instability. The free- ammonia concentration was 0.41 and 0.17 kg N m - 3 for the 55 ° and 35 °C fermentors, respectively. Table 2 summarises the effluent characteristics
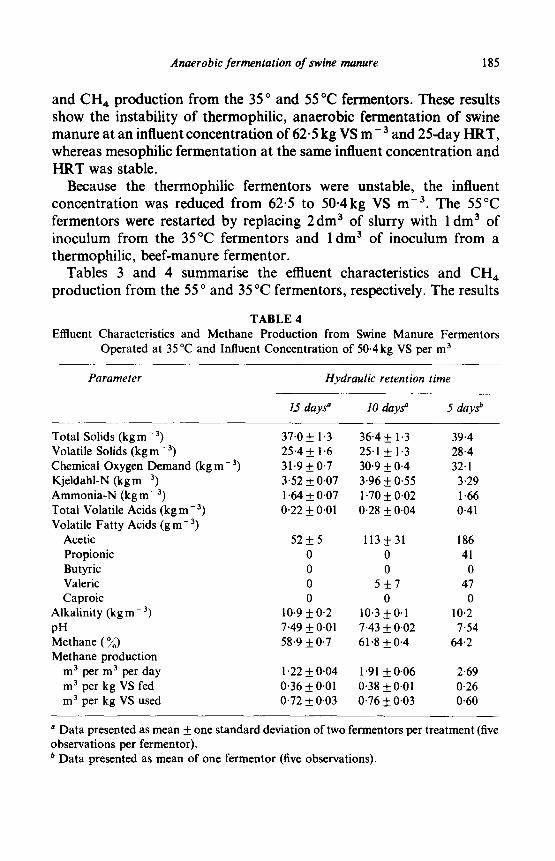
TABLE 3 Effluent Character is t ics and Me t hane Produc t ion of Swine M a n u r e Fermentors Operated
at 55°C and Influent Concen t r a t i on of 50.4kg VS per m 3
Parameter Hydraulic retention time a
15 days 10 days 5 days
Tota l Solids ( k g m -3) 3 3 . 2 + 2 . 1 2 9 . 3 + 0 . 1 36.1 + 2 . 3 Volatile Solids ( k g m -3) 21.7 ___ 0.8 19.2 + 0.7 25.1 + 1.7 Chemical Oxygen Demandl ( k g m -3) 31.5 _ 0.4 28.4 _ 2'6 33.8 _ 0'5 Kje ldahl -N (kg m - 3) 3.78 +__ 0'05 3.29 + 0.16 3-34 + 0.05 A m m o n i a - N (kg m - 3) 2.06 _ 0'08 1-86 + 0.25 1-77 + 0' 10 Total Volatile Acids (kg m - 3) 1.90 + 0.11 1.22 + 0.14 1.88 ___ 0.52 Volatile Fa t ty Acids (g m - 3)
Acetic 271 +__ 17 534 -I- 95 439 _ 148 Propionic 1 240 + 47 502 + 56 1 198 ___ 257 Butyric 33 + 1 6 _ 8 42 + 1 Valeric 18 + 0 42 _ 1 178 _ 88 Caproic 0 0 6 + 8
Alkal ini ty ( k g m -3) 12.1 ___0.4 11.1 + 0 . 2 10.5 -I-0-7 p H 8-01 _ 0 . 0 0 7 . 8 0 + 0 . 1 0 7 . 7 2 + 0 . 0 3 M e t h a n e (~o) 61.0 _ 0 . 1 61.3 _+0.4 61.1 +0 .1 M e t h a n e p roduc t ion
m3 per m3 per day 1 . 4 5 + 0 . 0 9 1.80+__0.12 3 . 1 2 + 0 . 1 5 m 3 per kg VS fed 0.43 + 0.03 0.36 + 0.02 0.31 + 0.10 m 3 per kg VS used 0.74 _ 0.05 0-57 _ 0.03 0.62 _ 0.03
a Datal presented as mean + one s tandard deviat ion of two fermentors per t rea tment (five observat ions per fermentor) .
Anaerobic fermentation o f swine manure 185
and C H 4 p r o d u c t i o n f r o m the 35 o and 55 °C fermentors . These results
show the instabil i ty o f thermophi l ic , anae rob ic f e rmen ta t ion o f swine
m a n u r e at an influent c o n c e n t r a t i o n o f 62.5 kg VS m - a and 25-day H R T ,
whereas mesophi l ic f e rmen ta t ion at the same influent concen t r a t i on and
H R T was stable.
Because the thermophi l i c f e rmen to r s were unstable , the influent
concen t r a t i on was reduced f r o m 62.5 to 50 .4kg VS m -3. The 55°C
fe rmentors were restar ted by replac ing 2 d m 3 o f s lurry with I d m a o f
i n o c u l u m f r o m the 35°C fe rmento r s and 1 d m a o f i nocu lum f r o m a
thermophi l ic , bee f -manure fe rmentor .
Tables 3 and 4 summar ise the effluent character is t ics and C H ,
p r o d u c t i o n f r o m the 55 ° and 35 °C fermentors , respectively. The results
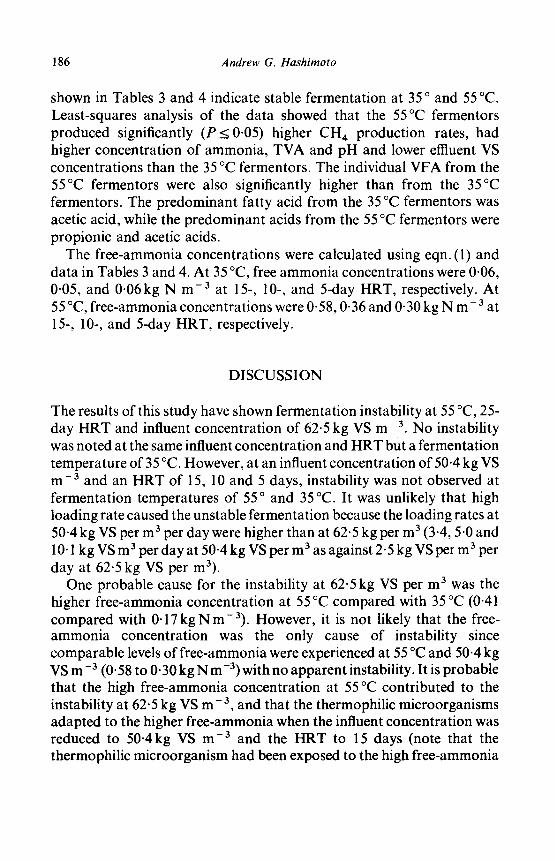
TABLE 4 Effluent Characteristics and Methane Production from Swine Manure Fermentors
Operated at 35 °C and Influent Concentration of 50.4kg VS per m 3
Parameter Hydraulic retention time
1.5 days a 10 days ~ 5 days b
Total Solids (kg m- 3) 37-0 _ 1.3 36-4 _ 1.3 39-4 Volatile Solids (kgm-3) 25.4 +__ 1-6 25.1 + 1-3 28.4 Chemical Oxygen Demand (kg m- 3) 31.9 _ 0-7 30.9 _ 0.4 32.1 Kjeldahl-N (kg m- 3) 3.52 + 0.07 3.96 + 0.55 3.29 Ammonia-N (kgm-3) 1.64 _ 0.07 1.70 + 0.02 1.66 Total Volatile Acids (kg m- 3) 0.22 _ 0.01 0.28 + 0.04 0.41 Volatile Fatty Acids (g m- a)
Acetic 52 + 5 113 + 31 186 Propionic 0 0 41 Butyric 0 0 0 Valeric 0 5 + 7 47 Caproic 0 0 0
Alkalinity (kgm -3) 10.9 -t- 0-2 10.3 +0.1 10.2 pH 7-49 _ 0.01 7.43 + 0.02 7.54 Methane (~o) 58.9 _ 0.7 61.8 + 0.4 64.2 Methane production
m s per m a per day 1.22 _ 0.04 1'91 + 0-06 2"69 m 3 per kg VS fed 0"36 + 0-01 0.38 + 0-01 0.26 m s per kg VS used 0.72 + 0.03 0.76 + 0-03 0-60
° Data presented as mean _+ one standard deviation of two fermentors per treatment (five observations per fermentor). b Data presented as mean of one fermentor (five observations).
186 Andrew G. Hashimoto
shown in Tables 3 and 4 indicate stable fermentation at 35 ° and 55 °C. Least-squares analysis of the data showed that the 55°C fermentors produced significantly (P _< 0.05) higher CH 4 production rates, had higher concentration of ammonia, TVA and pH and lower effluent VS concentrations than the 35 °C fermentors. The individual VFA from the 55°C fermentors were also significantly higher than from the 35°C fermentors. The predominant fatty acid from the 35 °C fermentors was acetic acid, while the predominant acids from the 55 °C fermentors were propionic and acetic acids.
The free-ammonia concentrations were calculated using eqn. (1) and data in Tables 3 and 4. At 35 °C, free ammonia concentrations were 0.06, 0-05, and 0-06 kg N m-3 at 15-, 10-, and 5-day HRT, respectively. At 55 °C, free-ammonia concentrations were 0.58, 0.36 and 0-30 kg N m - 3 at 15-, 10-, and 5-day HRT, respectively.
DISCUSSION
The results of this study have shown fermentation instability at 55 °C, 25- day HRT and influent concentration of 62.5 kg VS m - 3. No instability was noted at the same influent concentration and HRT but a fermentation temperature of 35 °C. However, at an influent concentration of 50.4 kg VS m -3 and an HRT of 15, 10 and 5 days, instability was not observed at fermentation temperatures of 55 ° and 35 °C. It was unlikely that high loading rate caused the unstable fermentation because the loading rates at 50.4 kg VS per m 3 per day were higher than at 62.5 kg per m 3 (3.4, 5.0 and 10.1 kg VS m 3 per day at 50.4 kg VS per m 3 as against 2.5 kg VS per m 3 per day at 62-5 kg VS per m3).
One probable cause for the instability at 62.5 kg VS per m 3 was the higher free-ammonia concentration at 55 °C compared with 35 °C (0-41 compared with 0-17 kg N m-3). However, it is not likely that the flee- ammonia concentration was the only cause of instability since comparable levels of free-ammonia were experienced at 55 °C and 50.4 kg VS m -3 (0.58 to 0.30 kg N m -3) with no apparent instability. It is probable that the high free-ammonia concentration at 55 °C contributed to the instability at 62.5 kg VS m - 3, and that the thermophilic microorganisms adapted to the higher flee-ammonia when the influent concentration was reduced to 50.4kg VS m -3 and the HRT to 15 days (note that the thermophilic microorganism had been exposed to the high flee-ammonia
concentrations for over 170 days when steady state at 15-day HRT occurred).
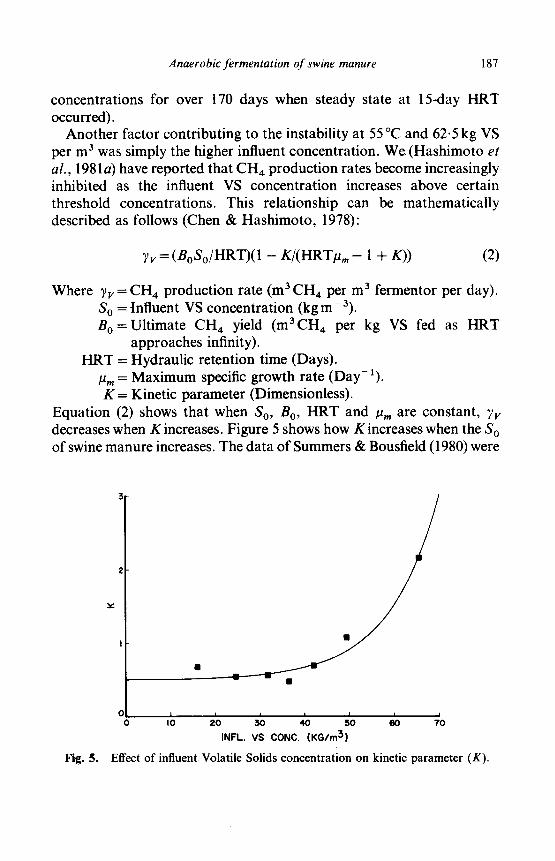
Another factor contributing to the instability at 55 °C and 62.5 kg VS per m 3 was simply the higher influent concentration. We (Hashimoto et
al., 198 la) have reported that CH4 production rates become increasingly inhibited as the influent VS concentration increases above certain threshold concentrations. This relationship can be mathematically described as follows (Chen & Hashimoto, 1978):
7v = ( B o S o / H R T ) ( 1 - K / ( H R T I t m - 1 + K)) (2)
Fig. 5.
Where Vv = CH4 production rate (m 3 CH 4 per m 3 fermentor per day). So = tnfluent VS concentration (kg m - 3). B o=Ul t imate CH 4 yield (maCH4 per kg VS fed as HRT
approaches infinity). HRT = Hydraulic retention time (Days).
/~,~ = Maximum specific growth rate (Day-1). K = Kinetic parameter (Dimensionless).
Equation (2) shows that when S o, B o, HRT and #m are constant, ~'v decreases when K increases. Figure 5 shows how K increases when the S O of swine manure increases. The data of Summers & Bousfield (1980) were
, ¢
= _ _ _ r - - I
Anaerobic fermentation of swine manure 187
i 210 i i i i ; 0 0 I0 30 40 50 60
INFL. V$ CONC. (KG/m 3)
Effect of influent Volatile Solids concentration on kinetic parameter (K).
188 Andrew G. Hashimoto
used to calculate K, assuming a B o of 0.36 m 3 CH 4 per kg VS fed and a #,, related to temperature (T in °C) as follows (Hashimoto e t al . , 1981a):
/~,, = 0.013(T) - 0" 129 (3)
Figure 5 shows that Kis related to S O by the following empirical equation:
K = 0.50 + 0.0043 exp (0.091So) (4)
Figure 5 and eqn. (4) show that K increases sharply when S O increases above 50 kg VS per m 3. This may partially explain why the 55 °C fer- mentors were unstable at 62.5 kg VS per m 3 but stable at 50.4 kg VS per m 3. The fact that similar instability did not occur at 35 °C, even with the same K, may be because the free ammonia concentration was significantly lower at 35°C. Thus, the instability of the fermentation at 55°C and 62-5 kg VS per m 3 was probably due to the combined effects of high free- ammonia and influent VS concentrations.
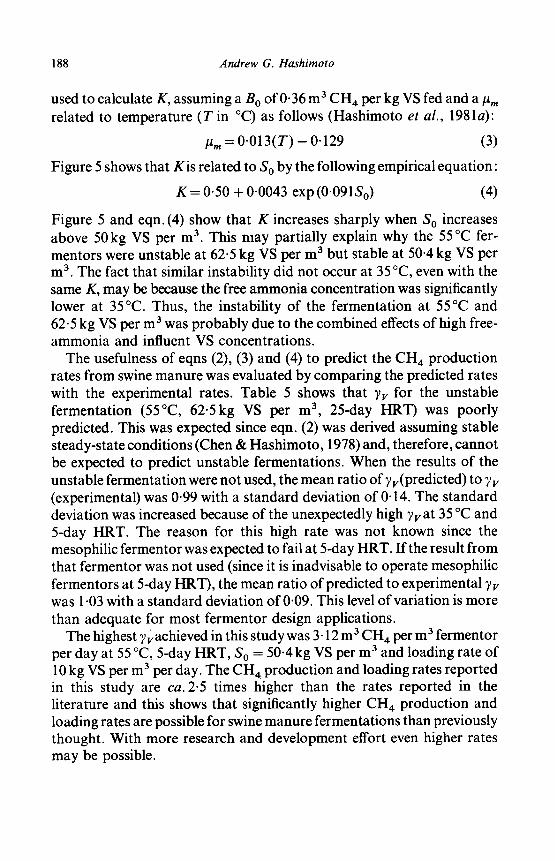
The usefulness of eqns (2), (3) and (4) to predict the CH 4 production rates from swine manure was evaluated by comparing the predicted rates with the experimental rates. Table 5 shows that Yv for the unstable fermentation (55°C, 62.5kg VS per m 3, 25-day HRT) was poorly predicted. This was expected since eqn. (2) was derived assuming stable steady-state conditions (Chen& Hashimoto, 1978) and, therefore, cannot be expected to predict unstable fermentations. When the results of the unstable fermentation were not used, the mean ratio of ~v(predicted) to ~v (experimental) was 0.99 with a standard deviation of 0.14. The standard deviation was increased because of the unexpectedly high ~v at 35 °C and 5-day HRT. The reason for this high rate was not known since the mesophilic fermentor was expected to fail at 5-day HRT. If the result from that fermentor was not used (since it is inadvisable to operate mesophilic fermentors at 5-day HRT), the mean ratio of predicted to experimental Yv was 1.03 with a standard deviation of 0.09. This level of variation is more than adequate for most fermentor design applications.
The highest ),vachieved in this study was 3.12 m 3 CH 4 per m 3 fermentor per day at 55 °C, 5-day HRT, S O = 50.4kg VS per m a and loading rate of 10 kg VS per m 3 per day. The CH 4 production and loading rates reported in this study are ca. 2-5 times higher than the rates reported in the literature and this shows that significantly higher CH 4 production and loading rates are possible for swine manure fermentations than previously thought. With more research and development effort even higher rates may be possible.
Anaerobic fermentation of swine manure 189
TABLE 5 Comparison of Experimental and Predicted Methane Production Rates from Swine
Manure
Temperature HRT S O CH 4 production rates Ratio (°C) (days) (kg VSm -3) (m 3 per m a per day) Pred.~Exp.
Experimental Predicted °
55 25 62-5 0'26 1-08 4.15 55 15 50"4 1'45 1-47 1'01 55 10 50-4 1'80 2-08 1-16 55 5 50"4 3' 12 3-34 1-07
35 25 62'5 1-04 0"98 0"94 35 15 50'4 1-22 1"33 1"09 35 10 50'4 1'91 1-76 0"92 35 5 50'4 2"69 2"01 0-75
a From eqn. (2):
~V= (BoSo/HRT)(1- K/(#mHRT- 1 + K))
where B o = 0.49m 3 CH4 m 3 fermentor per day; K = 1.77 at So = 62.5kg VS m -3 and K=0.92 at So=50-4kg VS m -3 (from eqn.(4)) and #m=0.326 per day at 35°C and #,,= 0'586 per day at 55°C (from eqn.(3)).
A C K N O W L E D G E M E N T S
T h e technical ass i s tance o f L y n n N i e m a n n , Steve Spe l lman a n d F r a n
S toege r -Wal l ace is a p p r e c i a t e d a n d gra te fu l ly acknowledged . Rev iew a n d c o m m e n t s b y Y u d - R e n Chen , Vincent Vare l a n d Michae l M a c N e i l a re a lso apprec i a t ed .
R E F E R E N C E S
American Public Health Association (APHA) (1975). Standard methods for the examination o f water and wastewater (14th edn). American Public Health Association, Inc., New York, NY.
AOAC (1975). Official methods o f analyses (12th edn). Association of Official Analytical Chemists, Washington, DC.
Chen, Y. R. & Hashimoto, A. G. (1978). Kinetics of methane fermentation. Biotechnol. Bioengr. Symp. No. 8, 269-82.
190 Andrew G. Hashimoto
Converse, J. C., Evans, G. W., Robinson, K. L., Gibbons, W. & Gibbons, M. (1981). Methane production from a large-size on-farm digester for poultry manure. In: Livestock waste: A renewable resource. Am. Soc. of Agric. Engr., St.Joseph, MI, 122-5.
CRC (1968). Handbook of chemistry and physics (48th edn). Chemical Rubber Co., Cleveland, OH.
Fischer, J. R., iannotti, E. L., Porter, J. H. & Garcia, A. (1979). Producing methane gas from swine manure in a pilot-size digester. Transactions of the ASAE, 22(2), 370-4.
Fischer, J. R., Sievers, D. M. & Fulhage, C. D. (1979). Design criteria and operational guidelines for a pilot-scale anaerobic digester. Resource Recovery and Conservation, 4, l - 11.
Gramms, L. C., Polkowski, L. B. & Witzel, S. A. (1971). Anaerobic digestion of farm animal wastes. Transactions of thk ASAE, 14, 7-13.
Harvey, W. R. (1975). Least squares analysis of data with unequal subclass numbers. ARS H-4, US Department I of Agriculture.
Hashimoto, A. G. (198 l). Methane production from beef cattle manure: Effects of temperature, hydraulic retention time and influent substrate concentration. Quarterly Progress Report submitted to the Solar Energy Research Institute, Golden, CO.
Hashimoto, A. G., Chen, Y. R. & Varel, V. H. (1981a). Theoretical aspects of methane production: State-of-the-art. In: Livestock waste: A renewable resource. Am. Soc. of Agric. Engr., St. Joseph, MI, 86-91, 95.
Hashimoto, A. G., Varel, V. H. & Chen, Y. R. (1981b). Ultimate methane yield from beef cattle manure: Effect of temperature, ration constituents, antibiotics and manure age. Agric. Wastes, 3, 241-56.
Hobson, P. N. & Shaw, B. G. (1976). Inhibition of methane production by Methanobacterium formicicum. Water Res., 10, 849-52.
Huang, S. Y., Won, K. T. & Wang, H. H. 0978). Optimum design of anaerobic digester for swine waste. Proc. Nat'l. Sci. Counc. Rep. of China, 2(4), 407-15.
Kroeker, E. J., Schulte, D. D., Sparling, A. B. & Lapp, H. M. (1979). Anaerobic treatment process stability. J. Water Pollut. Control. Fed., 51, 718-27.
Lapp, H. M., Schulte, D. D., Kroeker, E. J., Sparling, A. B. & Topnik, B. H. (1975). Start-up of pilot scale swine manure digesters for methane production. In: Managing livestock wastes. Am. Soc. of Agric. Engr., St. Joseph, MI, 234-7, 243.
McCarty, P. L. (1964). Anaerobic waste treatment fundamentals. III. Toxic materials and their control. Public Works, 95, 91-4.
McCarty, P. L. & McKinney, R. E. (1961). Salt toxicity in anaerobic digestion. J. Water Pollut. Control Fed., 33, 399-415.
Sievers, D. M. & Brune, D. E. 0978). Carbon/nitrogen ratio and anaerobic digestion of swine waste. Transactions of the ASAE, 21, 537-41,549.
Stevens, M. A. & Schulte, D. D. (1979). Low temperature anaerobic digestion of swine manure. J. Env. Engr. Div., ASCE, 105, 33-42.
Summers, R. & Bousfield, S. (1980). A detailed study of piggery-waste anaerobic digestion. Agric. Wastes, 2, 61-78.
Anaerobic fermentation of swine manure 191
van Velsen, A. F. M. (1979a). Anaerobic digestion of piggery waste. 2. Start-up procedure. Neth. J. Agric. Sci., 27, 142-52.
van Velsen, A. F. M. (1979b). Adaptation of methanogenic sludge to high ammonia-nitrogen concentrations. Water Res., 13, 995-9.
van Velsen, A. F. M., Lettinga, G. & den Ottelander, D. (1979). Anaerobic digestion of piggery waste. 3. Influence of temperature. Neth. J. Agric. Sci., 27, 255-67.
Wael, L. L. & Gehrke, C. W. (1975). An automated total protein nitrogen method. J. Assoc. Official Analytical Chemists, 48, 1221-6.