thermophilic anaerobic co-digestion of olive mill wastewater with olive mill solid wastes in a...
TRANSCRIPT
A
waTiodoo©
K
1
em2eatwopnTtph
T
b
1d
Chemical Engineering Journal 132 (2007) 195–203
Thermophilic anaerobic co-digestion of olive mill wastewaterwith olive mill solid wastes in a tubular digester
Boubaker Fezzani ∗, Ridha Ben CheikhEnergy Department, Biogas Laboratory, Engineers National School of Tunis, Tunisia
Received 5 October 2006; received in revised form 6 December 2006; accepted 13 December 2006
bstract
This study investigates for the first time the thermophilic (55 ◦C) anaerobic co-digestion of olive mill wastewater (OMW) with olive mill solidastes (OMSW) in laboratory scale semi-continuous tubular digesters. Each digester was fed with an influent composed of OMW and OMSW overrange of hydraulic retention times (HRTs) of 12, 24 and 36 days and at organic loading rates (OLRs) between 1.19 and 10.84 g COD/(l day). TheCOD concentration of OMW were 43, 67 and 130 g COD/l and the amount of the dry OMSW co-digested with OMW was 56 g TS/l. The results
ndicated that the best methane productivity and SCOD removal efficiency of 46 l/((l OMW) day) and 69%, respectively, were achieved at an OLRf 3.62 g COD/(l day) corresponding to an OMW of 130 g COD/l digested at an HRT of 36 days. Furthermore, the best net energy production from
igesters operated at thermophilic temperature was 427 kJ/day higher than from those operated at mesophilic temperature for the same conditionsf feed concentration and HRT. In contrast, an HRT of 12 days caused a sharp increase of both total volatile fatty acids (TVFA) and chemicalxygen demand (COD) contents in the effluents and a cessation in methane production for the three influents substrate concentrations studied.2007 Elsevier B.V. All rights reserved.
aerob
lrtmbtidtmahTa
eywords: Olive mill wastewater; Olive mill solid wastes; Tubular digester; An
. Introduction
The disposal of olive mill wastewater (OMW) is a seriousnvironmental problem in the olive oil producing areas andany processes have been proposed to treat OMW over the last
0 years such as concentration by evaporation, chemical andlectrochemical treatments, aerobic biological treatments andnaerobic digestion process [1]. In general, anaerobic diges-ion process is a widely applied process for treating organicastes because it combines production of energy, in the formf biogas and decreasing of pollution with high efficiency. Thisrocess can be carried out at two different temperature ranges,amely mesophilic (35–40 ◦C) and thermophilic (55–60 ◦C).hermophilic digestion has become in recent decade an impor-
ant alternative to mesophilic digestion because it offers severalotential advantages compared to mesophilic temperature. First,ydrolysis and biochemical reactions are faster than those at
∗ Corresponding author at: 28 Rue Larbi Zarrouk, 9000 Beja, Tunisia.el.: +216 97 37 69 69.
E-mail addresses: [email protected],[email protected] (B. Fezzani).
saaii
tin
385-8947/$ – see front matter © 2007 Elsevier B.V. All rights reserved.oi:10.1016/j.cej.2006.12.017
ic co-digestion; Biogas; Thermophilic temperature
ow temperatures [2]. Second, the maximum specific growthates of microorganisms increase with temperature [3,4]. Third,he destruction of pathogens organisms and weed seeds are
ore efficient at higher temperature [5]. Moreover, specificiogas production rates are higher under thermophilic condi-ions than under mesophilic conditions which may lead to anmprovement in the energy balance [6]. Applying anaerobicigestion either at mesophilic or thermophilic temperature toreat OMW without previous treatment was failed [7,8]. Theain reason is that OMW is an acid influent possesses low
lkalinity and contains low amount of ammonium nitrogen andigh levels of phenol and TCOD concentration (pH 5.4 ± 0.07,K-N = 750 ± 24 mg N/l, total phenol = 10.2 ± 0.14 g C6H6O/lnd TCOD = 105.37 ± 13.8 g/l) [9]. Several proposals have beenuggested to overcome the difficulties of treating OMW bynaerobic digestion such as high dilution of OMW (1:10) andddition of ammonium chloride or urea [10–12], aerobic biolog-cal pre-treatments [9,13] and co-digestion with substrates richn ammonium nitrogen [14].
The co-digestion of OMW with others organic wastes con-aining high level of ammonium nitrogen to compensate the lackn OMW has becoming the most interesting because it doesot require any addition of chemical substances which are not

196 B. Fezzani, R.B. Cheikh / Chemical Engin
Nomenclature
OMW olive mill wastewaterOMSW olive mill solid wastesTS total solid (g/l)VS volatile solids (g/l)TSS total suspended solids (g/l)VSS volatile suspended solids (g/l)TVFA total volatile fatty acids (g/l)TCOD total chemical oxygen demand (g COD/l)SCOD soluble chemical oxygen demand (g COD/l)TPO4
−-P total mineral ortho-phosphorus (g/l) or(g/kg TS)
TK-N total Kjeldhal nitrogen (g/l) or (g/kg TS)TNH4
+-N total ammonium nitrogen (mg/l) or (mg/kg TS)NH3-N free ammonia nitrogen (ppm)H2S dihydrogen sulphur (ppm)CH4 methane (%)CO2 carbon dioxide (%)HRT hydraulic retention time (days)OLR organic loading rate (g COD/(l day))CST continuous stirred tank
ecoeamacNrfsatwtcdOrsscccWgss
O
tttwtimret
2
2
ds0aotdbehss
2
2
Ben Yeder three-phase olive mill located in El-Mornaguia atTunis capital. The chemical composition of these wastes, inmain values, at the beginning of experiments are summarisedin Tables 1 and 2.
USAB up flow anaerobic sludge blanket
conomically and environmentally desirable [14–17]. Also, theo-digestion process has no negative effects on the potentialf biogas production rate from OMW compared to the oth-rs pre-treatment [18]. Fewer researchers have investigated thenaerobic co-digestion of OMW with other substrates either atesophilic or thermophilic temperature. At mesophilic temper-
ture we have investigated in our previous work the anaerobico-digestion of OMW with olive mill solid wastes (OMSW: TK-= 12 ± 5 g N/l) in semi-continuous tubular digester [18]. The
esults indicated that OMSW–OMW co-digestion was success-ul with a TCOD reduction up to 90% compared to 70% from theeparate treatment of diluted OMW [11,12]. On the other hand,t thermophilic temperature only Angelidaki et al. [16] werehe first who have studied the anaerobic co-digestion of OMWith other substrates (manure and sewage sludge) in both con-
inuous stirred tank and batch reactors and showed that OMWould be treated successfully without high dilution if it was co-igested with manure or swage sludge. For the co-digestion ofMW with manure (50:50 and 75:25 OMW:manure) the TCOD
emoval efficiency was 75% compared to 55% for the sewageludge–OMW co-digestions (50:50 and 75:25 OMW:sewageludge). The best performance observed for manure–OMWo-digestions were due to the fact that manure contains highontent of ammonium nitrogen and possesses high bufferingapacity (TNH4
+-N = 2.5 g N/l and alkalinity = 14.5 g CaCO3/l).hereas sewage sludge contains low level of ammonium nitro-
en (TNH4+-N = 470 mg N/l and TK-N = 1.2 g N/l) and OMW
hould be diluted with water (1:5) to be co-digested with sewageludge [15].
Continuing the research of the anaerobic co-digestion ofMW with others substrates rich in nitrogen amounts and
Fd((
eering Journal 132 (2007) 195–203
aking into account the potentials advantages of thermophilicemperature the objective this work was to study for the firstime the feasibility of the anaerobic co-digestion of OMWith OMSW at thermophilic conditions in a semi-continuous
ubular digester. This report discusses a laboratory scalenvestigation with emphasis placed on the evaluation of opti-
al values of biogas production, methane percentage, TCODemoval efficiency and the qualities of effluents under differ-nt HRT and influent substrate concentrations at thermophilicemperature.
. Materials and methods
.1. Equipments
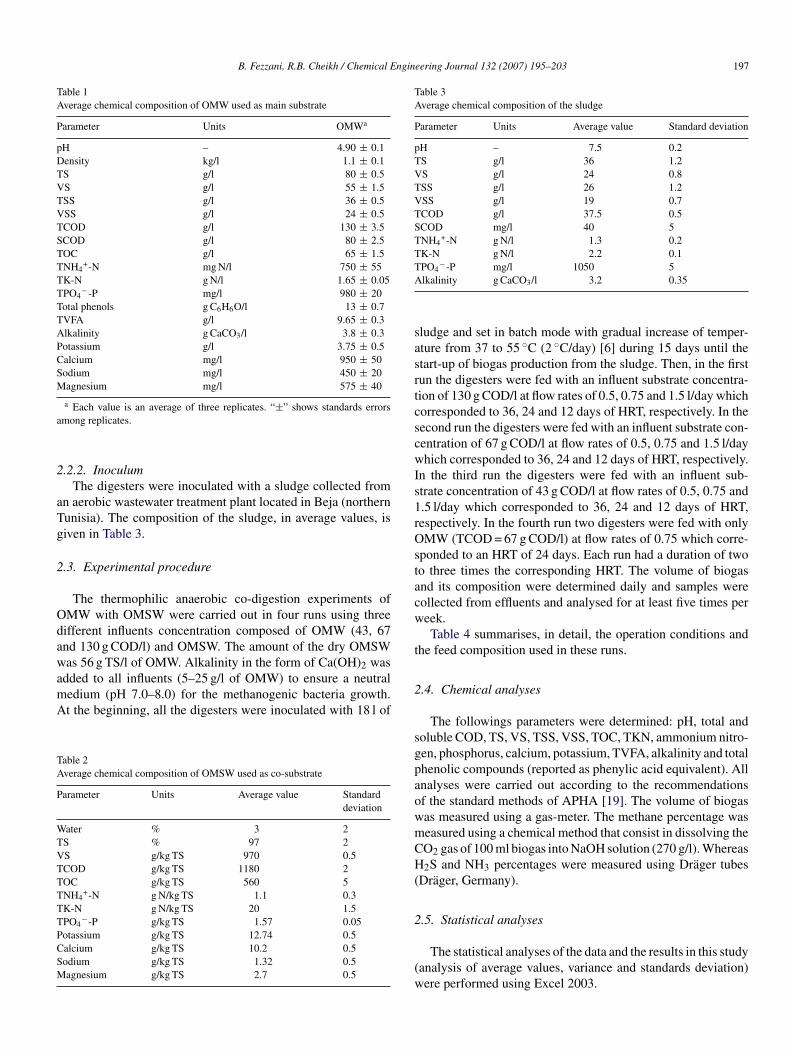
Five tubular digesters of 18 l useful volume were used. Eachigester consisted of two coaxial cylinders. The Plexiglas out-ide cylinder had an internal diameter of 30 cm, a thickness of.5 cm and a length of 70 cm. The glass internal cylinder hadn internal diameter of 20 cm, a thickness of 1 cm, a lengthf 70 cm and a volume of 22 l. The latter was equipped withhree ports, two of them for daily manual feeding and effluentischarge and the other port for collecting gas into a plasticag. These digesters were warmed with a water heating systemquipped with thermostat and pump. Agitation (seven times perour) was performed using a motor agitator equipped with a timewitch. Fig. 1 shows in detail the tubular digester used in thistudy.
.2. Substrates composition
.2.1. Olive mill wastesOMSW and OMW used in this study were collected from
ig. 1. Semi-continuous feeding tubular digester: (1) inside cylinder of 20 cmiameter; (2) outside cylinder of 30 cm diameter; (3) inlet port; (4) outlet port;5) agitator; (6) plastic bag; (7) plastic tap; (8) metal container filled with water;9) plastic pipe; (10) water heater with thermostat and pump; (11) agitator motor.
B. Fezzani, R.B. Cheikh / Chemical Engineering Journal 132 (2007) 195–203 197
Table 1Average chemical composition of OMW used as main substrate
Parameter Units OMWa
pH – 4.90 ± 0.1Density kg/l 1.1 ± 0.1TS g/l 80 ± 0.5VS g/l 55 ± 1.5TSS g/l 36 ± 0.5VSS g/l 24 ± 0.5TCOD g/l 130 ± 3.5SCOD g/l 80 ± 2.5TOC g/l 65 ± 1.5TNH4
+-N mg N/l 750 ± 55TK-N g N/l 1.65 ± 0.05TPO4
−-P mg/l 980 ± 20Total phenols g C6H6O/l 13 ± 0.7TVFA g/l 9.65 ± 0.3Alkalinity g CaCO3/l 3.8 ± 0.3Potassium g/l 3.75 ± 0.5Calcium mg/l 950 ± 50Sodium mg/l 450 ± 20Magnesium mg/l 575 ± 40
a
2
aTg
2
OdawamA
TA
P
WTVTTTTTPCSM
Table 3Average chemical composition of the sludge
Parameter Units Average value Standard deviation
pH – 7.5 0.2TS g/l 36 1.2VS g/l 24 0.8TSS g/l 26 1.2VSS g/l 19 0.7TCOD g/l 37.5 0.5SCOD mg/l 40 5TNH4
+-N g N/l 1.3 0.2TK-N g N/l 2.2 0.1T −A
sasrtcscwIs1rOstacw
t
a Each value is an average of three replicates. “±” shows standards errorsmong replicates.
.2.2. InoculumThe digesters were inoculated with a sludge collected from
n aerobic wastewater treatment plant located in Beja (northernunisia). The composition of the sludge, in average values, isiven in Table 3.
.3. Experimental procedure
The thermophilic anaerobic co-digestion experiments ofMW with OMSW were carried out in four runs using threeifferent influents concentration composed of OMW (43, 67nd 130 g COD/l) and OMSW. The amount of the dry OMSW
as 56 g TS/l of OMW. Alkalinity in the form of Ca(OH)2 wasdded to all influents (5–25 g/l of OMW) to ensure a neutraledium (pH 7.0–8.0) for the methanogenic bacteria growth.t the beginning, all the digesters were inoculated with 18 l of
able 2verage chemical composition of OMSW used as co-substrate
arameter Units Average value Standarddeviation
ater % 3 2S % 97 2S g/kg TS 970 0.5COD g/kg TS 1180 2OC g/kg TS 560 5NH4
+-N g N/kg TS 1.1 0.3K-N g N/kg TS 20 1.5PO4
−-P g/kg TS 1.57 0.05otassium g/kg TS 12.74 0.5alcium g/kg TS 10.2 0.5odium g/kg TS 1.32 0.5agnesium g/kg TS 2.7 0.5
2
sgpaowmCH(
2
(w
PO4 -P mg/l 1050 5lkalinity g CaCO3/l 3.2 0.35
ludge and set in batch mode with gradual increase of temper-ture from 37 to 55 ◦C (2 ◦C/day) [6] during 15 days until thetart-up of biogas production from the sludge. Then, in the firstun the digesters were fed with an influent substrate concentra-ion of 130 g COD/l at flow rates of 0.5, 0.75 and 1.5 l/day whichorresponded to 36, 24 and 12 days of HRT, respectively. In theecond run the digesters were fed with an influent substrate con-entration of 67 g COD/l at flow rates of 0.5, 0.75 and 1.5 l/dayhich corresponded to 36, 24 and 12 days of HRT, respectively.
n the third run the digesters were fed with an influent sub-trate concentration of 43 g COD/l at flow rates of 0.5, 0.75 and.5 l/day which corresponded to 36, 24 and 12 days of HRT,espectively. In the fourth run two digesters were fed with onlyMW (TCOD = 67 g COD/l) at flow rates of 0.75 which corre-
ponded to an HRT of 24 days. Each run had a duration of twoo three times the corresponding HRT. The volume of biogasnd its composition were determined daily and samples wereollected from effluents and analysed for at least five times pereek.Table 4 summarises, in detail, the operation conditions and
he feed composition used in these runs.
.4. Chemical analyses
The followings parameters were determined: pH, total andoluble COD, TS, VS, TSS, VSS, TOC, TKN, ammonium nitro-en, phosphorus, calcium, potassium, TVFA, alkalinity and totalhenolic compounds (reported as phenylic acid equivalent). Allnalyses were carried out according to the recommendationsf the standard methods of APHA [19]. The volume of biogasas measured using a gas-meter. The methane percentage waseasured using a chemical method that consist in dissolving theO2 gas of 100 ml biogas into NaOH solution (270 g/l). Whereas2S and NH3 percentages were measured using Drager tubes
Drager, Germany).
.5. Statistical analyses
The statistical analyses of the data and the results in this studyanalysis of average values, variance and standards deviation)ere performed using Excel 2003.

198 B. Fezzani, R.B. Cheikh / Chemical Engineering Journal 132 (2007) 195–203
Table 4Influents composition used under different OLR in a semi-continuous feeding tubular digester
Run Influent TCOD(g COD/l)
HRT(day)
OLR(g COD/(l day))
Operationaltime (day)
Flow rate(l/day)
InfluentpH
Influent composition
1 130 36 3.62 70 0.5 7.5 ± 0.1 OMW (ml) 500 ± 0.1Water (ml) 0.0OMSW (g) 28 ± 0.1
24 5.42 70 0.75 7.5 ± 0.1 OMW (ml) 750 ± 0.1Water (ml) 0.0OMSW (g) 56 ± 0.1
12 10.834 40 1.5 7.5 ± 0.1 OMW (ml) 1500 ± 0.1Water (ml) 0.0OMSW (g) 112 ± 0.1
2 67 36 1.862 70 0.5 7.5 ± 0.1 OMW (ml) 375 ± 0.1Water (ml) 125 ± 0.1OMSW (g) 28 ± 0.1
24 2.792 70 0.75 7.5 ± 0.1 OMW (ml) 500 ± 0.1Water (ml) 250 ± 0.1OMSW (g) 56 ± 0.1
12 5.584 50 1.5 7.5 ± 0.1 OMW (ml) 1000 ± 0.1Water (ml) 500 ± 0.1OMSW (g) 112 ± 0.1
3 43 36 1.194 70 0.5 7.5 ± 0.1 OMW (ml) 125 ± 0.1Water (ml) 375 ± 0.1OMSW (g) 28 ± 0.1
24 1.792 70 0.75 7.5 ± 0.1 OMW (ml) 250 ± 0.1Water (ml) 500 ± 0.1OMSW (g) 56 ± 0.1
12 3.584 50 1.5 7.5 ± 0.1 OMW (ml) 500 ± 0.1Water (ml) 1000 ± 0.1OMSW (g) 112 ± 0.1
4 67 24 2.792 60 0.75 7.5 ± 0.1 OMW (ml) 500 ± 0.1
E repli
3
3
3
tFtigcabte
maai13d
6sdccbbHgwcmactmorc
ach value is an average of three replicates. “±” shows standards errors among
. Results and discussion
.1. Biogas production
.1.1. Effect of the HRT on biogas productionThe daily biogas production observed at different HRT for
he three influents substrate concentrations are illustrated inig. 2. As can be seen at an HRT of 12 days and for the
hree influent substrate concentration studied we observe anntense production of biogas followed by sharp drop of bio-as production. Whereas, for the others two influent substrateoncentrations studied at an HRT of 24 and 36 days we observefluctuated production of biogas followed by a steady state ofiogas production. Table 5 summarises the steady state opera-ion result including HRT, biogas productivity, pH and TVFA offfluents.
The best biogas productivity (66 l/((l OMW) day)) withethane content of 70% was obtained at an HRT of 36 days with
n influent substrate concentration of 130 g COD/l. We noticelso that the pH of effluents remained within the optimal work-
ng range (7.2–7.7) and the TVFA level in effluents were below500 mg/l for the three influents studied at an HRT of 24 and6 days. However, for all the influent studied at an HRT of 12ays the pH of effluents dropped below 6.3 and TVFA rose over3
gw
Water (ml) 250 ± 0.1
cates.
.5 g/l. This accumulation of volatiles fatty acids in effluents athort HRT was due to the fact that acedogenic bacteria may pro-uce volatile fatty acids (VFA) faster than methanogenic bacteriaan consume it and the excess of VFA can build up in the digesterausing consequently a drop in the effluent pH and an inhi-ition of the methanogenesis process. Besides, methanogenicacteria were washed out from the digester, operated at a shortRT, before growing enough to achieve the process of bio-as production. Comparing the results of biogas productivityith those obtained at mesophilic temperature for the same
onditions of feed concentration and HRT we notice that bestethane productivity was increased from 23 l/((l OMW) day)
t mesophilic conditions to 46 l/((l OMW) day) at thermophiliconditions [18]. This increase of methane productivity was dueo the increase of hydrolysis rate of OMSW that contribute with
uch more amount of ammonium nitrogen, also to the increasef both methanogenic bacteria growth and biological reactionsates inside the digester operated at thermophilic conditionsompared to mesophilic conditions.
.1.2. Effect of the OMSW on biogas productionFig. 3 shows biogas productions, effluent ammonium nitro-
en and effluent TVFA for an OMW of 67 g COD/l co-digestedith OMSW compared to those obtained for the same influent

B.Fezzani,R
.B.C
heikh/C
hemicalE
ngineeringJournal132
(2007)195–203
199
Table 5Steady-state results of the anaerobic co-digestion of OMW with OMSW under different experimental conditions
HRT (days) Influent TCOD(g COD/l)
EffluentpH
EffluentTVFA (g/l)
Effluent totalphenol (g C6H6O/l)
Biogas productivity(l/((l OMW fed) day)
CH4 (%) H2S (ppm) NH3 (ppm) Phenol removalefficiency (%)
36 130 7.5 ± 0.1 0.5 ± 0.1 3.6 ± 0.2 66.024 ± 0.059 70 ± 0.016 280 ± 30 10 ± 3 72.30 ± 0.224 7.5 ± 0.1 1.4 ± 0.1 4.75 ± 0.2 45.336 ± 0.036 68 ± 0.02 320 ± 30 1 ± 0.5 63.46 ± 0.212 6.1 ± 0.2 10.4 ± 0.5 11.50 ± 0.2 2.5 ± 0.016 20 ± 0.032 45 ± 20 0 11.5 ± 0.2
36 67 7.7 ± 0.1 0.5 ± 0.5 2.55 ± 0.2 42.01 ± 0.023 76 ± 0.025 250 ± 10 20 ± 5 70.55 ± 0.224 7.7 ± 0.1 0.6 ± 0.05 3.30 ± 0.2 53.35 ± 0.024 72 ± 0.032 280 ± 25 5 ± 2 61.89 ± 0.212 6.2 ± 0.2 12.5 ± 0.5 6.20 ± 0.2 1.5 ± 0.037 24 ± 0.022 50 ± 40 0 28.4 ± 0.2
36 43 7.5 ± 0.1 0.4 ± 0.1 2.15 ± 0.2 23 ± 0.020 75 ± 0.025 210 ± 10 12 ± 5 50.4 ± 0.224 7.6 ± 0.1 0.5 ± 0.1 2.35 ± 0.2 40 ± 0.031 74 ± 0.025 220 ± 35 7 ± 3 45.76 ± 0.212 6.3 ± 0.2 6.5 ± 0.5 3.50 ± 0.2 1.5 ± 0.031 25 ± 0.025 45 ± 20 0 19.22 ± 0.2
Each value is an average of three replicates taken after the steady-sate conditions were reached; “±” shows standards errors among replicates.
Fig.2.B
iogasproduction
atdifferentHR
Ts:12
days(a),24
days(b)and
36days
(c)and
differentOM
Wsubstrate
concentrations:130g
CO
D/l(�
),67g
CO
D/l
(�)
and43
gC
OD
/l(+).
digestedalone
undertherm
ophilicconditions
atan
HR
Tof
24days.
As
canbe
seen,for
OM
Wdigested
alonew
eobserve
anintense
biogasproduction
ofabout
75l/day
duringthe
first15
daysfollow
edby
asharp
decreasein
biogasproduction
which
stoppedat
the41
days.W
enotice
alsoa
sharpincrease
ofT
VFA
levelanda
sharpdecrease
ofam
monium
nitrogenbelow
200m
g/lin
theeffluent.
Whereas,
forO
MW
co-digestedw
ithO
MSW
we
observea
sharprise
ofbiogasproduction
toapprox-
imately
60l/day
followed
bya
gradualdecrease
untilreaching
asteady
stateof
biogasproduction
about32
l/day.In
thecase
ofO
MW
digestedalone
thecessation
ofbiogas
productionand
thehigh
levelof
TV
FAlevel
ineffluents
were
dueto
the

200 B. Fezzani, R.B. Cheikh / Chemical Engin
Fig. 3. Effect of OMSW on biogas production, effluent ammonium nitrogen andTVFA at an HRT of 24 days and OMW substrate concentration of 67 g COD/l.
r2uilmaOTobsaadwiw[mtdc
i[
3
boatHaaoicT
Table 6Steady-state results of COD removal efficiency of OMW co-digested with OMSW at
HRT (day) Influent COD (g/l) Effluent CO
TCOD SCOD TCOD
12 130 ± 0.5 80 ± 0.5 95 ± 0.567 ± 0.5 56 ± 0.5 55 ± 0.543 ± 0.5 36 ± 0.5 37 ± 0.5
24 130 ± 0.5 80 ± 0.5 46 ± 0.567 ± 0.5 56 ± 0.5 41 ± 0.543 ± 0.5 36 ± 0.5 30 ± 0.5
36 130 ± 0.5 80 ± 0.5 37 ± 0.567 ± 0.5 56 ± 0.5 34 ± 0.543 ± 0.5 36 ± 0.5 25 ± 0.5
Each value is an average of three replicates. “±” shows standards errors among repli
eering Journal 132 (2007) 195–203
apid decrease of ammonium nitrogen inside the reactor below00 mg N/l. Whereas for OMW co-digested with OMSW, a grad-al decrease of ammonium nitrogen and a low level of TVFAn effluents were observed. In fact, OMSW contains a highevel of particulate nitrogen which after hydrolysis under ther-
ophilic conditions contributes with a significant amount ofmmonium nitrogen to compensate the low level of NH4
+ inMW that decreases rapidly by methanogenic bacteria needs.his continual supply in ammonium nitrogen by OMSW willvoid the risk of shortage in NH4
+ and maintains methanogenicacteria growth to achieve the process of biogas production atteady state. Table 8 confirms our deductions and gives themounts of ammonium nitrogen of the two effluents (OMWnd OMW + OMSW) at steady state. As can be seen for OMWigested alone the amount of ammonium nitrogen in the effluentas decreased to 200 ± 30 mg N/l compared to 600 ± 30 mg N/l
n the effluent of OMW co-digested with OMSW. These resultsould support the earlier work by Angelidaki and coworkers
15–17] who studied the anaerobic co-digestion of OMW withanure under thermophilic conditions and their results showed
hat OMW could successfully treated without previous dilutionue to the high content of ammonium offered by manure toompensate for the deficiency in OMW.
Also, she showed in other work that TVFA level in effluentsncreased rapidly at NH4
+-concentrations lower than 250 mg N/l16].
.2. Composition of biogas
Table 5 shows the average composition of the producediogas during the steady state period of the three influentsf OMW (43, 67 and 130 g COD/l) co-digested with OMSWt the following HRT: 12, 24 and 36 days. As can be seen,he methane percentage was increased with the increase ofRT. The best methane percentage (76%) was obtained with
n influent substrate concentration of 67 g COD/l digested atn HRT of 36 days. Indeed, at long HRT there were increase
f contact between bacteria and substrates. Besides, OMWnfluents which have low concentration of COD have also lowoncentration of inhibiting compounds such as phenol andVFA, reason why the methanogenic process was improved.different HRT and influent substrate concentration
D (g/l) COD removal efficiency (%)
SCOD �(g) �(SCOD)
65 ± 0.5 26.92 ± 0.5 18.75 ± 0.546 ± 0.5 17.91 ± 0.5 17.85 ± 0.528 ± 0.5 13.95 ± 0.5 22.22 ± 0.5
28 ± 0.5 64.61 ± 0.5 65 ± 0.524 ± 0.5 38.8 ± 0.5 57.14 ± 0.519 ± 0.5 30.23 ± 0.5 47.22. ± 0.5
25 ± 0.5 71.54 ± 0.5 68.75 ± 0.520 ± 0.5 49.25 ± 0.5 64.28 ± 0.517 ± 0.5 41.86 ± 0.5 52.78 ± 0.5
cates.
ngin
WiNiaopmgtit
3
mcpWohlOeoi[tOtmotdtttltlT
lmwat
3
ocwdl
v
3
bp
E
w((a
dadaobhi
TT
H
1
2
3
E
B. Fezzani, R.B. Cheikh / Chemical E
e notice also for non-failed reactors, that H2S percentagesnto biogas were decreased with the increase of HRT, whereasH3 percentages were increased with the increase of HRT. This
ncrease of free ammonia with HRT was due to the increase inmmonium nitrogen concentration offered by the hydrolysis ofrganic nitrogen compounds contained in OMSW and whichasses into the biogas in the form of free ammonia. Further-ore, the presence of these gases in thermophilic reactors in
reat amounts compared to mesophilic reactors were due tohe solubility of NH3, H2S and H2 gases that decreased withncreasing temperature causing high transfer of these gases intohe biogas and producing consequently an odorous effluent.
.3. COD removal efficiency
Effluents COD removal efficiency and their qualities are sum-arised in Table 6. As can be seen an OMW of 130 g COD/l
o-digested with OMSW at an HRT of 36 days gave the besterformances with a SCOD removal efficiency of 68.75%.hereas, the best quality of effluents (SCOD = 17 g COD/l) was
btained with the lowest influent TCOD concentration and theighest HRT studied. These results of COD destruction wereower than those obtained from the anaerobic co-digestion ofMW with manure in CST reactor that gave a SCOD removal
fficiency of 75% [15]. Whereas they were higher than thosebtained from the anaerobic co-digestion of OMW with manuren USAB reactors that gave a SCOD removal efficiency of 65%17]. Moreover, comparing these results with those given byhe previous work that studied the co-digestion of OMW withMSW in tubular digester at mesophilic temperature we found
hat COD removal efficiencies of influents treated under ther-ophilic conditions were decreased [18]. For instance, an OMW
f 67 g COD/l co-digested with OMSW at an HRT of 36 days,he SCOD removal efficiency was 64% under thermophilic con-itions compared to 77% under mesophilic conditions. Besides,he colour of all effluents, rejected from digesters operated athermophilic temperature, were dark red purple due to the facthat they still contain polyphenolic compounds of high molecu-
ar weight such tannins and anthocyanes [20] that increase afterhe hydrolysis of OMSW. This means that these polypheno-ic compounds were not degradable by thermophilic bacteria.able 5 confirms our deductions and shows both total phenolootd
able 7he amount of TKN, phosphorus, potassium, calcium, sodium and magnesium in the
RT (day) Influent TCOD (g/l) TK-N (mg/l) TPO4−-P
2 130 1950 ± 20 1282 ± 1567 1350 ± 20 1050 ± 1543 850 ± 20 520 ± 15
4 130 2350 ± 20 1170 ± 1567 1560 ± 20 780 ± 1543 950 ± 20 490 ± 15
6 130 2450 ± 20 1220 ± 1567 1870 ± 20 860 ± 1543 1050 ± 20 540 ± 15
ach value is an average of three replicates. “±” shows standards errors among replic
eering Journal 132 (2007) 195–203 201
evels in effluents and phenol removal efficiency under ther-ophilic conditions. As can be seen, phenol removal efficiencyere below 75% and the total phenol levels in all effluents were
bove 2 g C6H6O /l for the three influents studied under differenthermophilic conditions.
.4. Mineral contents of digested effluents
Total Kjeldhal nitrogen, phosphorus, potassium and calciumf different effluents at different HRT are presented in Table 7. Asan be seen the concentration of mineral elements in effluentsere much higher than those in influents. These results wereue to the degradation of organic compounds into methane andiberation of mineral elements that accumulate in effluents.
The richness of effluents in mineral substances made themery important for agricultural grounds to increase their fertility.
.5. Net energy production
The net energy production Ep (kJ/day) is the differenceetween the produced energy and the energy consumed by therocess and expressed as follows:
p = EA − (EB + EC + ED) (1)
here EA is the daily energy production by an anaerobic digesterkJ/day), EB the daily energy required to heat influent substratekJ/day), EC the energy loss through the digester walls (kJ/day),nd ED is the electrical energy required by the digester (kJ/day).
The expressions of EA, EB, EC and ED were described inetail by Bouallagui et al. [6] who studied the thermophilicnaerobic digestion of fruits and vegetables wastes in the sameigesters. The results of the net energy production from thenaerobic co-digestion of OMW with OMSW under differentperation conditions were summarised in Table 9. As cane seen, the net energy under thermophilic temperature wereigher compared to those under mesophilic temperature. Fornstance the net energy production obtained from the digestion
f an influent substrate concentration of 67 g COD/l at an HRTf 24 days in thermophilic temperature was 427 kJ/day higherhan that obtained from the same influent operated at mesophilicigesters.effluents at different HRT and influents TCOD concentrations
K (mg/l) Ca (mg/l) Na (mg/l) Mg (mg/l)
3520 ± 10 2010 ± 20 314 ± 15 570 ± 153490 ± 10 3630 ± 20 546 ± 15 1390 ± 152650 ± 10 2800 ± 20 225 ± 15 430 ± 15
5200 ± 10 4750 ± 20 670 ± 15 2700 ± 153860 ± 10 2450 ± 20 510 ± 15 670 ± 152800 ± 10 3250 ± 20 425 ± 15 750 ± 15
5650 ± 10 5200 ± 20 750 ± 15 950 ± 154300 ± 10 4350 ± 20 655 ± 15 1250 ± 153000 ± 10 3600 ± 20 550 ± 15 850 ± 20
ates.

202 B. Fezzani, R.B. Cheikh / Chemical Engineering Journal 132 (2007) 195–203
Table 8The amount of ammonium nitrogen, phosphorus and potassium in the effluents of OMW digested alone compared to those in OMW co-digested with OMSW
HRT (day) Influent TCOD (g/l) TNH4+-N (mg N/l) TPO4
−-P (mg/l) K (mg/l)
OMW OMW + OMSW OMW OMW + OMSW OMW OMW + OMSW
24 67 200 ± 30 600 ± 30 530 ± 15 780 ± 15 1380 ± 10 3860 ± 10
Each value is an average of three replicates. “±” shows standards errors among replicates.
Table 9Effect of influent TCOD concentrations and temperature on net energy production at an HRT of 24 days
Influent TCOD(g COD/l)
T (◦C) Energy production inthe digester (kJ/day)
Energy consumed forload heating (kJ/day)
Energy loss through thedigester walls (kJ/day)
Net energy production(kJ/day)
Reference
130 55 828.18 111.91 86.28 629.99 This study35 360.86 47.97 38.34 274.55 [18]
67 55 1034.70 111.91 86.28 836.51 This study35 496.20 47.97 38.34 409.89 [18]
4
4
scom4wOpwtHtnratelprboma
A
PMGks
R
[
[
[
[
[
3 55 536.46 111.9135 329.30 47.97
. Conclusion
We conclude from this study that OMW could be degradeduccessfully in co-digestion with OMSW under thermophiliconditions without previous dilution and without additionf chemical nitrogen substances. The best performance inethane productivity and SCOD removal efficiency were
6 l CH4/((L OMW fed) day) and 68.97%, respectively. Theyere obtained with an OMW of 130 g COD/l co-digested withMSW at an HRT of 36 days. Besides, the best net energyroduction from digesters operated at thermophilic temperatureas 427 kJ/day higher than from those operated at mesophilic
emperature for the same conditions of feed concentration andRT. Nevertheless and despite the above mentioned benefits,
hermophilic anaerobic co-digestion of OMW with OMSW isot entirely successful in reaching the treatment efficienciesequired by the national regulations of all the Mediterraneanrea countries and the COD removal efficiency was lowerhan that obtained using mesophilic conditions. Besides, efflu-nts rejected from the thermophilic digesters contained higherevel of polyphenolic compounds responsible of the darkurple colour (tannins and anthocyanes) compared to thoseejected from digesters operated under mesophilic conditionsecause thermophilic bacteria could not degrade these kindsf polyphenolic compounds. Furthermore, an inhibition of theethanogenic process was observed with all influents studied at
n HRT ≤ 12 days.
cknowledgements
The authors wish to express their gratitude and thanks tor. Chedly Abdelly from Biotechnology Centre at INRST and
rs. Salwa Rejeb and Mr. Larbi Takrouni from the INR-REF also Mrs. Leila Ben Dhiab from soil direction for theirind and excellent helps with some experimental work of thistudy.[
86.28 338.27 This study38.34 242.99 [18]
eferences
[1] J.A. Fiestas, B. Lutwin, K. Ernst, G. Klemens, M. Kachouri, Mediter-ranean Experiences on the Treatment and the Elimination of Olive MillWastewater, GTZ Edition Tunisia, 1996.
[2] M.H. El-Mashad, G. Zeeman, G. Lettinga, Thermophilic anaerobic diges-tion of cow manure: effect of temperature on hydrolysis, in: TheProceedings of the 9th World Congress of Anaerobic Digestion, Belgium,IWA Antwerp, September 2001, pp. 2–6.
[3] J.F. Andrews, H.O. Buhr, The thermophilic anaerobic process, Water Res.11 (1977) 129–143.
[4] Z. Mladenovska, B.K. Ahring, Growth kinetics of thermophilicMethanosacina spp. isolated from full scale plants treating animal manure,FEMS Microbiol. Ecol. 31 (2000) 225–229.
[5] H. Watanabe, T. Kitamura, S. Ochi, M. Ozaki, Inactivation of pathogenicbacteria under mesophelic and thermophilic conditions, Water Sci. Technol.36 (6–7) (1997) 25–32.
[6] H. Bouallagui, O. Haouari, R. BenCheikh, M. Hamdi, Y. Touhami, L.Marouani, Effect of temperature on the performance of an anaerobic tubu-lar reactor treating fruit and vegetable waste, Process Biochem. 39 (2004)2143–2148.
[7] G. Boari, A. Brunetti, R. Passino, A. Rozzi, Anaerobic digestion of olivemill wastewater, Agric. Wastes 10 (1984) 161–175.
[8] R. Borja, A. Martin, A. Garrido, Anaerobic digestion of black olive wastew-ater, Bioresour. Technol. 45 (1993) 27–32.
[9] G. Lyberatos, M.S. Fountoulakis, S.N. Dokianakis, M.E. Kornaros, G.G.Aggelis, Removal of phenolics in olive mill wastewaters using the white-rotfungus Pleurotus ostreatus, Water Res. 36 (2002) 4735–4744.
10] G.N. Demirer, T.H. Erguder, E. Guven, Anaerobic treatment of olive millwastes in batch digester, Process Biochem. 36 (2000) 243–248.
11] S.P. Tsonis, S.G. Grigoropolous, Anaerobic tretability pf olive mill wastew-ater, Water Sci. Technol. 28 (1993) 34–44.
12] M. Hamdi, Anaerobic digestion of olive mill wastewater, Process Biochem.31 (2) (1996) 105–110.
13] R. Borja, A. Martin, V. Valonso, I. Garcia, C.J. Banks, Influence of differentaerobic pre-treatments on the kinetics of anaerobic digestion of olive millwastewater, Water Res. 29 (2) (1995) 489–495.
14] H.N. Gavala, I.V. Skiadas, G. Lyberatos, On the performance of a central-
ized digestion facility receiving seasonal agroindustrial wastewaters, WaterSci. Technol. 40 (1) (1999) 339–346.15] I. Angelidaki, B.K. Ahing, Co-digestion of olive mill wastewaters withmanure, household waste or sewage sludge, Biodegradation 8 (1997)221–226.

ngin
[
[
[
[
USA, 1995.
B. Fezzani, R.B. Cheikh / Chemical E
16] I. Angelidaki, B.K. Ahing, L. Ellegaard, Modelling anaerobic co-digestionof manure with olive mill effluent, Water Sci. Technol. 36 (1997) 263–270.
17] I. Angelidaki, B.K. Ahing, H. Deng, J.E. Schmidt, Anaerobic digestion of
olive mill effluents together with swine manure in USAB reactors, WaterSci. Technol. 45 (10) (2002) 213–218.18] B. Fezzani, R. BenCheikh, Anaerobic co-digestion of olive mill waste waterwith olive mill solid waste in a tubular digester at a mesophilic temperature,Bioresour. Technol. 98 (2007) 769–774.
[
eering Journal 132 (2007) 195–203 203
19] APHA (American Public Health Association), Standard Methods for theExamination of Water and Wastewater, 19th ed., APHA, Washington, DC,
20] V. Balice, C. Carrieri, O. Cera, B. Rindone, The fate of tannin like com-pounds from olive mill effluents in biological treatments, in: Proceedingsof the Fifth International Symposium on Anaerobic Digestion, Bologna,Italy, 1988, pp. 275–280.