thermomechanical behavior of shape memory elastomeric composites
TRANSCRIPT

Contents lists available at SciVerse ScienceDirect
Journal of the Mechanics and Physics of Solids
Journal of the Mechanics and Physics of Solids 60 (2012) 67–83
0022-50
doi:10.1
n Corr
E-m
journal homepage: www.elsevier.com/locate/jmps
Thermomechanical behavior of shape memoryelastomeric composites
Qi Ge a, Xiaofan Luo b,c, Erika D. Rodriguez b,d, Xiao Zhang e, Patrick T. Mather b,c,Martin L. Dunn a, H. Jerry Qi a,n
a Department of Mechanical Engineering, University of Colorado, Boulder, CO 80309, USAb Syracuse Biomaterials Institute, Syracuse University, Syracuse, NY 13244, USAc Department of Biomedical and Chemical Engineering, Syracuse University, Syracuse, NY 13244, USAd Department of Mechanical and Aerospace Engineering, Syracuse University, Syracuse, NY 13244, USAe Winter Park High School, Winter Park, FL 32792, USA
a r t i c l e i n f o
Article history:
Received 14 February 2011
Received in revised form
21 September 2011
Accepted 25 September 2011Available online 1 October 2011
Keywords:
Shape memory
Shape memory polymers
Soft active materials
Thermomechanical behaviors
Constitutive models
96/$ - see front matter & 2011 Elsevier Ltd. A
016/j.jmps.2011.09.011
esponding author. Tel.: þ1 303 492 1270.
ail address: [email protected] (H.J. Qi).
a b s t r a c t
Shape memory polymers (SMPs) can fix a temporary shape and recover their permanent
shape in response to environmental stimuli such as heat, electricity, or irradiation. Most
thermally activated SMPs use the macromolecular chain mobility change around the glass
transition temperature (Tg) to achieve the shape memory (SM) effects. During this process,
the stiffness of the material typically changes by three orders of magnitude. Recently, a
composite materials approach was developed to achieve thermally activated shape memory
effect where the material exhibits elastomeric response in both the temporary and the
recovered configurations. These shape memory elastomeric composites (SMECs) consist of an
elastomeric matrix reinforced by a semicrystalline polymer fiber network. The matrix
provides background rubber elasticity while the fiber network can transform between solid
crystals and melt phases over the operative temperature range. As such it serves as a
reversible ‘‘switching phase’’ that enables shape fixing and recovery. Shape memory
elastomeric composites provide a new paradigm for the development of a wide array of
active polymer composites that utilize the melt–crystal transition to achieve the shape
memory effect. This potentially allows for material systems with much simpler chemistries
than most shape memory polymers and thus can facilitate more rapid material development
and insertion. It is therefore important to understand the thermomechanical behavior and to
develop corresponding material models. In this paper, a 3D finite-deformation constitutive
modeling framework was developed to describe the thermomechanical behavior of SMEC.
The model is phenomenological, although inspired by micromechanical considerations of
load transfer between the matrix and fiber phases of a composite system. It treats the matrix
as an elastomer and the fibers as a complex solid that itself is an aggregate of melt and
crystal phases that evolve from one to the other during a temperature change. As such, the
composite consists of an elastomer reinforced by a soft liquid at high temperature and a stiff
solid at low temperature. The model includes a kinetic description of the non-isothermal
crystallization and melting of the fibers during a temperature change. As the fibers transform
from melt to crystal during cooling it is assumed that new crystals are formed in an
undeformed state, which requires careful tracking of the kinematics of the evolving phases
which comes at a significant computational cost. In order to improve the computational
efficiency, an effective phase model (EPM) is adopted to treat the evolving crystal phases as
an effective medium. A suite of careful thermomechanical experiments with a SMEC was
carried out to calibrate various model parameters, and then to demonstrate the ability of the
ll rights reserved.

Q. Ge et al. / J. Mech. Phys. Solids 60 (2012) 67–8368
model to accurately capture the shape memory behavior of the SMEC system during
complex thermomechanical loading scenarios. The model also identifies the effects of
microstructural design parameters such as the fiber volume fraction.
& 2011 Elsevier Ltd. All rights reserved.
1. Introduction
Shape memory polymers (SMPs) are an emerging class of smart materials that can fix a temporary shape and recoverthe permanent shape in response to environmental stimuli such as heat, electricity, or irradiation (Lendlein and Kelch,2002, 2005). Compared to shape memory alloys, the advantages of SMPs are low density, the ability to endure large shapechanges in excess of 400%, and relatively inexpensive fabrication processes (Lendlein and Kelch, 2002, 2005). A largenumber of SMPs have been developed for microsystem actuation components, biomedical devices, aerospace deployablestructure, and morphing structures.
In SMPs triggered by a temperature change, an undeformed sample in its permanent shape is heated to TH4Ttrans where itexhibits elastomeric behavior, deformed to a desired shape, and then cooled to TLoTtrans. After unloading at TL, the sample is fixedin a temporary shape. Heating back to TH recovers the permanent shape. The most common mechanism in thermally triggeredSMP is the second order transition from the rubbery state to the glassy state (Nguyen et al., 2008; Qi et al., 2008), which isaccompanied by a large change in material modulus from a few MPa to a few GPa. This large change in modulus offers theadvantage of easy programming as the temporary shape is formed by deforming the material at a high temperature where thematerial modulus is low. However, in some applications, especially in biomedical applications such as biomimetic sensing andactuation, soft materials are desirable. Recently, several attempts have been made to create new soft and elastomeric SMPs.Rousseau and Mather (2003) developed a smectic-C liquid crystalline elastomer (LCE) exhibiting the shape memory effects basedon the smectic-C-to-isotropic transition of the LCE Weiss et al. (2008) introduced a new type of SMP consisting of an elastomericionomer and low mass fatty acids or their salts, where the ionomer provided a strong intermolecular bond between the fatty acidcrystal and the polymer to form a secondary network of the fatty acid with a transition temperature related to the meltingtemperature of the fatty acid. However, these materials involve complex, custom chemical synthesis, which presents an inherentchallenge for large scale production (Luo and Mather, 2009).
Recently, Luo and Mather (2009) reported a novel approach to develop a shape memory elastomeric composite (SMEC)by embedding a crystallizable thermoplastic fiber network into an elastomeric matrix. In the approach, a poly (e-caprolactone) (PCL; Mw¼65000 g/mol, Sigma-Aldrich, St Louis, MO) is first electrospun into a fiber network (or mat). Thisfiber network is then immersed into a silicone rubber (Sylgard 184, Dow Corning Corp., Midland, MI) pre-polymer solution,which is then chemically crosslinked to produce a SMEC system: Sylgard serves as an elastomeric matrix and providesrubber elasticity, while the PCL fiber serves as a reversible ‘‘switching phase’’ for shape fixing and recovery through thecrystal–melt transition. In a thermomechanical cycle, the SMEC is heated to TH4Ttrans (Ttrans is Tm, the melting temperatureof PCL), deformed at TH, then cooled to TLoTtrans while maintaining the external load. During cooling, the PCL fibernetwork undergoes a phase transformation from a polymer melt to a semicrystalline polymer. After unloading at TL, atemporary shape is fixed due to the crystallized PCL. Heating back to TH, where PCL melts and the stress stored in thesemicrystalline PCL is released, the SMEC recovers its permanent shape. Because the operational temperatures in a shapememory cycle are much higher than the glass transition temperatures for both Sylgard and PCL, the modulus of the SMECis a few MPa at TH4Ttrans and �10 MPa at TLoTtrans.
The approach developed by Luo and Mather (2009) for Sylgard/PCL SMEC provides a paradigm for developing a widearray of smart polymer composites with different chemistries that utilize melt–crystal transition in polymers to achievethe shape memory effect. It is therefore important to understand the thermomechanical behaviors and to developcorresponding material models of the phenomena. In this paper, a 3D finite-deformation constitutive model is developed todescribe the shape memory behavior of shape memory elastomeric composites. In Section 2, we introduce a SMEC materialsystem and carry out experiments to characterize its thermomechanical (including shape memory) behavior. In Section 3,a general 3D, finite-deformation constitutive model that describes the melt–crystal evolution of the fiber network duringthermomechanical loading and the resulting effect on the behavior of the composite is presented in detail. We also presentand use an effective phase model to simulate the mechanics of the evolving phases in a more computationally efficientmanner. In Section 4, results from the model are compared with those from experiments and we explore the effects ofenvironmental and microstructural variables including the thermal rate and the composite volume fraction.
2. Materials and thermomechanical behavior measurements
2.1. Materials
A SMEC was prepared using a silicone rubber (Sylgard 184) as the elastomeric matrix and electrospun PCL as thecrystallizable fiber reinforcement. Details regarding the fabrication process and the resulting morphology of the isotropic

Q. Ge et al. / J. Mech. Phys. Solids 60 (2012) 67–83 69
Sylgard/PCL SMEC can be found in Luo and Mather (2009) and are briefly presented in Supplementary material. Thematerial is then cut into 13.86�2.77�0.68 mm rectangular thin film samples for testing.
2.2. Physical and mechanical properties
Dynamic mechanical analysis (DMA) tests for the Sylgard/PCL SMEC and neat Sylgard were conducted using a dynamicmechanical analyzer (Q800 DMA, TA Instruments). From DMA (see Fig. S2a and b), it was found that the glass transitiontemperature of the neat Sylgard is �127 1C. The glass transition and crystallization temperatures of PCL are �49.5 1C and27.2 1C, respectively. At 80 1C, the storage modulus for the Sylgard/PCL SMEC is 1.4 MPa, while for the neat Sylgard it is3.16 MPa. More details about the DMA tests are reported in the Supplementary materials.
2.3. Shape memory behavior
Shape memory behavior of an SMEC results from a four-step thermomechanical loading–unloading cycle, as illustratedin Fig. 1. In Step 1 (S1), the SMEC is isothermally predeformed (stretched in this paper) at TH4Tm (the melting temperatureof PCL). Step 2 (S2) cools the material to TLoTc (the crystallization temperature of PCL) whilst the stretching force ismaintained. After unloading (Step 3, S3), the SMEC is fixed at (or programmed to) the temporary shape at TL. The SMEC canmaintain this shape as long as the temperature does not change. In the final step (Step 4, S4), the shape memory effect isrealized by raising the temperature to TH and the initial shape is recovered.
The measured shape memory behavior of the Sylgard/PCL SMEC is shown in stress–temperature–strain (Fig. 2a) andstrain–temperature plots (Fig. 2b), under three different imposed nominal stresses (0.1, 0.15, 0.2 MPa). In S1, the samplewas stretched at 80 1C (TH) by gradually ramping the tensile stress at a loading rate of 0.1 MPa/min to the predefined value(0.1, 0.15, and 0.2 MPa in the three different cases, respectively). In S2, the temperature was decreased to 5 1C (TL) at a rateof �2 1C/min while the nominal stress was fixed. Fig. 2a and b show that, when lowering the temperature, the straininitially increased for the 0.15 and 0.2 MPa cases, but decreased for the 0.1 MPa case. At a temperature of about 30 1C, thestrain dropped by �1% due to crystallization of PCL. In S3, the stress was quickly released at 5 1C. Here, a slight contractionof the sample can be observed. In S4, the unconstrained strain recovery was triggered by heating back to 80 1C at a rate of2 1C/min. In order to further quantify the shape memory behavior, the fixing ratio Rf and the recovery ratio Rr are used asfollowing (Luo and Mather, 2009; Rousseau, 2008):
Rf ¼eu
em� 100%, Rr ¼
eu�ep
eu�e0� 100%, ð1Þ
Fig. 1. Schematics of the free/constrained recovery experiments. The left side shows the thermomechanical loading–unloading cycle for free recovery.
The right side shows the constrained recovery cycle.

Fig. 2. Shape memory behavior of Sylgard/PCL SMECs with different imposed stresses: (a) stress–temperature–strain plot showing the 3D shape memory
cycles; (b) strain–temperature plot.
Table 1Rf and Rr for the Sylgard/PCL SMEC at various of training stresses.
0.1 MPa 0.15 MPa 0.2 MPa
Rf 84.0% 88.4% 88.8%
Rr 98.2% 99.2% 99.7%
Fig. 3. The constrained recovery of the Sylgard/PCL SMEC: (a) stress–temperature–strain plot; (b) strain–temperature plot.
Q. Ge et al. / J. Mech. Phys. Solids 60 (2012) 67–8370
where em and eu are the strains before and after unloading at TL, ep is the permanent strain after heat induced recovery ande0 is the initial strain at TH. The calculated Rf and Rr from our experiments are listed in Table 1 for the three differentimposed nominal stress cases. The recovery ratios Rr for the three cases are 498%, demonstrating the excellent recoverycapability of the material. On the other hand, the fixing ratios Rf are �80%, which are lower than those (497%) reported byLuo and Mather (2009). In fact, the fixity of SMEC can be tuned by changing the Sylgard/PCL composition. This will bediscussed in Section 4.3.2.
A constrained recovery experiment (schematically shown in Fig. 1) was also conducted. Note that the only differencebetween the free recovery and the constrained recovery is that the constrained recovery does not have the unloading step(S3). Fig. 3a and b show the results of the constrained recovery experiment with an imposed nominal stress of 0.15 MPa.

Fig. 4. Measured thermal strain during a temperature cycle.
Fig. 5. Shape memory behavior with different thermal rates (1 1C/min (red), 2 1C/min (blue), 5 1C/min (black) and 10 1C/min (brown)): (a) stress–
temperature–strain plot; (b) strain–temperature plot. (For interpretation of the references to color in this figure legend, the reader is referred to the web
version of this article.)
Q. Ge et al. / J. Mech. Phys. Solids 60 (2012) 67–83 71
In S1, the sample was first stretched at 80 1C (TH) by gradually ramping the tensile stress to 0.15 MPa. At S2, thetemperature was decreased to 5 1C (TL) at a rate of �2 1C/min while the stress was fixed as a constant. In S4, the stretchedsample was heated back to 80 1C at a rate of 2 1C/min. The strain increased initially when increasing temperature. At about60 1C, the strain decreased with increasing temperature. At 80 1C, the sample has recovered to the stretched shape in S1.
2.4. Thermal deformation
We measured the thermal deformation of the SMEC and the results are shown in Fig. 4. A small stretching force(1�10�4 N) was applied to ensure the sample was straight. The temperature was decreased from 80 to �10 1C at a rate of2 1C/min and heated back to 80 1C at the same rate. In Fig. 4, the material first contracted linearly with a coefficient ofthermal expansion (CTE) of 2.66�10�4/1C, and then nonlinearly contracted by about 1% due to crystallization over thetemperature range from about 25–15 1C. Below 15 1C, the material again contracted linearly with a CTE of 1.57�10�4/1C.The total thermal strain at 5 1C was �2.11%. When heating from �10 to 80 1C, the material expanded roughly linearly,then ascended abruptly by about 1% due to melting in the narrow temperature range from about 50–60 1C, and finallyexpanded almost linearly again closing the loop at 80 1C.

Q. Ge et al. / J. Mech. Phys. Solids 60 (2012) 67–8372
2.5. Effects of thermal rates
In order to investigate the effect of thermal rates on the shape memory behavior, four different thermal rates (1, 2, 5 and10 1C/min)1 with a 0.15 MPa nominal stress were applied to free recovery experiments (Fig. 5a and b). For the 1 and 2 1C/mincases, the curves show a similar trend and about 90% of deformation can be fixed after unloading. For the 5 1C/min caseand 10 1C/min cases, crystallization does not finish completely upon cooling resulting in poorer shape fixity; Rf�60%, for the5 1C/min and �40% for the10 1C/min case (Fig. 5b).
3. Model description
3.1. Overall model
In this section, we develop a continuum thermomechanical constitutive model framework for shape memoryelastomeric composites by treating the matrix and fiber network as a homogenized system of multiple phases. Thematrix is taken as a conventional elastomer and the fiber network is idealized as a two-phase aggregate of melt andcrystalline regions; it is a melt at high temperatures and is an elastic solid at low temperatures. The evolution of the meltand crystalline phases in the fiber is described by existing theories of crystallization. Our goal is to develop a modelingapproach for this class of materials and so at this point, some levels of detailed understanding are sacrificed in favor of areasonably simple way to describe the complex thermomechanical phenomena and therefore several assumptions aremade:
(i)
1
equip
the sa
the m
unde
Since the fiber (PCL) melts behave like liquids, they can only carry hydrostatic pressure under compressive conditions.Since the fiber sits in an interconnected network, some fiber melts may leak out of the SMEC under hydraulic pressure.To simplify the model, we assume that the melt phase does not support loads. Future studies should consider the loadcarrying capability of the melt phase that can be assessed using micromechanics considerations.
(ii)
Since the melting temperature of the fiber (PCL) is much higher than its glass transition temperature, the relaxationtime of the fiber melts is fast at the temperature near its melting temperature. Therefore, it is assumed that theexternal loading does not affect the morphology of the fiber crystals.(iii)
During crystallization, the fiber crystals are formed in a stress-free (natural) configuration (Rajagopal and Srinivasa,1998a,b). The fiber crystals formed at different times thus have a different deformation history.(iv)
During crystallization, the deformation transfer is simplified by an averaging scheme that assumes that both thematrix and the crystalline phase undergo a small deformation increment.(v)
Since deformation of the crystals is limited (�1% tensile at S2 and �1% compressive at S3) in a shape memory cycle,their inelastic deformation is not considered.(vi)
In order to reflect the complex load sharing among the fiber network and matrix, we use the concentration factorapproach, motivated by micromechanical considerations. For simplicity, though, we assume the stress concentrationfactors are constant during a shape memory cycle. A more detailed analysis would consider their evolution as the fibernetwork evolves.Fig. 6 shows a 1D representation of the constitutive model. We decompose the deformation of the material into amultiplicative split of a thermal and mechanical component:
G¼GMGT¼ FGT , F¼GM , ð2Þ
where G is the total deformation gradient, GM is the mechanical deformation gradient and gives rise to stress, GT is thedeformation gradient due to thermal deformation. For the convenience of model description, we set F¼GM and use F torepresent the mechanical deformation gradient. The mechanical contribution from the matrix is represented by ahyperelastic spring in Fig. 6 because it is always in the rubbery state with a low tan d (¼0.06) during the temperaturecycle. The fiber network changes its crystallinity with temperature: When T4Tm, melt phases do not carry load; whenToTc, the fiber network crystallizes and can carry load. Since crystallization of fibers is a continuous and time dependentprocess, we further divide the fiber network into small crystalline phases formed at different times with a volume fractionof Dvc
i and a deformation gradient of Fi-m. More details will be described in the next section of the 3D generalized theory.As shown in Fig. 6, the model arranges stresses on the matrix and fiber network in parallel and the total Cauchy stress
rtotal is given by:
rtotal ¼ vMxrMxþvFbrFb, ð3Þ
In a previous study (Westbrook et al., 2010, Improved testing system for thermomechanical experiments on polymers using uniaxial compression
ment. Polymer Testing 29(4), 503–512.), it was found that the main factors affecting the temperature distribution within a sample were the size of
mple and the contact between the sample and the fixture. For a cylindrical sample (10 mm in diameter and height) with improved fixture design,
aximum temperature difference within the sample was 5.3 1C for a thermal rate of 10 1C/min). Since the sample used in this paper was a thin film
r a tensile testing setup, we expect that the temperature difference within the sample is even smaller.

Fig. 6. 1D analogy of the constitutive model for the SMEC: The block on the top represents the thermal stretch due to thermal expansion and contraction.
The left spring represents the matrix as an elastomer with modulus NkT. The right multiple springs represents crystals formed at different times within
the fiber aggregate. When a phase crystallizes, the switch turns on and acts as a solid with modulus m; when it is in the melt phase, the switch turns off
and it does not carry load (its modulus is negligible).
Q. Ge et al. / J. Mech. Phys. Solids 60 (2012) 67–83 73
where rMx and rFb are the stresses in the matrix and the PCL fiber network, respectively, vMx and vFb are the correspondingvolume fractions which satisfy vMxþvFb¼1.
In reality, the stress distribution in the phases depends on the details of the microstructure, including the geometry,and architecture of the spatial arrangement of the phases, and the evolution of their properties. We attempt to account forthe departure of stress distribution among the phases by borrowing the concept of a stress concentration factor from themicromechanics of heterogeneous solids in linear and nonlinear elasticity (Benveniste, 1987; Castaneda, 1991; Dunn,1998). Introducing stress concentration factors for the fiber and matrix, the total Cauchy stress rtotal is written as
rtotal ¼ gMxvMxrMxþgFbvFbrFb, ð4Þ
where gMx and gFb are stress concentration factors of the matrix and the fibers and gMxvMxþgFbvFb¼1. For the sake ofconvenience, gMxvMx and gFbvFb are denoted by vMx and vFb.
3.2. Crystallization and melting of the fiber network
Since the crystal–melt transition is the trigger that imparts the shape memory effect to the SMEC, it is essential tocapture the kinetics of crystallization and melting of the fibers. The classic theory to describe crystallization kinetics isAvrami’s phase transition theory (Avrami, 1939, 1940, 1941). The original derivations by Avrami was simplified by Evans(1945) with the ‘‘raindrop’’ theory, in which one idealizes the crystallization kinetics as a drop falling into a pool(representing nucleation of a crystal) that creates a wave-front that subsequently propagates (representing the growthfront of a crystal). A drop falls at time t and its front propagates from t to t. The probability that i-th wave passes over apoint P in space is given by Poisson’s equation (Ozawa, 1971):
pi ¼e�EEi
i!, ð5Þ
where E is the expectancy and is equal to the average number of such wave fronts. In the crystallization process, a point inmelt state is a point that has not been passed over by any growing front. Therefore, i¼0 gives the probability of a pointbeing in the melt (Ozawa, 1971):
p0 ¼ e�E: ð6Þ
In the case of crystallization, the expectancy E is equal to V(t), the volume fraction of crystals without impingement(intersection of growth fronts) (Sperling, 2006). Therefore, the relative volume fraction of the amorphous phase is(Sperling, 2006):
1�wðtÞ ¼ e�VðtÞ, ð7Þ
where w(t) is the relative degree of crystallinity.To understand the description of V(t), it is instructive to first consider the case where crystal nuclei all develop
simultaneously upon cooling the polymer to the crystallization temperature and then extend this development to the caseof sporadic nucleation where nucleation is a function of time (Sperling, 2006). In the first case, the nucleation density is aconstant and the rate of growth of V(t) is
dVðtÞ
dt¼ AN
ðGtÞn
t, ð8Þ

Q. Ge et al. / J. Mech. Phys. Solids 60 (2012) 67–8374
where N is the nucleation density, G is the crystal growth rate (for isothermal crystallization, G is a constant at a certaintemperature), and A and n are constants related to the dimension of the crystal. For 1D rods, A¼pd2/4, n¼1, d is thediameter of the rod; for 2D discs, A¼2pd, n¼2, d is the thickness of the disc; for 3D spheres, A¼4p, n¼3. IntegratingEq. (8) over t from 0 to tc (a specific time during crystallization) yields
VðtcÞ ¼ BNðGtcÞn, ð9Þ
with B¼(A/n). For the sporadic nucleation case, the nucleation density is a function of time N(t). As time increases from t totþdt, the number of newly formed nucleus per volume is (dN(t)/dt)dt and the volume fraction of these crystalline phasesat t(t4t) is B((dN(t))/dt)[G(t�t)]ndt. Integrating over time from 0 to tc, yields the volume fraction without impingement:
VðtcÞ ¼ B
Z tc
0
dNðtÞdt½Gðtc�tÞ�ndt: ð10Þ
Eq. (10) describes the isothermal crystallization process. In the SMEC system crystallization (and melting) is actually anon-isothermal process that occurs as the temperature is lowered continuously from a temperature above to atemperature below the crystallization temperature. As the nucleation density and the crystal growth rate are functionsof temperature during non-isothermal crystallization, the nucleation density and the growth rate are functions oftemperature and time, expressed as N[T(t)] and G[T(t)], respectively. Accordingly, Eq. (9) can be modified as
VðtcÞ ¼ B
Z tc
0
dN½TðtÞ�dt
Z tc
tG½TðsÞ�ds
� �n
dt, ð11Þ
where the Hoffman–Lauritzen expression is widely adopted to describe the growth rate G[T(t)] (Lauritzen and Hoffman,1973):
G TðtÞ½ � ¼ G0 exp �U
R TðtÞ�T1½ �
� �exp �
Kg
TðtÞDTf
� �: ð12Þ
In Eq. (12), the pre-exponential factor G0 is almost independent of temperature (Angelloz et al., 2000; Isayev andCatignani, 1997). The first exponential term of Eq. (12) reflects the chain mobility in the melt, where U is the diffusionalactivation energy for the transport of crystallizable segments at the liquid–solid interface (Liu et al., 2010), R is theuniversal gas constant, TN is the temperature Tg�30 K (Angelloz et al., 2000; Isayev and Catignani, 1997). The secondexponential term contains the secondary nucleation effect on the crystal growth front (Angelloz et al., 2000) where Kg is anucleation constant (Liu et al., 2010), DT ¼ T0
m�TðtÞ is the undercooling, where T0m is the equilibrium melting temperature;
f ¼ ð2TðtÞ=½T0mþTðtÞ�Þ is a correction factor used to account for the variation of the heat of fusion with temperature
(Angelloz et al., 2000).The evolution of the number of nuclei can be empirically described by (Angelloz et al., 2000; Isayev and Catignani,
1997):
N½TðtÞ� ¼N0 expfb½T0m�TðtÞ�g, ð13Þ
where N0 is a pre-exponential factor of nucleation density and b an empirical parameter.Based on the understanding of kinetics of crystallization, the melting kinetics can be developed in an analogous
manner. During the melting processing, the volume of the existing crystals decreases until it becomes zero. Assumemelting starts at time t¼tms, the volume fraction of crystals at time t¼tmsþtm during melting can be described by
VðtmÞ ¼ B
Z tce
0
dN½TðtÞ�dt
Z tce
tG½TðuÞ�du�
Z tm
tms
C½TðuÞ�du
� �n
dt, ð14Þ
where tce is the time at which crystallization ends; in general, tce¼tms. C(t) is the rate of decrease of crystal size; in thispaper, it is treated as a constant due to our low heating rate (2 1C/min) and narrow melting temperature range (�35 to�65 1C).
By using Eq. (7) with Eqs. (11)–(14), the relative degree of crystallinity w(t) can be calculated. However, in reality,polymer crystallinity does not reach 100% but becomes saturated at some degree of crystallinity, HN. Thus, thecrystallinity is expressed as
vðtÞ ¼H1wðtÞ: ð15Þ
According to Kweon et al. (2003), for the PCL fiber, under conditions similar to those of this paper, HN¼25%.Using this model, we simulated the kinetics of crystallization and melting of PCL and results are shown in Fig. 7.
Observable crystallization starts at �30 1C and finishes at �20 1C. During melting, observable melting starts at �35 1C andfinishes at �65 1C.
3.3. Mechanical behavior
As described and shown in Fig. 1, a SMEC shape memory cycle involves four distinct thermomechanical steps. Duringthe cooling and heating steps, mechanical deformation can be coupled with crystallization/melting processes. It thereforebecomes a natural approach to describe material behavior under two thermomechanical scenarios: mechanical

Fig. 7. Simulation of crystallization and melting for PCL.
Q. Ge et al. / J. Mech. Phys. Solids 60 (2012) 67–83 75
deformation during crystallization and mechanical deformation during melting. In these two cases, we consider the one-way coupling where crystallization/melting can affect the mechanical deformation. The coupling in the reverse directionwhere mechanical deformation affects crystallization/melting kinetics is not considered. This assumption is valid for tworeasons: first, during crystallization, the material deformation rate is much slower than the relaxation time of the polymermelt so that any nonequilibrium deformation can be relaxed and thus mechanical deformation will not influencecrystallization. Second, during melting, mechanical deformation in the semicrystalline PCL is relatively small so that themelting kinetics will not be appreciably influenced. Nevertheless, if it were appreciable, a description of crystallization thatincludes a dependence on deformation could be included in our overall theory.
3.3.1. Mechanical behavior of the constituents
For convenience we take both the matrix and the fiber network to be hyperelastic solids. In our case the matrix, Sylgard,is in its rubbery state during a shape memory cycle, while the PCL crystals, although linear elastic, can be idealized ashyperelastic. As such there exist free energy functions so that the Cauchy stresses can be obtained as
rMxðFMxÞ ¼ J�1
ðFMxÞ@WMx
ðFMxÞ
@FMxðFMxÞT ,
rFbCðFFbCÞ ¼ J�1
ðFFbCÞ@WFbC
ðFFbCÞ
@FFbCðFFbCÞT , ð16Þ
where the superscripts Mx and FbC indicate the quantities associated with the matrix and crystalline component of thefiber network, respectively; W is the free energy density function; r is the Cauchy stress tensor; F is the mechanicaldeformation gradient, and the Jacobian J¼ detF characterizes the volume change . It is noted that rMx and rFbC are thestresses carried by the matrix and the fiber crystalline phases, respectively.
3.3.2. Mechanics during crystallization
As shown in Fig. 7, crystallization and melting are continuous processes and functions of temperature and time. Ourbasic assumption is that when a small fraction of polymer crystals is formed from a melt, it is in a stress-free state. In orderto satisfy the boundary conditions, either overall or locally, this small fraction will deform immediately. This stress-freestate for new born crystalline phases was referred as a natural configuration by Rajagapol (Rajagopal and Srinivasa, 1998a,b), and was used by many researchers to study crystallizing polymers (Ma and Negahban, 1995a, b; Negahban, 1993;Negahban and Wineman, 1992), rubbers with thermally induced scissoring and reformation (Tobolsky, 1960; Wineman,1999, 2005; Wineman and Min, 2000, 2003; Wineman and Shaw, 2008), shape memory polymers (Barot and Rao, 2006;Barot et al., 2008; Qi et al., 2008), and light activated shape memory polymers (Long et al., 2009). In this section, we dealwith mechanics during crystallization. During a shape memory cycle, crystallization can occur during cooling (S2) andunloading at low temperatures (S3). As indicated below, the method in this section is also applied to the case where thereis no crystallization, such as the high temperature loading step (S1).
To better illustrate the physics and the mechanics, we use an incremental approach; schematics are attached in theSupplementary materials. Considering at time t¼t0, all fiber crystals are melted, and mechanical deformation gradient is F0.

Q. Ge et al. / J. Mech. Phys. Solids 60 (2012) 67–8376
Since only the matrix carries load at this moment, FMx¼F0, and
rtotal0 ¼ vMxrMxðF0Þ: ð17Þ
At time t¼t0, crystallization starts. At t¼t0þDt, a small amount of crystalline phase has formed from the fiber meltwith a volume fraction Dvc
1. As stated above, we assume that this newly formed crystalline phase is initially undeformedand stress-free. Simultaneously, a mechanical deformation may occur. One reason for this mechanical deformation couldbe due to mechanical loading change during crystallization. For example, in a shape memory cycle, the crystallizationprocess can easily extend into S3, the unloading step at the temperature below the crystallization temperature. Anotherreason could be attributed to the modulus change of the matrix due to its dependence on temperature (entropic elasticity).The deformation and load transfer from the matrix to polymer crystals is complicated (Ma and Negahban, 1995a, b;Negahban, 1993; Negahban and Wineman, 1992); for example, they may depend on the shape and spatial distribution ofthe crystals. Here, we simplify this deformation transfer by assuming both the matrix and fiber crystals undergo the samesmall incremental deformation gradient DF1. Then, the deformations in the matrix and the fiber crystal become
FMx¼DF1F0, F1-1 ¼DF1, ð18Þ
and the total stress is
rtotal1 ¼ vMxrMxðF1-1F0ÞþvFbCDvc
1rFbCðF1-1Þ: ð19Þ
Here, the subscript in F1-1 represents the deformation gradient at the time of the 1st time increment for the crystallinephase formed during the 1st time increment. As the crystallization proceeds, more small volume fractions of crystals form.Each of them has no deformation in its new-born state but deforms after its birth due to the reasons discussed above.Following the above discussion, at time t¼t0þmDt, the deformation gradient in the crystalline phase formed at timet¼t0þ iDt can be expressed as
Fi-m ¼DFmFi-m�1 ¼Ymj ¼ i
LDFj, ð20Þ
where Pni ¼ 1
LðÞi means the multiplicative operation goes toward left, or Pn
i ¼ 1LðÞi ¼ ðÞn � � � ð Þ2ðÞ1; DFj is the incremental
deformation gradient at t¼t0þ jDt when the j-th crystal forms; Fi-m represents the deformation gradient at timet¼t0þmDt for the crystals formed at time t¼t0þ iDt. Note that DFi has its reference configuration occupying the spatialconfiguration at time t¼t0þ(i�1)Dt, so does Fi-m. The deformation gradient in the matrix is
FMx¼
Ymj ¼ 1
LDFj
0@
1AF0 ¼ F1-mF0: ð21Þ
The total stress is
rtotalm ¼ vMxrMxðF1-mF0ÞþvFbC
Xm
i ¼ 1
Dvci r
FbCðFi-mÞ: ð22Þ
Note that Eq. (22) can also be applied to the case where there is no new crystalline phase is formed by simply settingDvc
i ¼ 0.
3.3.3. Mechanics during melting
During melting, the crystalline phases vanish gradually. According to the kinetic description of the melting process, theportion of crystalline domains that grow at a later time melts first (as they are closer to the melt–crystal boundary).Assuming at the time when melting starts (t¼tms), the total number of crystalline phases (which is equal to the totalnumber of time increments during crystallization) is me, at time t¼tmsþDt, Dvc
memelts.2 Here, for the sake of brevity, we
assume that within Dt, Dvcme
volume fraction of crystals melt. Concurrently with melting, a small incremental deformationgradient DFmelt
1 is induced. This deformation, for example, could be due to shape recovery in the heating step of a shapememory cycle. Following the same assumption for mechanical deformation during crystallization, we assume that theincremental deformation gradient DFmelt
1 is applied to all the phases, except of me-th crystalline phase, which just meltedand cannot carry load. Therefore, the total stress is
rtotal ¼ vMxrMxðDFmelt1 F1-msF0ÞþvFb
Xme�1
i ¼ 1
Dvci r
FbCðDFmelt1 Fi-msÞ, ð23Þ
2 Note in real simulations, in Dt time period, the amount of crystals that melt generally is not equal to Dvcme
. However, this can be treated by
conducting interpolation between two time increments. The treatment is arithmetical and therefore is not discussed here.

Q. Ge et al. / J. Mech. Phys. Solids 60 (2012) 67–83 77
Following the same argument, at time t¼tmsþnDt, the crystal with volume fraction Dvcme�nþ1 melts and the
deformation gradient is increased by DFmeltn . The total stress is
rtotal ¼ vMxrMxðFmelt1-nF1-msF0ÞþvFb
Xme�n
i ¼ 1
Dvci r
FbCðFmelt1-nFi-msÞ, Fmelt
1-n ¼Yn
i ¼ 1
LDFmelti : ð24Þ
Depending on the boundary conditions, Eq. (24) can be solved for DFmeltn if a constant stress is applied (load control), or
for rtotal if DFmeltn is prescribed (displacement control).
3.3.4. Effective phase model (EPM)
The mechanics discussed above is computationally expensive as it requires the deformation gradient in each fraction ofcrystals to be updated during each time increment and is stored as internal variables. This can quickly exhaust computerCPU time and memory resources. In order to enhance computational efficiency, Long et al. (2010) developed an effectivephase model (EPM) to capture the mechanics of a material with evolving phases (Long et al., 2010). In the EPM, thebehavior of the new phases formed at different times are combined into an effective phase with an effective deformation.The effective phase and its effective deformation are continuously updated to account for the response of each new phasethat would normally develop under the general loading conditions (Long et al., 2010). In this paper, the EPM theory is usedto improve the computational efficiency.
During crystallization at time t¼t0þmDt, there are m crystalline phases during crystallization beginning at t¼t0. In theEPM, it is assumed that the mechanical deformation in these m crystalline phases can be represented by an effective phasewith a combined volume fraction of vc
m ¼Pm
i ¼ 1 Dvci and an effective deformation gradient Fm. The total stress in the SMEC
is therefore:
rtotalm ¼ vMxrMxðFmÞþvFbvc
mrFbCðFmÞ: ð25Þ
At time t¼t0þ(mþ1)Dt, a new crystalline phase with volume fraction Dvcmþ1 is formed. Accompanying this new
crystalline phase, the composite undergoes a further deformation with DFmþ1 and the total stress is now calculated as
rtotalmþ1 ¼ vMxrMxðDFmþ1FmÞþvFb½v
cmrFbCðDFmþ1FmÞþDvc
mþ1rFbCðDFmþ1Þ�: ð26Þ
Applying Eq. (25) to the time t¼t0þ(mþ1)Dt, we have
rtotalmþ1 ¼ vMxrMxðFmþ1ÞþvFbvc
mþ1rFbCðFmþ1Þ, ð27Þ
where Fmþ1¼DFmþ1Fm and Fmþ1 ¼DFmþ1Fm. Comparing Eqs. (26) and (27), we have
vcmþ1r
FbCðDFmþ1FmÞ ¼ vcmrFbCðDFmþ1FmÞþDvc
mþ1rFbCðDFmþ1Þ, ð28Þ
For a given DFmþ1 and with a calculation of Jacobian, Eq. (28) can be solved using a Newton–Raphson scheme for thedeformation increment in the effective phase DFmþ1. The same process can be applied to melting. In order to help readersbetter understand the EPM theory, schematics are presented in Supplementary material.
3.4. Thermal deformation
Thermal deformation of the SMEC arises from contributions from the matrix and fiber network. The latter includesthermal contraction/expansion of the crystalline phase as well as a volume change that accompanies the melt–crystalphase transformation. Here, we assume that the thermal contraction/expansion is always isotropic, therefore:
GT¼ JT I¼ ðlT
Þ3I, ð29Þ
where lT is the linear stretch ratio due to thermal contraction/expansion.Based on the thermal contraction/expansion experiment in Section 2.4, there are three regions of the thermal
deformation: (i) the high temperature linear regime characterized by a linear coefficient of thermal expansion (a1), wherethe fibers are completely melted; (ii) the nonlinear strain drop or rise (DlPT) region corresponding to the melt–crystaltransition of the fibers; (iii) the low temperature linear deformation (a2) regime where the fibers are crystallized.
At high temperatures, where the fibers melt completely and the SMEC contracts or expands linearly with a1, thethermal stretch is:
lT¼ 1þa1ðT�THÞ, ð30Þ
where TH is the temperature where the experiment starts.During the melt–crystal phase transition, where vc increases from 0 to the saturated crystallinity HN, the thermal
deformation can be expressed by combining the linear and nonlinear thermal behavior:
lT¼ 1þa1ðT
0m�THÞþDlPT ðv
cðTÞ=H1Þ, ð31Þ
where T0m is the equilibrium melting temperature in Eq. (13) where crystallization or melting starts, and HN is the
saturated crystallinity in Eq. (15).

Fig. 8. Comparison of experiment and simulation of thermal deformation during a cooling–heating cycle.
Q. Ge et al. / J. Mech. Phys. Solids 60 (2012) 67–8378
At low temperatures, where the fibers crystallize completely and vc¼HN, the SMEC contracts or expands linearly with
a2 and the thermal stretch is:
lT¼ 1þa1ðT
0m�THÞþa2ðT�TrÞþDlPT ð32Þ
where Tr is a reference temperature corresponding to the time increment where the crystallinity reaches HN.Fig. 8 shows the comparison between experimental data and simulation. Overall, the model captures the thermal
deformation reasonably well. The largest error occurs during heating from 10 to 50 1C: The model predicts a linearexpansion whilst the experiment shows a slightly nonlinear behavior.
4. Results
4.1. Mechanical behaviors under uniaxial loading with a neo-Hookean solid
To begin we briefly describe results of our above model with simple material behaviors and uniaxial loading conditions.For the Sylgard matrix, the maximum stretch of the sample was 1.15 and the stress-strain behavior did not exhibit non-
Gaussian behavior. For the PCL semicrystalline polymer, as will be shown later, the strain was low. For the sake of brevity,we assume that both Sylgard and the PCL semicrystalline polymer can be described by an incompressible neo-Hookeanmodel with the strain energy functions (Treloar, 1958):
WMx¼
1
2NkTðl2
1þl22þl
23�3Þ, WFbC
¼1
2mðl2
1þl22þl
23�3Þ, ð33Þ
where li are the applied stretches in the three principal directions, N is the chain density, k is Boltzmann’s constant, T istemperature, m is the shear modulus of the semicrystalline PCL. When subject to uniaxial loading, the Cauchy stress of eachphase is
sMx ¼ l@WMxðlÞ
@l¼NkT, sFbC ¼ l
@WFbCðlÞ@l
¼ mðl2�1=lÞ: ð34Þ
Here, we enforce material incompressibility, l is the mechanical stretch in the uniaxial stretching direction and it isdefined as l¼1þe, and e is the strain. Note that for the Sylgard matrix, the stress is also a function of temperature T.In addition, the total stretch of the material should include the thermal contraction/expansion, i.e, ltotal
¼ lTl.The mechanical stretch l during a shape memory cycle can be simulated using either the general model or the EPM
theory which improves the computational efficiency. Details are listed in the Supplementary material.
4.2. Comparison between model simulations and experiments
4.2.1. Free recovery
The thermomechanical model we have developed is complex and requires a number of input parameters that must bedetermined. Specifically, it requires 18 parameters; they are summarized in Table 2 along with their values and sources. Ofthe 18, 12 are determined by independent experiments and reasonable literature values and the other 6 are determined byfitting the experimental curve of a single shape memory cycle at an imposed stress of 0.15MP and a heating/cooling rate of

Table 2Material parameters used in simulations.
Parameter Value Description (fitting parameters are described in italics)
CompositionvMx 0.87 Matrix (Sylgard) volume fraction of (determined by fabrication)
vFb 0.13 Fiber (PCL) volume fraction (determined by fabrication)
Kinetics of crystallization and meltingG0 4.6�105 m s�1 Pre-exponential factor of growth rate (Liu et al., 2010)
U 17.3 kJ mol�1 Diffusional activation energy (Liu et al., 2010)
T0m
310 K The equilibrium melting temperature (Kweon et al., 2003)
TN 193 K The temperature 30 K lower than Tg (Tg¼223 K obtained from DMA)
Kg 35080 K2 Nucleation constant (Liu et al., 2010)
N0 2.4�104 m�3 Pre-exponential factor of nucleation density (fitting parameter)
b 0.1349 K�1 Empirical parameter (Angelloz et al., 2000)
C 8.3�105 m s�1 The melting contraction rate (fitting parameter)
HN 0.25 The saturated crystallinity (Kweon et al., 2003)
Mechanical behaviorsgMx 0.51 Stress concentration factor of matrix (Sylgard) (fitting parameter)
gFb 4.31 Stress concentration factor of fiber (PCL) (fitting parameter)
N 2.16�1026 m�3 Polymer crosslinking density (from DMA for neat Sylgard)
m 20.69 MPa PCL crystal phase modulus (fitting parameter)
Thermal contraction/expansiona1 2.66�10�4
1C�1 CTE at high temperature (measured)
a2 8.27�10�51C�1 CTE at low temperature (measured)
DlPT �1.16�10�2 Thermal strain due to phase transition (fitting parameter)
Fig. 9. Simulations used to fit model parameters and experimental results for a shape memory cycle with an imposed stress 0.15 MPa: (a) stress–
temperature–strain plot; (b) strain–temperature plot.
Q. Ge et al. / J. Mech. Phys. Solids 60 (2012) 67–83 79
21C/min (details about how to identify these parameters are presented in Supplementary material). Fig. 9 shows theresults of the parameter fitting; the excellent agreement between model simulation and experiment validates the ability ofthe model to adequately capture the physical phenomena underlying the shape memory behavior.
The material parameters in Table 2 (identified by fitting the 0.15 MPa data) were then used to predict the shapememory behaviors with 0.1 and 0.2 MPa stresses. Fig. 10 shows good agreement between the model prediction and theexperiment.
4.2.2. Constrained recovery
The numerical simulation of a constrained recovery experiment is shown in Fig. 11 along with experimental results. Themodel predicts the constrained recovery of the material well, including the existence of two strain peaks at differenttemperatures that arise from the hysteresis of crystallization and melting.

Fig. 10. Comparisons between model predictions (solid-dot line) and experimental results (solid line) for applied stresses of 0.1 MPa (red) and 0.2 MPa
(black): (a) stress–temperature–strain plot; (b) strain–temperature plot. (For interpretation of the references to color in this figure legend, the reader is
referred to the web version of this article.)
Fig. 11. Model predictions and experiments for a constrained recovery shape memory cycle with an imposed stress of 0.15 MPa. (a) stress–temperature–
strain plot; (b) strain–temperature plot.
Q. Ge et al. / J. Mech. Phys. Solids 60 (2012) 67–8380
4.3. Parametric studies
4.3.1. Effect of thermal rates
The constitutive model with parameters in Table 2 is used to investigate the effect of thermal rates on the shapememory performance in Fig. 12. The model predictions are in good agreement with companion experiments. To developinsight into the role of crystallization/melting kinetics on the shape memory behavior, in Fig. 13, we plot the computedcrystallinity as a function of temperature for various thermal rates. The crystallinity clearly plays a key role in determiningthe fixity upon unloading. For the slow cooling, such as 1 and 2 1C/min, crystallization occurs at a faster rate than thecooling rate and the fiber network reaches the saturation crystallinity at or before the low temperature is reached, andtherefore the best fixity is achieved. For the faster cooling rates, crystallization occurs at a slower rate than the cooling rate.Thus upon unloading at the low temperature, the crystallinity has only reached 5% and 2%, respectively, leading to a poorfixity: the 5 1C/min case held about 60% of the temporary shape and the 10 1C/min case fixed only about 40%. Interestingly,for the 5 and 10 1C/min cases, the crystallinity keeps increasing during heating, since the temperature is still below thecrystallization temperature.
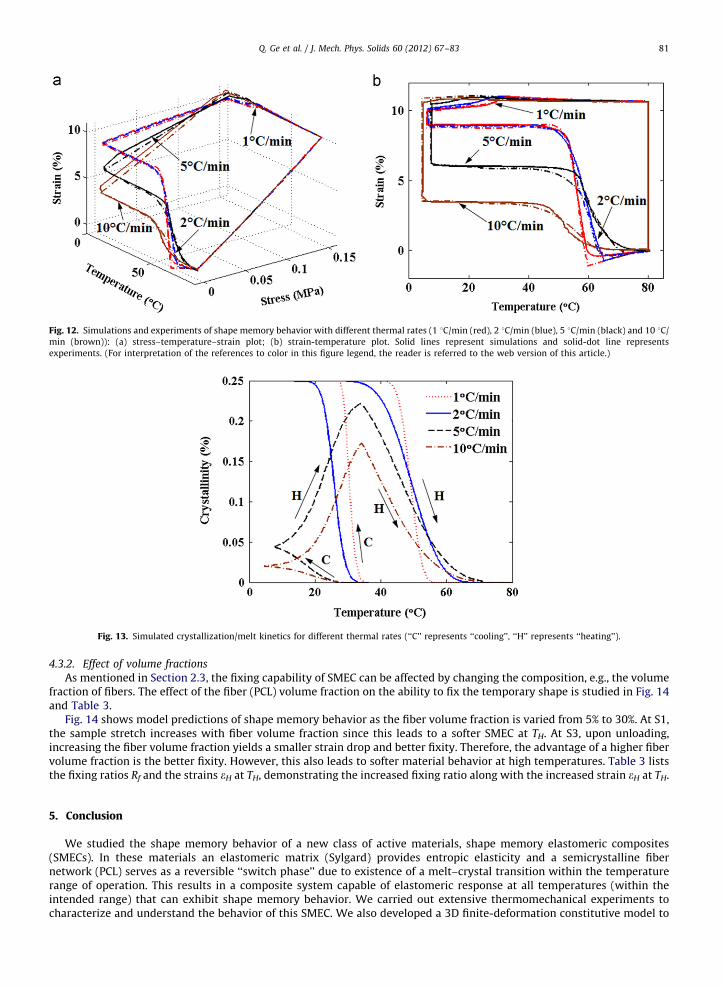
Fig. 12. Simulations and experiments of shape memory behavior with different thermal rates (1 1C/min (red), 2 1C/min (blue), 5 1C/min (black) and 10 1C/
min (brown)): (a) stress–temperature–strain plot; (b) strain-temperature plot. Solid lines represent simulations and solid-dot line represents
experiments. (For interpretation of the references to color in this figure legend, the reader is referred to the web version of this article.)
Fig. 13. Simulated crystallization/melt kinetics for different thermal rates (‘‘C’’ represents ‘‘cooling’’, ‘‘H’’ represents ‘‘heating’’).
Q. Ge et al. / J. Mech. Phys. Solids 60 (2012) 67–83 81
4.3.2. Effect of volume fractions
As mentioned in Section 2.3, the fixing capability of SMEC can be affected by changing the composition, e.g., the volumefraction of fibers. The effect of the fiber (PCL) volume fraction on the ability to fix the temporary shape is studied in Fig. 14and Table 3.
Fig. 14 shows model predictions of shape memory behavior as the fiber volume fraction is varied from 5% to 30%. At S1,the sample stretch increases with fiber volume fraction since this leads to a softer SMEC at TH. At S3, upon unloading,increasing the fiber volume fraction yields a smaller strain drop and better fixity. Therefore, the advantage of a higher fibervolume fraction is the better fixity. However, this also leads to softer material behavior at high temperatures. Table 3 liststhe fixing ratios Rf and the strains eH at TH, demonstrating the increased fixing ratio along with the increased strain eH at TH.
5. Conclusion
We studied the shape memory behavior of a new class of active materials, shape memory elastomeric composites(SMECs). In these materials an elastomeric matrix (Sylgard) provides entropic elasticity and a semicrystalline fibernetwork (PCL) serves as a reversible ‘‘switch phase’’ due to existence of a melt–crystal transition within the temperaturerange of operation. This results in a composite system capable of elastomeric response at all temperatures (within theintended range) that can exhibit shape memory behavior. We carried out extensive thermomechanical experiments tocharacterize and understand the behavior of this SMEC. We also developed a 3D finite-deformation constitutive model to

Fig. 14. Simulated shape memory cycles with various fiber (PCL) volume fractions at an imposed stress of 0.15 MPa and a cooling/heating rate
of 2 1C/min.
Table 3Rf and eH as a function of fiber volume fraction.
vFb 5% 13% 20% 30%
Rf 70.4% 88.4% 93.9% 95.4%
eH 9.73% 10.72% 11.71% 13.23%
Q. Ge et al. / J. Mech. Phys. Solids 60 (2012) 67–8382
describe the complex thermomechanical shape memory behavior. Our constitutive model includes a description of thecrystal/melt phase transformation using the Evans theory and Hoffman–Lauritze expression for crystallization. Thekinematics of the evolving phases during transformation is tracked based on the assumption that newly formed crystallinephases are undeformed and stress-free. In order to improve the computational efficiency, an effective phase model isadopted to capture the mechanics of material with evolving phases. The model accurately captures the complex shapememory behavior in both free and constrained recovery and provides insight into the role of crystallization kinetics onbehavior. We also used the model to explore the effect of fiber volume fraction on shape fixity and showed how the fibervolume fraction impacts the strain at high temperature as well as the shape fixity. While our approach was to incorporatesimple descriptions of various phenomena with the goal of reasonably describing the macroscopic thermomechanicalresponse, our framework readily admits the incorporation of more sophisticated models of various phenomena such ascrystallization and melting.
Acknowledgment
The authors gratefully acknowledge the support from an AFOSR Grant (FA9550-09-1-0195) to PTM, HJQ, and MLD;a NSF career award to HJQ (CMMI-0645219); and a NSF grant to PTM (DMR-0758631).
Appendix A. Supporting materials
Supplementary data associated with this article can be found in the online version at doi:10.1016/j.jmps.2011.09.011.
References
Angelloz, C., Fulchiron, R., Douillard, A., Chabert, B., Fillit, R., Vautrin, A., David, L., 2000. Crystallization of isotactic polypropylene under high pressure(gamma phase). Macromolecules 33 (11), 4138–4145.
Avrami, M., 1939. Kinetics of phase change I—general theory. J. Chem. Phys. 7 (12), 1103–1112.Avrami, M., 1940. Kinetics of phase change II—transformation-time relations for random distribution of nuclei. J. Chem. Phys. 8, 212–224.Avrami, M., 1941. Granulation, phase change, and microstructure—kinetics of phase change. III. J. Chem. Phys. 9 (2), 177–184.Barot, G., Rao, I.J., 2006. Constitutive modeling of the mechanics associated with crystallizable shape memory polymers. Z. Angew. Math. Phys. 57 (4),
652–681.

Q. Ge et al. / J. Mech. Phys. Solids 60 (2012) 67–83 83
Barot, G., Rao, I.J., Rajagopal, K.R., 2008. A thermodynamic framework for the modeling of crystallizable shape memory polymers. Int. J. Eng. Sci. 46 (4),325–351.
Benveniste, Y., 1987. A new approach to the application of Mori-Tanaka theory in composite-materials. Mech. Mater. 6 (2), 147–157.Castaneda, P.P., 1991. The effective mechanical-properties of nonlinear isotropic composites. J. Mech. Phys. Solids 39 (1), 45–71.Dunn, M.L., 1998. One-dimensioal composite micromechanics. Int. J. Mech. Eng. Edu. 26, 38–50.Evans, U.R., 1945. The laws of expanding circles and spheres in relation to the lateral growth of surface films and the grain-size of metals. Trans. Faraday
Soc. 41 (7), 365–374.Isayev, A.I., Catignani, B.F., 1997. Crystallization and microstructure in quenched slabs of various molecular weight polypropylenes. Polym. Eng. Sci. 37
(9), 1526–1539.Kweon, H., Yoo, M.K., Park, I.K., Kim, T.H., Lee, H.C., Lee, H.S., Oh, J.S., Akaike, T., Cho, C.S., 2003. A novel degradable polycaprolactone networks for tissue
engineering. Biomaterials 24 (5), 801–808.Lauritzen, J.I., Hoffman, J.D., 1973. Extension of theory of growth of chain-folded polymer crystals to large undercoolings. J. Appl. Phys. 44 (10),
4340–4352.Lendlein, A., Kelch, S., 2002. Shape-memory polymers. Ang. Chem. Int. Ed. in English 41 (12), 2035–2057.Lendlein, A., Kelch, S., 2005. Shape-memory polymers as stimuli-sensitive implant materials. Clin. Hemorheol. Microcirc. 32 (2), 105–116.Liu, H.X., Huang, Y.Y., Yuan, L., He, P.S., Cai, Z.H., Shen, Y.L., Xu, Y.M., Yu, Y., Xiong, H.G., 2010. Isothermal crystallization kinetics of modified bamboo
cellulose/PCL composites. Carbohydr. Polym. 79 (3), 513–519.Long, K.N., Dunn, M.L., Qi, H.J., 2010. Mechanics of soft active materials with phase evolution. Int. J. Plasticity 26 (4), 603–616.Long, K.N., Scott, T.F., Qi, H.J., Bowman, C.N., Dunn, M.L., 2009. Photomechanics of light-activated polymers. J. Mech. Phys. Solids 57 (7), 1103–1121.Luo, X.F., Mather, P.T., 2009. Preparation and characterization of shape memory elastomeric composites. Macromolecules 42 (19), 7251–7253.Ma, R., Negahban, M., 1995a. Simulation of mechanical response in crystallizing polymers—crystallization under a constant shear force. Acta Mech. 112
(1–4), 59–76.Ma, R.J., Negahban, M., 1995b. Simulation of mechanical response during polymer crystallization around rigid inclusions and voids—homogeneous
crystallization. Mech. Mater. 21 (1), 25–50.Negahban, M., 1993. Simulation of mechanical response in crystallizing polymers—crystallization under constant shearing deformations. Mech. Mater.
16 (4), 379–399.Negahban, M., Wineman, A.S., 1992. Modeling the mechanical response of a material undergoing continuous isothermal crystallization. Int. J. Eng. Sci. 30
(7), 953–962.Nguyen, T.D., Qi, H.J., Castro, F., Long, K.N., 2008. A thermoviscoelastic model for amorphous shape memory polymers: incorporating structural and stress
relaxation. J. Mech. Phys. Solids 56 (9), 2792–2814.Ozawa, T., 1971. Kinetics of non-isothermal crystallization. Polymer 12 (3), 150–158.Qi, H.J., Nguyen, T.D., Castro, F., Yakacki, C.M., Shandas, R., 2008. Finite deformation thermo-mechanical behavior of thermally induced shape memory
polymers. J. Mech. Phys. Solids 56 (5), 1730–1751.Rajagopal, K.R., Srinivasa, A.R., 1998a. Mechanics of the inelastic behavior of materials—Part 1, theoretical underpinnings. Int. J. Plasticity 14 (10–11),
945–967.Rajagopal, K.R., Srinivasa, A.R., 1998b. Mechanics of the inelastic behavior of materials. Part II: Inelastic response. Int. J. Plasticity 14 (10–11), 969–995.Rousseau, I.A., 2008. Challenges of shape memory polymers: a review of the progress toward overcoming SMP’S limitations. Polym. Eng. Sci. 48 (11),
2075–2089.Rousseau, I.A., Mather, P.T., 2003. Shape memory effect exhibited by smectic-C liquid crystalline elastomers. J. Am. Chem. Soc. 125 (50), 15300–15301.Sperling, L.H., 2006. Introduction to Physical Polymer Science. Wiley, Hoboken, NJ.Tobolsky, A.V., 1960. Properties and Structures of Polymers. Wiley, New York.Treloar, L.R.G., 1958. The Physics of Rubber Elasticity. Clarendon Press, Oxford.Weiss, R.A., Izzo, E., Mandelbaum, S., 2008. New design of shape memory polymers: mixtures of an elastomeric ionomer and low molar mass fatty acids
and their salts. Macromolecules 41 (9), 2978–2980.Westbrook, K.K., Castro, F., Long, K.N., Slifka, A.J., Qi, H.J., 2010. Improved testing system for thermomechanical experiments on polymers using uniaxial
compression equipment. Poly. Test. 29 (4), 503–512.Wineman, A., 1999. Changes due to scission in an elastomeric cylinder undergoing circular shear and heat conduction. Am. Soc. Mech. Eng., Applied
Mechanics Division, AMD 236, 15.Wineman, A., 2005. Some comments on the mechanical response of elastomers undergoing scission and healing at elevated temperatures. Math. Mech.
Solids 10 (6), 673–689.Wineman, A., Min, J.H., 2000. Scission and cross-linking in an elastomeric cylinder undergoing circular shear and heat conduction. American Society of
Mechanical Engineers. Applied Mechanics Division, AMD 244, 117.Wineman, A., Min, J.H., 2003. Time dependent scission and cross-linking in an elastomeric cylinder undergoing circular shear and heat conduction.
Int. J. Non-Linear Mech. 38 (7), 969–983.Wineman, A., Shaw, J., 2008. Influence of thermally induced scission and crosslinking on the post-scission inflation of circular elastomeric membranes.
Int. J. Eng. Sci. 46 (8), 758–774.