thermal effects on esr signal evolution in nano and bulk cuo powder
TRANSCRIPT
Journal of Non-Crystalline Solids 325 (2003) 16–21
www.elsevier.com/locate/jnoncrysol
Thermal effects on ESR signal evolutionin nano and bulk CuO powder
A. Viano a,*, S.R. Mishra b, R. Lloyd c, J. Losby b, T. Gheyi c
a Department of Physics, Rhodes College, 2000 North Parkway, Memphis, TN 38112, USAb Department of Physics, The University of Memphis, Memphis, TN 38152, USA
c Department of Chemistry, The University of Memphis, Memphis, TN 38152, USA
Received 29 July 2002; received in revised form 26 May 2003
Abstract
In order to understand the effects of low dimension on the magnetic properties of CuO, a systematic electron spin
resonance study is carried out on CuO nano and bulk powders. Sol–gel produced CuO nanopowder was calcined at
temperatures from 200 to 1000 �C to produce nanoparticles of varying size. A broad electron spin resonance (ESR)
signal was obtained for the CuO nanoparticles, representative of antiferromagnetic ordering. This ordering persists even
at higher calcination temperatures. On the contrary, CuO bulk powder shows two separate ESR signals which merge
into one at higher temperatures. These data indicate that the antiferromagnetic ordering is preserved up to 800 �C in
CuO nanomaterial. In bulk CuO powder, the ESR signal breaks from antiferromagnetic ordering at lower tempera-
tures. This is a result of the high latent heat of bulk material, which leads to early decomposition of the powder. With
evidence from detailed thermal analysis, the observed differences in the ESR data for bulk and nano CuO as a function
of calcination temperature are explained on the basis of particle size difference.
� 2003 Elsevier B.V. All rights reserved.
PACS: 75.10; 75.50K; 61.46
1. Introduction
The magnetic properties of nanoparticles are of
great current interest, mainly because of their un-
ique properties and their diverse industrial appli-cations [1]. Most studies are concentrated on
understanding the magnetic properties of oxide
* Corresponding author. Tel.: +1-901 843 3912; fax: +1-901
843 3117.
E-mail address: [email protected] (A. Viano).
0022-3093/$ - see front matter � 2003 Elsevier B.V. All rights reserv
doi:10.1016/S0022-3093(03)00317-X
nanoparticles such as ferritines; c-Fe2O3, NiO, etc.
CuO occupies a special place among the semi-
conductor 3d oxides because it has some unique
physical properties. Unlike NiO, CoO, FeO and
MnO, CuO has a low symmetry monoclinic crystalstructure and a magnetic susceptibility tempera-
ture behavior that is unusual for 3d antiferro-
magnets. In polycrystalline CuO the susceptibility
increases, rather than decreases, above the N�eeeltemperature, TN. Also, CuO has been investigated
extensively in relation to the high Tc oxide super-
conductors [2]. CuO has recently been studied in
ed.
A. Viano et al. / Journal of Non-Crystalline Solids 325 (2003) 16–21 17
nanostructured form, which is known to haveapplications in catalysis and optics [3]. Over and
above, the study of CuO by itself is essential since
many of its magnetic properties are governed by
the oxygen stoichiometry. The diverse results ob-
tained by different authors when measuring its
magnetic properties have been attributed to the
existence of intrinsic defects like cation or anion
vacancies [4,5], particle size effects [6], and un-compensated charge [7].
In the present investigation, an electron spin
resonance (ESR) technique is used to probe the
calcination temperature effect on magnetic order-
ing in nano and bulk CuO powder. The magnetic
measurement is coupled with thermal analysis to
understand the origin of ESR signals that may
arise from any phase transformation. Thermalanalysis also allows a check of the phase purity
and aids in an understanding of the relationship
between magnetic ordering and the oxide phases of
CuO. The importance of the present study lies in
the fact that sol–gel synthesis has evolved as a
standard technique for oxide nanoparticle fabri-
cation. In this process, particle size is often con-
trolled by varying the calcination temperature.Although calcination can increase the particle size,
its effects on other physical properties, such as
magnetic, electrical and thermal, need to be in-
vestigated. The influence of the calcination tem-
perature on these properties depends on the heat
distribution within the particle. Nanoparticles can
easily dissipate heat because of their high surface
area and low latent heat, while bulk particles haveunequal heat distribution and high latent heat.
Thus, the heat distribution during the fabrication
stage of nanoparticulate material can influence its
physical properties. This study investigates this
influence on the magnetic properties.
2. Experimental
CuO nanoparticles were synthesized using the
sol–gel technique described by Punnoose et al. [8].
This involved reacting aqueous solutions of copper
nitrate and sodium hydroxide at pH¼ 10 and at
room temperature. The resulting gel was washed
several times with distilled water until free of
nitrate ions. This gel was carefully filtered anddried in air at 70 �C. The bulk CuO powder was at
)22 mesh. Both CuO nano and bulk powder were
calcined in air at temperatures ranging from 200 to
1000 �C for approximately 10–12 h. The annealed
samples were cooled slowly to room temperature.
X-ray diffraction (XRD) patterns were obtained
with a diffractometer using CuKa radiation. The
Scherrer formula [9] was applied to determine theparticle size, taking instrumental broadening into
account. ESR data were obtained on a spectro-
meter interfaced to a PC for data acquisition and
analysis. The ESR was operated with a center field
of 2500 G, a modulation amplitude of 4.00, a time
constant of 0.25 s, a scan time equal to 4 min, and
a microwave power of 20 mW. Thermal analysis
was performed using a differential thermal ana-lyzer (DTA) with Pt/PtRd thermocouples and
alumina sample and reference cups. Al2O3 powder
was used as the reference material and scans were
carried out with a constant heating/cooling rate
of 10 �C/min. Transmission electron microscopy
(TEM) images were obtained at 80 kV.
3. Results
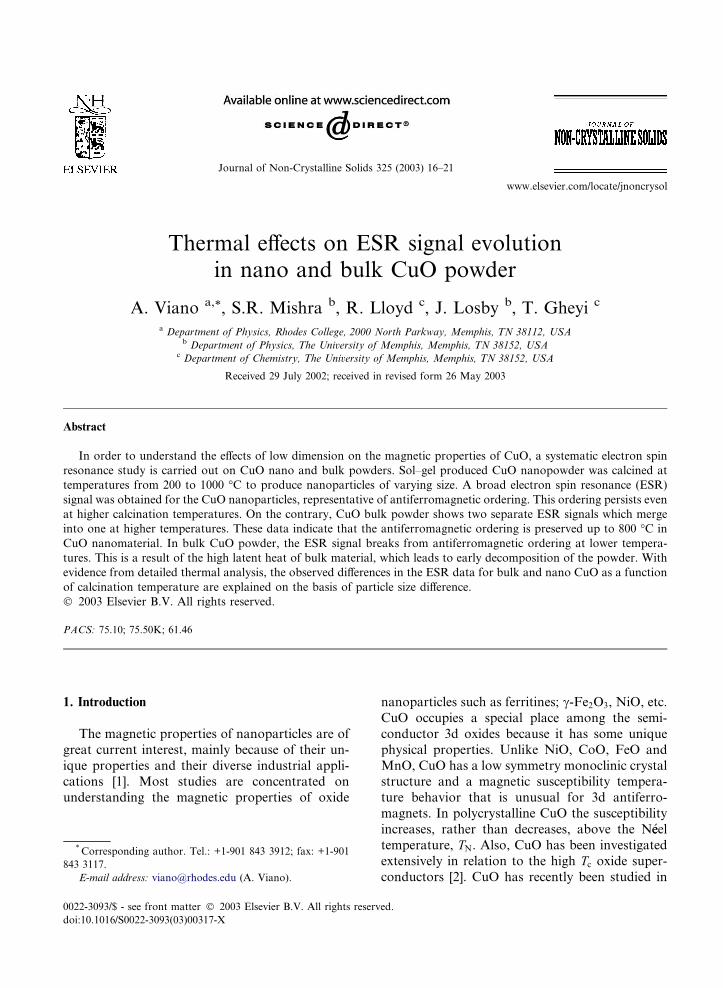
The results of structural analysis are shown in
Fig. 1. Fig. 1(a) shows a typical TEM micrograph
of CuO nanomaterial calcined at 200 �C. An ag-
glomeration of nanoscale particles is clearly visible,
showing a uniform distribution of particle sizes and
a homogeneous morphology. A typical XRD pat-tern for a wide range of 2h values for unannealed
CuO nanomaterial is shown in Fig. 1(b). Fig. 1(c)
shows the XRD patterns for the calcined samples
(for greater clarity, only the pertinent range in 2h isplotted). The particle sizes, as determined using the
Scherrer formula, are also listed next to their rep-
resentative spectra in Fig. 1(c).
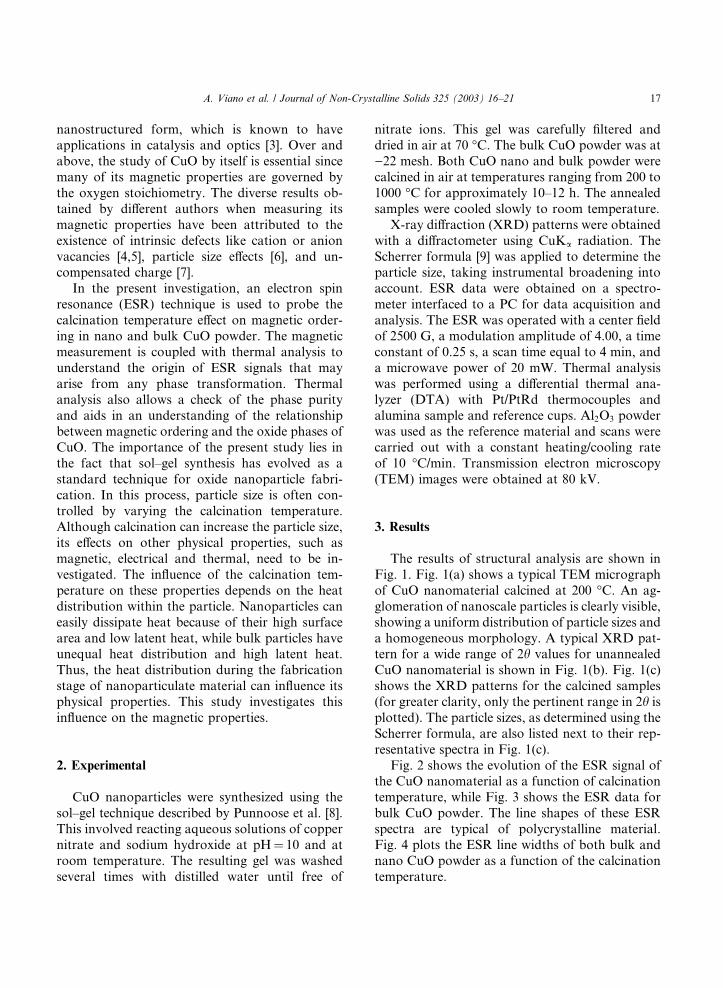
Fig. 2 shows the evolution of the ESR signal ofthe CuO nanomaterial as a function of calcination
temperature, while Fig. 3 shows the ESR data for
bulk CuO powder. The line shapes of these ESR
spectra are typical of polycrystalline material.
Fig. 4 plots the ESR line widths of both bulk and
nano CuO powder as a function of the calcination
temperature.
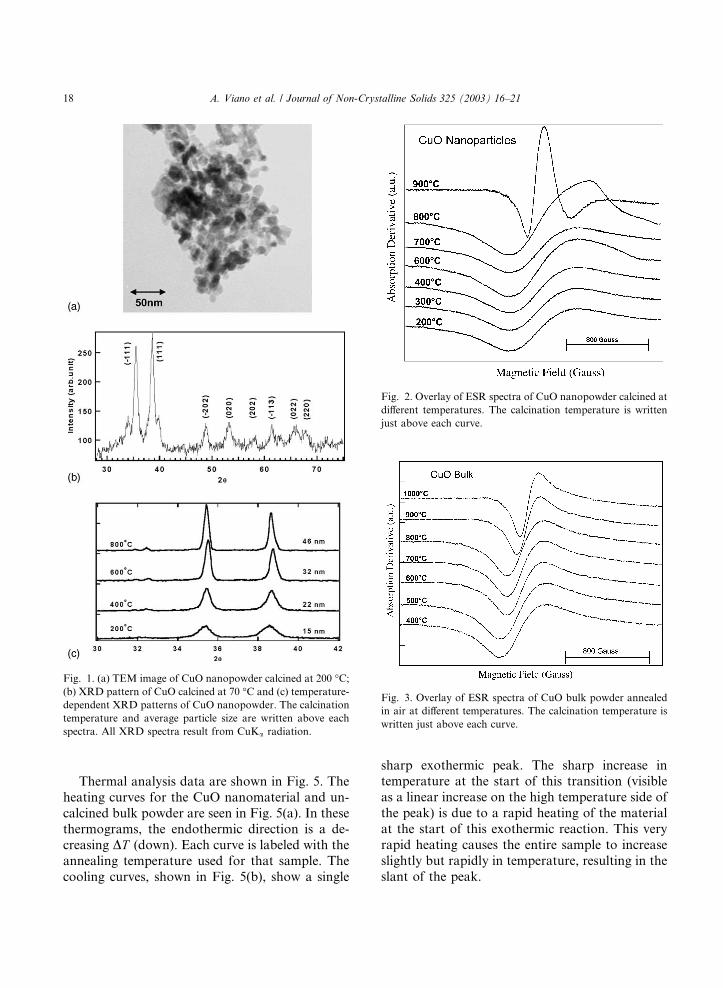
Fig. 2. Overlay of ESR spectra of CuO nanopowder calcined at
different temperatures. The calcination temperature is written
just above each curve.
Fig. 1. (a) TEM image of CuO nanopowder calcined at 200 �C;(b) XRD pattern of CuO calcined at 70 �C and (c) temperature-
dependent XRD patterns of CuO nanopowder. The calcination
temperature and average particle size are written above each
spectra. All XRD spectra result from CuKa radiation.
Fig. 3. Overlay of ESR spectra of CuO bulk powder annealed
in air at different temperatures. The calcination temperature is
written just above each curve.
18 A. Viano et al. / Journal of Non-Crystalline Solids 325 (2003) 16–21
Thermal analysis data are shown in Fig. 5. The
heating curves for the CuO nanomaterial and un-
calcined bulk powder are seen in Fig. 5(a). In thesethermograms, the endothermic direction is a de-
creasing DT (down). Each curve is labeled with the
annealing temperature used for that sample. The
cooling curves, shown in Fig. 5(b), show a single
sharp exothermic peak. The sharp increase intemperature at the start of this transition (visible
as a linear increase on the high temperature side of
the peak) is due to a rapid heating of the material
at the start of this exothermic reaction. This very
rapid heating causes the entire sample to increase
slightly but rapidly in temperature, resulting in the
slant of the peak.
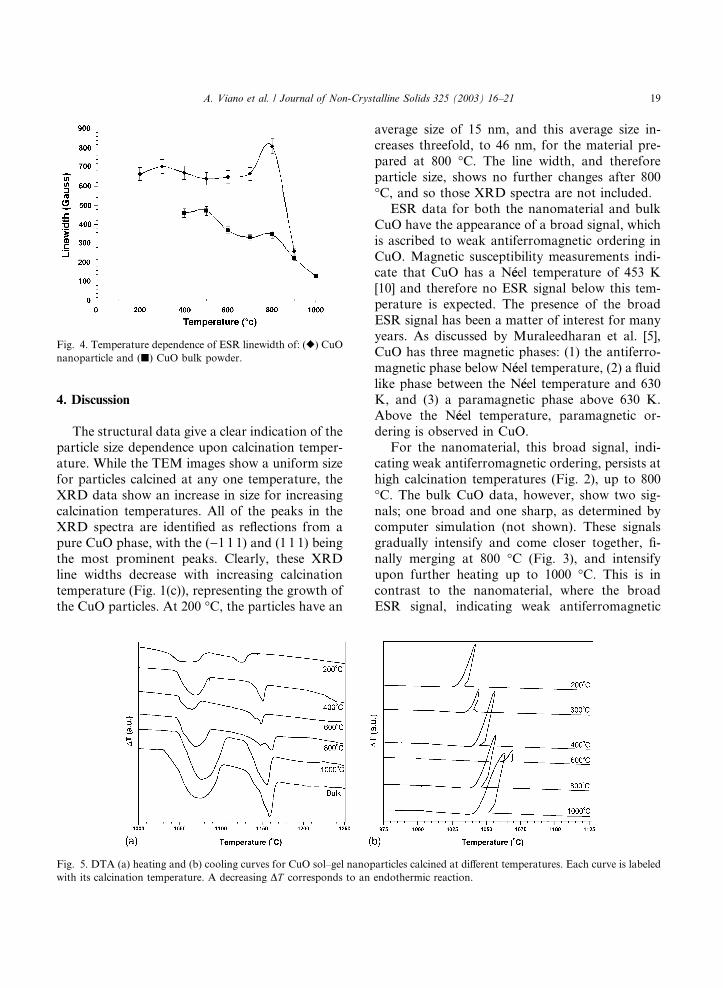
Fig. 4. Temperature dependence of ESR linewidth of: (r) CuO
nanoparticle and (j) CuO bulk powder.
A. Viano et al. / Journal of Non-Crystalline Solids 325 (2003) 16–21 19
4. Discussion
The structural data give a clear indication of the
particle size dependence upon calcination temper-
ature. While the TEM images show a uniform size
for particles calcined at any one temperature, the
XRD data show an increase in size for increasing
calcination temperatures. All of the peaks in the
XRD spectra are identified as reflections from a
pure CuO phase, with the ()1 1 1) and (1 1 1) beingthe most prominent peaks. Clearly, these XRD
line widths decrease with increasing calcination
temperature (Fig. 1(c)), representing the growth of
the CuO particles. At 200 �C, the particles have an
Fig. 5. DTA (a) heating and (b) cooling curves for CuO sol–gel nanop
with its calcination temperature. A decreasing DT corresponds to an
average size of 15 nm, and this average size in-creases threefold, to 46 nm, for the material pre-
pared at 800 �C. The line width, and therefore
particle size, shows no further changes after 800
�C, and so those XRD spectra are not included.
ESR data for both the nanomaterial and bulk
CuO have the appearance of a broad signal, which
is ascribed to weak antiferromagnetic ordering in
CuO. Magnetic susceptibility measurements indi-cate that CuO has a N�eeel temperature of 453 K
[10] and therefore no ESR signal below this tem-
perature is expected. The presence of the broad
ESR signal has been a matter of interest for many
years. As discussed by Muraleedharan et al. [5],
CuO has three magnetic phases: (1) the antiferro-
magnetic phase below N�eeel temperature, (2) a fluid
like phase between the N�eeel temperature and 630K, and (3) a paramagnetic phase above 630 K.
Above the N�eeel temperature, paramagnetic or-
dering is observed in CuO.
For the nanomaterial, this broad signal, indi-
cating weak antiferromagnetic ordering, persists at
high calcination temperatures (Fig. 2), up to 800
�C. The bulk CuO data, however, show two sig-
nals; one broad and one sharp, as determined bycomputer simulation (not shown). These signals
gradually intensify and come closer together, fi-
nally merging at 800 �C (Fig. 3), and intensify
upon further heating up to 1000 �C. This is in
contrast to the nanomaterial, where the broad
ESR signal, indicating weak antiferromagnetic
articles calcined at different temperatures. Each curve is labeled
endothermic reaction.
20 A. Viano et al. / Journal of Non-Crystalline Solids 325 (2003) 16–21
ordering, is preserved up to 800 �C. Thus, theweak antiferromagnetic ordering persists to a
higher temperature for the nanomaterial than for
the bulk CuO. Since nanoparticles are very small
in size and therefore have high surface area and
many defects, the Cu2þ near the defects likely
contribute an antiferromagnetic interaction with
neighboring atoms, but of varying strength
throughout the material. This could result in localcanted structures, an effect which is well known in
disordered spinel ferrites [11]. Crystal field calcu-
lations performed by Grebinnik et al. [12], which
show that the shape of observed ESR spectra re-
sults from the exchange interactions in CuO, sup-
port this inference.
The ESR signal for bulk CuO powder also
shifts towards a higher magnetic field value uponannealing. A breaking of the antiferromagnetic
ordering is seen at higher temperatures with the
appearance of a singlet shifted to a higher field
value. It is re-emphasized here that the ESR
measurements have been performed after cooling
the samples to room temperature. Also, these
calcination temperatures are not high enough to
initiate any phase transition, e.g. CuO to Cu2O, aswill be discussed below. Thus, the observed
breakage of antiferromagnetic ordering in particles
annealed at temperatures above 800 �C can be
attributed to the weakening of the exchange in-
teraction between nonequivalent copper–oxygen
complexes, mainly resulting from oxygen defi-
ciency. The broad ESR signal clearly indicates the
presence of a large number of defects in CuOnanoparticles. In bulk CuO powder, the sharpen-
ing of the ESR signal indicates a complete de-
struction of antiferromagnetic ordering [13]. Even
though the N�eeel temperature of CuO is 230 K, the
actual magnetic transition from the antiferromag-
netic state to paramagnetic state takes place only
at higher temperatures. The presence of broad
lines thus observed is typical of the fluid phase.The appearance of the narrow line at the high
field side in the bulk CuO data is attributed to
unassociated CuO molecules. As the annealing
temperature increases, the number of unassociated
CuO molecules grows at the expense of the mag-
netically coupled ones and hence the observed in-
tensification of the high field signal. As discussed
above, the weak antiferromagnetic ordering per-sists to a higher temperature in the nanomaterial
than in the bulk. These differences likely occur
because of the high latent heat of particles in the
CuO bulk powder. Thus, although the calcination
temperature may be lower, because of the high
latent heat the bulk powder is heated sufficiently to
initiate CuO dissociation. Furthermore, the ESR
signals for bulk powder are comparatively nar-rower, indicating a relatively low defect concen-
tration in bulk powder. The ESR line widths (Fig.
4) for the nanomaterial remain almost constant up
to 800 �C. The decrease in linewidth for the bulk
powder results from the continuous growth of a
singlet component in the ESR signal, which arises
from the increase in unassociated CuO molecules,
as explained above.The heating curves obtained by thermal analy-
sis show two transitions. The one occurring below
1050 �C corresponds to the CuO to Cu2O transi-
tion [3], and the onset of the transition is taken as
the first deviation from the baseline. The higher
temperature transition is the melting transition.
The high temperature of the CuO to Cu2O tran-
sition is evidence that our calcination temperaturesare not high enough to induce a structural phase
transition. Two observations from this graph re-
late to the nanoparticle size distribution. First, the
onset of the CuO to Cu2O transition shows a
steady increase with annealing temperature. The
melting transition also shows this general trend
towards a higher transition temperature. These
shifts in transition temperatures result from theincrease in particle size with increased calcination
temperature. The supplied heat distributes readily
in the smaller particles but is not rapidly distrib-
uted in larger ones, leading to a delay in the phase
transition for material calcined at higher temper-
atures. Second, the CuO to Cu2O transition shows
a general broadening as the annealing temperature
increases, or as the particle size increases. This isan indication of a variation of particle sizes within
the sample. A broader peak suggests a large size
distribution, with the small particles undergoing
the transition early and larger ones transforming
later.
The exothermic peaks seen in the cooling curves
indicate a rapid phase transition from Cu2O to the
A. Viano et al. / Journal of Non-Crystalline Solids 325 (2003) 16–21 21
stable CuO phase. This phase transition again isparticle size dependent. CuO nanoparticles an-
nealed at lower temperature regain the CuO phase
at a lower temperature compared to those annealed
at higher temperatures. The width of the exother-
mic peak decreases with particle size, again an
indication of rapid heat dissipation from nano-
particles. DTA results thus clearly indicate the
influence of particle size on the heat distribution.
5. Conclusion
This comparative study of bulk and nano CuO
powder highlights the importance of particle size
on the magnetic properties of nanoparticles. The
presence of a broad ESR signal in both bulk andnanopowder arises from a weakening of anti-
ferromagnetic ordering in CuO. This is also evi-
denced by the shift of this signal towards the
higher field side. The difference in the linewidths of
the ESR signals between bulk and nanopowder
indicates a high defect concentration in nano-
powder, which must arise from the comparatively
high surface area of nanoparticles. The calcinationdoes increase the particle size of CuO nanoparti-
cles prepared via a sol–gel route, but does not
destroy the antiferromagnetic ordering until it is
above 800 �C. The observed higher stability of
antiferromagnetic ordering for the nanomaterial
arises from the rapid heat dissipation capability of
the high surface area nanoparticles. On the con-
trary, antiferromagnetic ordering breaks down at amuch lower temperature, around 400 �C, for the
bulk material. The uneven heat distribution and
high latent heat of bulk powder are the reasons for
this difference. Thus the unique characteristic of
nano CuO, such as a high surface to volume
fraction, is responsible for the preservation of
antiferromagnetic ordering. The unusual magnetic
behavior of nanomaterial is intimately coupled to
its unique physical properties. Further studies willinclude investigations of the magnetic moment as a
function of particle size.
Acknowledgements
The authors would like to thank Ms Sharon
Frase at the University of Memphis� IntegratedMicroscopy Center for assistance acquiring the
TEM images. This work was funded in part by a
grant from Rhodes College.
References
[1] J.L. Dormann, D. Fiorani (Eds.), Magnetic Properties of
Fine Particles, Elsevier Science, Amsterdam, 1992;
G.C. Hadjipanayis, R.W. Siegel (Eds.), Nanophase Mate-
rials: Synthesis, Properties, Applications, Kluwer, Dordr-
echt, 1994.
[2] D. Vaknin, S.K. Sinha, D.E. Moncton, D.C. Johnston,
J.M. Newsam, C.R. Safinya, H.E. King Jr., Phys. Rev.
Lett. 58 (1987) 2802;
W.-H. Li, J.W. Lynn, H.A. Mook, B.C. Sales, Z. Fisk,
Phys. Rev. B 37 (1988) 9844.
[3] J.F. Xu, W. Ji, Z.X. Shen, S.H. Tang, X.R. Ye, Z. Jia, X.Q.
Xin, J. Solid State Chem. 147 (1999) 516.
[4] T.I. Arbuzova, I.B. Smolyak, S.V. Naumov, A.A. Samo-
khvalov, Phys. Solid State 40 (1998) 1702.
[5] K. Muraleedharan, C.K. Subramaniam, N. Venkatara-
mani, T.K. Gundu Rao, C.M. Srivastava, V. Sankara-
narayan,R. Srinivasan, Solid State Commun. 76 (1990) 727.
[6] M. O�Feeffe, F.S. Stone, J. Phys. Chem. Solids 23 (1962)
261.
[7] T.I. Arbuzova, I.B. Smolyak, S.V. Naumov, A.A. Samo-
khvalov, Phys. Solid State 40 (1998) 1702.
[8] A. Punnoose, H. Magnone, M.S. Seehra, J. Bonevich,
Phys. Rev. B 64 (2001) 174420.
[9] W.F. Brown Jr., J. Appl. Phys. 30 (1959) 130S.
[10] Y. Yamada, K. Sugawara, Y. Shiohara, in: Proceedings of
ISS Conference, Tsukuba, 1989, p. 547.
[11] K. Muraleedharan, Ph.D. thesis, Bombay University, 1986.
[12] V.G. Gerbinnik, K.I. Gritasai, V.N. Duginov, V.A. Zhu-
kov, B.F. Kirillov, et al., Phys. At. Nucl. 59 (1996) 195.
[13] A. Punnoose, J. Mathew, B.P. Maurya, M. Umar, R.J.
Singh, Mod. Phys. Lett. B 6 (1992) 1043.