the world is changing. - unicredit · unicredit bank d.d. · annual report 2014 3 contents...
TRANSCRIPT

The world is changing.
Let’s change together.
2014 Annual Report

2014 Annual Report

This year’s report depicts how innovative UniCredit products and ideas help our customers and businesses respond to the challenges of this
changing world.
By spotlighting sophisticated, new multichannel products and services we have developed to meet the modern needs of our customers, we show how our bank is adapting to rapid changes – and how our solutions are helping our customers adapt at the same time.
At UniCredit, we make it easy for the people who bank with us to take full advantage of the technologies and customized services now available to them – so that they can achieve their goals and live their lives on their own terms. As their partner, we have a clear responsibility to provide them the flexibility, the foresight and the tools they need to overcome obstacles and seize new opportunities.
The world is changing. Let’s change together.
2014 Annual Report

2 Annual Report 2014 · UniCredit Bank d.d.

3UniCredit Bank d.d. · Annual Report 2014
Contents
Director’s report 4
Economic environment in Bosnia and Herzegovina 7
Business description 13
Management and Corporate governance 22
Responsibility for the financial statements 25
Independent auditor’s report 26
FINANCIAL STATEMENTS:
- Statement of profit or loss and other comprehensive income 28
- Statement of financial position 29
- Statement of cash flows 30
- Statement of changes in equity 32
- Notes to the financial statements 33-101
APPENDICES
APPENDIX A The financial statements presented in the form prescribed by the Regulations on the content and form of financial statements for banks and financial institutions 104
APPENDIX BAddress and phone numbers 108
APPENDIX C Business network of UniCredit Bank d.d. as at 31 December 2014 109

Director’s report
Dear clients, shareholders and business partners, With exceptional pride and pleasure we present to you the outstanding achievements of UniCredit Bank d.d. (hereinafter: the “Bank”) in the year 2014.
The year behind us was marked by a challenging macroeconomic and political environment, while the floods that hit the country in May have further adversely affected the business environment. We are proud to have surpassed expectations regarding the implementation of our business objectives in such a demanding environment. We strengthened our leading position in the banking sector of Bosnia and Herzegovina concluding the year as the leading bank in size of total assets, profit, issued loans and collected deposits, and we have improved our market share in the retail segment and corporate segment, whereby we reaffirmed once again our strength, stability and resilience and proved the quality of our work.
The focus of all our activities is the delivery of quality services to almost one million of clients, where all efforts were focused on achieving a high level of their satisfaction and creating solutions to the needs of each individual client. We are proud to highlight the fact that every fifth convertible mark is being saved in our Bank, and more than a sixth of all loans were issued to our clients.
In 2014 we continued to strengthen our revenue position by achieving so far the largest annual revenues, while with a rational approach to cost management we achieved significant savings, resulting in the lowest annual operating costs so far. All this has contributed to finish this year with a net profit of KM 61.4 million which is by KM 5.8 million more than in 2013.
This result was achieved while retaining all the traditionally strong fundamentals of our Bank successfully built up for years, and measured by parameters like the ratio of loans to deposits which
“ The focus of all our activities is the delivery of quality services to almost one million of clients, where all efforts were focused on achieving a high level of their satisfaction and creating solutions to the needs of each individual client.”
IVAN VLAHO Director
4 Annual Report 2014 · UniCredit Bank d.d.

last year amounted to 83.7% or coverage of bad loans with provision. The Bank’s assets in 2014 shows stability and amounts to KM 3,962 million KM. Total net loans recorded an increase of 7.2% compared to the previous year and amount to KM 2,479 million. There has been growth in customer deposits of 8.7%, and the year is being concluded with an amount of KM 2,961 million. Strong capital base was further strengthened in 2014, with a capital amounting to KM 640.1 million which is an increase of 10.6% compared to previous year. Capital adequacy ratio in the amount of 16.4% confirms the safety of operations with the Bank.
The credit for the successes achieved belongs to all Bank employees whose selfless contribution and effort embedded in our results. Human resources management in UniCredit Bank has a strategic role and priority, thereby resulting in a positive effect on our customers and the community in which we operate, hence strengthens the competitive advantages of our bank, and from year to year, ranks us among the most desirable employers.
On the top of our priorities is also our focus on corporate social responsibility and improving the quality of life in Bosnia and Herzegovina. That is why we want to point out, with special proud of our humanitarian actions aimed at helping areas affected by natural disasters. We renewed our four branches that are directly affected by the floods, and we are particularly proud on the collegiality and wholehearted solidarity that employees expressed to their colleagues, whose houses and properties directly suffered in the natural disaster.
As part of corporate social responsibility activities of the Bank emphasize the initiative we launched last year with UniCredit Foundation in order to provide KM 117,000 for development of social entrepreneurship in our country.
Additional power of the Bank is represented through affiliation to UniCredit Group, which for many years shows the most serious approach to banking in Central and Eastern Europe.
The success of the Bank during the past year has been awarded with numerous awards. Posao.ba named us one of the 10 most desirable employers in BiH, Consultant Revicon and Prism Magazine awarded us the Crystal Prism for the most successful bank in 2013, while our magazine Bank & Business in BiH crowned with two Gold BAM for total capital and return on equity - ROE.
Results achieved in 2014 gave us a very good starting position for the start of 2015. Before us is an ambitious goal to raise our scale of excellence to a higher level. I expect to continue with the development trends of our Bank, where the focus of all our activities still will be to provide quality services to our clients, and to support the development of our community.
We look forward to the year ahead. We at UniCredit Bank d.d. Mostar are ready to provide all kinds of support to creating a good business environment and run the investment and the economic cycle in our country in the desired direction.
On behalf of the Management Board I would like to thank all customers and business partners for their loyalty and trust, that in the future will be justified.
Sincerely yours,
5UniCredit Bank d.d. · Annual Report 2014
Ivan Vlaho Director

6 Annual Report 2014 · UniCredit Bank d.d.
The future is for everyone.
Simplicity and clarity appeal to all of us. That’s way UniCredit created Subito Banca via Internet, a practical online banking interface with common sense graphics, intuitive navigation buttons and large fonts. We are making our online services easy to use even by people unfamiliar with new technologies. We are offering solutions based on the preferences of more than 300 customers over the age of 60, collected during workshops and laboratories in Italy. We are proof that you can always innovate in a new way.
Technology is for young people.
Young people of all ages.

7UniCredit Bank d.d. · Annual Report 2014
Economic environment in Bosnia and Herzegovina
Macroeconomic review of year 2014
The most important events on the world financial markets during 2014, such as the fall in oil prices, interest rates, geopolitical conflict between Russia and Ukraine, have significantly affected the originally announced forecasts, leading numerous corrections of the expected numbers, and will largely shape the economy in the future.
The slow recovery of the international environment and a high degree of political uncertainty during 2014 showed a weakening of the economic activity of Bosnia and Herzegovina from the first quarter until the expected stagnation of the end of the year.
Despite the fact that the economy of Bosnia and Herzegovina in 2013 recorded relatively good results, the apparent reversal in the first few months of 2014 confirmed the fragility of the economic model and the fact that the growth is not re-used for the development and reduction of unemployment.
Although heavily influenced by a weakened economy of the main EU partners, Bosnia and Herzegovina significantly inferior results achieved were mainly on the basis of internal barriers that have prevented the retention of good trends from 2013.
Among the most important events that have affected the economic and political development of the country should be mentioned in (a) protests that took place earlier this year, resounding strongly in medias all over the world and thus leaving the image of a unstable socio-economic environment in the country, (b) large and devastating natural disasters caused enormous damage to the country in May, (c) general elections, which were held in October and the impossibility of forming a government from which it was expected to animate the investment cycle in the country, (d) a new approach to the EU for the activation of pre- accession Treaty for Bosnia and Herzegovina, which should include specific reforms signed by key political leaders, (e) a new approach to the IMF to Bosnia and Herzegovina, which expects commitment of government to create economic sustainable model as a precondition for the withdrawal of new funds.
Failure to implement the necessary reforms in the country led to further deterioration in the position of Bosnia and Herzegovina in world rankings report “Lakoća poslovanja 2014”, placing 131 on the scale. Delays in reforms and poor positioning will certainly further negatively contribute to already slow trend of foreign direct investments in Bosnia and Herzegovina. The adopted strategy of foreign direct investment as well as public investment in Bosnia and Herzegovina mostly rely on the continued development of the energy sector and transport, which should be the main drivers of the investment cycle.
Comparing Bosnia and Herzegovina to other countries in the region but also in CEE, it can be concluded that macroeconomic trends have not recorded much poorer results in comparison to other countries, of course taking into account the additional restrictions of Bosnia and
Herzegovina in terms of the weak base for the development and the complexity of the political decision-making. It is expected that each negative correction of forecast for the EU partners will also negatively impact on Bosnia and Herzegovina, but still it has not found itself with a negative sign or in recession as it is the case for some other neighboring countries.
Conditions in the labor market remain almost unchanged, with an unemployment rate that has never fallen below 44% with an almost unchanged amount of salaries paid. This trend in the labor market has not given the opportunity to recover personal consumption. High unemployment continues to pose serious challenges for the creation of a sustainable economic model of the country.
In such conditions dominated by deflation with a level of -0.4% at the end of 2014. During the first half of the year the negative rates are significantly increased, while in the second half of the year, are nevertheless lowered to a moderate level, but still with a negative sign.
Rating of Bosnia and Herzegovina has still not been changed and remains at level “B with a stable outlook”, according to S & P and “B3 with stable outlook” according to Moody’s, with the IMF Stand-By Arrangement as the main sanctuary.
At the beginning of 2014 it seemed that industrial production continued with a promising trend from 2013, but in April the growth of industrial production was significantly reduced and additionally influenced by the effects of natural disasters that befell Bosnia and Herzegovina. The largest drop was in the electricity sector due to high base from previous year and unfavorable weather conditions, then mining, agriculture, forestry and transport. Despite negative influences on the construction sector, production has not recorded a negative sign due to the continuation of works on the construction of Corridor Vc highway. The beginning in 2014, brought optimistic rates on foreign trade growth, with the growth of export at a rate of 5-6%, but slowing down and a reverse trend came in the first quarter and deteriorated further after the May floods. The trade deficit increased steadily throughout the year with lagging in production but and a damaged transport infrastructure. Trends in trade show stronger orientation to Germany and Italy, as the main trading partners since the entry of Croatia to the EU (given the still unadjusted standards for the export of goods and services which entered into force after the Croatia entered to the EU).
During 2014 Stand-by arrangement with the IMF remained the main support of the financial stability of the country. The funds have been engaged twice, in January tranche VI in the amount of SDR 42,275,000 and in July tranches VII and VIII in amounts of SDR 42,275,000 each with an increase of SDR Stand-by arrangement for 50% of the quota, ie. SDR 84,550,000 intended to mitigate the effects of natural disasters (floods in May).

8 Annual Report 2014 · UniCredit Bank d.d.
Identifi ed the problem that the funds of the Stand-by arrangement are mainly used for repayment of old debts and other budgetary expenditures and not for development purposes, has led to the fact that the eighth review of the IMF arrangement which started in September 2014 has not been completed and is awaiting fi nal opinion of authorities in Bosnia and Herzegovina for compliance with the new approach to the reforms required by the EU, and the expected creation of a new economic model of the country.
Great devastating fl oods and landslides that have affected 20% of the territory of Bosnia and Herzegovina in May 2014, took with them almost 15% of GDP in Bosnia and Herzegovina and caused extensive damage to the transport and energy infrastructure, private and public lands. Such signifi cant damages led to a large lag in the overall economy, the decline in industrial production and foreign trade. All international institutions in a timely manner have worked to help Bosnia and Herzegovina. The Donors’ Conference, which took place in July 2014, raised 1.6 billion aid to Bosnia (of which 0.3 billion of grants and 1.3 billion of loans with favorable terms). The total amount raised at the conference represents 40% of the total projected damages (KM 3,98 billion). Given that the planned renovation dynamics is not achieved, many international political fi gures have expressed dissatisfaction with the low renewal and distribution of funds.
Expectation for 2015
Almost all fi nancial institutions announced the recovery of the economy of Bosnia and Herzegovina in 2015, the differences are only in the expected intensity of that growth. But we stick to forecasts of GDP growth of 2%, due to the less optimistic estimate of the Eurozone and the neighboring countries, but still with caution because of the political stalemate in government formation. It is undisputed that after stagnation, a good basis for growth and improvement has been created in 2014 including also new opportunities for the country that in 2015 should initiate positive processes in socio-economic terms and initiate pre-accession negotiations with the EU. A new direction that will be defi ned during 2015, will depend on the resources of international institutions which have so far played a key role in maintaining fi scal discipline and stability.
As the rating of Bosnia and Herzegovina has so far largely relied on the support of the Stand-By Arrangement with the IMF is certainly the main goal for 2015 to reach a clear decision on the reforms that will enable investments, further growth and development, and not stagnation or a new degradation of the country.
Economic environment in Bosnia and Herzegovina (CONTINUED)
Macroeconomic review of year 2014 (continued)
Key macroeconomic indicators in Bosnia and Herzegovina
2011 2012 2013 2014FNominal GDP (KM billion) 25.8 25.7 26.3 26.1Population (in thousand) 3,840 3,836 3,832 3,829GDP per capita (in KM) 6,712 6,709 6,853 6,810Real GDP (annual change, %) 1.0 -1.2 2.1 -Consumer prices (annual change, %) 3.1 1.8 -1.2 1.0average 3.7 2.1 -0.1 -0.8Monthly wage (annual, %) 4.4 1.5 0.2 0.1Unemployment rate (registered, %) 43.3 44.1 44.6 44.0Balance of state budget (in % of GDP) -1.2 -1.9 -2.3 -4.0Balance of the current account of balance of payments (in % of GDP) -9.7 -9.3 -5.5 -8.1Foreign direct investments (in % of GDP) 2.6 2.1 1.9 3.5Foreign currency reserves (in KM billion) 6.4 6.5 7.1 7.2FX rate EUR/KM 1.96 1.96 1.96 1.961M EURIBOR, end of period 1.0 0.1 0.2 -average 1.2 0.3 0.2 0.1
Source: Agency of Statistics of Bosnia and Herzegovina, Central Bank of Bosnia and Herzegovina, UniCredit Research

9UniCredit Bank d.d. · Annual Report 2014
Banking Industry in 2014
The banking sector has a key role in the financial system of Bosnia and Herzegovina. Once again confirmed as stable and liquid by all major international financial institutions, the banking sector is headed towards new adjustments to European business standards, which can be seen through a number of regulatory changes introduced during 2014.
Its stability the banking sector confirmed by high capital adequacy ratio, which amounted to 17% at the end of the third quarter 2014. Of course, such a result can be seen as a reflection of poorly loan growth, but also the absence of significant dividend payments and timely coverage of major losses through recapitalisation.
Among the most important changes during the year 2014 following should certainly be specified (a) the new Law on Consumer Protection FBiH, where there has been a significant change in the terms of contracts with customers, (b) amendments to the Decision on minimum standards for capital management, where the law is partially closer to Basel II and Basel III standards with the introduction of limits for the payment of dividends, (c) FATCA implementation, for which the banks individually signed agreements for harmonisation, since it has not signed IGA agreement at the country level, (d) amendments to the Decision on minimum Standards for liquidity of banks, with the permission of including a stability factor of a part of deposits with longer maturities and (e) increase in amount of deposit insurance from 30,000 to KM 50,000 in December 2013, which proved to be a good protective measure already in 2014 in the liquidation process of a small bank.
The banking sector has confirmed its important role in the country through support at the time of natural disasters that occurred in May. Decision has beem made on temporary measures when dealing with loan liabilities of clients who are affected by natural disasters, defining the terms of the moratorium and restructuring of loans. Per Decision it was determined that maximum duration of the loan moratorium was up to 12 months (no more than 30.9.2015), as well as the maximum level of interest rates that banks can charge for the duration of the moratorium (max 50% of the originally agreed). At the same time Decision agreed the possibility of replacing the existing credit liabilities of clients, including the extension of principal and / or interest, reducing interest rates, write-off of part of the receivables, the capitalization of interest, approval of new loans and the like.
Development of capital markets and financial sector of Bosnia and Herzegovina contributed to the issuance of securities of the Government of FBiH and RS, where the most important customer just occurs to be the banking sector. During 2014 , a total of KM 414 million treasury bills was issued and KM 326 million bonds. Looking at the entities, FB&H issued treasury bills in the amount of KM 240 million and KM 140 million bonds. The RS government issued treasury
bills in the amount of 174 million KM and bonds in the amount of 186 million KM.
In the market of Bosnia and Herzegovina in 2014, the number of banks was reduced to 26 due to the liquidation of a bank with headquarter in RS. Total assets of the banking sector in 2014 grew by 4.4% compared to the previous year and amounted to KM 24,478 million.
Intense competition from banks was felt in 2014, which reflected mostly as great pressure on net interest margins. The decrease in interest expense partially offset the gap in interest income, with an increase in customer deposits (ratio Loans / Deposits decreased to the 122% in 2008 to only 109% in 2014), while reducing dependence on foreign funding (return Funding and credit lines).
As a major risk and expense of banking sector remains a steady increase in the volume of non-performing loans and a way to manage this type of portfolio. Although the beginning of the year pointed to a positive direction, the second quarter clearly showed that the share of non-performing loans continues to rise. The corporate segment of legal entities in the third quarter of 2014 reached a record level of 20.7%, the retail segment registered a rate of 10.5%, while the total loans ratio of non-performing loans amounting to 16.1%.
This upward trend in non-performing loans takes cautious monitoring of the profitability of the sector, given the uneven trend in risk provisions sas movement volume non-performing loans.
High unemployment and stagnant salaries certainly do not give the opportunity to strengthen personal consumption, so the majority of activity in the part of the increase in lending volume largely remained on restructuring of existing debt and customer acquisition. Total loans grew by 2.8%, where loans to households have increased by 5.7%, while the corporate segment grew by 0.7%.
Deposits did not face a decline. During 2014 there was an intense competitiveness in interest rates on deposits, with banks trying to make up for the return of foreign sources of domestic deposits, especially in the retail segment. Movement of corporate deposits during the year were under the influence of Goverment deposits and inflows of IMF funds. Total deposits grew by 8.5%, where retail deposits rose by 9.0%, while the corporate segment grew by 7.7%.

10 Annual Report 2014 · UniCredit Bank d.d.
Expectations for 2015
The movement of the banking sector will largely depend on the investment cycle in the country. Considering that lending to the corporate sector is lagging behind up to several months comparing to GDP growth, each delay of economic recovery reduces the possibility of signifi cant demand for loans by the end of 2015. Revival of projects and infl ow of new investments are of crucial importance for the recovery of the economic cycle and thus to stimulate loan growth. Revenue will remain under severe pressure due to the still present strong competition and the increasing focus of banks on the retail segment which is recognized as less risky. Profi tability of the banking sector will surely continue to be under close observation, given the potential risk resulting from continued deterioration of portfolio quality.
Economic environment in Bosnia and Herzegovina (CONTINUED)
Banking Industry in 2014 (continued)

11UniCredit Bank d.d. · Annual Report 2014
The world moves fast.
Anticipation makes a world of difference.
Serving talent.
In a world that is always on the move, UniCredit saw the need for a network of high-tech services.UniCredit Start Lab is our accelerator for innovative startups. From mentoring and network development to managerial coaching, we’ve got it covered. MyZabaStart is a platform, lauched in Zagrebačka Banka Croatia, that provides support for deserving business ideas in the green, creative and innovative sectors, to help drive their business growth.

12 Annual Report 2014 · UniCredit Bank d.d.
Time is precious.
Give it more value.
Advice when you want it.
Everyone needs advice. And no one wants to waste time. That is why we created Video Advice@home. This convenient service delivers expert advice online, allowing you to connect with our consultants from the comfort of home. Easy-to-install software enables us to respond quickly to questions about your current account, car loan or mortgage. We can create value for you, whenever and wherever you need us.

13UniCredit Bank d.d. · Annual Report 2014
UniCredit Bank d.d. Mostar (hereafter the “Bank”) is a licensed commercial bank headquartered in Bosnia and Herzegovina.
The Bank provides the full range of fi nancial services to companies and individuals in Bosnia and Herzegovina.
The Bank is serving over 945 thousand retail clients and more than 3.8 thousand of corporate clients. The full set of banking services provided by the Bank, includes corporate banking, retail banking, fi nancial institutions, international operations, investment banking.
The Bank readily and actively participates in the implementation of new developments in the banking sector and contributes through its active engagement to the promotion of an innovative approach in the form of more transparent communication, reporting, application of standards and sharing of know-how gained from the rich pool of experience of the Group the Bank belongs to.
Business description
Sarajevo
Visoko
Kakanj
Vareš
Olovo
TuzlaKalesija
Živinice
MaglajJelahGračanica
Doboj
Orašje
Brčko
Odžak
ZavidovićiŽepče
Zenica
TravnikTurbeNoviTravnik
Bugojno
Donji Vakuf
Uskoplje
VitezBreza
Konjic
Mostar
Široki Brijeg
Grude
PosušjeČitluk
LjubuškiMeđugorje
Stolac
Neum
VogošćaKiseljak
Rama
Fojnica
Jajce
Bihać
Cazin Prijedor
V.Kladuša
Bosanska Krupa
Sanski MostBanja Luka
Laktaši
Livno
Tomislavgrad
Gradačac
Lukavac
Srebrenik Bijeljina
Tešanj
Čapljina
Map of the Branch Network

14 Annual Report 2014 · UniCredit Bank d.d.
Business description (CONTINUED)
Retail segment
clients in 2014 we have continued to spread the network of, pay-in/pay-out ATMs and with year end we had 36 devices in production which enable clients to deposit money on current accounts of retail/current account of corporate entities in any moment.
Our ATMs beside stated functions enables client’s cash disbursement, to confi rm balance and sale of prepaid vouchers.
We are working hard to confi rm the reputation of dynamic and modern bank that follows the requirements of the market, considering the needs of its customers and strives to be the number one bank in their eyes.
Organization
The retail segment offers a wide range of products and services to clients of personal, family and small business banking, and manages the branch network and direct channels of distribution.
The business network is divided into 10 regions, which are further split into agencies located throughout Bosnia and Herzegovina, and as of the end of 2014, there were 79 such agencies.
Retail Banking has a portfolio of more than 945 thousand clients, segment of individual clients and small business banking.
Business in 2014
The business is client oriented, so that client’s needs are recognised in a unique way, where continuous improvement of processes and services, which result in a more effi cient and simple management of business relations, development of client business consulting through an individualised approach and a full range of Bank’s products and services, continuously differentiate the Bank from its competitors.
According to 2014 surveys, clients once again demonstrated that they appreciate the unique quality of service and rewarded the Bank’s focus on improvement of the client satisfaction.
As an innovative and modern Bank in the market, which follows trends and clients’ needs, we would like to make our e-ba and m-ba services even more user-friendly for our new and future clients, and in this segment we constantly work on development and up-grading of applications and improvement of client experience.
In addition to banking products and services, the JES Package, as an anchor product of the Bank, also provides a range of non-banking services and benefi ts, thus enriching and facilitating the everyday lives and businesses of our clients, which have been recognized by over 100,000 satisfi ed users.
Client recongnise the Bank as a reliable partner and dring 2014 a growth of the Bank’s market share has been recorded, not only in deposits but also in retail loans Volume of loans to individuals was at level of KM 1,500.4 million, with an increase in market share to 20.5%. The volume of retail deposits at the end of 2014 increased to KM 1,921.7 million, with an increase in market share of 21.2%.
In the credit card business, a diverse range of card products tailored to the demands of our clients, as well as a wide ATM and EFT POS network enabling access to cash at any time and in any place, giving clients the necessary freedom and fl exibility.
With the end of 2014 the banks network of ATMs consists of 256 ATMs in production. Following the needs of the market and the

15UniCredit Bank d.d. · Annual Report 2014
Corporate and Investment Banking Sector
and strengthening this segment of the market. In part to protect customers against market risks, the focus is on continuous education of customers about the products and services which Markets, financing and advice can offer to improve the business of clients. Share in syndicated loans as the leading creditor and Agent in syndication indicates that business focus remains on strengthening the economy and the public sector through transactions and comprehensive support.
By improving business and our products, we want to be committed and be closer to our customers, in order to mutually accomplish our goals. Drawing on the strength of UniCredit Group, taking into account the nature of the local market, we provide an integrated approach to solutions, to improve our quality of products and services, raise efficiency and provide ease of operation.
So during the year we spent a number of business activities in the field of product management, and are creating and introducing new products and improved existing ones:
• Factoring,
•Mediation services in concluding insurance policies with insurance companies in cooperation with UniCredit Broker d.o.o.,
• Improvement of products and processes in the card business and the front end system with a focus on fulfillment of changes in regulations.
Thanks to the joint work of our teams, we were able to adapt to constant changes of the market and high customer expectations. The market continues to be challenging, but the opportunities for growth and advancement are still present.
Organisation
The segment of Corporate and investment banking deals with clients from large and medium-sized enterprises to whom in addition to product financing also offers products from the domain of global transaction banking and financial markets.
Through ten business centers the Bank covers the entire Bosnia and Herzegovina and the leads business relations with over 3.8 thousand clients, segment of large enterprises and middle enterprises.
Business in 2014
The domestic market continues to record weak economic recovery with the deterioration in asset quality, with foreign investment significantly reduced in the last few years. In these conditions, with strong competition in lending, and a limited number of quality investment projects, UniCredit Bank managed to increase its market share in all major segments of corporate business. Despite the challenging environment, the Bank has increased in the segment of lending to corporate entities, and the total amount of loans at the end of 2014 amounted to 1,270 million, which resulted in the growth of market share to over 13%, while deposits of corporate clients at the end of 2014 amounted to 1,016 million with an increase in market share to over 15%.
Thanks to a balanced business model in which we rely on sustainability, commitment to our customers and regional availability we were able to provide a unique approach to the market of Bosnia and Herzegovina with a service level in accordance to business expectations and needs. Participating as partners in the business activities of the government and private companies we used the possibility that we can respond to all client requests that are consistent with our culture of risk.
In 2014, we maintained our position of the most important partners in the financing of government which is supported by our long-standing dominant position in the market for this segment of clients. Also, UniCredit Bank has participated in all significant and major transactions in the private sector in the country that are related to corporate banking clients.
The Bank has provided support to SMEs, through projects in the sphere of renewable energy and improvement of energy efficiency in cooperation with international financial institutions (EBRD and WB) through which was approved more than 35 million customers through a number of available credit lines.
Active participation in the domestic securities market, significantly increased the market share of the Bank in the number of issued market securities that is also evidence of commitment to support

16 Annual Report 2014 · UniCredit Bank d.d.
Business description (CONTINUED)
Financial Overview and Business Performance
Strong pressure on decrease of interest rates is still present. The decrease of the interest income (KM 0.8 million) is due to infl uence of lower interest rates charged on loans to customers, while at the same time, with higher interest expense (KM 0.5 million) due to higher volume of deposits (term) compared to 2013, has resulted in less net interest income (KM 1.3 million) compared to previous year.
Lack of quality development projects and low investment levels on the market is still noticeable, while savings, due to postponement of investments, are further increased.
Net fee and commission Income
The net fee and commission income amounts to KM 57.7 million, with an annual growth of KM 2.5 million (4.6%).
The increase in fees is mainly a result of higher fee rates in the payment system (larger number of transactions with the introduction of new fees), higher loan fees (secured loans) and higher fees on credit card transactions.
Net gains from FX transactions and FX differences on conversion of monetary assets and liabilities, and other income
Net gains from FX transactions and FX differences on conversion of monetary assets and liabilities, and other income in 2014 amounted to KM 10.6 million, on the same level as previous year. FX gains were decreased by KM 0.2 compared to previous year, while other income is increased by KM 0.2 million.
Financial indicators:
(in KM ‘000)31 December
201431 December
2013Total operating income 206,905 205,795Profi t before impairment losses and taxation 91,418 85,316Profi t before tax 68,985 63,006Profi t for the year 61,398 55,571Equity and reserves 640,074 578,828Loans and receivables from clients 2,478,823 2,311,743Current accounts and deposits of clients and banks 3,056,717 2,868,657Total assets 3,961,762 3,729,433
Performance indicators Capital adequacy 16.4% 20.0%Operating costs in total income 55.8% 58.5%Return after taxation on equity and reserve (ROE) 10.1% 10.0%Return before taxation on average total assets (ROA) 1.8% 1.7%
Overview of business operations of the Bank
In 2014, the Bank generated KM 61.4 million profi t before taxation, which is by KM 5.8 million (10.5%) more than in the previous year. Profi t growth was a result of higher cost effi ciency, focus on cost management and continiuos advancement of processes and higher fee and commission income, despite different hardships from the bussines envirement.
During 2014, the Bank focused on retaining the position of market leader and main participant in terms of initiating and implementing new banking standards, and improve customer satisfaction through the adoption of existing and introduction of new products and services while preserving the quality of the portfolio.
Income and expenses
Total income of the Bank for 2014 amounts to KM 206.9 million, which is KM 1.1 million above the last year level (0.5%).
In the structure of the Bank’s total income, share of net interest income amounts to 67% and decreased by 1.0 percentage point compared to previous year, while the share of net income from fees and commissions increased by 1.1 pp and amounted to 27.9%, while other income accounted for 5.1%.
Net interest income
The 2014 net interest income amounted to KM 138.6 million, which is 1% less compared to previous year.

17UniCredit Bank d.d. · Annual Report 2014
Operating expenses
The 2014 operating expenses amount to KM 115.5 million, which was less than KM 5.0 million (4.1%) compared to previous year. Improvement and increase of efficiency, optimization and rationalization of the branch network contributed significantly to lower administration costs and depreciation.
Personnel costs amounted to KM 53.7 and are higher by KM 0.2 million (0.3%) compared to previous year, due to higher salary costs and costs of severance payments, and optimization of the number of employees, at the same time.
Administrative and marketing expenses amounted to KM 37 million and decreased by 0.9 million (2.4%) compared to previous year, due to lower costs of marketing, communications and sponsorship, the cost of information and communication technologies, cost of real estate, insurance and cash management. With the continuous improvement of cost management activities of the Bank achieved a favorable share of operating costs in operating income for 2014 of 55.8%, which is an improvement of 2.7 percentage points compared to the previous year.
Impairment losses and provisions
Total impairment and provisions costs amounted to KM 22.4 million and they are higher by KM 0.1 milion (0.5%) comparing to previous year.
The increase in provisioning costs relates to the current situation in the business environment, where still dominates the prolonged recession and high unemployment.
Impairment losses on loans and receivables from customers amounted to KM 18.3 million and this was KM 2.1 million (10.2%) decrease compared to previous year. Net impairment of loans and receivables resulted from KM 14.1 million new provisioning costs, out of which KM 17.4 million for corporate loans, and KM 3.3 million for retail loans, plus new costs of provisioning for the performing portfolio in the amount of KM 4.2 million.
Other impairment and provisioning amounted to KM 4.2 million of additional charges, including off-balance provisioning of KM 3.4 million and allowance for other assets of KM 0.8 million.
Income and expenses structure for 2014
Interest expense 22.68%
Fee and comission expenses 1.44%
Staff costs 29.52%
Operating costs 34.01%
Impairment losses on loans and receivables and other provisions 12.34%
Structure of expenses
22.68%
1.44%
29.52%34.01%
12.34%
Interest income 74.48%
Fee and commission income 24.99%
Other income 0.54%
Structure of income
74,48%
24.99%
0.54%
Assets
As of 31 December 2014, the Bank’s assets amounted to KM 3,961.7 million, with an increase in the amount of KM 232.3 milion (6.2%) compared to previous year, mainly because of increase in loans and commitment receivables financed initially through growth of client deposits.
Assets structure
The previous chart shows the structure of assets and trends in 2014 and 2013.
Treasury funds
Loans and receivables from customers
4,000,000
3,500,000
3,000,000
2,500,000
1,500,000
500,000
2,000,000
1,000,000
2014 20130
Property,equipment and intangible assets
Accrued interest and other assets
Total assets
Assets structure KM (000)

18 Annual Report 2014 · UniCredit Bank d.d.
Business description (CONTINUED)
Asset of Assest and Liability Management sector
Property of Assets and Liabilities Management sector consists of cash and cash equivalents, reserve and free funds with the Central Bank of Bosnia and Herzegovina, loans and advances to banks and securities. Total assets of Assets and Liabilities Management sector amounted to KM 1,388.1 million, an increase of KM 71.5 million (5.4%) compared to previous year. Participation in total assets of these properties amounted to 35.0%, a decrease of 0.3 percentage points compared to the previous year.
Loans to and receivables from to banks still keep the largest share within these assets, as well as cash and cash equivalents, followed by obligatory reserves and securities.
The Bank has maintained throughout the year liquidity considerably above the required limits of the Banking Agency of Federation of Bosnia and Herzegovina and the Central Bank of Bosnia and Herzegovina.
The structure of loan and advances to customers:
(in KM ‘000)31 December
201431 December
2013 Change
Gross loansCorporate 1,269,684 1,208,053 61,631Retail 1,505,071 1,386,371 118,700
2,774,755 2,594,424 180,331
Allowance for impairment losses Corporate (201,830) (190,179) 11,651Retail (94,102) (92,502) 1,600
(295,932) (282,681) 13,251
Net loans Corporate 1,067,854 1,017,874 49,980Retail 1,410,969 1,293,869 117,100
2,478,823 2,311,743 167,080
Asset of Assest and Liability Management sector
(in KM ‘000)31 December
201431 December
2013Cash and cash equivalents 471,476 423,265Obligatory reserve with CBBH 267,416 243,005Loans to and receivables from banks 330,456 507,470Financial assets available-for-sale 318,839 142,933
1,388,187 1,316,673
Financial overview and business performance (continued)
Loans and advances to customers
Gross loans and advances to customers increased by KM 180.3 (7.0%) million on yearly basis, despite the diffi cult economic situation in the region and lack of investment.
Gross loans to corporates (including state and public institutions) at the end of 2014 amounted to KM 1,269.7 milion and are increased by KM 61.6 milion (5.1%). Their participations in the total portfolio amounted 45.8% and is decreased by 0.8 pp compared to the last year.
Gross loans to citizens at the end of 2014 amounted to KM 1,505.1 million, and are increased in the amount of KM 118.7 million (8.6%), despite the high rates of unemployment and lower disposable income due to higher citizens borrowing. Their share in the total portfolio amounts to 54.2% and is increased compared to the previous year by 0.8 pp.
The largest portion in the overall retail loans portfolio referred to long-term all-purpose loans (68.5%), followed by long-term housing loans (18.1%) and receivables based on current accounts (7.5%) and credit cards (5.1%).

19UniCredit Bank d.d. · Annual Report 2014
2,000,000
1,500,000
1,000,000
500,000
0Demand deposits Term deposits Total
Current accounts and deposits from Retail in 2014
Current accounts and deposits from Retail in 2013
Current accounts and deposits from Retail
Current accounts and deposits from Corporate and State in 2014
Current accounts and deposits from Corporate and State in 2013
Demand deposits Term deposits Total
1,200,000
1,000,000
800,000
600,000
400,000
200,000
0
Long-term loans made 62.7% of the total gross loans, while short-term loans made 37.3%.
Allowance for impairment losses on loans compared to the previous year increased by KM 13.2 million, out of which provisions for corporate loans increased by KM 11.6 million, and provisions for retail loans increased by KM 1.6 million.
The Bank is continually focused on preserving the quality of the loan portfolio are therefore non-performing loans are monitored and adequately secured.
Net loans to customers amounted to KM 2,478.8 million, recording an increase of KM 167.1 million (7.2%) compared to the previous year.
Liabilities, equity and reserves
Structure of liabilities, equity and reserves – comparation with previous year:
In terms of structure of corporate deposits (including state and public institutions), they are divided into a vista (81.3%) and term deposits (18.7%). Compared to previous year, the deposit ratio shifted in favour of a vista deposits (growth by 0.1 pp).
Current accounts, savings and term deposits of retail customers at the end of 2014 amounted to KM 1,944.7 million, and are higher compared to previous year by the amount of KM 204.8 million (11.8%). Their share in total current accounts and customer deposits amounted to 65.7%. Within the total retail deposits, term deposits make up 51.5% and a vista deposits 48.5%. Compared to the previous year, the share of deposits has changed in favor of term deposits of 0.7 pp.
Structure of current accounts and deposits from customers – comparation with previous year:
2014 2013
2,000,000
1,000,000
500,000
0
1,500,000
Structure of liabilities, equity and reserves
Curent accounts and deposits from Retail
Curent accounts and deposits from Corporate and State
Curent accounts and deposits from banks
Interest -bearing borrowings and subordinated debt
Equity
Other liabilities
Provisions for liabilities and charges
Current accounts and deposits from customers
Total current accounts and deposits from customers in 2014 amount to KM 2,961.2 million and are increased by KM 236.9 million (8.7%) in comparison to previous year. Current accounts and local currency deposits in local currency made 50% of the total deposit portfolio and is decreased compared to previous year by 0.1 pp.
Current accounts and deposits of corporate clients and state amount to KM 1.016.5 million and were increased by KM 32.1 million (3.3%), compared to previous year. Their share in total current accounts and deposits of clients amounted to 34.3%.
Current accounts and deposits with banks, and borrowings
Current accounts and bank deposits at the end of 2014 amounted to KM 95.5 million and are decreased by KM 48.8 million (33.8 %) compared to the previous year.
Borrowings at the end of 2014 amounted to KM 158.3 million and are decreased by KM 21.6 million (12%) compared to the previous year.
Current accounts and deposits from Corporate and State

20 Annual Report 2014 · UniCredit Bank d.d.
Borrowings consist of assets of UniCredit Bank Austria AG, EIB1), the EBRD2), UniCredit Bank AG, Foundation for Sustainable Development “OdRaz” (World Bank funds), the Development Bank of the Federation of Bosnia and Herzegovina (LDP and IBF) and HBOR3).
The share of deposits in total liabilities and equity of the Bank is 2.4%, while the share of borrowings is 4.5%. Comparing to the previous year, the share of deposits and borrowings was reduced by 2.3 pp.
Equity and reserve
The Bank’s equity amounted to KM 640.1 million and compared to previous year is increased by KM 61.2 million, as a result of including the current year profi t into the Bank’s reserves.
Equity and reserves make 16.2% of the total funding which in an increase of 0.6 pp growth in comparison to previous year.
The capital adequacy ratio, presented according to the local regulator methodology, is 16.4%, which is a decrease compared to previous years amounting to 20%, due to change in local legislation.
The capital adequacy according to the Basel III methodology for 2014 is also signifi cantly above the prescribed limit.
Key performance indicators
The profi tability ratio ROE is 10.1% and it’s below the last year’s level (due to greater increase of equity vs. profi t), while ROA is 1,8% and it’s above the last year’s level.
The effi ciency indicator (cost to income ratio) is 55.8% and it’s improved by 2.7 pp compared to the previous year, as a result of higher revenue growth compared to the growth of costs.
Net loans to deposits are 83.7%, which indicates stability and self-sustainability, i.e. fi nancing of loans from the Bank’s own resources.
Profi tability per employee (gross operating profi t in relation to the number of employees) is KM 75.2 thousand and it has increased of KM 13 thousand compared to the previous year, as a result of revenue growth and optimization of number of employees.
1 European Investment Bank – Europska investicijska banka2 European Bank for Reconstruction and Development – Europska
banka za obnovu i razvoj3 Hrvatska banka za obnovu i razvoj - Croatian Bank for
Reconstruction and Development
Business description (CONTINUED)
Financial overview and business performance (continued)

21UniCredit Bank d.d. · Annual Report 2014
The data is clear.
Personalized support services make it clearer.
Clear-cut answers for the future.
The path to knowledge begins with understanding. Babel is an application that transforms data into useful and accurate information. With it, we can develop personalized products and services, just for you. Babel ensures that we will always meet your expectations and that we help you with important changes in your life. Because information is key to anticipating the future.

22 Annual Report 2014 · UniCredit Bank d.d.
In accordance to the Law on banks, Law on legal entities and the Bank’s Statute, managing bodies of the Bank are: General Assembly, Supervisory Board and Management Board.
General Assembly
The General Assembly is the Bank’s supreme managing body. The General Assembly consists of the Bank’s shareholders.
The General Assembly method of functioning and decision-making is regulated by the Rulebook on operating of the Bank’s General Assembly.
Audited financial statements will be submitted to the General Assembly for approval.
As of 31 December 2014, the Bank had 51 shareholders; the top shareholder was Zagrebačka banka d.d. Zagreb with 78.176 shares, which represented an equity stake of 65.6%.
Bank’s share capital is established at the level of KM 119,195,000 and it is divided into: 119,011 ordinary “A” class shares (with the face value of KM 1,000 per share) and 184 preference “D” class shares (with the face value of KM 1,000 per share).
An ordinary “A” class share gives its holder the right to have one vote at the General Meeting of Shareholders, the right to participate in the Bank’s management as provided by the Articles of Incorporation, the right to participate in the Bank’s profit in proportion to the face value of the share, as well as other rights foreseen by the Articles of Incorporation and the law.
A preferred “D” class share gives its holder the right of priority collection of dividend from the Bank’s profit in proportion to the face value of the share as well as the right of priority collection in case of the Bank’s bankruptcy or liquidation from the unallocated part of the bankruptcy/liquidation estate.
Supervisory Board
The Supervisory Board supervises the Bank’s operations and work of the Management Board, it shapes business policy, passes Bank’s general by-laws, issues business and other policies and procedures, and decides on the issues defined by the law, Articles of Incorporation and Bank’s other rules and regulations. The Supervisory Board consists of 7 members elected to a four-year term by shareholders at the General Assembly.
The Supervisory Board method of functioning and decision-making is regulated by the Rulebook on operating of the Bank’s Supervisory Board.
Management and Corporate governance
Members of the Bank Supervisory Board as of 31 December 2014 are:
1. Franjo Luković Chairman Zagrebačka banka d.d., Zagreb, Croatia
2. Sanja Rendulić Deputy Chairman Zagrebačka banka d.d., Zagreb, Croatia
3. Miljenko Živaljić Member Zagrebačka banka d.d., Zagreb, Croatia
4. Damir Krcivoj Member Zagrebačka banka d.d., Zagreb, Croatia
5. Marko Remenar Member Zagrebačka banka d.d., Zagreb, Croatia
6. Mario Agostini Member UniCredit Bank Austria AG, Vienna, Austria
7. Helmut Franz Haller Member UniCredit Bank Austria AG, Vienna, Austria
Management Board
The Management Board organises operations and governs the Bank’s business.
The Management Board is composed of the director (CEO) and executive directors, appointed by the Supervisory Board to a four-year term, with prior consent of the Banking Agency of the Federation of Bosnia and Herzegovina.
The CEO chairs the Board, manages the business, represents the Bank and bears responsibility for the Bank’s lawful operations.
The Management Board method of functioning and decision-making is regulated by the Rulebook on operating of the Bank’s Management Board.
As of 31 December 2014, the Bank Management Board comprise the following members:
1. Ivan Vlaho Director2. Edin Gajević Executive Director for Retail Banking
3. Igor Bilandžija Executive Director for Corporate and Investment Banking
4. Amina Mahmutović Executive Director for Risk Management5. Gordan Pehar Executive Director for Finance management / CFO6. Stefano Gison Executive Director for Support to banking bussines
Audit Committee
The Audit Committee supervises the work of the internal audit, including appointment of an external audit company which will carry out an audit of the annual financial statements. The Audit Committee has 5 members who are appointed by the Supervisory Board for a period of 4 years.
The Audit Committee method of functioning is regulated by the Rulebook on operating of the Bank’s Audit Committee.

23UniCredit Bank d.d. · Annual Report 2014
As of 31 December 2014, members of the Audit Committee are as follows:
1. Danimir Gulin President2. Marijana Brcko Member3. Hrvoje Matovina Member4. Christian Pieschel Member5. Angelika Glavanovits Member
Organisational structure of the Bank as of 31 December 2014 - key organisational units of the Bank:
General DirectorCEO
SHAREHOLDERS MEETING
SUPERVISORY BOARD
AUDIT COMMITTEE
INTERNAL AUDIT
LEGAL AFFAIRS
HUMAN RESOURCE MGMT PLANNING & CONTROLLING
CREDIT UNDERWRITING
COLLECTION, RESTRUCTURING AND WORKOUT MGMT
MARKET RISK
OPERATIONAL AND REPUTATIONAL RISK AND RISK INTEGRATION
CREDIT RISK MONITORING
CREDIT RISK CONTROLLING
ACCOUNTING & REPORTING
ALM
BANKING AND MACROECONOMICAL ANALYSES
MARKETING & COMMUNICATIONS
ANTI-MONEY LAUNDERING AND COUNTER-TERRORISM FINANCING
BANK SECRETARY
BOARD OFFICE
IT
CORPORATE PLANNING & CONTROLLING
FINANCE PRODUCTS
INTERNATIONAL DESK/CBCG
GTB SMALL BUSINESS SEGMENT RETAIL PLANNING & CONTROLLING
CLIENT RELATIONSHIP MGMT (CRM)
MULTICHANNEL
RETAIL PRODUCT MGMT
SEGMENT FOR PRIVATE INDIVIDUALS
REGIONS
OUTLETS
MARKETS AND FINANCING & ADVISORY
MID CORPORATE SEGMENT
LARGE CORPORATE SEGMENT
BUSINESS CENTRES
ORGANIZATION
OPERATION SUPPORT
FACILITY MGMT
COST MANAGEMENT
SECURITY
MANAGEMENT BOARD
CFO Executive Director
GBS Executive director
Division
Department
Unit/Regional Office/Business CentreSection/Branch Centre
CORPORATE AND INVESTMENT BANKING Executive director
RETAILExecutive director
CRO Executive directorCompliance
Application Fraud Manager
Data Quality Management

24 Annual Report 2014 · UniCredit Bank d.d.
Employees
At the end of 2014, the Bank employed 1,216 persons.
The Bank implemented a policy of continuous improvement and internal mobility of employees in order to adapt the requirements of the Bank and Group, to regulator and the current economic environment, new competition and technological innovations that affect operations of the Bank. Today’s challenging business environment and increased complexity requires a proactive approach and the dynamic organization of the Bank which puts employees in the fi rst place as well as taking care of their development and benefi ts. To this end, the Bank is continuously working to simplify and strengthen the process of performance management, as well as the development of consistent standards for all our employees.
We invest in the development programs in order to improve the professional skills of employees, as well as the quality and accountability of managers. We believe that diversity at all levels of our organization is essential to generate value for employees, customers, community and owners. Our diverse workforce allows us a better understanding of different cultures, business opportunities and customer needs. That is why we continue to invest in building a culture of inclusion through the promotion of gender equality and respect for age differences.
Management and Corporate governance (CONTINUED)
Rewarding employee performance
Support to Bank’s strategy is rewarding employees. Through a system of variable remuneration, the right for a variable award can be realised by every employee of the Bank, where the reward is realized depending on individual employee performance, the performance of the organizational unit and fi nally the performance of the Bank.
Within the system of remuneration and management systems operating performance entitled to remuneration, the results achieved in 2013, acquired the 1,138 employees.
Compensation System is continuously revised and updated and adjusted with applicable regulatory requirements that limit risk taking to a level that does not exceed a level acceptable to the Bank.
Top shareholders
As at 31 December 2014, the Bank had the following shareholder structure:
Shareholders % Participation of all owned shares Amount of equity KM 0001. Zagrebačka banka d.d., Zagreb, Croatia 65.59% 78,1762. UniCredit Bank Austria AG, Vienna, Austria 24.40% 29,0793. International Finance Corporation (IFC) 5.73% 6,8314. UniCredit S.p.A, Milano, Italy 3.27% 3,9005. Other shareholders 1.01% 1,209
TOTAL 100% 119,195
There were no changes in the shareholder structure compared to 31 December 2013.

25UniCredit Bank d.d. · Annual Report 2014
Pursuant to the Law on Accounting and Audit of Federation of Bosnia and Herzegovina (Offi cial Gazette No. 83/09), the Management Board is responsible for ensuring that fi nancial statements are prepared for each fi nancial period in accordance with International Financial Reporting Standards (“IFRS”) which give a true and fair view of the state of affairs and results of UniCredit Bank d.d. (the “Bank”) for that period. IFRS are published by the International Accounting Standards Board.
After making enquiries, the Management Board has a reasonable expectation that the Bank has adequate resources to continue in operational existence for the foreseeable future. For this reason, the Management Board continues to adopt the going concern basis in preparing the fi nancial statements.
In preparing those fi nancial statements, the responsibilities of the Management Board include ensuring that:
• suitable accounting policies are selected and then applied consistently;
• judgements and estimates are reasonable and prudent;
• applicable accounting standards are followed, subject to any material departures disclosed and explained in the financial statements; and
• the financial statements are prepared on the going concern basis unless it is inappropriate to presume that the Bank will continue in business.
The Management Board is responsible for keeping proper accounting records, which disclose with reasonable accuracy at any time the fi nancial position of the Bank and must also ensure that the fi nancial statements comply with the Accounting and Auditing Law in the Federation of Bosnia and Herzegovina. The Management Board is also responsible for safeguarding the assets of the Bank and hence for taking reasonable steps for the prevention and detection of fraud and other irregularities.
Signed on behalf of the Management Board
Director
Ivan Vlaho
Chief Financial Offi cer
Gordan Pehar
UniCredit Bank dd MostarKardinala Stepinca bb88000 MostarBosnia and Herzegovina
13 February 2015
Responsibility for the fi nancial statements
Chief Financial Offi cer

26 Annual Report 2014 · UniCredit Bank d.d.
To the shareholders of UniCredit Bank d.d. Mostar:
We have audited the accompanying fi nancial statements of UniCredit Bank d.d. Mostar (the “Bank”), which comprise of the statement of fi nancial position as at 31 December 2014, and the statement of profi t or loss and other comprehensive income, statement of changes in equity and statement of cash fl ows for the year then ended, and a summary of signifi cant accounting policies and other explanatory notes.
Management’s responsibility for the fi nancial statements
Management is responsible for the preparation and fair presentation of these fi nancial statements in accordance with the International Financial Reporting standards and for such internal control as Management determines is necessary to enable the preparation of fi nancial statements that are free from material misstatement, whether due to fraud or error.
Auditor’s responsibility
Our responsibility is to express an opinion on these fi nancial statements based on our audit. We conducted our audit in accordance with International Standards on Auditing. Those standards require that we comply with ethical requirements and plan and perform the audit to obtain reasonable assurance whether the fi nancial statements are free from material misstatement.
An audit involves performing procedures to obtain audit evidence about the amounts and disclosures in the fi nancial statements. The procedures selected depend on the auditor’s judgment, including the assessment of the risks of material misstatement of the fi nancial statements, whether due to fraud or error. In making those risk assessments, the auditor considers internal control relevant to the entity’s preparation and fair presentation of the fi nancial statements in order to design audit procedures that are appropriate in the circumstances, but not for the purpose of expressing an opinion on the effectiveness of the entity’s internal control. An audit also includes evaluating the appropriateness of accounting policies used and the reasonableness of accounting estimates made by management, as well as evaluating the overall presentation of the fi nancial statements.
We believe that the audit evidence we have obtained is suffi cient and appropriate to provide a basis for our audit opinion.
Opinion
In our opinion, the fi nancial statements present fairly, in all material respects, the fi nancial position of the Bank as at 31 December 2014 and of its fi nancial performance and cash fl ows for the year then ended, in accordance with International Financial Reporting Standards.
Deloitte d.o.o.
Sead Bahtanović, director and licensed auditor Sabina Softić, partner and licensed auditor
Sarajevo, Bosnia and Herzegovina
13 February 2015
Independent Auditors’ report

27UniCredit Bank d.d. · Annual Report 2014

28 Annual Report 2014 · UniCredit Bank d.d.
Notes 2014 2013Interest and similar income 6 179,825 180,671Interest expense and similar charges 7 (41,229) (40,737)
Net interest income 138,596 139,934
Fee and commission income 8 60,333 57,723Fee and commission expenses 9 (2,613) (2,519)
Net fee and commission income 57,720 55,204
Dividend income 9 9 Net gains from foreign exchange trading and translation of monetary assets and liabilities 10 9,292 9,518 Other income 11 1,288 1,130
Operating income 206,905 205,795
Depreciation and amortization 22,23 (10,142) (13,885)Operating expenses 12 (105,345) (106,594)
Profit before impairment losses and taxation 91,418 85,316
Impairment losses and provisions, net 13 (22,433) (22,310)
Profit before taxation 68,985 63,006
Income tax expense 14 (7,587) (7,435)
NET PROFIT 61,398 55,571
Other comprehensive income:Items that will be reclassified subsequently to profit and loss when specific conditions are met:
Net change in fair value of financial assets available-for-sale (152) (236)
TOTAL COMPREHENSIVE INCOME 61,246 55,335
Basic and diluted earnings per share (KM) 31 516.23 467.24
The accompanying notes form an integral part of these financial statements.
Statement of profit or loss and other comprehensive incomefor the year ended 31 December 2014(all amounts are expressed in thousands of KM, unless otherwise stated)

29UniCredit Bank d.d. · Annual Report 2014
Statement of financial positionas at 31 December 2014(all amounts are expressed in thousands of KM, unless otherwise stated)
Notes31 December
201431 December
2013
ASSETSCash and cash equivalents 15 471,476 423,265Obligatory reserve at the Central Bank of B&H 16 267,416 243,005Loans to and receivables from banks 17 330,456 507,470Financial assets available-for-sale 18 318,839 142,933Financial assets at fair value through profit or loss 19 18 56Loans and receivables from customers 20 2,478,823 2,311,743Other assets and receivables 21 31,033 33,427Property and equipment 22 52,254 53,271 Intangible assets 23 11,447 14,263
TOTAL ASSETS 3,961,762 3,729,433
LIABILITIESCurrent accounts and deposits from banks 24 95,517 144,388Current accounts and deposits from customers 25 2,961,200 2,724,269Financial liabilities at fair value through profit or loss 19 17 49Borrowings 26 158,316 179,832Subordinated debt 27 19,694 19,702Other liabilities 28 68,485 67,861Provisions for liabilities and charges 29 16,767 12,820Current tax liability 307 282Deferred tax liability 14 1,385 1,402
TOTAL LIABILITIES 3,321,688 3,150,605
EQUITYShare capital 30 119,195 119,195Treasury shares (81) (81)Share premium 48,317 48,317Revaluation reserve for investments (118) 34Regulatory reserves for credit losses 20,682 20,682Retained earnings 452,079 390,681
TOTAL EQUITY 640,074 578,828
TOTAL LIABILITIES AND EQUITY 3,961,762 3,729,433
The accompanying notes form an integral part of these financial statements.

30 Annual Report 2014 · UniCredit Bank d.d.
2014 2013
Cash flow from operating activities Interest receipts 177,826 181,037 Fee and commission receipts 60,308 57,757 Interest payments (38,578) (38,962)Fee and commission payments (2,655) (2,474)Operating expenses paid (92,965) (99,269)Net receipts from trading activities 9,290 9,512 Other receipts 1,288 1,129
Net cash inflow from operating activities before changes in operating assets and liabilities 114,514 108,730
(Increase) / decrease in operating assets:Obligatory reserve with Central Bank of B&H (24,457) (5,997)Loans to and receivables from banks 193,012 (3,432)Loans and receivables from customers (184,825) (50,129)Other assets 2,289 (18)
Net increase in operating assets, net (13,981) (59,576)
Increase / (decrease) in operating liabilities: Current accounts and deposits from banks (48,878) (8,322)Current accounts and deposits from customers 214,928 75,629 Other liabilities (11,658) (6,347)
Net increase in operating liabilities, net 154,392 60,960
Net cash inflow from operating activities before income tax paid 254,925 110,114
Income tax paid (7,562) (7,085)
Net cash from operating activities 247,363 103,029
Cash flow from investing activities Acquisition of property and equipment (2,957) (2,282)Proceeds from sale of property and equipment 211 497Acquisition of intangible assets (3,700) (2,749)Receipts on redemption of financial assets available-for-sale 77,041 54,197 Purchases of financial assets available-for-sale (249,734) (63,718)Dividend receipts 9 9
Net cash used in investing activities (179,130) (14,046)
Statement of cash flowsfor the year ended 31 December 2014(all amounts are expressed in thousands of KM, unless otherwise stated)

31UniCredit Bank d.d. · Annual Report 2014
2014 2013
Cash flows from financing activities Repayment of issued debt securities - (100,000)Proceeds from interest bearing borrowings 4,708 6,985 Repayment of interest bearing borrowings (25,961) (40,826)
Net cash used in financing activities (21,253) (133,841)
Net cash inflow / (outflow) 46,980 (44,858)
Effect of foreign exchange rate changes on cash and cash equivalents 1,231 (1,149)
Net increase/(decrease) in cash and cash equivalents 48,211 (46,007)
Cash and cash equivalents at the beginning of the year 423,265 469,272
Cash and cash equivalents at the end of the year 471,476 423,265
The accompanying notes form an integral part of these financial statements.

32 Annual Report 2014 · UniCredit Bank d.d.
Share capital
Treasury shares
Share premium
Revaluation reserve for
investments
Regulatory reserves for
credit lossesRetained earnings Total
Balance as at 1 January 2013 119,195 (81) 48,317 270 20,682 335,110 523,493
Net profit for the year - - - - - 55,571 55,571
Change in fair value of financial assets available-for-sale - - - (262) - - (262)Deferred tax on financial assets available-for-sale (Note 14) - - - 26 - - 26Other comprehensive income - - - (236) - - (236)
Total comprehensive income - - - (236) - 55,571 55,335
Balance as at 31 December 2013 119,195 (81) 48,317 34 20,682 390,681 578,828
Net profit for the year - - - - - 61,398 61,398
Change in fair value of financial assets available-for-sale - - - (162) - - (162)FX differences on financial assets available-for-sale - - - (7) - - (7)Deferred tax on financial assets available-for-sale (Note 14) - - - 17 - - 17Other comprehensive income - - - (152) - - (152)
Total comprehensive income - - - (152) - 61,398 61,246
Balance as at 31 December 2014 119,195 (81) 48,317 (118) 20,682 452,079 640,074
The accompanying notes form an integral part of these financial statements.
Statement of changes in equityfor the year ended 31 December 2014(all amounts are expressed in thousands of KM, unless otherwise stated)

33UniCredit Bank d.d. · Annual Report 2014
Notes to the financial statementsfor the year ended 31 December 2014
1. Reporting entity
UniCredit Bank d.d. (the “Bank”) is a joint stock company incorporated and domiciled in the Federation of Bosnia and Herzegovina. The registered office is at Kardinala Stepinca bb, Mostar. The Bank provides a full range of services including retail and corporate banking and treasury operations. The Bank is a member of Zagrebačka banka Group (Zagrebačka banka d.d., a bank domiciled in Zagreb, Republic of Croatia, is its immediate parent company) and UniCredit Group, and provides services in Bosnia and Herzegovina. The ultimate parent company is UniCredit Bank SpA., a bank domiciled in Milan, Italy.
2. Summary of significant accounting policies
2.1 Statement of compliance
These financial statements have been prepared in accordance with International Financial Reporting Standards (“IFRS”) as published by the International Accounting Standards Board.
2.2 Going concern
The financial statements have been prepared on the going concern basis, which assumes continuity of normal business activities and the realisation of assets and the settlement of liabilities in the ordinary course of business.
2.3 Basis of preparation
These financial statements have been prepared on a historical cost basis, except for financial assets and liabilities at fair value through profit or loss and debt securities available-for-sale which are stated at fair value.
Historical cost is generally based on the fair value of the consideration given in exchange for assets.
Fair value is the price that would be received to sell or paid to transfer a liability in an orderly transaction between market participants at the measurement date, regardless of whether that price is directly observable or estimated using another valuation technique. In estimating the fair value of an asset or a liability, the Bank takes into account the characteristics of the asset or liability which market participants would take into account when pricing the asset or liabilty at the measurement date. Fair value for measurement and/or disclosure purposes in these financial statements is determined on such basis, except for measurement that have some similiarities to fair value but are not fair value, such as net realisable value in IAS 2 or value in use in IAS 36.
In addition, for financial reporting purposes, fair value measurements are categorised into Level 1, 2 or 3 based on the degree to which the inputs to the fair value measurements are observable and the significance of the inputs to the fair value measurement in its entirety, which are described as follows:
• Level 1 inputs are quoted prices (unadjusted) in active markets for identical assets or liabilities that the Bank can access at the measurement date;
• Level 2 inputs are inputs, other than quoted prices included in Level 1, that are observable for the asset or liability, either directly or indirectly; and
• Level 3 inputs are unobservable inputs for the asset or liability.
(all amounts are expressed in thousands of KM, unless otherwise stated)

34 Annual Report 2014 · UniCredit Bank d.d.
Notes to the fi nancial statementsfor the year ended 31 December 2014 (CONTINUED)(all amounts are expressed in thousands of KM, unless otherwise stated)
2. Summary of signifi cant accounting policies (continued)
2.3 Basis of preparation (continued)
The fi nancial statements are presented in Convertible marks since that are the functional currency of the Company. The Convertible mark (KM) is offi cially tied to the Euro (EUR 1 = KM 1.95583).
The preparation of fi nancial statements in conformity with IFRS requires Management to make estimates and assumptions that effect the reported amounts of assets and liabilities and disclosure of contingent assets and liabilities at the date of the fi nancial statements and their reported amounts of revenues and expenses during the reporting period. Actual results could differ from those estimates.
The estimates and underlying assumptions are reviewed on an ongoing basis. Revisions to accounting estimates are recognized in the period in which the estimate is revised if the revision affects only that period or in the period of revision and future periods if the revision affects both current and future periods.
Information on amounts where signifi cant uncertainty exists in their estimate and critical judgments in applying accounting policies that have the most impact on the amounts disclosed in these fi nancial statements are disclosed in Note 4.
The accounting policies set out below have been applied consistently to all periods presented in these fi nancial statements.
2.4 Interest income and expense
Interest income and expense are recognized in profi t or loss as they accrue using the effective interest rate method. Effective interest rate is the rate that discounts estimated future cash fl ows (including all fees on points paid or received that form an integral part of the effective interest rate, transaction costs and other premiums or discounts) through the expected life of the fi nancial asset / liability, or, where appropriate, a shorter period.
2.5 Fee and commission income and expense
Fees and commissions that are an integral part of effective interest rates on fi nancial assets and fi nancial liabilities are included in interest income and interest expense.
Other fee and commission income includes fees which relate to credit card business, the issue of guarantees, letters of credit, domestic and foreign payments and other services, and are recognized in the statement of profi t or loss and comprehensive income upon performance of the relevant service.
Other fee and commission expense, mainly service and transaction fees, are recognized as an expense upon incurrence of services.

35UniCredit Bank d.d. · Annual Report 2014
2. Summary of significant accounting policies (continued)
2.6 Employee benefits
On behalf of its employees, the Bank pays personal income tax and contributions for pension, disability, health and unemployment insurance, on and from salaries, which are calculated as per the set legal rates during the course of the year on the gross salary. The Bank pays the tax and contributions in the favour of the institutions of the Federation of Bosnia and Herzegovina (on federal and cantonal level) and Republika Srpska.
In addition, transport allowances, meal allowances and vacation bonuses are paid in accordance with the local legislation. These expenses are recognized in the statement of profit or loss and comprehensive income in the period in which the salary expense is incurred.
2.6.1 Long-term employee awards
Participants for each cycle of the so-called “Long-term Incentive Plan” are defined based on criteria related to their contribution to the Bank’s long-term sustainable profitability. The estimated amount is recognized as personnel costs in profit or loss as earned by participants.
2.6.2 Other employee benefits
Liabilities based on other long-term employee benefits, such as jubilee awards and statutory termination benefits, are recorded at the net present value of the liability for defined benefits at the reporting date. The projected credit unit method is used for the calculation of the present value of the liability. The rate of average long-term borrowing of corporate clients is used as a discount rate in the absence of an active corporate debt securities market.
2.7 Foreign currency translation
Transactions in foreign currencies are translated into KM at the exchange rate prevailing at the date of the transaction. Monetary assets and liabilities denominated in foreign currencies are translated into KM at the reporting date at the foreign exchange rate ruling at that date. Foreign exchange differences arising on translation are recognized in profit or loss, except in the case of differences arising on non-monetary financial assets available-for-sale, which are recognized in other comprehensive income. Non-monetary assets and liabilities in foreign currency that are measured at historical cost are translated using the exchange rate at the date of the transaction and are not retranslated at the reporting date.
The Bank values its assets and liabilities by middle rate of Central Bank of Bosnia and Herzegovina (“CBBH“) valid at the reporting period date, which approximate market rates. The principal rates of exchange set forth by CBBH and used in the preparation of the Bank’s balance sheet at the reporting dates were as follows:
31 December 2014 EUR 1 = KM 1.95583 USD 1 = KM 1.608413
31 December 2013 EUR 1 = KM 1.95583 USD 1 = KM 1.419016
36 Annual Report 2014 · UniCredit Bank d.d.
Notes to the fi nancial statementsfor the year ended 31 December 2014 (CONTINUED)(all amounts are expressed in thousands of KM, unless otherwise stated)
2. Summary of signifi cant accounting policies (continued)
2.8 Cash and cash equivalents
For the purpose of preparation of the cash fl ow statement and statement of fi nancial position, cash and cash equivalents comprise cash in hand, items in the course of collection and current accounts.
Cash and cash equivalents excludes the compulsory minimum reserve with CBBH as these funds are not available for the Bank’s day to day operations. The compulsory minimum reserve with CBBH is a required reserve to be held by all commercial banks licensed in Bosnia and Herzegovina.
2.9 Financial instruments
Financial assets and fi nancial liabilities are recognized when the Bank becomes a party to the contractual provisions of the instrument.
Financial assets and fi nancial liabilities are initially measured at fair value increased for transaction costs that are directly attributable to the acquisition or issue except for fi nancial assets and fi nancial liabilities at fair value through profi t and loss. Transaction costs that are directly attributable to the acquisition or issue of fi nancial assets or fi nancial liabilities (other than fi nancial assets and fi nancial liabilities at fair value through profi t or loss) are added to or deducted from the fair value of the fi nancial assets or fi nancial liabilities, as appropriate, on initial recognition. Transaction costs directly attributable to the acquisition of fi nancial assets and fi nancial liabilities at fair value through profi t or loss are recognized immediately in profi t or loss.
2.9.1 Financial assets – classifi cation and valuation
Financial assets are recognized and derecognized on a trade date where the purchase or sale of an investment is under a contract whose terms require delivery of the fi nancial asset within the timeframe established by the market concerned.
Financial assets are classifi ed into the following specifi ed categories: fi nancial assets as ‘at fair value through profi t or loss’ (FVTPL), ‘held-to-maturity investments’, ‘available-for-sale’ (AFS), and ‘loans and receivables’.
The classifi cation depends on the nature and purpose of the fi nancial assets and is determined at the time of initial recognition. Currently, the Bank has no held-to-maturity investments.
a) Method of effective interest rate
The effective interest method is a method of calculating the amortized cost of a fi nancial asset and of allocating interest income over the relevant period. The effective interest rate is the rate that exactly discounts estimated future cash receipts (including all fees on points paid or received that form an integral part of the effective interest rate, transaction costs and other premiums or discounts) through the expected life of the fi nancial asset, or, where appropriate, a shorter period.
Income is recognized on an effective interest basis for fi nancial instruments: ‘available-for-sale’ and ‘loans and receivables’.
37UniCredit Bank d.d. · Annual Report 2014
2. Summary of significant accounting policies (continued)
2.9 Financial instruments (continued)
2.9.1 Financial assets – classification and valuation (continued)
b) Financial assets at fair value through profit or loss (“FVTPL”)
Financial assets are classified as at FVTPL when the financial asset is either held for trading, when it is acquired or incurred principally for the purpose of selling or repurchasing it in the near term, for the purpose of short-term profit taking, or designated as at FVTPL by Management at initial recognition.
A financial asset is classified as held for trading if:
• it has been acquired principally for the purpose of selling it in the near term; or
• on initial recognition it is part of a portfolio of identified financial instruments that the Group manages together and has a recent actual pattern of short-term profit-taking; or
• it is a derivative that is not designated and effective as a hedging instrument.
A financial asset other than a financial asset held for trading may be designated as at FVTPL upon initial recognition if:
• eliminates or significantly reduces a measurement or recognition inconsistency that would otherwise arise; or
• the financial asset forms part of a group of financial assets or financial liabilities or both, which is managed and its performance is evaluated on a fair value basis, in accordance with the Group’s documented risk management or investment strategy, and information about the grouping is provided internally on that basis; or
• it forms part of a contract containing one or more embedded derivatives, and IAS 39 Financial Instruments: Recognition and Measurement permits the entire combined contract (asset or liability) to be designated.
Financial assets at FVTPL are stated at fair value, with any gains or losses arising on remeasurement recognised in profit or loss. The net gain or loss recognised in profit or loss incorporates any dividend or interest earned on the financial asset. Fair value is determined in the manner described in Note 36.
c) Financial assets available-for-sale (“AFS”)
Financial assets available-for-sale are non-derivatives that are either designated in this category or not classified in any of the other categories. Financial assets classified as available-for-sale are intended to be held for an indefinite period of time, but may be sold in response to needs for liquidity or changes in interest rates, foreign exchange rates, or equity prices. Financial assets available-for-sale include debt and equity securities.

38 Annual Report 2014 · UniCredit Bank d.d.
Notes to the fi nancial statementsfor the year ended 31 December 2014 (CONTINUED)(all amounts are expressed in thousands of KM, unless otherwise stated)
2. Summary of signifi cant accounting policies (continued)
2.9 Financial instruments (continued)
2.9.1 Financial assets – classifi cation and valuation (continued)
c) Financial assets available-for-sale (“AFS”) (continued)
Financial assets available-for-sale are measured initially at fair value plus transaction costs that are directly attributable to the acquisition or issue of the fi nancial asset. Subsequent to initial recognition available-for-sale fi nancial assets are measured at fair value, except for equity securities that do not have a quoted market price in an active market and whose fair value cannot be reliably measured, which are stated at cost, less impairment. Fair value is determined in the manner described in Note 36.
Gains and losses arising from changes in fair value are recognized directly in equity in the revaluation reserve for securities with the exception of impairment losses, interest calculated using the effective interest rate method and foreign exchange gains and losses on monetary assets, which are recognized directly in profi t or loss. Where the investment is disposed of or is determined to be impaired, the cumulative gain or loss previously recognized in the investments revaluation reserve is included in profi t or loss for the period.
Dividends on fi nancial assets available-for-sale are recognized in profi t or loss when the Bank’s right to receive payments is established.
The fair value of fi nancial assets available-for-sale denominated in a foreign currency is determined in that foreign currency and translated at the spot rate at the reporting period date. The change in fair value attributable to translation differences that result from a change in amortized cost of the asset is recognized in profi t or loss, and other changes are recognized in equity.
d) Loans and receivables
Loans and other receivables that have fi xed or determinable payments that are not quoted in an active market are classifi ed as loans and receivables. Loans and receivable arise when the Bank provides money directly to a debtor with no intention of trading with the receivable or disposal in the near future.
Loans and receivables are initially recognized at fair value plus incremental costs. After initial recognition, loans and receivables are measured at amortised cost using the effective interest rate method, less any impairment. Interest income is recognized by applying the effective interest rate, except for short-term receivables when the recognition of interest would be immaterial.
Loans and receivables include loans to and receivables from banks, loans and receivables from customers, cash and cash equivalents, and obligatory reserves with CBBH.

39UniCredit Bank d.d. · Annual Report 2014
2. Summary of significant accounting policies (continued)
2.9 Financial instruments (continued)
2.9.2 Impairment of financial assets
a) Financial assets carried at amortised cost
The Bank assesses at each reporting date whether there is objective evidence that a financial asset or group of financial assets is impaired. A financial asset or a group of financial assets is impaired and impairment losses are incurred if there is objective evidence of impairment as a result of one or more events that occurred after the initial recognition of the asset (a “loss event”) and that loss event (or events) has an impact on the estimated future cash flows of the financial asset or group of financial assets that can be reliably estimated.
Objective evidence that a financial asset or group of assets is impaired (also for available-for-sale financial assets and financial assets measured at cost) includes:
• significant financial difficulty of the borrower;
• a breach of contract, such as a default or delinquency in interest or principal payments;
• the Bank granting to the borrower, for economic or legal reasons relating to the borrower’s financial difficulty, a concession that it would not otherwise consider;
• it becoming probable that the borrower will enter bankruptcy or other financial reorganisation;
• the disappearance of an active market for the financial asset because of financial difficulties;
• available data indicating that there is a measurable decrease in the estimated future cash flows from a group of financial assets since the initial recognition of those assets, although the decrease cannot yet be identified for the individual financial assets in the group.
Individually significant financial assets are tested for impairment on an individual basis. The remaining financial assets are assessed collectively. Those individually significant assets which are not identified as impaired are subsequently included in the basis for collective impairment assessment. For the purposes of a collective evaluation of impairment, financial assets are grouped on the basis of similar credit risk characteristics.
For the purposes of a collective evaluation of impairment for incurred but not reported losses (IBNR) and specific provisions calculated on a collective basis the Bank uses statistical models and historical data on the probability of occurrence that cause impairment, the time required to recover and total loss incurred, adjusted for management’s judgment as to whether the current economic and credit conditions are such that it is likely that the actual losses will be higher or lower of those calculated by historical modelling.
The Bank regularly reviews the loss rate and the expected rate of recovery at each reporting date, to ensure accurate reporting.
Impairment loss for financial assets measured at amortised cost is calculated as the difference between the carrying amount of the assets and the present value of expected future cash flows discounted at the original effective interest rate of financial assets.

40 Annual Report 2014 · UniCredit Bank d.d.
Notes to the fi nancial statementsfor the year ended 31 December 2014 (CONTINUED)(all amounts are expressed in thousands of KM, unless otherwise stated)
2. Summary of signifi cant accounting policies (continued)
2.9 Financial instruments (continued)
2.9.2 Impairment of fi nancial assets (continued)
a) Financial assets carried at amortised cost (continued)
The carrying value of the asset is reduced through an allowance account and the amount of loss is recognized through profi t or loss. If loan and receivable have a variable interest rate, the discount rate for determining the impairment loss is the current effective interest rate.
If in a subsequent period, the amount of the impairment loss decreases and the decrease can be related objectively to an event occurring after the impairment was recognized (such as an improvement in the debtor’s credit worthiness), the previously recognized impairment loss is reversed by adjusting the allowance account. The amount of the reversal is recognized in profi t or loss.
When a loan is uncollectible, it is written off against the related impairment allowance account. Such loans are written off after all the necessary procedures have been completed and the amount of the loss has been determined. Subsequent recoveries of amounts previously written off are recognized as a reversal of impairment losses in profi t or loss.
b) Financial assets available-for-sale
In the case of fi nancial assets available-for-sale, a signifi cant or prolonged decline in the fair value of the investment below its acquisition cost is additionally considered in determining whether the assets are impaired.
If any such evidence exists for fi nancial assets available-for-sale, the cumulative loss, measured as the difference between the acquisition cost and the current fair value, less any impairment loss on that fi nancial asset previously recognized in profi t or loss, is removed from other comprehensive income and recognized in profi t or loss.
If, in a subsequent period, the fair value of a debt instrument classifi ed as available-for-sale increases and the increase can be objectively related to an event occurring after the impairment loss was recognized in profi t or loss, the impairment loss is reversed through profi t or loss. However, any subsequent recovery in the fair value of an impaired available-for-sale equity security is subsequently recognized in other comprehensive income until derecognition of that asset.
Exceptions from above are equity securities classifi ed as available-for-sale for which there is no reliable measure of fair value. The Bank assesses at each reporting date whether there is objective evidence that a fi nancial asset or such group of fi nancial assets is impaired. An impairment loss is calculated as the difference between the carrying amount of the fi nancial asset and the present value of expected future cash fl ows discounted by the required market return for similar fi nancial assets. Impairment losses on such instruments, recognised in profi t or loss, are not subsequently reversed through profi t or loss.

41UniCredit Bank d.d. · Annual Report 2014
2. Summary of significant accounting policies (continued)
2.9 Financial instruments (continued)
2.9.3 Derecognition of financial assets
Bank derecognizes a financial asset only when the contractual rights to the cash flows from the asset expire; or it transfers the financial asset and substantially all the risks and rewards of ownership of the asset to another entity.
If the Bank neither transfers nor retains substantially all the risks and rewards of ownership and continues to control the transferred asset, the Bank continues to recognize the financial asset.
On derecognition of a financial asset the difference between the carrying amount of the asset, and the sum of the consideration received and any cumulative gain or loss that had been recognized in other comprehensive income is recognized in profit or loss.
2.9.4 Financial liabilities and equity instruments issued by the Bank
a) Classification
Debt and equity instruments are classified as either financial liabilities or as equity in accordance with the substance of the contractual arrangement.
Equity instruments
An equity instrument is any contract that evidences a residual interest in the assets of an entity after deducting all of its liabilities. Equity instruments issued by the Bank are recorded at the proceeds received, net of direct issue costs.

42 Annual Report 2014 · UniCredit Bank d.d.
Notes to the fi nancial statementsfor the year ended 31 December 2014 (CONTINUED)(all amounts are expressed in thousands of KM, unless otherwise stated)
2. Summary of signifi cant accounting policies (continued)
2.9 Financial instruments (continued)
2.9.4 Financial liabilities and equity instruments issued by the Bank (continued)
a) Classifi cation (continued)
Financial guarantee contract liabilities
Financial guarantee contract liabilities are measured initially at their fair values and are subsequently measured at the higher of:
• the amount of the obligation under the contract, as determined in accordance with IAS 37: “Provisions, Contingent Liabilities and Contingent Assets”; or
• the amount initially recognized less, where appropriate, cumulative amortization recognized in accordance with the revenue recognition policies set out at above.
Financial liabilities
Financial liabilities are classifi ed as either fi nancial liabilities ‘at FVTPL’ or ‘other fi nancial liabilities’.
Financial liabilities at fair value through profi t or loss (“FVTPL”)
Financial liabilities are classifi ed as at FVTPL when the fi nancial liability is either held for trading or it is designated as at FVTPL.
A fi nancial liability is classifi ed as held for trading if:
• it has been acquired principally for the purpose of repurchasing it in the near term; or
• on initial recognition it is part of a portfolio of identified financial instruments that the Group manages together and has a recent actual pattern of short-term profit-taking; or
• it is a derivative that is not designated and effective as a hedging instrument.
A fi nancial liability other than a fi nancial liability held for trading may be designated as at FVTPL upon initial recognition if:
• such designation eliminates or significantly reduces a measurement or recognition inconsistency that would otherwise arise; or
• the financial liability forms part of a group of financial assets or financial liabilities or both, which is managed and its performance is evaluated on a fair value basis, in accordance with the Group’s documented risk management or investment strategy, and information about the grouping is provided internally on that basis; or
• it forms part of a contract containing one or more embedded derivatives, and IAS 39 Financial Instruments: Recognition and Measurement permits the entire combined contract (asset or liability) to be designated as at FVTPL.
Financial liabilities at FVTPL are stated at fair value, with any gains or losses arising on remeasurement recognised in profi t or loss. The net gain or loss recognised in profi t or loss incorporates any interest paid on the fi nancial liability. Fair value is determined in the manner described in Note 36.

43UniCredit Bank d.d. · Annual Report 2014
2. Summary of significant accounting policies (continued)
2.9 Financial instruments (continued)
2.9.4 Financial liabilities and equity instruments issued by the Bank (continued)
a) Classification (continued)
Financial liabilities (continued)
Other financial liabilities
Other financial liabilities, including current and deposit account, issued debt securities, subordinated debt and borrowings, are initially measured at fair value, net of transaction costs.
Other financial liabilities are subsequently measured at amortised cost using the effective interest method.
The effective interest method is a method of calculating the amortised cost of a financial liability and of allocating interest expense over the relevant period. The effective interest rate is the rate that exactly discounts estimated future cash payments through the expected life of the financial liability, or, where appropriate, a shorter period.
b) Derecognition of financial liabilities
The Bank derecognizes financial liabilities when, and only when, the Bank’s obligations are discharged, cancelled or they expire.
2.9.5 Offsetting
Financial assets and liabilities are offset and the net amount presented in the statement of financial position when, and only when, the Bank has a legal right to set off the amounts and it tends either to settle them on a net basis or to realise the asset and settle the liability simultaneously.
Income and expenses are presented on a net basis only when permitted under IFRS, or for gains and losses arising from a group of similar transactions such as in the Group’s trading activity.
2.9.6 Derivative financial instruments
The Bank uses derivative financial instruments to hedge economically its exposure to foreign exchange risk arising from operating, financing and investing activities. The Bank does not hold or issue derivative financial instruments for speculative trading purposes. All derivatives are classified as financial instruments held for trading.
Derivative financial instruments including foreign exchange forward contracts and foreign exchange swap contracts that are initially recognized at trade date and subsequently measured at their fair value in the statement of financial position. Fair values are obtained from discounted cash flow models.
All derivatives are classified as financial assets at fair value through profit or loss when their fair value is positive and as financial liabilities at fair value through profit or loss when it is negative.

44 Annual Report 2014 · UniCredit Bank d.d.
Notes to the fi nancial statementsfor the year ended 31 December 2014 (CONTINUED)(all amounts are expressed in thousands of KM, unless otherwise stated)
2. Summary of signifi cant accounting policies (continued)
2.10 Property and equipment
Property and equipment are stated at historical cost less accumulated depreciation and impairment losses. Cost includes all expenditure that is directly attributable to the acquisition of the items.
Subsequent cost is included in the asset’s carrying amount or is recognized as a separate asset as appropriate, only when it is probable that future economic benefi ts associated with the item will fl ow to the Bank and the cost of the item can be measured reliably.
All other repairs and maintenance are charged to profi t or loss during the period in which they are incurred.
Depreciation is provided on all property and equipment except for land and assets not yet brought into use on a straight-line basis at prescribed rates designed to write off the cost to estimated residual value over the estimated useful life of the asset. The estimated useful lives are as follows:
Buildings 2%Computers 20% - 25%Leasehold improvement Over the renting periodOther equipment 10%-20%
Amortisation methods, the useful lives and residual values of property and equipment are reviewed, and adjusted if appropriate, at each reporting date.
Gains and losses on disposals are determined by comparing proceeds with the carrying amount, and are included in profi t or loss as other income or operating expense.
2.11 Intangible assets
Intangible assets are stated at cost less accumulated amortisation and impairment losses. The cost includes all expenditure that is directly attributable to the acquisition of the items.
Intangible assets except for intangible assets not yet brought into use are amortised on a straight-line basis over their estimated useful lives as follows:
Software 20%Other intangible assets 20%

45UniCredit Bank d.d. · Annual Report 2014
2. Summary of significant accounting policies (continued)
2.12 Taxation
The income tax charge is based on taxable profit for the year and comprises current and deferred tax. Income tax is recognised in profit or loss except to the extent that it relates to items recognised directly in other comprehensive income, in which case it is recognised in other comprehensive income.
2.12.1 Current income tax
Current tax is the expected tax payable on the taxable income for the year, using the tax rates enacted or substantially enacted at the reporting date, and any adjustments to tax payable in respect of previous years.
2.12.2 Deferred income tax
Deferred income taxes are recognised reflecting the tax effects of temporary differences between the carrying amounts of assets and liabilities for financial reporting purposes and the amounts used for income tax purposes. Deferred tax is not recognised for temporary differences on the initial recognition of assets or liabilities in a transaction that is not a business combination and that affects neither accounting nor taxable profit nor loss. Deferred tax assets and liabilities are measured by using the tax rates expected to apply to taxable profit in the years in which those temporary differences are expected to be recovered or settled based on tax rates enacted or substantially enacted at the reporting date.
The measurement of deferred tax liabilities and deferred tax assets reflects the tax consequences that would follow from the manner in which the enterprise expects, at the reporting date, to recover or settle the carrying amount of its assets and liabilities.
Deferred tax assets and liabilities are offset if there is a legally enforceable right to offset current tax liabilities and assets, and they relate to taxes levied by the same tax authority.
Deferred tax assets and liabilities are not discounted and are classified as a non-current asset/liability in the statement of financial position.
Deferred tax assets are recognised only to the extent that it is probable that sufficient taxable profits will be available against which the deferred tax assets can be utilised. At each reporting date, the Bank reassesses unrecognised potential deferred tax assets and the carrying amount of recognised deferred tax assets, which are reduced to the extent at which it is no longer probable that tax benefits can be used.
2.13 Impairment of non-financial assets
Non-financial assets (other than deferred tax assets) are tested for impairment and their recoverable amount estimated whenever there is indication that the carrying amount may not be recoverable. An impairment loss is recognized in profit or loss whenever the carrying amount of an asset exceeds its recoverable amount.
46 Annual Report 2014 · UniCredit Bank d.d.
Notes to the fi nancial statementsfor the year ended 31 December 2014 (CONTINUED)(all amounts are expressed in thousands of KM, unless otherwise stated)
2. Summary of signifi cant accounting policies (continued)
2.13 Impairment of non-fi nancial assets (continued)
For impairment testing, assets are grouped together into the smallest group of assets that generates cash infl ows from continuing use that are largely independent of the cash infl ows of other assets or cash-generating units.
The recoverable amount of individual assets or cash-generating units is the higher of the asset’s fair value less costs to sell and value in use. In assessing value in use, the estimated future cash fl ows are discounted to their present value using a pre-tax discount rate that refl ects current market assessments of the time value of money and the risks specifi c to the asset or cash-generating unit. The recoverable amount of assets that do not generate independent cash fl ows (e.g. corporate assets) is determined by assessing cash fl ows of the group to which the asset belongs.
An impairment loss is reversed if there has been a change in the estimates used to determine the recoverable amount. An impairment loss is reversed only to the extent that the asset’s carrying amount does not exceed the carrying amount that would have been determined, net of depreciation or amortisation, as if no impairment loss had been recognized.
2.14 Provisions
Provisions are recognized when the Bank has a present obligation (legal or constructive) as a result of a past event, it is probable that the Bank will be required to settle the obligation, and a reliable estimate can be made of the amount of the obligation.
The amount recognized as a provision is the best estimate of the consideration required to settle the present obligation at the reporting period date, taking into account the risks and uncertainties surrounding the obligation. Where a provision is measured using the cash fl ows estimated to settle the present obligation, its carrying amount is the present value of those cash fl ows. Provisions are released only for such expenditure in respect of which provisions are recognized at inception. If the outfl ow of economic benefi ts to settle the obligations is no longer probable, the provision is reversed.
2.15 Equity and reserves
2.15.1 Share capital
Share capital represents the nominal value of paid-in ordinary and preference shares and is denominated in KM.
2.15.2 Treasury shares
When the Bank purchases its own equity instruments (treasury shares), the consideration paid is deducted from equity until the shares are cancelled. When such shares are subsequently sold or reissued, any consideration received, net of transaction costs, is included in issued share capital.
47UniCredit Bank d.d. · Annual Report 2014
2. Summary of significant accounting policies (continued)
2.15 Equity and reserves (continued)
2.15.3 Regulatory reserves for credit losses
Regulatory reserves for credit losses are recognized in accordance with regulations of the Banking Agency of Federation of Bosnia and Herzegovina. Regulatory reserves for credit losses are non-distributable.
2.15.4 Retained earnings
Profit for the period after appropriations to owners and allocations to other reserves are transferred to retained earnings.
2.15.5 Revaluation reserve for securities
Revaluation reserve for securities comprises changes in fair value of financial assets available-for-sale, net of deferred tax.
2.15.6 Dividends
Dividends on ordinary shares are recognized as a liability in the period in which they are approved by the Bank’s shareholders.
2.16 Off-balance-sheet commitments and contingent liabilities
In the ordinary course of business, the Bank enters into credit related commitments which are recorded off balance sheet and primarily comprise guarantees, letters of credit, undrawn loan commitments and credit card limits.
2.17 Managed funds for and on behalf of third parties
The Bank manages funds for and on behalf of corporate and retail customers. These amounts do not represent the Bank’s assets and are excluded from the statement of financial position. For the services rendered the Bank charges a fee.
2.18 Segment reporting
A business segment is a distinguishable component of the Bank that is engaged in business activities, which may result in revenue or expenses. The Bank has identified four primary business segments: Retail, Corporate and Investing Banking, Assets and Liabilities Management, and Central Unit.
Segmental results are measured inclusive of the application of internal transfer prices, based on specific prices, appropriate currencies and maturities, with embedded additional adjustments.
Segmental business result are regularly monitored by the Management and Supervisory Board, based on management financial information.

48 Annual Report 2014 · UniCredit Bank d.d.
Notes to the fi nancial statementsfor the year ended 31 December 2014 (CONTINUED)(all amounts are expressed in thousands of KM, unless otherwise stated)
2. Summary of signifi cant accounting policies (continued)
2.19 Earnings per share
The Bank publishes basic and diluted earnings per share (EPS) data. Basic EPS is calculated by dividing the profi t or loss attributable to ordinary shareholders of the Bank by the weighted average number of ordinary shares outstanding during the period. During 2013 and 2014 there were no dilution effects.
2.20 Borrowing costs
Borrowing costs directly attributable to the acquisition or construction of qualifying assets, which are assets that necessarily take a substantial period of time to get ready for their intended use or sale, are added to the cost of those assets, until such time as the assets are substantially ready for their intended use or sale.
Investment income earned on the temporary investment of specifi c borrowings pending their expenditure on qualifying assets is deducted from the borrowing costs eligible for capitalisation.
All other borrowing costs are recognised in the income statement in the period in which they are incurred.
During 2013 and 2014, there were neither qualifying assets nor capitalized borrowing costs.
2.21 Assets acquired in lieu of uncollectible receivables
The Bank assesses the marketability of assets acquired in lieu of uncollectible receivables and only marketable assets, the value of which can be measured reliably, are recognized as assets in the statement of fi nancial position. The Bank’s intention is mainly to sell such assets, in which case they are classifi ed as inventory, and not amortised. However, in certain limited cases they may end up being used by the Bank and amortised within buildings, which are part of property and equipment.
3. Adoption of new and revised standards
3.1 Standards and Interpretations effective in current period
The following standards, amendments to the existing standards and interpretations issued by the International Accounting Standards Board are effective for the current period:
•Amendments to IFRS 10: “Consolidated Financial Statements”, IFRS 12: “Disclosures of Interests in Other Entities” and IAS 27: “Separate Financial Statements” - Investment Entities (effective for annual periods beginning on or after 1 January 2014);
•Amendments to IAS 32: “Financial instruments: presentation” - Offsetting Financial Assets and Financial Liabilities (effective for annual periods beginning on or after 1 January 2014):
•Amendments to IAS 36: “Impairment of assets” - Recoverable Amount Disclosures for Non-Financial Assets (effective for annual periods beginning on or after 1 January 2014):
•Amendments to IAS 39: “Financial Instruments: Recognition and Measurement” - Novation of Derivatives and Continuation of Hedge Accounting (effective for annual periods beginning on or after 1 January 2014);
• IFRIC 21: “Levies” (effective for annual periods beginning on or after 1 January 2014).

49UniCredit Bank d.d. · Annual Report 2014
3. Adoption of new and revised standards (continued)
3.1 Standards and Interpretations effective in current period (continued)
The adoption of these standards, amendments and interpretations has not led to any changes in the Company’s accounting policies.Company’s accounting policies.
3.2 Standards and Interpretations in issue not yet adopted
At the date of authorization of these financial statements the following standards, revisions and interpretations were in issue but not yet effective:
• IFRS 9: “Financial Instruments” (effective for annual periods beginning on or after 1 January 2018),
• IFRS 14: “Regulatory Deferral Accounts” (effective for annual periods beginning on or after 1 January 2016),
• IFRS 15: “Revenue from Contracts with Customers” (effective for annual periods beginning on or after 1 January 2017),
• Amendments to IFRS 10: “Consolidated Financial Statements” and IAS 28: “Investments in Associates and Joint Ventures” - Sale or Contribution of Assets between an Investor and its Associate or Joint Venture (effective for annual periods beginning on or after 1 January 2016),
• Amendments to IFRS 10: “Consolidated Financial Statements”, IFRS 12: “Disclosure of Interests in Other Entities” and IAS 28: “Investments in Associates and Joint Ventures” - Investment Entities: Applying the Consolidation Exception (effective for annual periods beginning on or after 1 January 2016),
• Amendments to IFRS 11: “Joint Arrangements” – Accounting for Acquisitions of Interests in Joint Operations (effective for annual periods beginning on or after 1 January 2016),
• Amendments to IAS 1: “Presentation of Financial Statements” - Disclosure Initiative (effective for annual periods beginning on or after 1 January 2016),
• Amendments to IAS 16: “Property, Plant and Equipment” and IAS 38: “Intangible Assets” - Clarification of Acceptable Methods of Depreciation and Amortisation (effective for annual periods beginning on or after 1 January 2016),
• Amendments to IAS 16: “Property, Plant and Equipment” and IAS 41: “Agriculture” - Agriculture: Bearer Plants (effective for annual periods beginning on or after 1 January 2016),
• Amendments to IAS 19: “Employee Benefits” - Defined Benefit Plans: Employee Contributions (effective for annual periods beginning on or after 1 July 2014),
• Amendments to IAS 27: “Separate Financial Statements” - Equity Method in Separate Financial Statements (effective for annual periods beginning on or after 1 January 2016);
• Amendments to various standards “Improvements to IFRSs (cycle 2010-2012)” resulting from the annual improvement project of IFRS (IFRS 2, IFRS 3, IFRS 8, IFRS 13, IAS 16, IAS 24 and IAS 38) primarily with a view to removing inconsistencies and clarifying wording (amendments are to be applied for annual periods beginning on or after 1 July 2014),
• Amendments to various standards “Improvements to IFRSs (cycle 2011-2013)” resulting from the annual improvement project of IFRS (IFRS 1, IFRS 3, IFRS 13 and IAS 40) primarily with a view to removing inconsistencies and clarifying wording (amendments are to be applied for annual periods beginning on or after 1 July 2014),
•Amendments to various standards “Improvements to IFRSs (cycle 2012-2014)” resulting from the annual improvement project of IFRS (IFRS 5, IFRS 7, IAS 19 and IAS 34) primarily with a view to removing inconsistencies and clarifying wording (amendments are to be applied for annual periods beginning on or after 1 January 2016).
The Bank has elected not to adopt these standards, revisions and interpretations in advance of their effective dates. The Bank anticipates that the adoption of these standards, revisions and interpretations will have no material impact on the financial statements of the Bank in the period of initial application, except for IFRS 9. Management is currently analysing the impact of IFRS 9 on the Bank’s financial statements.

50 Annual Report 2014 · UniCredit Bank d.d.
Notes to the fi nancial statementsfor the year ended 31 December 2014 (CONTINUED)(all amounts are expressed in thousands of KM, unless otherwise stated)
4. Critical accounting judgments and key sources of estimation uncertainty
In the application of the Bank’s accounting policies, which are described in Note 2, the Management is required to make judgements, estimates and assumptions about the carrying amounts of assets and liabilities that are not readily apparent from other sources. The estimates and associated assumptions are based on historical experience and other factors that are considered to be relevant. Actual results may differ from these estimates. Signifi cant estimates of the Management Board as of 31 December 2014 and 2013 in these fi nancial statements are presented below.
The estimates and underlying assumptions are reviewed on an on-going basis. Revisions to accounting estimates are recognized in the period in which the estimate is revised if the revision affects only that period or in the period of the revision and future periods if the revision affects both current and future periods.
4.1 Key sources of estimation uncertainty
The following are the key assumptions concerning the future, and other key sources of estimation uncertainty at the reporting period date, that have a signifi cant risk of causing a material adjustment to the carrying amounts of assets and liabilities within the next fi nancial year.
4.1.1 Useful lives of property and equipment
As described in Note 2.10 above, the Bank reviews the estimated useful lives of property and equipment at the end of each annual reporting period.

51UniCredit Bank d.d. · Annual Report 2014
4. Critical accounting judgments and key sources of estimation uncertainty (continued)
4.1.2 Impairment losses on loans and receivables
As described in Note 2.9.2 above, at each reporting period date, the Bank assessed indicators for impairment of loans and receivables and their impact on the estimated future cash flows from the loans and receivables.
a) Impairment losses on loans and receivables and provisions for off-balance-sheet exposure
The Bank monitors the creditworthiness of its customers on an ongoing basis. The need for impairment of the Bank’s on - and off-balance-sheet credit risk exposures is assessed on a monthly basis. Impairment losses are made mainly against the carrying value of loans to corporate and retail customers (summarised in Note 20), and as provisions for liabilities and charges arising from off-balance-sheet risk exposure to customers, mainly in the form of unused loan facilities, guarantees and letters of credit (summarised in Note 32). Impairment losses are also considered for credit risk exposures to banks and for other assets not carried at fair value, where the primary risk of impairment is not credit risk.
Note
2014 2013
KM ‘000 KM ‘000
Allowances for impairment losses on credit risk exposure Allowances for impairment losses on loans and receivables from customers 20 295,932 282,681Provisions for off-balance-sheet items 29 11,338 7,975Allowances for impairment losses on loans to and receivables from banks 17 124 124
Total 307,394 290,780
Financial assets carried at amortised cost
The Bank first assesses whether objective evidence of impairment exists individually for assets that are individually significant (mainly corporate exposures and retail exposures over KM 150 thousand) and collectively for assets that are not individually significant (mainly retail exposures under KM 150 thousand). However, assets assessed individually as unimpaired are then included in groups of assets with similar credit risk characteristics and then assessed collectively for impairment.
In assessing collective impairment the following guidelines are used:
• future cash flows of a homogeneous segment/product group are estimated based on historical losses for assets with similar credit risk characteristics;
• information on historical loss rates are applied consistently to defined homogeneous segments/groups;
• historical losses are adjusted in line with current data which can be used consistently with the current conditions;
• the methodology and assumptions used to estimate future cash flows are regularly revised, and updated as necessary.
As explained further below, the Bank calculates provisions under FBA rules, as well as estimating impairment allowances under IFRS. The provisions calculated under FBA rules are not recognized by the Bank but form the basis for capital adequacy calculations, and in previous periods, formed the basis for transfers to non-distributable reserves within equity.

52 Annual Report 2014 · UniCredit Bank d.d.
Notes to the fi nancial statementsfor the year ended 31 December 2014 (CONTINUED)(all amounts are expressed in thousands of KM, unless otherwise stated)
4. Critical accounting judgments and key sources of estimation uncertainty (continued)
4.1 Key sources of estimation uncertainty (continued)
4.1.2 Impairment losses on loans and receivables (continued)
a) Impairment losses on loans and receivables and provisions for off-balance-sheet exposure (continued)
Non-performing portfolio - calculation in accordance with IFRS
At the year end, the gross value of impaired loans and receivables, and the rate of recognized impairment loss, calculated according to IFRS, were as follows:
(in KM ‘000) 31 December 2014 31 December 2013
Corporate (including state and
public sector) Retail Total
Corporate (including state and
public sector) Retail Total
Gross exposure 238,317 89,793 328,110 234,366 98,050 332,416
Impairment rate 78.09% 84.02% 79.72% 73.94% 80.80% 75.96%
An increase in the impairment rate of 1pp on the gross non-performing loans identifi ed above as impaired at 31 December 2014, would lead to the recognition of an additional impairment loss of KM 3,281 thousand (2013: KM 3,324 thousand).

53UniCredit Bank d.d. · Annual Report 2014
4. Critical accounting judgments and key sources of estimation uncertainty (continued)
4.1 Key sources of estimation uncertainty (continued)
4.1.2 Impairment losses on loans and receivables (continued)
a) Impairment losses on loans and receivables and provisions for off-balance-sheet exposure (continued)
Non-performing portfolio – calculation in accordance with FBA regulations
At year end, the gross value of impaired loans and receivables, and the rate of impairment loss, calculated as prescribed by FBA, were as follows:
(in KM ‘000) 31 December 2014 31 December 2013
Corporate (including state and
public sector) Retail Total
Corporate (including state and
public sector) Retail Total
Gross exposure 226,320 64,123 290,443 189,464 63,671 253,135
Impairment rate 77.22% 90.32% 80.11% 81.94% 91.55% 84.36%
An increase in the impairment rate of 1pp on the gross non-performing loans identified above as impaired under FBA regulations at 31 December 2014, would lead to additional provisions of KM 2,904 thousand (2013: KM 2,531 thousand). Under FBA regulations, exposures with installments up to 90 days overdue are treated as performing. In accordance with FBA regulations, the Bank also calculates provisions on such performing loans with delays in repayment of up to 90 days, at prescribed rates, in the range from 5% to 15% (risk category B). Impairment allowance at 31 December 2014, recognized for risk category B, amounted to KM 4,922 thousand (2013: KM 10,071 thousand), while gross exposure amounted to KM 58,411 thousand (2013: KM 91,759 thousand).
IBNR
In addition to identified losses on impaired loans, as described above, the Bank also recognises impairment losses which are known to exist at the reporting date, but which have not yet been specifically identified (“IBNR”). Amounts, for which an impairment loss has been identified, are excluded from this calculation.
The amount of IBNR at 31 December 2014, amounted to KM 43,361 thousand (2013: KM 37,038 thousand) or 1.8% (2013: 1.6%) of loans and receivables from customers and 1.0% (2013: 0.9%) of total on- and off-balance-sheet credit risk exposure to customers, in both cases net of amounts assessed as impaired.

54 Annual Report 2014 · UniCredit Bank d.d.
Notes to the fi nancial statementsfor the year ended 31 December 2014 (CONTINUED)(all amounts are expressed in thousands of KM, unless otherwise stated)
4. Critical accounting judgments and key sources of estimation uncertainty (continued)
4.1 Key sources of estimation uncertainty (continued)
4.1.2 Impairment losses on loans and receivables (continued)
b) Regulatory reserves calculated in accordance with FBA regulations
For the purposes of assessing capital adequacy in accordance with local regulations, the Bank also calculates provisions in accordance with the relevant FBA regulations. In accordance with these regulations, the relevant placements are classifi ed into appropriate risk groups, depending on the past due days, the fi nancial position of the borrower and collateral, and are provided for at prescribed rates.
The regulatory provisions include both specifi c and general provisions. The general provision is added back as Tier 2 capital in the computation of capital adequacy under FBA rules. The amount of such general provision of KM 65,820 thousand at 31 December 2014 added back as Tier 2 capital exceeds by KM 19,813 thousand the combined amount of regulatory reserves of KM 20,682 thousand excluded from Tier 1 capital and KM 25,325 thousand further deducted from capital at that date (2013: regulatory reserves KM 21,978 thousand).
4.1.3 Legal proceedings
The Bank makes individual assessment of all legal proceedings whose value exceeds KM 25 thousand. All legal proceedings below KM 25 thousand are monitored and provided for on a portfolio basis. The initial assessment is made by the Bank’s Legal Department and its adequacy is independently monitored by Risk Management.
As of 31 December 2014 the Bank has provided KM 3,592 thousand , which management estimates as suffi cient for covering risk of potential liability from legal proceedings against the Bank . It is not practicable to estimate the fi nancial impact of changes to the assumptions based on which management assesses the need for provisions.
4.1.4 Fair value of fi nancial instruments
As described in Note 36, the Management uses their judgement in selecting an appropriate valuation technique for fi nancial instruments not quoted in an active market. Valuation techniques commonly used by market practitioners are applied. Financial instruments, other than loans, are valued using a discounted cash fl ow analysis based on assumptions supported, where possible, by observable market prices or rates. The estimation of fair value of unlisted shares includes some assumptions not supported by observable market prices or rates.

55UniCredit Bank d.d. · Annual Report 2014
5. Segment reporting
The segments of the Bank include:
1. “Retail”: individuals, small business and sole traders;
2. “Corporate and Investing Banking”: large and medium corporate clients, state and public sector, financial markets (trading activities);
3. “Assets and Liabilities Management”: asset and liability management;
4. “Central Unit”: other assets and liabilities not assigned to other segments.
Segment reporting is prepared based on management financial information.
Income statement per segment
Year ended 31 December 2014 Retail
Corporate and Investing
Banking
Assets and Liabilities
Management Central Unit TotalNet interest income 103,366 36,250 (607) (413) 138,596
Net fee and commission income 42,504 16,282 (1,061) (5) 57,720
Dividend income - - - 9 9Net gains from foreign exchange trading and translation of monetary assets and liabilities 6,119 3,182 (3) (6) 9,292Other income 280 56 19 933 1,288
Operating income 152,269 55,770 (1,652) 518 206,905
Depreciation and amortization (6,908) (573) (21) (2,640) (10,142)Operating expenses (85,845) (19,663) (1,243) 1,406 (105,345)
Profit before impairment losses and taxation 59,516 35,534 (2,916) (716) 91,418
Impairment losses and provisions, net (2,914) (18,724) - (795) (22,433)
Profit before taxation 56,602 16,810 (2,916) (1,511) 68,985
Income tax expense (5,660) (1,681) 292 (538) (7,587)
NET PROFIT 50,942 15,129 (2,624) (2,049) 61,398

56 Annual Report 2014 · UniCredit Bank d.d.
Notes to the fi nancial statementsfor the year ended 31 December 2014 (CONTINUED)(all amounts are expressed in thousands of KM, unless otherwise stated)
5. Segment reporting (continued)
Income statement per segment (continued)
Year ended 31 December 2013 Retail
Corporate and Investing
Banking
Assets and Liabilities
Management Central Unit TotalNet interest income 107,251 40,320 (5,494) (2,143) 139,934
Net fee and commission income 40,170 16,010 (969) (7) 55,204
Dividend income - - - 9 9 Net gains from foreign exchange trading and translation of monetary assets and liabilities 6,495 3,015 6 2 9,518 Other income 191 149 143 647 1,130
Operating income 154,107 59,494 (6,314) (1,492) 205,795
Depreciation and amortization (9,118) (1,003) (39) (3,725) (13,885)Operating expenses (87,877) (19,968) (1,152) 2,403 (106,594)
Profi t before impairment losses and taxation 57,112 38,523 (7,505) (2,814) 85,316
Impairment losses and provisions, net (6,678) (14,507) - (1,125) (22,310)
Profi t before taxation 50,434 24,016 (7,505) (3,939) 63,006
Income tax expense (5,043) (2,402) 751 (741) (7,435)
NET PROFIT 45,391 21,614 (6,754) (4,680) 55,571

57UniCredit Bank d.d. · Annual Report 2014
5. Segment reporting (continued)
Statement of financial position per segment
31 December 2014 Retail
Corporate and Investing
Banking
Assets and Liabilities
Management Central Unit TotalSegment assets 1,504,254 1,010,589 1,192,377 254,542 3,961,762
Total assets 1,504,254 1,010,589 1,192,377 254,542 3,961,762
Segment liabilities 2,129,386 808,240 273,527 108,843 3,319,996Current tax liability - - - 307 307Deferred tax liability - - - 1,385 1,385
Total liabilities 2,129,386 808,240 273,527 110,535 3,321,688 Acquisition of property, equipment and intangible assets - - - - -
31 December 2013 Retail
Corporate and Investing
Banking
Assets and Liabilities
Management Central Unit TotalSegment assets 1,394,301 908,025 1,170,213 256,894 3,729,433
Total assets 1,394,301 908,025 1,170,213 256,894 3,729,433
Segment liabilities 1,899,643 801,423 343,616 104,239 3,148,921Current tax liability - - - 282 282Deferred tax liability - - - 1,402 1,402
Total liabilities 1,899,643 801,423 343,616 105,923 3,150,605 Acquisition of property, equipment and intangible assets - - - 5,031 5,031

58 Annual Report 2014 · UniCredit Bank d.d.
Notes to the fi nancial statementsfor the year ended 31 December 2014 (CONTINUED)(all amounts are expressed in thousands of KM, unless otherwise stated)
6. Interest and similar income
Analysis by source
2014 2013Retail 116,811 117,225Corporate 45,556 47,219State and public sector 16,058 15,140Banks and other fi nancial institiutions 1,400 1,087
179,825 180,671
Banks and other fi nancial institutions include CBBH.
Analysis by product
2014 2013Loans and receivables from customers 172,405 174,598Debt securities (fi nancial assets available-for-sale) 6,673 5,343Loans to and receivables from banks 452 569Obligatory reserves and cash reserves with CBBH 295 161
179,825 180,671
Interest income on impaired loans and receivables amounted to KM 1,717 thousand (2013: KM 1,953 thousand).
7. Interest expense and similar charges
Analysis by recipient
2014 2013Retail 28,762 26,119Banks and other fi nancial institutions 5,759 7,739Corporate 4,723 2,609State and public sector 1,985 4,270
41,229 40,737
Analysis by product
2014 2013Current accounts and deposits from retail customers 28,762 26,119Current accounts and deposits from corporate, and state and public sector 6,708 6,879Borrowings 4,366 5,003Current accounts and deposits from banks 829 984Subordinated debt 564 568Issued debt securities - 1,184
41,229 40,737

59UniCredit Bank d.d. · Annual Report 2014
8. Fee and commission income
2014 2013Credit cards 20,662 20,223Domestic payment transactions 16,753 16,273Foreign payment transactions 9,816 9,413Guarantees and letters of credit 5,902 5,578Other 7,200 6,236
60,333 57,723
9. Fee and commission expenses
2014 2013Foreign payment transactions 1,142 827Domestic payment transactions 862 941Other 609 751
2,613 2,519
10. Net gains from foreign exchange trading and translation of monetary assets and liabilities
2014 2013Net foreign exchange spot trading gains 8,756 9,854Net foreign exchange loss from translation of monetary assets and liabilities (2) (2)Net losses from FX forwards 538 (334)
9,292 9,518
11. Other income
2014 2013Income from claims settled by insurance companies 529 54Income from expenses recharged to customers 195 323Net gains on disposal of property and equipment 103 58Income from IT services 100 154Net income from repossessed collaterals 88 22Rent income 34 46Write-offs of other liabilities and reversal of accrued expenses 10 223Other 229 250
1,288 1,130

60 Annual Report 2014 · UniCredit Bank d.d.
Notes to the fi nancial statementsfor the year ended 31 December 2014 (CONTINUED)(all amounts are expressed in thousands of KM, unless otherwise stated)
12. Operating expenses
2014 2013Personnel costs 53,662 53,491Administration and marketing expenses 37,046 37,941Rental costs 7,003 7,615Savings deposit insurance expenses 6,418 6,312State contributions (excluding personnel-related) 732 695Other expenses 484 540
105,345 106,594
Personnel costs include KM 9,845 thousand of defi ned contributions paid into the state-owned pension plans (2013: KM 9,957 thousand).
13. Impairment losses and provisions, net
2014 2013Loans and receivables from customers (Note 20) 18,278 20,365Off-balance-sheet exposure to credit risk (Note 29) 3,360 826Provisions for legal proceedings (Note 29) 443 23Other assets (Note 21) 352 1,014Impairment of tangible assets (Note 22) - 82
22,433 22,310
14. Income tax expense
Total tax recognized in the income statement may be presented as follows:
2014 2013Current income tax 7,587 7,435Deferred income tax - -
7,587 7,435
Adjustment between income tax presented in tax balance and accounting income tax is presented as follows:
2014 2013Profi t before income tax 68,985 63,006Tax calculated at rate of 10% 6,899 6,301Effects of non-deductible expenses 708 747Effects of additional income tax from previous years - 420Effects of expenses not deducted in prior years (20) (33)
Current income tax 7,587 7,435
Average effective income tax rate 11.0% 11.8%

61UniCredit Bank d.d. · Annual Report 2014
14. Income tax expense (continued)
Movements in temporary differences of deferred tax assets and deferred tax liabilities in profit of loss and other comprehensive income are presented as follows:
Deferred tax assets Deferred tax liabilitiesNet deferred tax assets /
(liabilities)Balance at 1 January 2013 - 1,428 1,428Change in fair value of financial assets available-for-sale, recognized in other comprehensive income - (26) (26)
Balance as at 31 December 2013 - 1,402 1,402Change in fair value of financial assets available-for-sale, recognized in other comprehensive income (13) (4) (17)Net tax assets/ (liabilities) 13 (13) -
Balance as at 31 December 2014 - 1,385 1,385
Balances of deferred tax assets and deferred tax liabilities were as follows:
31 December2014
31 December2013
Deffered tax assets - -
Deffered tax liabilitiesNet deferred tax liability for financial assets available-for-sale - (4)Net deferred tax liability for other provisions for loans and receivables from customers (1,398) (1,398)Net tax assets / (liabilities) 13 -
Net deffered tax liabilities (1,385) (1,402)
15. Cash and cash equivalents
31 December2014
31 December2013
Current accounts with other banks 175,047 67,886Giro account with CBBH 150,698 228,679Cash in hand 145,567 126,592Items in the course of collection 164 108
471,476 423,265

62 Annual Report 2014 · UniCredit Bank d.d.
Notes to the fi nancial statementsfor the year ended 31 December 2014 (CONTINUED)(all amounts are expressed in thousands of KM, unless otherwise stated)
16. Obligatory reserve at the Central Bank of Bosnia and Herzegovina
31 December2014
31 December2013
Obligatory reserve at CBBH 267,416 243,005
267,416 243,005
The obligatory reserve represents amounts required to be deposited with CBBH. The obligatory reserve is calculated on the basis of deposits and borrowings taken regardless of currency.
The basis for calculation of obligatory reserve excludes:
• borrowings taken from foreign entities;
• funds from governments of BIH entities for development projects.
Required obligatory reserve rates are:
• 10% (2013: 10%) of deposits and borrowings with maturity of up to one year (short-term deposits and borrowings)
• 7% (2013: 7%) on deposits and borrowings with maturity over one year (long-term deposits and borrowings).
17. Loans to and receivables from banks
31 December2014
31 December2013
Placements with other banks 330,571 507,523Loans to banks 9 71
330,580 507,594Less: Impairment allowance (124) (124)
330,456 507,470
Expected to be recovered:- no more than twelve months after the reporting period 330,580 507,594- more than twelve months after the reporting period - -Less: Allowance for impairment losses (124) (124)
330,456 507,470
Loans to and receivables from banks included KM 4,343 thousand pledged as collateral for the Bank’s liabilities to Visa and MasterCard in respect of credit card operations (2013: KM 3,334 thousand).
Loans to and receivables from banks include KM 41,689 thousand (2013: KM 64,072 thousand) of placements and loans to related parties.

63UniCredit Bank d.d. · Annual Report 2014
17. Loans to and receivables from banks (continued)
The movement in impairment allowance for loans to and receivables from banks is as follows:
2014 2013Balance as at 1 January 124 124Changes - -
Balance as at 31 December 124 124
18. Financial assets available-for-sale
31 December
201431 December
2013Debt securities available-for-sale 318,623 142,717Equity securities available-for-sale 216 216
318,839 142,933
During 2013 and 2014, there were no overdue and unpaid financial assets available-for-sale or impairment losses on available-for-sale financial assets.
Debt securities available-for-sale
31 December2014
31 December2013
Bonds of the Government of the Federation of B&H 171,961 88,397Bonds of the Government of Republic of Srpska 25,570 -Treasury bills of the Government of the Federation of B&H 27,633 13,960Treasury bills of the Government of Republika Srpska 5,334 7,923Treasury bills of the Government of the Republic of Croatia 3,431 2,937Foreign bank bonds 84,694 29,500
318,623 142,717
Equity securities available-for-sale
2014 2013Listed or quoted 214 214Unlisted or unquoted 2 2
216 216

64 Annual Report 2014 · UniCredit Bank d.d.
Notes to the fi nancial statementsfor the year ended 31 December 2014 (CONTINUED)(all amounts are expressed in thousands of KM, unless otherwise stated)
19. Financial assets and liabilities at fair value through profi t or loss
Derivatives classifi ed as held for trading – OTC products (all of them with related parties)
31 December 2014 31 December 2013
Notional amount Fair value Notional amount Fair value
Financial assetsForward foreign exchange contracts 4,162 18 5,855 56Foreign exchange swap contracts 190,960 - 151,143 -
195,122 18 156,998 56
Financial liabilitiesForward foreign exchange contracts 24,185 17 4,837 48Foreign exchange swap contracts 200 - 214 1
24,385 17 5,051 49
20. Loans and advances to customers
31 December2014
31 December2013
Corporate (including state and public sector)- in domestic currency 1,231,134 1,165,395- in foreign currency 38,550 42,658
1,269,684 1,208,053Retail- in domestic currency 1,504,678 1,385,935- in foreign currency 393 436
1,505,071 1,386,371
Total loans before allowance 2,774,755 2,594,424
Less: allowance for impairment losses (295,932) (282,681)
Net loans 2,478,823 2,311,743
Expected to be recovered:- no more than twelve months after the reporting period 1,184,804 1,173,355- more than twelve months after the reporting period 1,589,951 1,421,069Less: Allowance for impairment losses (295,932) (282,681)
2,478,823 2,311,743
Included in retail loans in domestic currency is KM 763,124 thousand of gross loans (2013: KM 862,580 thousand), and in corporate loans in domestic currency KM 680,763 thousand (2013: KM 651,501 thousand) which have a EUR countervalue. Repayments of principal and interest are determined with reference to the EUR countervalue and are paid in the KM equivalent translated at the rate applicable at the date of payment.

65UniCredit Bank d.d. · Annual Report 2014
20. Loans and advances to customers (continued)
The movements in allowance for impairment losses are summarized as follows:
Retail Corporate Total
Balance as at 1 January 2013 86,017 180,882 266,899Increase in impairment losses 23,336 25,287 48,623Release of provisions due to exposure (6,391) (4,083) (10,474)Release on the basis of recoveries of amounts previously reserved (10,402) (7,382) (17,784)
Impairment losses recognized in the profit or loss (Note 13) 6,543 13,822 20,365Release due to writte-offs (162) (4,781) (4,943)Other movements 132 255 387Effect of foreign exchange (28) 1 (27)
Balance as at 31 December 2013 92,502 190,179 282,681Increase in impairment losses 21,807 27,662 49,469Release of provisions due to exposure (9,018) (6,093) (15,111)Release on the basis of recoveries of amounts previously reserved (10,658) (5,422) (16,080)
Impairment losses recognized in the profit or loss (Note 13) 2,131 16,147 18,278Release due to writte-offs (520) (4,923) (5,443)Other movements 12 445 457Effect of foreign exchange (22) (18) (41)
Balance as at 31 December 2014 94,102 201,830 295,932

66 Annual Report 2014 · UniCredit Bank d.d.
Notes to the fi nancial statementsfor the year ended 31 December 2014 (CONTINUED)(all amounts are expressed in thousands of KM, unless otherwise stated)
20. Loans and advances to customers (continued)
The Bank’s loan portfolio, net of impairment allowance, is analysed by industry in the table below:
31 December2014
31 December2013
Corporate (including state and public sector)Manufacturing:
Food and drinks 66,127 45,097Wood and paper 60,409 31,368Metal and engineering 42,532 51,498Electricity, gas and water 38,537 24,968Chemicals 29,966 34,358Textile and leather 6,799 23,496Electrical and optical equipment 4,899 7,183Tobacco 973 5,806Other manufacturing 30,401 48,413
Total manufacturing 280,643 272,187
Retail and wholesale trade 349,372 371,487Central and local governments 93,927 77,682Real estate 85,957 89,548Construction 74,003 55,919Transport and communications 62,549 70,982Health and social care 33,406 15,676Tourism 30,075 32,503Agriculture, forestry and fi sheries 11,942 10,421Financial intermediaries 2,901 4,197Education and other public services 1,705 3,931Other 41,374 13,341
Total corporate 1,067,854 1,017,874
RetailNon-purpose loans 984,228 853,398Housing loans 252,646 268,469Other retail loans 174,095 172,002
Total retail 1,410,969 1,293,869
Total loans and receivables from customers 2,478,823 2,311,743

67UniCredit Bank d.d. · Annual Report 2014
21. Other assets and receivables
31 December2014
31 December2013
Receivables from debit and credit cards 27,389 30,386Assets acquired in lieu of uncollectible receivables 4,568 4,723Accrued fees 499 473Other assets 7,954 7,410
40,410 42,992Less: allowance for impairment losses (9,377) (9,565)
31,033 33,427
The movements in allowance for impairment losses are summarized as follows:
2014 2013
Balance as at 1 January 9,565 9,517 Net charge / (credit) to profit or loss (Note 13) 352 1,014Release due to writte-offs (547) (970)Effects of foreign exchange 7 4
Balance as at 31 December 9,377 9,565

68 Annual Report 2014 · UniCredit Bank d.d.
Notes to the fi nancial statementsfor the year ended 31 December 2014 (CONTINUED)(all amounts are expressed in thousands of KM, unless otherwise stated)
22. Property and equipment
Land and buildings
Motor vehicles and
equipment ComputersLeasehold
improvementAssets in progress Total
COST
Balance as at 31 December 2012 51,842 34,136 52,455 - 2,629 141,062Additions - - - - 2,282 2,282Write-offs - (63) (82) - - (145)Disposals - (637) (735) - - (1,372)Transfers (from) / to 198 1,611 1,776 - (3,585) -Other movements - (1,061) (39) - - (1,100)
Balance as at 31 December 2013 52,040 33,986 53,375 - 1,326 140,727 Additions - - - 2,957 2,957Transfer from intangible assets (Note 23) - - - 28,047 1,452 29,499Write-offs - (685) (2,149) (128) - (2,962)Disposals (281) (180) - - - (461)Transfers (from) / to 117 1,196 1,390 989 (3,692) -Other movements (1) (9) (128) - (16) (154)
Balance as at 31 December 2014 51,875 34,308 52,488 28,908 2,027 169,606
ACCUMULATED DEPRECIATION
Balance as at 31 December 2012 15,227 23,050 43,918 - - 82,195 Depreciation charge for the year 1,003 2,746 3,813 - - 7,562 Write offs - (45) (82) - - (127)Disposals - (455) (735) - - (1,190)Impairment loss (Note 13) 82 - - - - 82 Other movements - (1,057) (9) - - (1,066)
Balance as at 31 December 2013 16,312 24,239 46,905 - - 87,456 Depreciation charge for the year 1,006 2,349 3,190 1,318 - 7,863Transfer from intangible assets (Note 23) - - - 25,266 - 25,266Write offs - (547) (2,081) (128) - (2,756)Disposals (197) (156) - - - (353)Other movements - - (124) - - (124)
Balance as at 31 December 2014 17,121 25,885 47,890 26,456 - 117,352
NET BOOK VALUE -
31 December 2014 34,754 8,423 4,598 2,454 2,027 34,754
31 December 2013 35,728 9,747 6,470 1,326 53,271

69UniCredit Bank d.d. · Annual Report 2014
22. Property and equipment (continued)
Assets in progress as at 31 December 2013 and 2014 represent equipment and motor vehicles that were not activated.
The carrying value of non-depreciating land within land and buildings amounted to KM 404 thousand on 31 December 2014 (2013: KM 404 thousand).
During 2013 and 2014, the Bank did not capitalise any borrowing costs related to the acquisition of property and equipment. During 2013 and 2014, property and equipment were not pledged as collateral for the Bank’s borrowings.
23. Intangible assets
SoftwareLeasehold
improvementsOther intangible
assetsAssets in progress Total
COST
Balance as at 31 December 2012 35,698 28,392 6,928 5,312 76,330 Additions - - - 2,749 2,749 Write-offs - (457) - - (457)Transfers (from) / to 1,938 112 196 (2,246) -
Balance as at 31 December 2013 37,636 28,047 7,124 5,815 78,622 Additions - - - 3,700 3,700Transfer to tangible assets (Note 22) - (28,047) - (1,452) (29,499)Transfers (from) / to 1,202 - - (1,202) -Other changes - - (1) (3) (4)
Balance as at 31 December 2014 38,838 - 7,123 6,861 52,819
ACCUMULATED DEPRECIATION
Balance as at 31 December 2012 30,106 23,841 4,277 - 58,224 Depreciation charge for the year 3,442 1,613 1,268 - 6,323 Write-offs - (188) - - (188)
Balance as at 31 December 2013 33,548 25,266 5,545 - 64,359 Depreciation charge for the year 1,513 - 766 - 2,279Transfer to tangible assets (Note 22) - (25,266) - - (25,266)
Balance as at 31 December 2014 35,061 - 6,311 - 41,372
NET BOOK VALUE
31 December 2014 3,777 - 812 6,861 11,447
31 December 2013 4,088 2,781 1,579 5,815 14,263
Assets in progress as at 31 December 2013 and 2014 represent software that was not activated.
During 2013 and 2014, the Bank did not capitalise any borrowing costs related to the acquisition of intangible assets. During 2013 and 2014, intangible assets were not pledged as collateral for the Bank’s borrowings.

70 Annual Report 2014 · UniCredit Bank d.d.
Notes to the fi nancial statementsfor the year ended 31 December 2014 (CONTINUED)(all amounts are expressed in thousands of KM, unless otherwise stated)
24. Current accounts and deposits from banks
31 December
201431 December
2013
Demand deposits - in foreign currency 8,391 3,520 - in KM 3,317 1,993
Term deposits - in foreign currency 80,191 138,875 - in KM 3,618 -
95,517 144,388
Current accounts and deposits from banks include KM 85,058 thousand due to related parties (2013: KM 140,219 thousand).
25. Current accounts and deposits from customers
31 December
201431 December
2013
Retail Current and savings accounts and term deposits - foreign currency 1,188,214 1,089,132Current and savings accounts and term deposits - KM 756,532 650,781
1,944,746 1,739,913
Corporate (including state and public sector)Demand deposits - in KM 603,900 601,182 - in foreign currency 222,761 200,141Term deposits - in KM 117,040 111,321 - in foreign currency 72,573 71,712
1,016,454 984,356
2,961,200 2,724,269
Retail deposits in KM include KM 1,098 thousand (2013: KM 1,128 thousand) and corporate deposits in KM include KM 69,961 thousand (2013: KM 75,806 thousand) which have a EUR currency clause, with payments in KM equivalent translated at the rate applicable at the date of payment.
Current accounts and deposits from customers include KM 18,551 thousand from related parties (2013: KM 44,109 thousand).

71UniCredit Bank d.d. · Annual Report 2014
26. Borrowings
31 December
201431 December
2013Foreign banks 146,867 171,811Domestic banks 11,449 8,021
158,316 179,832
Maturity analysis:Within one year 134,346 30,231In the second year 8,994 133,052Third to fifth year 14,092 13,865After five years 884 2,683
158,316 179,832
Interest-bearing borrowings include KM 117,372 thousand (2013: KM 117,367 thousand) of borrowings from related parties.
27. Subordinated debt
31 December2014
31 December2013
Subordinated debt 19,694 19,702
19,694 19,702
Subordinated debt in the amount of EUR 10 million relates to the loan UniCredit Bank dd Mostar from Bank Polska, Opieki which was approved in March 2005 in the amount of EUR 10 million, with a maturity of 10 years at a variable interest rate based on six-month EURIBOR + 2.50%.
The repayment of this debt is subordinated to all other liabilities of UniCredit Bank d.d.
28. Other liabilities
31 December2014
31 December2013
Liabilities for items in the course of settlement 38,407 38,348Accrued expenses 14,480 12,700Credit card payables 7,143 7,564Deferred income 1,858 1,586Other liabilities 6,597 7,663
68,485 67,861

72 Annual Report 2014 · UniCredit Bank d.d.
Notes to the fi nancial statementsfor the year ended 31 December 2014 (CONTINUED)(all amounts are expressed in thousands of KM, unless otherwise stated)
29. Provisions for liabilities and charges
Provisions for off-balance-sheet
itemsProvisions for legal
proceedings
Long-term provisions for
employees Total
Balance at 1 January 2013 7,184 4,140 1,773 13,097Net charge in profi t or loss 826 23 62 911Release due to usage of provisions - (948) (286) (1,234)Transfer from other liabilities - - 81 81Foreign currency differences (35) - - (35)
Balance as at 31 December 2013 7,975 3,215 1,630 12,820Net charge in profi t or loss 3,360 443 387 4,190Release due to usage of provisions - (66) (263) (329)Transfer from other liabilities - - 83 83Foreign currency differences 3 - - 3
Balance as at 31 December 2014 11,338 3,592 1,837 16,767
Except for long-term provisions for employees, which are presented within personnel costs in Note 12, provisions for liabilities and charges are presented within impairment losses and provisions in Note 13.
30. Issued share capital
Class A Ordinary shares
Class DPreference shares Total
Number of shares 119,011 184 119,195Par value 1,000 1,000 1,000
Total 119,011 184 119,195
31. Basic earnings per share
Basic earnings per share is calculated by dividing the net profi t attributable to ordinary shareholders by weighted average number of ordinary shares in issue during the year, excluding the average number of ordinary shares purchased by the Bank and held as treasury shares. For the purpose of calculating basic earnings per share, preferred shares are considered as ordinary shares as they do not bear preferential dividend right.
2014 2013Net profi t for the period attributable to ordinary shareholders 61,398 55,571Weighted average number of ordinary shares during the period 118,935 118,935
Basic earnings per share (KM) 516.23 467.24
Diluted earnings per share are not presented, as the Bank has not issued dilutive equity instruments.

73UniCredit Bank d.d. · Annual Report 2014
32. Commitments and contingent liabilities
During its operations, the Bank has commitments and contigent liabilities recoreded in off-balance, which are related to guarantees, credentials and unused part of loan facilities.
31 December2014
31 December2013
Unused loan facilities 516,831 436,947Payment and custom guarantees 176,077 149,247Performance bonds 88,837 101,619Letters of credit 11,921 11,088
793,666 698,901
33. Funds managed on behalf of third parties and custody services
31 December2014
31 December2013
Assets under custody 466,320 393,612Loans managed on behalf of third parties 57,256 41,383
523,576 434,995
These funds are not part of the statement of the financial position of the Bank, nor part of the assets of the Bank, and they are managed separately. The Bank earns fee income for provision of the related services.
34. Related party transactions
The Bank is a member of the UniCredit Group (“UCI Group”). The key shareholders of the Bank are Zagrebačka banka d.d. with a holding of 65.59% (2013: 65.59%) and UniCredit Bank Austria AG with 24.4% (2013: 24.4%). The Bank considers that it has an immediate related party relationship with its key shareholders and their subsidiaries; its associate (up until disposal); Supervisory Board members, Management Board members and other executive management (together “key management personnel”); close family members of key management personnel; and entities controlled, or significantly influenced by key management personnel and their close family members.
Related party transactions are part of the Bank’s regular operations.

74 Annual Report 2014 · UniCredit Bank d.d.
Notes to the fi nancial statementsfor the year ended 31 December 2014 (CONTINUED)(all amounts are expressed in thousands of KM, unless otherwise stated)
34. Related party transactions (continued)
An overview of related party transactions in 2013 and 2014 is presented below:
2014 2013
Income Expenses Income ExpensesUniCredit Bank Austria AG Vienna, Austria 745 3,889 561 3,756UniCredit Bank AG Munich, Germany 338 342 - 1,378UniCredit Bank a.d. Banja Luka 191 19 354 29Zagrebačka banka d.d. Zagreb, Croatia 42 691 265 1,750UniCredit Bank Slovenija d.d. Ljubljana, Slovenia 14 - 11 -UniCredit Bank Srbija a.d. Belgrade, Serbia 1 - 2 -UniCredit Global Information Services - 4,454 - 4,066Bank Polska Kasa Opieki S.A. Warsaw, Poland - 563 - 568ZANE BH d.o.o. Sarajevo - 97 - 87BACA Nekretnine d.o.o. Sarajevo - 43 - 66UniCredit Broker d.o.o. Sarajevo - 42 - 40UniCredit Leasing d.o.o. Sarajevo - 15 - 7UniCredit S.p.A Milano, Italia - - 12 -Interkonzum d.o.o. Sarajevo - - - 18
1,331 10,155 1,205 11,765Management Board and other key management personnel, as well as the parties related to Management Board and other key management personnel 92 4, 518 116 5,482
1,423 14,673 1,321 17,247
There were no transactions with the members of the Supervisory Board during 2013 and 2014.
Income from UniCredit Group members in 2014 includes interest income in the amount of KM 754 thousand (2013: KM 577 thousand) and fee and commission income in the amount of KM 109 thousand (2013: KM 347 thousand). Income in 2014 also includes other income in the amount of KM 468 thousand (2013: KM 281 thousand).
Expenses towards UniCredit Group members in 2014 include interest expense in the amount of KM 4,490 thousand (2013: KM 5,721 thousand), fees in the amount of KM 397 thousand (2013: KM 565 thousand), other administrative expenses in the amount of KM 4,817 thousand (2013: KM 4,433 thousand) and other expenses in the amount of KM 451 thousand (2013: KM 1,046 thousand).

75UniCredit Bank d.d. · Annual Report 2014
34. Related party transactions (continued)
An overview of balances at 31 December 2013 and 2014 is presented below:
31 December 2014 31 December 2013
Exposure* Liabilities Exposure* LiabilitiesUniCredit Bank Austria AG Vienna, Austria 98,265 178,131 80,554 236,890UniCredit Bank a.d. Banja Luka 38,633 3,624 23,170 3Zagrebačka banka d.d. Zagreb, Croatia 10,561 1,257 6,703 1,554UniCredit S.p.A Milano, Italia 6,772 544 7,344 369UniCredit Bank AG Munich, Germany 1,914 19,636 1,129 19,596UniCredit Global Information Services 1,648 - 85 -UniCredit Bank Slovenija d.d. Ljubljana, Slovenija 1 268 - 81Bank Polska Kasa Opieki S.A. Warsaw, Poland - 19,694 2 19,702UniCredit Leasing d.o.o. Sarajevo - 13,218 - 24,532UniCredit Broker d.o.o. Sarajevo - 2,515 - 2,060ZANE BH d.o.o. Sarajevo - 1,458 - 1,370BACA Nekretnine d.o.o. Sarajevo - 729 - 3,963UniCredit Leasing Nekretnine - 425 - -Interkonzum d.o.o. Sarajevo - 206 - 12,184
157,794 241,705 118,987 774,851Management Board and other key management personnel, as well as the parties related to Management Board and other key management personnel 1,602 6,202 1,877 2,410
159,396 247,907 120,864 777,261
* Exposure includes loans, interest receivables, other receivables and off-balance-sheet exposure.
Regarding exposure toward the related parties, the Bank did not have any impairment losses in 2014 and 2013, and the balance of impairment allowance at 31 December 2014 and 31 December 2013 was nil.
Further, the Bank received guarantees from UniCredit Bank Austria AG at 31 December 2014 in the amount KM 84,857 thousand (31 December 2013: KM 84,857 thousand), while as at 31 December 2014 the Bank did not have any given guarantees (31 December 2013: KM 6,423 thousand given guarantees per order of Bank Austria).
Remuneration paid to Management Board and other key management personnel:
2014 2013Gross salaries 2,893 2,584Bonuses 700 1,051Other benefits 488 1,224
4,081 4,859

76 Annual Report 2014 · UniCredit Bank d.d.
Notes to the fi nancial statementsfor the year ended 31 December 2014 (CONTINUED)(all amounts are expressed in thousands of KM, unless otherwise stated)
35. Risk management
The Bank’s risk management is conducted through a system of policies, programmes, procedures and approved limits, which are continuously upgraded in accordance with changes in legislation, changes in business activities based on market trends and development of new products, as well as through the adoption of risk management standards of the Group.
The most important types of risk to which the Bank is exposed are credit risk, market risks and operational risk.
The principles of risk management and internal acts related to risk management are defi ned and adopted by the Supervisory Board and the Management Board.
35.1 Credit risk
The Bank is, in its ordinary course of business, exposed to credit risk, which can be defi ned as the possibility that a borrower will default on its obligations defi ned in lending agreements, which may result in a fi nancial loss for the Bank.
The exposure to credit risk is managed in accordance with the Bank’s applicable programmes and policies, as well as other internal regulations prescribed by the Supervisory Board and the Management Board. The exposure to credit risks is managed, in a way that exposures to portfolios and individual client/group exposures are reviewed by taking into account prescribed limits.
The limits of credit risks are determined in relation to the Bank’s regulatory capital.
In order to manage the level of credit risk, the Bank deals with counterparties of good credit standing and when appropriate, obtains collateral.
The choice of collateral instruments for covering the Bank’s receivables depends on:
• the assessment of the borrower’s credit standing,
• risk evaluation of the lending product itself,
• evaluation of the value of the offered collateral and
• external regulations.
In accordance with the requirements of the Group, the Bank has implemented standardized approach to the international standard Basel III.
35.1.1 Maximum exposure to credit risk
The majority of credit risk exposures are secured with collateral in the form of cash, mortgages and guarantees, and so-called primary collateral or execution instruments consisting of promissory notes giving the Bank full contractual authority for collection of outstanding debts from the clients’ accounts as well as a preapproval for seizure of income verifi ed by the competent local authority (applicable to individual clients).

77UniCredit Bank d.d. · Annual Report 2014
35. Risk management (continued)
35.1 Credit risk (continued)
35.1.1 Maximum exposure to credit risk (continued)
The Bank continually applies prudent methods and tools in the credit risk assessment process.The maximum exposure to credit risk relating to items in the statement of financial position and commitments (off-balance-sheets items) is as follows:
31 December
201431 December
2013
Statement of financial positionCash and cash equivalents (Note 15) 325,909 296,673Obligatory reserve at CBBH (Note 16) 267,415 243,005Loans to and receivables from banks (Note 17) 330,456 507,470Debt securities within financial assets available-for-sale (Note 18 ) 318,623 142,717Financial assets at fair value through profit or loss (Note 19) 18 56Loans and receivables from customers (Note 20) 2,478,823 2,311,743Other assets exposed to credit risk (Note 21) 29,416 32,515
Total credit risk exposure relating to assets 3,750,660 3,534,179
Off-balance-sheet items (Note 33)Unused loan facilities 516,831 436,947Guarantees 264,914 250,866Letters of credit 11,921 11,088
Total off-balance sheet credit risk exposure 793,666 698,901
4,544,326 4,233,080
The above table represents the maximum credit risk exposure of the Bank as at 31 December 2014 and 2013, without taking into account any collateral held or other credit enhancements attached. For items in the statement of financial position, the exposures set out above are based on net carrying amounts as reported in the statement of financial position. For commitments the maximum credit risk exposure equals the total undrawn amounts.
As shown above 54.5% of the total maximum exposure to credit risk is derived from loans and receivables from customers (2013: 54.6%), while 7% refers to loans to and receivables from banks (2013: 12.0%).
Management is confident in its ability to continue to control and sustain acceptable exposure to credit risk.

78 Annual Report 2014 · UniCredit Bank d.d.
Notes to the fi nancial statementsfor the year ended 31 December 2014 (CONTINUED)(all amounts are expressed in thousands of KM, unless otherwise stated)
35. Risk management (continued)
35.1 Credit risk (continued)
35.1.2 Concentration of assets and liabilities toward state sector
The table below shows the concentration of placements and liabilities to the State of Bosnia and Herzegovina and the entities: the Federation of B&H and Republika Srpska:
31 December
201431 December
2013Current account with CBBH (Note 15) 150,698 228,679Obligatory reserve at CBBH (Note 16) 267,416 243,005Bonds of the Government of the Federation of B&H (Note 18) 171,961 88,397Treasury bills of the Government of the Federation of B&H (Note 18) 27,633 13,960Treasury bills of the Government of Republika Srpska (Note 18) 5,334 7,923Current tax liability (307) (282)Deferred tax liability (Note 14) (1,385) (1,402)
621,350 580,280
The Bank had no off-balance sheet sovereign risk exposure at 31 December 2014 and 2013.
In addition, liabilities to state institutions are as follows:
31 December
201431 December
2013Short-term deposits (13,517) (35,597)Off-balance-sheet exposure 3 5
Exposure to local and regional (cantonal) institutions is not included in the above analysis. The Bank has no other signifi cant concentrations of risk.
Furthermore, at the reporting period date KM 38,911 thousand (2013: KM 45,487 thousand) of the Bank’s balance-sheet exposure to corporate customers is secured by the State’s guarantees.
35.1.3 Real estate market trends
According to latest information from the Agency for Statistics of Bosnia and Herzegovina in the fi rst nine months of 2014 the number of completed dwellings was 1,561, which is 8.4% more than in the same period of 2013. Unfi nished apartments at the end of the third quarter of 2014 was 2,125, which is 28.8% less compared to the same period last year.

79UniCredit Bank d.d. · Annual Report 2014
35. Risk management (continued)
35.1 Credit risk (continued)
35.1.3 Real estate market trends (continued)
Basic characteristics of BH real estate market in 2014 are relatively stable real estate prices. Indications are that the real estate market in Bosnia and Herzegovina, especially Sarajevo, is slowly recovering from the effects of the economic crisis. In the capital of Bosnia and Herzegovina most turnover is through apartments of smaller sizes, up to 60m2. Customers are usually young couples, a way of financing is through loans. Every year there was a significant number of customers from the diaspora of Bosnia and Herzegovina.
In Bosnia and Herzegovina there is insufficient continuously guided and accurate statistics that can provide precise information on developments in real estate prices.
After the founding of the Association in the field of real estate in Bosnia and Herzegovina, in 2014 issued the first licenses to members of the Association who in the first group passed the licensing process of several months for certified appraiser of market value. It is a process of standardization of appraisals in accordance with the standards of the Royal Institute in London (RICS). The primary role of the Association is to set up and maintain the highest professional standards of business, education, ethics and professional conduct of its members.
35.1.4 Rescheduled and restructured receivables
Loan restructuring is done for clients where the focus of the business relationship shifted from making profit to mitigating losses on lending exposure at a stage when legal action for mitigating losses is not yet needed. The goal is timely identification of clients where restructuring would enable them to continue in business and to mitigate or prevent further losses for the Bank.
Restructuring activities are based on cooperation with other organisational parts of the Bank, which identify clients/exposures that should be the subject of restructuring, and include: defining the appropriate restructuring strategy, analysing restructuring applications, suggesting measures and making recommendations for restructuring, monitoring progress, monitoring the portfolio, assessing the level of impairment and the Bank’s proposed measures to improve collateral coverage in order to strengthen its position in the collection of receivables.
Number of finished apartments in BiH at the end of third quarter 2014
2010
1,7271,556
1,4401,561
2011 2012 2013 2014
2000
1500
1000
500
0
1,351

80 Annual Report 2014 · UniCredit Bank d.d.
Notes to the fi nancial statementsfor the year ended 31 December 2014 (CONTINUED)(all amounts are expressed in thousands of KM, unless otherwise stated)
35. Risk management (continued)
35.1 Credit risk (continued)
35.1.4 Rescheduled and restructured receivables (continued)
Compared to the end of 2013, the restructured corporate portfolio has increased in volume by 13% in 2014, amounting to KM 123,238 thousand (2013: KM 109,096 thousand). The increase in the portfolio is the result of migration from the point of client jurisdiction with regular collection of portfolio.The rate of provisioning of this portfolio as of 31 December 2014 was 32% (2013: 20%).
On the other hand, the restructured retail portfolio recorded increase of 42%, amounting to KM 4,472 thousand (2013: KM 7,760 thousand), with provisions amounting to 17% of the portfolio (2013: 15%). An apparent decline in the portfolio as of March 2014 is a result of pre-segmentation of clients from the restructuring portfolio to the standard portfolio as a result of the realisation of return criteria.
35.1.5 Analysis by overdue receivables (non-performing loan portfolio) and collateral
Impairment allowance coverage of the non-performing loan portfolio is 79.7% (2013: 75.9%).
31 December2014
31 December2013
Retail loansLoans that are neither past due nor impaired 1,356,388 1,220,947Past due loans that are not impaired 58,890 67,374Impaired loans 89,793 98,050
Gross 1,505,071 1,386,371Less: allowance for impairment losses (94,102) (92,502)
Net 1,410,969 1,293,869
Corporate , including state and public sectorLoans that are neither past due nor impaired 999,374 925,674Past due loans that are not impaired 31,994 48,013Impaired loans 238,317 234,366
Gross 1,269,685 1,208,053Less: impairment allowance (201,830) (190,179)
Net 1,067,855 1,017,874
The total impairment allowance for loans to customers is KM 295,932 thousand (2013: KM 282,681 thousand) of which KM 261,556 thousand (2013: KM 252,507 thousand) represents specifi c impairment allowances and the remaining amount of KM 34,376 thousand (2013: KM 30,174 thousand) represents IBNR calculated on a portfolio basis.

81UniCredit Bank d.d. · Annual Report 2014
35. Risk management (continued)
35.1 Credit risk (continued)
35.1.5 Analysis by overdue receivables (non-performing loan portfolio) and collateral (continued)
a) Loans that are neither past due nor impaired
Loans to customers are monitored and systematically reviewed. The objective of the loan portfolio monitoring is to reduce credit risk cost and improve the quality of the Bank’s loan portfolio by timely identification of potentially risky customers and a structured and targeted management of the business relationship with those customers.
Retail Corporate, including state and public sector
Cash and consumer
loans
Credit cards and overdrafts
Housing loans
Sole traders Total Large Medium Small Total
31 December 2014Standard monitoring 958,021 159,285 239,013 69 1,356,388 451,129 328,547 91,101 870,776Special monitoring - - - - - 105,723 21,668 1,206 128,597
958,021 159,285 239,013 69 1,356,388 556,852 350,215 92,307 999,374
31 December 2013Standard monitoring 818,661 153,194 248,896 196 1,220,947 434,491 300,141 94,478 829,110Special monitoring - - - - - 87,267 5,695 3,602 95,564
818,661 153,194 248,896 196 1,220,947 521,758 305,836 98,080 925,674

82 Annual Report 2014 · UniCredit Bank d.d.
Notes to the fi nancial statementsfor the year ended 31 December 2014 (CONTINUED)(all amounts are expressed in thousands of KM, unless otherwise stated)
35. Risk management (continued)
35.1 Credit risk (continued)
35.1.5 Analysis by overdue receivables (non-performing loan portfolio) and collateral (continued)
b) Past due loans that are not impaired
Retail Corporate, including state and public sector
Cash and consumer
loans
Credit cards and overdrafts
Housing loans
Sole traders Total Large Medium Small Total
31 December 2014Past due up to 30 days 29.849 12.245 8.303 5 50.402 4.512 22.058 3.747 30.316Past due 31 to 60 days 4.742 1.393 1.254 3 7.392 - 763 659 1.442Past due 61 to 90 days 556 229 311 - 1.096 - - 255 255
35.147 13.867 9.868 8 58.890 4.512 22.821 4.661 31.994
Estimated value of collateral 1.281 - 3.222 - 4.503 - 1.902 648 2.550
31 December 2013Past due up to 30 days 32.863 14.140 11.872 - 58.875 26.004 17.071 2.798 45.873Past due 31 to 60 days 4.461 1.444 1.484 - 7.389 - 817 1.181 1.998Past due 61 to 90 days 574 316 220 - 1.110 - - 142 142
37.898 15.900 13.576 - 67.374 26.004 17.888 4.121 48.013
Estimated value of collateral 1.145 - 3.786 - 4.931 7.812 1.392 687 9.891
Estimated values of properties pledged as collateral are based on valuations done by authorised surveyors/agency upon initial approval of a loan or possible subsequent re-evaluation, weighted by the value of the loan in the total exposure secured by the same collateral, up to the estimated value of collateral. The value of deposits and State guarantees is weighted in the same manner up to the outstanding balance of related secured exposure. Guarantors, co-debtorship and bills of exchange are not valued in the table above although they are usually required as collateral.

83UniCredit Bank d.d. · Annual Report 2014
35. Risk management (continued)
35.1 Credit risk (continued)
35.1.5 Analysis by overdue receivables (non-performing loan portfolio) and collateral (continued)
c) Non-performing loans (impaired loans)
Gross amount of non-preforming loans amounts to KM 328,110 thousand (2013: KM 332,416 thousand). The carrying value of impaired loans amounts to KM 66,554 thousand (2013: KM 79,909 thousand). The breakdown of the net amount of the individually impaired loans to customers, along with the fair value of related collateral held by the Bank as security, is as follows:
Retail Corporate, including state and public sector
Cash and consumer
loans
Credit cards and overdrafts
Housing loans
Sole traders Total Large Medium Small Total
31 December 2014Non-performing loans 5,641 913 7,793 - 14,347 35,446 12,690 4,070 52,206
Estimated value of collateral 641 - 3,665 - 4,305 21,995 2,564 874 25,416
31 December 2013Non-performing loans 8,400 931 9,491 6 18,828 37,189 18,885 5,007 61,081
Estimated value of collateral 825 - 4,083 - 4,908 26,488 6,085 1,409 33,982
The Bank expects to collect the excess in the carrying value of non-performing loans from the estimated value of the related collateral from sources other than collateral.

84 Annual Report 2014 · UniCredit Bank d.d.
Notes to the fi nancial statementsfor the year ended 31 December 2014 (CONTINUED)(all amounts are expressed in thousands of KM, unless otherwise stated)
35. Risk management (continued)
35.2 Liquidity risk
Liquidity risk is the potential risk that a bank will not be able to meet its obligations as scheduled, in full and without delay. It arises in the Bank’s fi nancing activities and assets and liabilities management. Adjusting its business with regard to liquidity risk is achieved through compliance with the relevant legislation, internal policies for maintenance of liquidity reserves, matching of assets and liabilities and adherence to liquidity limits set by the UniCredit Group.
ALM Department manages liquidity reserves on a daily basis, to enable the funding of clients’ needs and to ensure an optimum balance between continuity and fl exibility of fi nancing through use of sources with different maturities.
The Bank has access to a diverse funding base including various types of retail and corporate and bank deposits, borrowings, subordinated debt, issued debt securities, share capital and reserves. These enhance funding fl exibility and limit dependence on any one source of funds as well as generally ensure better funding cost management.
Needs for short-term liquidity are planned every month for a period of six months and controlled and matched on a daily basis.
The process of liquidity management includes developments of annual plans and development of back-up liquidity plans.
35.2.1 Structural liquidity
Structural liquidity and liquidity gaps are presented in the tables below based on the remaining contractual maturity, with the following exceptions:
1) Current accounts and demand deposits accounts as well as overdrafts of retail and corporate clients are classifi ed using a replication portfolio methodology, which is based on a simulation GMB model, using historical data for the past 3 years.
Long term a vista deposits over a year are for reporting purposes classifi ed as overnight deposits.
2) Securities available-for-sale are classifi ed according to assigned codes of liquidity, which represent the timeframe needed to pledge the security as collateral with a central bank or sell it on the open market.

85UniCredit Bank d.d. · Annual Report 2014
35. Risk management (continued)
35.2 Liquidity risk (continued)
35.2.1 Structural liquidity (continued)
The classification of assets, liabilities and off-balance-sheet items in the tables below differs from the remaining part of the financial statements, as they have been prepared using management reports. Reconciliation is not practicable. Some of the main differences are as follows:
•Other assets include property and equipment, receivables from credit cards and other receivables.
•Other liabilities include credit card payables, provisions for other assets and other fees and liabilities.
• The obligatory reserve includes a part of other funds with CBBH.
•Assets are presented on a gross basis i.e. without deduction of impairment allowances.
• Impaired loans are classified as a separate line item within other assets.
• The nominal value of derivatives is presented within off-balance sheet assets and liabilities, as appropriate.
•Cash in the tables below includes only cash in hand and items in the course of collection, with current accounts being presented within loans and receivables from banks.

86 Annual Report 2014 · UniCredit Bank d.d.
Notes to the fi nancial statementsfor the year ended 31 December 2014 (CONTINUED)(all amounts are expressed in thousands of KM, unless otherwise stated)
35. Risk management (continued)
35.2 Liquidity risk (continued)
35.2.1 Structural liquidity (continued)
31 December 2014 (in KM million) TOTAL Overnight
Up to 1 month
1 to 3 months
3 months to 1 year
1 to 3 years
3 to 10 years
Over 10 years
Gap - 284 190 5 103 156 (297) (441)
Assets 4,440 791 530 298 740 652 970 459
Statement of fi nancial position 4,220 791 408 220 720 652 970 459Loans to and receivables from customers 2,165 2 97 202 340 618 884 22Retail 1,156 2 27 49 175 357 527 19Corporate 1,009 - 70 153 165 261 357 3
Mortgage loans to customers 183 - 1 3 14 34 86 45Retail 183 - 1 3 14 34 86 45
Securities 315 45 2 - 268 - - -Financial assets available-for-sale 315 45 2 - 268 - - -
Loans to and receivables from banks 918 591 308 15 4 - - -Current accounts 173 173 - - - - - -Deposits 327 - 308 15 4 - - -Obligatory reserve at CBBH 418 418 - - - - - -
Other assets 639 153 - - 94 - - 392Cash 153 153 - - - - - -Impaired loans 327 - - - - - - 327Other assets 161 - - - 94 2 - 65
Off-balance sheet 220 - 122 78 20 - - -Derivatives 220 - 122 78 20 - - -Unused credit facilities - - - - - - - -
Liabilities 4,440 507 340 293 637 496 1,267 900
Statement of fi nancial position 4,220 502 218 215 609 496 1,280 900Demand deposits 1,975 373 86 73 164 190 1,089 -Retail 1,269 216 25 25 64 89 850 -Corporate 706 157 61 48 100 101 239 -
Time deposits 974 128 91 78 204 291 182 -Retail 656 5 70 58 132 222 169 -Corporate 318 123 21 20 72 69 13 -
Liabilities to banks 257 1 41 64 127 15 9 -Borrowings 39 - 2 3 10 15 9 -Current accounts and deposits 218 1 39 61 117 - - -
Other liabilities and equity 1014 - - - 114 - - 900Equity 579 - - - - - - 579Other liabilities 114 - - - 114 - - -Provisions 321 - - - - - - 321
Issued debt securities - - - - - - - -
Off-balance sheet 220 5 122 78 28 - (13) -Derivatives 220 - 122 78 20 - - -Contingent liabilities - 5 - - 8 - (13) -

87UniCredit Bank d.d. · Annual Report 2014
35. Risk management (continued)
35.2 Liquidity risk (continued)
35.2.1 Structural liquidity (continued)
31 December 2013 (in KM million) TOTAL Overnight
Up to 1 month
1 to 3 months
3 months to 1 year
1 to 3 years
3 to 10 years
Over 10 years
Gap (1) 261 342 91 55 24 (259) (515)
Assets 4,147 701 774 246 566 601 952 307
Statement of financial position 3,981 701 613 241 566 601 952 307Loans to and receivables from customers 2,134 4 105 238 339 562 863 23Retail 1,118 2 32 54 177 333 503 17Corporate 1,016 2 73 184 162 229 360 6
Mortgage loans to customers 186 - 1 3 15 39 89 39Retail 186 - 1 3 15 39 89 39
Securities 142 27 3 - 112 - - -Financial assets available-for-sale 142 27 3 - 112 - - -
Loans to and receivables from banks 1,041 537 504 - - - - -Current accounts 65 65 - - - - - -Deposits 504 - 504 - - - - -Obligatory reserve at CBBH 472 472 - - - - - -
Other assets 478 133 - - 100 - - 245Cash 133 133 - - - - - -Impaired loans 177 - - - - - - 177Other assets 168 - - - 100 - - 68
Off-balance sheet 166 - 161 5 - - - -Derivatives 166 - 161 5 - - - -Unused credit facilities - - - - - - - -
Liabilities 4,148 440 432 155 511 577 1,211 822
Statement of financial position 3,982 438 271 150 504 577 1,220 822Demand deposits 1,801 304 83 73 160 193 988 -Retail 995 166 25 25 61 75 643 -Corporate 806 138 58 48 99 118 345 -
Time deposits 913 129 81 74 181 226 222 -Retail 730 128 64 60 118 155 205 -Corporate 183 1 17 14 63 71 17 -
Liabilities to banks 342 5 107 3 59 158 10 -Borrowings 61 - 9 3 18 21 10 -Current accounts and deposits 281 5 98 - 41 137 - -
Other liabilities and equity 926 - - - 104 - - 822Equity 523 - - - - - - 523Other liabilities 104 - - - 104 - - -Provisions 299 - - - - - - 299
Issued debt securities - - - - - - - -
Off-balance sheet 166 2 161 5 7 - (9) -Derivatives 166 - 161 5 - - - -Contingent liabilities - 2 - - 7 - (9) -

88 Annual Report 2014 · UniCredit Bank d.d.
Notes to the fi nancial statementsfor the year ended 31 December 2014 (CONTINUED)(all amounts are expressed in thousands of KM, unless otherwise stated)
35. Risk management (continued)
35.2 Liquidity risk (continued)
35.2.2 Future cash fl ows from fi nancial instruments
The following table details the Bank’s remaining contractual maturity for its non-derivative fi nancial assets. The table has been drawn up based on the undiscounted contractual maturities of the fi nancial assets including interest that will be earned on those assets except where the Bank anticipates that the cash fl ow will occur in a different period.
Maturity for non-derivative fi nancial assets
Weighted average
effective interest rate
Less than 1 month
1 to 3 months
3 to 12 months 1 to 5 years Over 5 years Total
31 December 2014Non-interest bearing - 149,449 - - - - 149,449Variable interest rate instruments 7.77% 777,802 158,355 388,842 1,056,460 587,628 2,969,087Fixed interest rate instruments 5.90% 354,939 154,778 213,448 467,778 32,243 1,223,186
1,282,190 313,133 602,290 1,524,238 619,871 4,341,722
31 December 2013 Non-interest bearing - 126,700 - - - - 126,700Variable interest rate instruments 8.03% 751,974 130,091 404,768 1,048,146 480,505 2,815,484Fixed interest rate instruments 5.99% 572,367 172,774 120,018 225,767 19,172 1,110,098
1,451,041 302,865 524,786 1,273,913 499,677 4,052,282
The following table details the Bank’s remaining contractual maturity for its non-derivative fi nancial liabilities. The table has been drawn up based on the undiscounted cash fl ows of fi nancial liabilities based on the earliest date on which the Bank can be required to pay. The table includes both interest and principal cash fl ows.
Maturity for non-derivative fi nancial liabilities
Weighted average
effective interest rate
Less than 1 month
1 to 6 months
6 to 12 months 1 to 5 years Over 5 years Total
31 December 2014Non-interest bearing - 12,691 1,527 4,474 26,156 673 45,521Variable interest rate instruments 1.39% 1,795,832 76,764 286,776 424,236 1,241 2,584,849Fixed interest rate instruments 2.40% 58,081 108,291 110,176 349,625 28,610 654,783
1,866,604 186,582 401,426 800,017 30,524 3,285,153
31 December 2013 Non-interest bearing - 6,360 677 2,248 17,352 26 26,663Variable interest rate instruments 1.33% 1,671,795 61,376 277,416 439,617 3,212 2,453,416Fixed interest rate instruments 2.65% 42,372 148,126 207,566 230,547 12,556 641,167
1,720,527 210,179 487,230 687,516 15,794 3,121,246
The Bank expects to meet its other obligations from operating cash fl ows and proceeds of maturing fi nancial assets.

89UniCredit Bank d.d. · Annual Report 2014
35. Risk management (continued)
35.3 Market risk
Market risk is defined as the effect that price changes in the market have on the income statement and balance sheet of the Bank.
Basic risk factors include:
• interest rate risk;
• credit spread risk,
• currency risk and
• equity risk.
Overall exposure to market risks is monitored within Risk Management using various methodologies and techniques of risk measurement. The existing limits of market risks are reviewed at least once a year. Alterations to the limits of the Group are coordinated by Zagrebačka banka.
In addition to development and implementation of techniques for measuring market risk, the Bank continually works on improving its business processes and quality of data.
Market risk measurement techniques:
35.3.1 Value at Risk
Value-at-Risk methodology (VaR) is used to estimate the market risk of the positions held and the maximum potential losses expected by the Bank.
VaR is a statistically based estimate of the potential loss on the current portfolio from adverse market movements. It expresses the expected maximum amount that the Bank might lose, to a predefined level of confidence and for a certain holding period until positions could be closed. Loss can occur in the overall or individual positions, based on assumptions of various market variables.
The risk model calculates VaR daily with a confidence level of 99%. The calculation is based on the daily observations indicators data obtained in the last two years.
VaR according to risk types in 2014 and 2013 is as follows:
Minimum 2014 Average 2014 Maximum 2014 End of 2014Interest risk (18) (29) (107) (115)Currency risk - (2) (5) (3)Securities price risk (104) (187) (250) (630)
Total VaR (108) (189) (264) (688)
Minimum 2013 Average 2013 Maximum 2013 End of 2013Interest risk (2) (29) (107) (35)Currency risk - (2) (5) -
Total VaR (107) (187) (250) (121)

90 Annual Report 2014 · UniCredit Bank d.d.
Notes to the fi nancial statementsfor the year ended 31 December 2014 (CONTINUED)(all amounts are expressed in thousands of KM, unless otherwise stated)
35. Risk management (continued)
35.3 Market risk (continued)
35.3.1 Value at Risk (continued)
The quality of the VaR model is continuously monitored by backtesting.
All negative synthetic changes in market value that are beyond VaR are considered during backtesting violations.
Back-testing is the comparison of actual trading results with the measurement of risk generated by the model during the period of one year (250 working days).
The statistical limitations of back-testing supervisors have introduced a framework for supervisory interpretation of the test results.
The table below shows the result of back testing of regulatory trading book. In 2014 one backtesting violation was recorded.
2.1.20
14
2.2.20
14
2.3.20
14
2.4.20
14
2.6.20
14
2.7.20
14
2.10.2
014
2.12.2
014
2.11.2
014
2.9.20
14
2.8.20
14
2.5.20
14
6.000.000
4.000.000
2.000.000
-2.000.000
-4.000.000
-6.000.000
0
IMOD VaR IMOD VaR preslikan BT UniCredit Bank d.d. - Backtesting
35.3.2 Stress-testing
Stress-testing is used to evaluate the effect of market risks on the Bank’s portfolio. In the stress-testing process the Bank currently covers the following risk categories - currency risk and interest rate risk:
•Currency risk is tested for individual currencies and currency groups - testing includes appreciation and depreciation shocks of 5%, 10% and 30%.
• Interest rate risk is tested by each currency for the Bank’s overall position. The scenarios include parallel shifts in interest rates by 200 basis points, including various shocks on currency interest rate curves..
Testing is performed monthly and test results are included into regular ALCO’s reports.

91UniCredit Bank d.d. · Annual Report 2014
35. Risk management (continued)
35.4 Foreign currency risk
Foreign currency risk is the risk of losses caused by adverse exchange rate movements. Foreign currency exposure arises from credit, deposit-taking, investment and trading activities. It is monitored daily in accordance with regulations and internally set limits by UniCredit Group.
Supervision is conducted by individual currencies in total amounts for all assets and liabilities denominated in foreign currency or containing a foreign currency revaluation clause.
Foreign currency risk management is performed in accordance with UniCredit Group standards by setting principles and limits for foreign currency exposures and by monitoring exposures against limits of open foreign currency positions stated in absolute values. The Bank directs bussines activities in order to minimise the gap between assets and liabilities denominated in foreign currency by aligning its positions with set limits.
The carrying amounts of the Bank’s monetary assets and monetary liabilities per currency at the reporting period date were as follows.
KM EUR USD Other currencies Total
As of 31 December 2014
AssetsCash and cash equivalents 267,123 146,890 11,494 45,969 471,476Obligatory reserve at CBBH 267,416 - - - 267,416Loans to and receivables from banks 38,625 195,593 84,764 11,474 330,456Financial assets available-for-sale 225,790 54,500 35,118 3,431 318,839Financial assets at fair value through profit or loss - 18 - - 18Loans and receivables from customers 1,181,509 1,297,314 - - 2,478,823Other receivables 22,903 - - 1 22,904
2,003,366 1,694,315 131,376 60,875 3,889,932
LiabilitiesCurrent accounts and deposits from banks 6,935 88,582 - - 95,517Current accounts and deposits from customers 1,406,604 1,362,544 131,621 60,431 2,961,200Financial liabilities at fair value through profit or loss - 17 - - 17Borrowings and subordinated debt 1,744 176,266 - - 178,010Other liabilities 48,756 10,887 197 189 60,029
1,464,039 1,638,296 131,818 60,620 3,294,773
Net position 539,327 56,019 (442) 255 595,159

92 Annual Report 2014 · UniCredit Bank d.d.
Notes to the fi nancial statementsfor the year ended 31 December 2014 (CONTINUED)(all amounts are expressed in thousands of KM, unless otherwise stated)
35. Risk management (continued)
35.4 Foreign currency risk (continued)
KM EUR USD Other currencies Total
As of 31 December 2013
AssetsCash and cash equivalents 323,509 46,822 8,881 44,053 423,265Obligatory reserve at CBBH 243,005 - - - 243,005Loans to and receivables from banks 23,001 346,259 130,337 7,873 507,470Financial assets available-for-sale 102,573 37,423 - 2,937 142,933Financial assets at fair value through profi t or loss - 56 - - 56Loans and receivables from customers 958,352 1,353,391 - - 2,311,743Other receivables 20,514 - - 20,514
1,670,954 1,783,951 139,218 54,863 3,648,986
LiabilitiesCurrent accounts and deposits from banks 1,993 142,395 - - 144,388Current accounts and deposits from customers 1,286,550 1,249,803 135,009 52,907 2,724,269Financial liabilities at fair value through profi t or loss - 49 - - 49Borrowings and subordinated debt 1,745 197,789 - - 199,534Other liabilities 58,612 - - - 58,612
1,348,900 1,590,036 135,009 52,907 3,126,852
Net position 322,054 193,915 4,209 1,956 522,134
35.4.1 Foreign currency sensitivity analysis
The Bank is mainly exposed to EUR and USD. Since Convertible Mark (KM) is pegged to EUR, the Bank is not exposed to risk of change of EUR exchange rate.
The following table details the Bank’s sensitivity to a 10% increase and decrease in KM against USD. 10% is the sensitivity rate used when reporting foreign currency risk internally to key management personnel and represents management’s assessment of the reasonably possible change in foreign exchange rates. The sensitivity analysis includes only outstanding foreign currency denominated monetary items and adjusts their translation at the period end for a 10% change in USD. A positive number below indicates an increase in profi t where KM strengthens 10% against USD. For a 10% weakening of KM against USD, there would be an equal and opposite impact on the profi t, and the balances below would be negative.
USD Impact
31 December2014
31 December2013
Profi t / (loss) (44) 421

93UniCredit Bank d.d. · Annual Report 2014
35. Risk management (continued)
35.5 Interest rate risk
Interest rate risk represents the risk of decrease in asset values caused by adverse interest rate changes. Interest rate changes affect the net present value of future cash flows and consequently net interest income.
Interest rate change risk sources are:
• repricing risk resulting from unfavourable changes in the fair value of assets and liabilities in the remaining period until the next interest rate change;
• yield curve risk as the risk of changes in shape and slope of yield curve; and
• basis risk as the risk of different base rates of corresponding asset and liabilities (e.g. EURIBOR vs LIBOR).
35.5.1 Interest rate sensitivity analysis
The sensitivity analysis below has been determined through the measurement of risk by calculating the net present value of a change in the value of the portfolio in a scenario where the interest rate changes by 0.01% (1 basis point) with the basis point value (BPV) limit applied as the sensitivity measure according to currencies and time periods. Daily compliance limits are set by UniCredit Group.
Sensitivity analysis per currency:
Up to 3 months3 months to 1 year 1 to 3 years 3 to 10 years Over 10 years Total
31 December 2014KM (3) (12) (41) (35) - (91)EUR - (1) 3 (10) (1) (9)USD - 1 (6) - - (5)
(3) (12) (44) (45) (1) (105)
31 December 2013KM 1 3 17 3 (1) 23 EUR 4 1 13 4 - 22USD - 1 2 6 - 9
5 5 32 13 (1) 54
BPV limits are monitored through an internal model, IMOD, which is also used for the calculation of VaR (developed by the UniCredit Group).

94 Annual Report 2014 · UniCredit Bank d.d.
Notes to the fi nancial statementsfor the year ended 31 December 2014 (CONTINUED)(all amounts are expressed in thousands of KM, unless otherwise stated)
35. Risk management (continued)
35.5 Interest rate risk (continued)
35.5.2 Effective interest rates
The table below presents effective interest rates applicable to various balance-sheet categories calculated as the weighted average interest rates for the period:
2014 2013
% %Cash and cash equivalents 0.05 0.04Obligatory reserve at CBBH 0.05 0.03Financial assets available-for-sale 3.48 3.74Loans to and receivables from banks 0.11 0.13Loans and receivables from customers 6.48 6.84Current accounts and deposits from banks 1.25 1.08Current accounts and deposits from customers 1.48 1.51Interest-bearing borrowings 2.64 2.63Subordinated debt 2.87 2.90Issued debt securities 0.00 1.53
35.6 Operational risk
The Bank is exposed to operational risk in all its activities, and as a consequence of this fact, through an established organizational structure of the Bank, on a daily basis tend to affect the spread of culture and awareness of the importance of operational risk management.
The Bank established an appropriate system for recognising, measuring, grading and monitoring of operational risks, aiming at its optimum management and reduction by using the positive experience of the Group regarding operational risks, standards and principles defi ned by the local regulator and the Basel Committee as well as its own fi ndings based on its own experience in this area.
Operational risk management is inbuilt throughout the entire organisational structure of the Bank, through regular strategic management and supervision. In this way the Bank has a special focus on continuous analysis and development of solutions to avoid, control and transfer operational risk to third parties.
The Bank uses standard procedures within its established operational risk management system, which include gathering information about default events (including monitoring of events in which the operational risk is associated with other risks - particularly credit and market risk), monitoring key risk indicators, assessing operational risk when implementing new products/projects/changes, scenario analysis and analysis and reporting on the Bank’s exposure to operational risk, which also includes reporting on the results of operational risk management.
35.7 Reputational risk
Reputational risk represent current or future risk that may affect the Bank’s revenues or equity as a result of unfavorable seeing of the Bank’s image by the customers, other counterparties, shareholders/investors, regulator or employees (stakeholders).

95UniCredit Bank d.d. · Annual Report 2014
35. Risk management (continued)
35.7 Reputational risk (continued)
All the Bank’s activities are exposed to reputational risk. According to the standards of UniCredit Group, in its daily operating activities, the Bank is systematically approaching to the strategy, monitoring and evaluation for each individual case of reputational risk.
The Bank recognizes the exceptional importance of preventing and mitigating actions in reputational risk management. Responsibility for reputational risk management is distributed through the Bank’s overall hierarchical structure and continuous rising of awareness on importance of reputational risk represents one of the underlying basics of the risk management.
35.8 Capital management
In compliance with laws, regulations and internal acts the Bank monitors and reports quarterly to regulators on its guarantee capital, risk-weighted assets and capital adequacy ratios.
Although not required by the local regulator, the Bank as a member of UniCredit Group also monitors and reports on capital adequacy according to Basel III methodology as required.
Through its management reporting the Bank also regularly monitors capital movements, capital adequacy ratios as well as all changes in methodology which will have an impact on its capital.
During 2014 the Bank has been in compliance with all regulatory capital requirements and according to the local regulations had a capital adequacy ratio of 16.4% as at 31 December 2014.
On 31 December 2014 the Bank has achieved a lower adequacy compared to the end of 2013, and the biggest effect is the result of exclusion of retained earnings from previous years from the initial capital in the amount of KM 73.9 million, considering that according to the new decision of FBA profits can be included into the core capital only when the Assembly of the Bank decides that the same profit is unconditionally, completely and unrestrictedly at all times available to cover losses and that is subordinated to all liabilities of the Bank.
In addition to changes in the recognition of retained earnings and profit for the year, following is introduced:
• specific requirements of financial leverage rates (31 December 2015) ratio capital to exposures ≥ 6%;
• restrictions on the amount and conditions of recognition of items of additional capital and relationship to core capital as follows:
- gradual reduction of the share of additional capital in relation to the share capital by half (31 December 2015), ie to a third (31 December 2016);
- gradual reduction of the share of general provision for loan losses to 1.625% (31 December 2015), ie to 1.25% (31 December 2016);
- precise and additional conditions for the recognition of subordinated debt (the introduction of depreciation in the last five years before the expiry of the agreed period), (at 31 December 2015).
• new deductions from core capital:
- deferred tax assets
- negative revaluation reserve on the basis of the effects of changes in the fair value of assets and
- intangible assets defined in accordance with the applicable accounting framework.

96 Annual Report 2014 · UniCredit Bank d.d.
Notes to the fi nancial statementsfor the year ended 31 December 2014 (CONTINUED)(all amounts are expressed in thousands of KM, unless otherwise stated)
35. Risk management (continued)
35.8 Capital management (continued)
The new decision strengthens core capital, so that additional capital can be a maximum of half the core capital (from 31 December 2015), or 1/3 of core capital (from 31 December 2016).
The minimum prescribed capital adequacy ratio is 12%, with a minimum participation of core capital of 8% (at 31 December 2015), ie 9% (at 31 December 2016).
Net capital for the purpose of calculating the capital adequacy ratio according to the methodology of FBA consists of:
• core capital – share capital (net of treasury shares, intangible assets, defferred tax assets and negative revaluation reserve on the basis of the effects of changes in the fair value of the assets), share premium, retained earnings and reserves created by retained earnings adopted by the Assembly of the Bank;
• supplement capital – share capital in permanent shares on the basis of cash payments, subordinated debt, positive revaluation reserves from the effects of changes in the fair value of the property, and general reserves calculated at prescribed rates by the regulator (see below).
The allowance for general provision included as Tier 2 capital does not comprise allowances actually recognised by the Bank in its fi nancial statements. Rather, it represents an amount calculated on eligible assets (performing balance-sheet and off-balance-sheet exposure as defi ned by FBA) at rates prescribed by FBA, in the amount of KM 65,820 thousand.
As explained in Note 4, FBA also requires amounts equivalent to specifi c provisions calculated in accordance with FBA rules to be excluded or deducted from capital for capital adequacy assessment purposes, to the extent that those specifi c provisions exceed the total impairment allowances recognised by the Bank in the fi nancial statements. In accordance with the above requirements, the Bank has excluded from capital an amount of KM 46,007 thousand of equity recognised in its fi nancial statements. Out of this amount, KM 20,682 thousand were already recognized as within the equity in the fi nancial statements; the rest of KM 25,325 thousand was presented as deducting item.
Total weighted risk used for calculation of the capital adequacy includes:
• risk-weighted assets and credit equivalents and
•weighted operative risk.
The capital adequacy ratio according to Basel II methodology for 2014 was also signifi cantly above the prescribed limit.

97UniCredit Bank d.d. · Annual Report 2014
35. Risk management (continued)
35.8 Capital management (continued)
The composition of the Bank’s net capital and ratios for the years ended 31 December 2014 and 2013 is given in the table below (information on risk-weighted assets is unaudited at the date of issuance of this report).
2014 2013* 2013
Core capital Ordinary shares 119,011 119,011 119,011 Treasury shares (81) (81) (81)Share premium 48,317 48,317 48,317 Reserve and retained earnings 316,666 316,704 390,638 Intangible assets (11,447) (14,263) (14,263)Defferred tax assets (13) - -Negative revalorisation reserves due to effects of fair value changes of assets (426) (175) -
Total share capital 472,027 469,513 543,622
Supplement capital Allowance for general provision under FBA rules 65,820 58,599 58,599 Positive revalorisation reserves due to effects of fair value changes of assets 241 184Preference shares 184 184 184 Subordinated debt 19,558 19,558 19,558
Total additional capital 85,803 78,525 78,341
Deductions from capital Adjustment for shortfall in regulatory reserves per regulatory requirement (25,325) (21,978) (21,978)
Total deductions from capital (25,325) (21,978) (21,978)
Net capital 532,505 526,060 599,985
Risk weighted assets Credit-risk – weighted assets 3,010,181 2,758,021 2,758,021 Other weighted assets 241,270 239,229 239,229
Total risk weighted assets 3,251,451 2,997,250 2,997,250
Capital adequacy ratio 16.4% 17.6% 20.0%
** Modified in accordance to new Decision on Minimum Standards for Bank Capital Management and capital protection, Official Gazette of the Federation of BiH, No. 46/14 - for the comparison purpose only.

98 Annual Report 2014 · UniCredit Bank d.d.
Notes to the fi nancial statementsfor the year ended 31 December 2014 (CONTINUED)(all amounts are expressed in thousands of KM, unless otherwise stated)
36. Fair value measurement
This note provides information about how the Company determines fair values of various fi nancial assets and fi nancial liabilities.
36.1 Fair value of Bank’s fi nancial assets and fi nancial liabilities that are measured at fair value on a recurring basis
Some of the Bank’s fi nancial assets and fi nancial liabilities are measured at fair value at the end of each reporting period. In addition, the information is given about how the fair values of these fi nancial assets and fi nancial liabilities are determined (in particular, the valuation technique(s) and inputs used).
31 December 2014 Fair values
Level 1 Level 2 Level 3 Financial assets available-for-sale (see Note 18)Listed equity securities in Bosnia and Herzegovina (reinsurance) 214 - -Unlisted debt securities in Bosnia and Herzegovina:
Bonds of the Government of the Federation of B&H - 171.961 -Bonds of the Government of Republika Srpska - 25.570 -Treasury bills of the Government of the Federation of B&H - 27.633 -Treasury bills of the Government of Republika Srpska - 5.334 -
Unlisted debt securities in Croatia:Treasury bills of the Government of the Republic of Croatia - 3.431 -
Unlisted debt securities in Austria (banking) - 84.694Unlisted equity securities in Bosnia and Herzegovina - - 2
Foreign currency forward contracts (see Note 19)Assets - 18 -Liabilities - 13 4
31 December 2013 Fair values
Level 1 Level 2 Level 3 Financial assets available-for-sale (see Note 18)Listed equity securities in Bosnia and Herzegovina (reinsurance) 214 - -Listed equity securities in Germany and FinlandUnlisted debt securities in Bosnia and Herzegovina: - 88.397 -
Bonds of the Government of the Federation of B&H - 13.960 -Treasury bills of the Government of the Federation of B&H - 7.923 -Treasury bills of the Government of Republika Srpska
Unlisted debt securities in Croatia:Treasury bills of the Government of the Republic of Croatia - 2.937 -
Unlisted debt securities in Austria (banking) - 29.500 -Unlisted equity securities in Bosnia and Herzegovina - - 2
Foreign currency forward contracts (see Note 19)Assets - 56 -Liabilities - 49 -

99UniCredit Bank d.d. · Annual Report 2014
36. Fair value measurement (continued)
36.1 Fair value of Bank’s financial assets and financial liabilities that are measured at fair value on a recurring basis (continued)
Valuation techniques and key inputs
Financial assets available-for-sale
For the securities presented under Level 1 (listed equity securities in Bosnia and Herzegovina) valuation technique is based on quoted bid prices in an active market.
For the securities presented under Level 2 (unlisted debt securities in Bosnia and Herzegovina, Republic of Croatia and Austria) discounted cash flow valuation technique is applied. Instruments that are not quoted in an active market are valued by using the models which include maximum relevant and available inputs and, also, unobservable inputs, but at minimum level. Depending on significance of inputs that are unobservable, debt securities are awarded with Level 2 or Level 3. Valuation is performed based on discounted cash flow, considering the last available rate on owned or similar debt securities as yield rate.
For the securities presented under Level 3 (unlisted equity securities in Bosnia and Herzegovina) discounted cash flow valuation technique is applied. Significant unobservable inputs are long-term revenue growth rates. Relationship of unobservable inputs to fair value is reflected as the higher the revenue growth rate, as the higher the fair value.
Foreign currency forward contracts
Valuation technique applied for forward contracts presented under Level 2 is discounted cash flow. Future cash flows are estimated based on forward exchange rates (from observable forward exchange rates at the end of the reporting period) and contract forward rates, discounted at a rate that reflects the credit risk of various counterparties.
There were no transfers between Level 1 and Level 2 during 2014 and 2013.

100 Annual Report 2014 · UniCredit Bank d.d.
Notes to the fi nancial statementsfor the year ended 31 December 2014 (CONTINUED)(all amounts are expressed in thousands of KM, unless otherwise stated)
36. Fair value measurement (continued)
36.2 Fair value of the Bank’s fi nancial assets and fi nancial liabilities that are not measured at fair value on a recurring basis (but fair value disclosures are required)
Except as detailed in the following table, the Management consider that the carrying amounts of fi nancial assets and fi nancial liabilities recognized in the fi nancial statements approximate their fair values.
31 December 2014 31 December 2013
Carrying amount Fair value Carrying amount Fair value
Financial assets Loans and receivables:
- Loans and receivables from customers 2,478,823 2,609,468 2,311,743 2,462,707
Financial liabilitiesFinancial liabilities held at amortised cost:
- Current accounts and deposits from customers 2,961,200 2,982,685 2,724,269 2,738,952- Borrowings 158,316 158,437 179,832 178,941
Fair value hierarchy as at 31 December 2014
Level 1 Level 2 Level 3 Total
Financial assets Loans and receivables:
- Loans and receivables from customers - 664,126 1,945,342 2,609,468
- 664,126 1,945,342 2,609,468
Financial liabilitiesFinancial liabilities held at amortised cost:
- Current accounts and deposits from customers - 2,982,685 - 2,982,685- Borrowings - 158,437 - 158,437
- 3,141,122 - 3,141,122
Presumptions used for estimate and measurement of fair value of particular fi nancial instruments for 2014 are based on requirements of IFRS 13, by applying the methodology developed on UnICredit Group level.
The fair values of the fi nancial assets and fi nancial liabilities included in the level 2 and level 3 categories above have been determined in accordance with generally accepted pricing models based on a discounted cash fl ow analysis, with the most signifi cant inputs being the discount rate that refl ects the credit risk of counterparties and the new, this year introduced, concept of risk neutral PD parameter based on market parameters.

101UniCredit Bank d.d. · Annual Report 2014
36. Fair value measurement (continued)
36.2 Fair value of the Bank’s fi nancial assets and fi nancial liabilities that are not measured at fair value on a recurring basis (but fair value disclosures are required) (continued)
For the purpose of classifi cation of instruments in fair value hierarchy (level 2 or level 3), a value limit / materiality of the difference between the fair value of risk-free and full fair value was established. If the determined difference is greater than 5% instrument is classifi ed as level 3. Accordingly, if the total fair value is not signifi cantly different from the risk-free fair value (less than 5%), the instrument is classifi ed as level 2.
In order to determine fair value and leading to lower dependence on the concept of internal parameters in 2014 an approach to risk neutral approach for estimating fair value was introduced.
This approach has no impact on the assessment methodology, but it does on loan parameters calculations. All parameters related to established loan ranges (spread) are supplemented by risk neutral approach based on market values. New parameters are included in the calculation of the market premium and correlation of return of assets and markets.
The table shows the calculations of fair value for performing loans and deposits from customers with fi xed and variable interest rates.
Fair value of non-performing loans of clients is equaled to book value.
36.3 Reconciliation of Level 3 fair value measurements
Fair value of unlisted equity securities in Bosnia and Herzegovina equity cannot be reliably measured. Therefore, they are measured at cost, as they have no material impact on the Bank’s fi nancial statements.
37. Approval of the fi nancial statements
The fi nancial statements on the pages 28 to 101 were approved by the Management Board on 13 February 2015 for the submission to the Supervisory Board:
Director
Ivan Vlaho
Chief Financial Offi cer
Gordan Pehar
Director Chief Financial Offi cer

102 Annual Report 2014 · UniCredit Bank d.d.
The financial statements presented in the form prescribed by the Regulations on the content and form of financial statements for banks and financial institutions
BALANCE SHEET (Statement of financial position as at 31 December 2014) in KM
These financial statements include Balance Sheet (statement of financial position as at 31.12.2014) in the form that is prescribed by the Regulations on the content and form of financial statements for banks and financial institutions (Official Gazette of FBIH 82/10) and Income Statement (statement on the overall result for the period from 01.01. to 31.12.2014).
Appendix A
ITEMCode for
AOP
Current year
Previous year (initial balance) Gross
Impairment value
Net(3-4)
1 2 3 4 5 6Assets A. CURRENT ASSETS AND RECEIVABLES (002+008+011+014+018+022+030+031+032+033+034) 0 0 1 4,220,405,334 307,344,053 3,913,061,281 3,677,692,9821. Cash and cash equivalents,gold and receivables from business (003 to 007) 0 0 2 516,842,155 10,220,301 506,621,854 461,066,538a) Cash and cash equivalents in domestic currency 0 0 3 267,459,986 4,351,839 263,108,147 319,491,071b) Other receivables in domestic currency 0 0 4 40,186,857 5,629,019 34,557,838 37,358,461c) Cash and cash equivalents in foreign currency 0 0 5 208,368,139 0 208,368,139 103,773,769d) Gold and other precious metals 0 0 6 36,541 0 36,541 36,541e) Other receivables in foreign currency 0 0 7 790,632 239,443 551,189 406,6962. Deposits and loans in local and foreign currency (009 + 010) 0 0 8 267,415,796 0 267,415,796 242,958,958a) Deposits and loans in domestic currency 0 0 9 267,415,796 0 267,415,796 242,958,958b) Deposits and loans in foreign currency 0 1 0 0 0 0 03. Fee and interest receivables,receivables based on sale and other receivables (012 + 013) 0 1 1 8,108,669 7,191,657 917,012 1,172,406a) Fee and interest receivables,receivables based on sale and other receivables in local currency 0 1 2 7,849,999 6,935,123 914,876 1,167,573b) Fee and interest receivables,receivables based on sale and other receivables in foreign currency 0 1 3 258,670 256,534 2,136 4,8334. Loans and deposits (015 to 017) 0 1 4 2,445,576,718 64,531,918 2,381,044,800 2,392,068,280a) Loans and deposits in local currency 0 1 5 1,094,780,690 22,902,576 1,071,878,114 868,604,010b) Loans and deposits with hedge local currency currency 0 1 6 1,046,258,884 41,382,692 1,004,876,192 1,027,160,899c) Loans and deposits in foreign currency 0 1 7 304,537,144 246,650 304,290,494 496,303,3715. Securities (019 to 021) 0 1 8 316,454,006 1,518 316,452,488 142,097,267a) Securities in local currency 0 1 9 198,469,631 1,518 198,468,113 102,095,034b) Securities with hedge local currency 0 2 0 30,492,780 0 30,492,780 7,922,572c) Securities in foreign currency 0 2 1 87,491,595 0 87,491,595 32,079,6616. Other placements and prepayments (023 to 029) 0 2 2 664,271,118 225,204,329 439,066,789 437,178,582a) Other placements in local currency 0 2 3 2,356,640 2,356,640 0 10,716b) Other placements with hedge local currency 0 2 4 0 0 0 0c) Due placements and current maturities of long-term placements in local currency 0 2 5 619,801,039 202,788,796 417,012,243 414,526,496d) Prepayments in local currency 0 2 6 15,028,715 408,482 14,620,233 12,185,697e) Other placements in foreign currency 0 2 7 11,032,643 7,314,355 3,718,288 3,351,961f) Due placements and current maturities of long-term placements in foreign currency 0 2 8 15,151,392 12,329,399 2,821,993 6,294,974g) Prepayments in foreign currency 0 2 9 900,689 6,657 894,032 808,7387. Inventories 0 3 0 1,736,872 194,330 1,542,542 1,150,951

103UniCredit Bank d.d. · Annual Report 2014
BALANCE SHEET (Statement of financial position as at 31 December 2014) (continued) in KM
8. Fixed available for sale assets 0 3 1 0 0 0 09. Assets of discontinued operations 0 3 2 0 0 0 010. Other assets 0 3 3 0 0 0 011. Value added tax prepayment 0 3 4 0 0 0 0B. FIXED ASSETS (036+041) 0 3 5 222,424,872 158,723,920 63,700,952 67,534,3211. Tangible assets and investment in property (037 to 040) 0 3 6 169,605,974 117,352,375 52,253,599 56,126,218a) Tangible assets owned by the bank 0 3 7 138,670,852 90,895,830 47,775,022 51,939,319b) Investment in property 0 3 8 28,907,685 26,456,545 2,451,140 2,780,641c) Fixed assets acquired under financial lease 0 3 9 0 0 0 0d) Advances and acquired but not brought into use 0 4 0 2,027,437 0 2,027,437 1,406,2582. Intangible assets (042 to 046) 0 4 1 52,818,898 41,371,545 11,447,353 11,408,103a) Goodwill 0 4 2 0 0 0 0b) Investment in development 0 4 3 0 0 0 0c) Intangible assets under financial lease 0 4 4 0 0 0 0d) Other intangible assets 0 4 5 45,960,822 41,371,545 4,589,277 5,666,854e) Advances and assets acquired but not brought into use 0 4 6 6,858,076 0 6,858,076 5,741,249C. DEFFERED TAX ASSETS 0 4 7 13,056 0 13,056 0D. OPERATING ASSETS (001+035+047) 0 4 8 4,442,843,262 466,067,973 3,976,775,289 3,745,227,303E. OFF BALANCE SHEET ASSETS 0 4 9 1,022,475,174 0 1,022,475,174 875,616,377F. TOTAL ASSETS (048+049) 0 5 0 5,465,318,436 466,067,973 4,999,250,463 4,620,843,680
ITEMCode for
AOP Current year Previous year (initial balance)1 2 3 4
A. LIABILITIES (102+106+109+113) 1 0 1 3,336,701,478 3,166,395,6641. Deposits and borrowings (103 to 105) 1 0 2 3,057,093,563 3,017,375,179a) Deposits and interest-bearing borrowings in domestic currency 1 0 3 1,368,793,464 1,250,701,105b) Hedging deposits and borrowings 1 0 4 79,637,676 80,934,041c) Deposits and interest-bearing borrowings in foreign currency 1 0 5 1,608,662,423 1,685,740,0332. Interests and fees (107+108) 1 0 6 35,253 43,710a) Interests and fees in domestic currency 1 0 7 16,852 17,562b) Interests and fees in foreign currency 1 0 8 18,401 26,1483. Securities (110 to 112) 1 0 9 0 0a) Securities in domestic currency 1 1 0 0 0b) Hedging securities i domestic currency 1 1 1 0 0c) Securities in foreign currency 1 1 2 0 04. Other liabilities and accruals (114 to 124) 1 1 3 279,572,662 148,976,775a) Salaries and fees 1 1 4 2,828,580 2,734,345b) Other liabilities in domestic currency , excluding liabilities for tax and contributions 1 1 5 49,686,309 46,143,426c) Tax and contributions ,excluding current and deffered income tax 1 1 6 2,033,193 2,213,086d) Current tax liability 1 1 7 7,586,908 7,052,656e) Deffered tax liability 1 1 8 1,397,540 1,397,540

104 Annual Report 2014 · UniCredit Bank d.d.
The fi nancial statements presented in the form prescribed by the Regulations on the content and form of fi nancial statements for banks and fi nancial institutions (continued)
BALANCE SHEET (Statement of fi nancial position as at 31 December 2014) (continued) in KM
Appendix A
f) Provisions 1 1 9 16,767,058 12,819,509g) Accruals in domestic currency 1 2 0 12,075,584 12,954,073h) Commission operations,AFS assets,discontinued operation assets,subordinated debt liabilities and current liabilities 1 2 1 4,082,782 1,312,925i) Other liabilities in foreign currency 1 2 2 11,767,516 14,920,808j) Accruals in foreign currency 1 2 3 21,262,913 18,559,497k) Commission operations, due and subordinated liabilities and current maturities in goreign currency 1 2 4 150,084,279 28,868,910B. EQUITY (126+132+138+142-148) 1 2 5 640,073,811 578,831,6391. Issued share capital (127+128+129-130-131) 1 2 6 167,283,583 167,283,583a) Share capital 1 2 7 119,195,000 119,195,000b) Other forms of capital 1 2 8 0 0c) Share premium 1 2 9 48,317,277 48,317,277d) Registered but uncontributed capital 1 3 0 0 0e) Repurchase of own shares 1 3 1 228,694 228,6942. Reserves (133 to 137) 1 3 2 337,576,168 337,576,168a) Reserves from profi t 1 3 3 316,894,479 316,894,479b) Other provisions 1 3 4 0 0c) Provision for losses 1 3 5 20,681,689 20,681,689d) General banking risk provisions 1 3 6 0 0e) Transferred reserves (foreign exchange) 1 3 7 0 03. Revaluation reserve (139 to 141) 1 3 8 -117,508 38,194a) Revaluation reserve based on change in value of fi xed assets and intangible investments 1 3 9 0 0b) Revaluation reserve based on change in value of securities 1 4 0 -117,508 38,194c) Other revaluation resererves 1 4 1 0 04. Profi t (143 to 147) 1 4 2 135,331,568 73,933,694a) Profi t for the year 1 4 3 61,397,874 55,570,557b) Unallocated profi t from prior years 1 4 4 73,933,694 18,363,137c) Surplus of income over expenses for the period 1 4 5 0 0d) Unallocated surplus of income over expenses for previous years 1 4 6 0 0e) Retained earnings 1 4 7 0 05. Loss (149+150) 1 4 8 0 0a) Loss for the period 1 4 9 0 0b) Loss from previous years 1 5 0 0 0C. LIABILITIES (101+125) 1 5 1 3,976,775,289 3,745,227,303D. OFF BALANCE SHEET LIABILITIES 1 5 2 1,022,475,174 875,616,377E. TOTAL LIABILITIES (151+152) 1 5 3 4,999,250,463 4,620,843,680

105UniCredit Bank d.d. · Annual Report 2014
INCOME STATEMENT (Statement of financial position as at 31 December 2014) in KM
ITEMCode for
AOPVALUE
Current year Prior year1 2 3 4
A. OPERATING INCOME AND EXPENSES 1. Interest income 2 0 1 179,857,219 180,562,6072. Interest expense 2 0 2 40,967,747 40,467,992Net interest income (201-202) 2 0 3 138,889,472 140,094,615Net interest expense (202-201) 2 0 4 0 03. Fee and commissions income 2 0 5 77,885,217 73,141,6714. Fee and commissions expense 2 0 6 11,250,651 9,681,994Net fee and commission income (205-206) 2 0 7 66,634,566 63,459,677Net fee and commission expense (206-205) 2 0 8 0 05.Gains from sale of securities and shares (210 to 213) 2 0 9 0 0a) Gains from sale of securities at fair value through profit and loss 2 1 0 0 0b) Gains from sale of available for sale securities 2 1 1 0 0c) Gains from sale of securities held to maturity 2 1 2 0 0d) Gains from sale of participation (share) 2 1 3 0 06. Losses from sale of securities and shares (215 to 218) 2 1 4 0 0a) Losses from sale of securities at fair value through profit and loss 2 1 5 0 0b) Losses from sale of available for sale securities 2 1 6 0 0c) Losses from sale of securities held to maturity 2 1 7 0 0d) Losses from sale of participation (share) 2 1 8 0 0Net gains from sale of securities and shares (209-214) 2 1 9 0 0Net losses from sale of securities and shares (214-209) 2 2 0 0 0OPERATING PROFIT (201+205+209-202-206-214) 2 2 1 205,524,038 203,554,292OPERATING EXPENSE (202+206+214-201-205-209) 2 2 2 0 0B. OTHER OPERATING INCOME AND EXPENSE 1. Operating income (224+225) 2 2 3 0 0a) Income from leasing activities 2 2 4 0 0b) Other operating income 2 2 5 0 02. Operating expense (227 to 236) 2 2 6 114,484,425 119,558,115a) Expenses of gross salaries and contribution expense 2 2 7 45,506,124 44,811,251b) Expenses of fees for temporary and occasional work contracts 2 2 8 421,601 389,586c) Other personnel expenses 2 2 9 4,007,209 4,831,081d) Material expenses 2 3 0 3,475,546 3,619,725e) Production services expenses 2 3 1 27,290,004 28,479,858f) Depreciation expenses 2 3 2 10,142,322 13,885,058g) Expenses from leasing activities 2 3 3 0 0h) Non-material expenses (excluding taxes and contributions) 2 3 4 21,976,931 21,829,917i) Tax and contributions expenses 2 3 5 1,664,688 1,711,639j) Other expenses 2 3 6 0 0OTHER OPERATING PROFIT (223-226) 2 3 7 0 0OTHER OPERATING EXPENSE (226-223) 2 3 8 114,484,425 119,558,115C) GAIN AND LOSS ON PROVISIONS 1. Bad debts recovered (240 to 243) 2 3 9 195,252,965 162,614,743a) Income from recovered provisions for placements 2 4 0 172,234,773 142,107,014

106 Annual Report 2014 · UniCredit Bank d.d.
INCOME STATEMENT (Statement of fi nancial position as at 31 December 2014) (continued) in KM
b) Income from recovered provisions for off-balance sheet items 2 4 1 22,666,602 19,765,533c) Income from recovered provision for liabilities 2 4 2 351,590 742,196d) Income from other provisions recovered 2 4 3 0 02. Provision charges (245 to 248) 2 4 4 218,286,003 184,953,304a) Provisions charges for placements 2 4 5 191,042,385 163,513,054b) Provision charges for off-balance sheet items 2 4 6 26,026,223 20,591,828c) Charges based on provisions for liabilities 2 4 7 794,613 764,878d) Other provision charges 2 4 8 422,782 83,544PROVISIONS INCOME (239-244) 2 4 9 0 0PROVISION CHARGES (244-239) 2 5 0 23,033,038 22,338,561D. OTHER INCOME AND EXPENSES 1. Other income (252 to 258) 2 5 1 1,379,311 1,184,733a) Income from bad debts previously written off 2 5 2 37,945 30,646b) Losses from sales of fi xed assets, and intangible investments 2 5 3 102,920 58,159c) Income from reduction in liabilities 2 5 4 0 0d) Income from dividends and shares 2 5 5 9,282 9,478e) Surplus 2 5 6 39,886 26,691f) Other income 2 5 7 1,189,278 1,059,759g) Gains grom discounted operations 2 5 8 0 02. Other expense (260 to 266) 2 5 9 886,529 1,127,696a) Expense from bad debts written off 2 6 0 0 0b) Losses from depreciation and fi xed assets write off, and intangible assets 2 6 1 0 0c) Losses from disposals and write-offs of fi xed and intangible assets 2 6 2 203,317 353,435d) Shortfalls 2 6 3 10,708 8,130e) Inventorywrite-offs 2 6 4 0 0f) Other expenses 2 6 5 672,504 766,131g) Expenses from discontinued operations 2 6 6 0 0GAIN FROM OTHER INCOME AND EXPENSES (251-259) 2 6 7 492,782 57,037LOSS FROM OTHER INCOME AND EXPENSES (259-251) 2 6 8 0 0OPERATING GAIN (221+237+249+267-222-238-250-268) 2 6 9 68,499,357 61,714,653OPERATING LOSS (222+238+250+268-221-237-249-267) 2 7 0 0 0E. INCOME AND EXPENSES FROM CHANGE IN VALUE OFF ASSETS AND LIABILITIES 1. Income from changes in value of assets and liabilities (272 to 276) 2 7 1 124,741,609 145,409,621a) Income based on change in value of placements and receivables 2 7 2 0 0b) Income based on change in value securities 2 7 3 0 0c) Income based on change in value of liabilities 2 7 4 0 0d) Income based on change in value of fi xed assets, investment real estate and intangible investments 2 7 5 0 0e) Income from positive foreign exchange differences 2 7 6 124,741,609 145,409,6212. Expenses from change in value of assets and liabilities (278 to 282) 2 7 7 124,256,186 144,118,853a) Expenses from change in value of placements and receivables 2 7 8 0 0b) Expenses from change in value of securities 2 7 9 0 0c) Expenses from change in value of liabilities 2 8 0 0 0d) Expenses from change in value of fi xed assets, investment real estate and intangible investments 2 8 1 0 81,584e) Expenses from unfavorable foreign exchange differences 2 8 2 124,256,186 144,037,269
The fi nancial statements presented in the form prescribed by the Regulations on the content and form of fi nancial statements for banks and fi nancial institutions (continued)
Appendix A

107UniCredit Bank d.d. · Annual Report 2014
INCOME STATEMENT (Statement of financial position as at 31 December 2014) (continued) in KM
PROFIT ARISING FROM THE CHANGE IN VALUE OF ASSETS AND LIABILITIES (271-277) 2 8 3 485,423 1,290,768LOSS FROM CHANGE IN VALUE OF ASSETS AND LIABILITIES (277-271) 2 8 4 0 0PROFIT BEFORE TAX (269+283-270-284) 2 8 5 68,984,780 63,005,421LOSS BEFORE TAX (270+284-269-283) 2 8 6 0 0F. CURRENT AND DEFFERED INCOME TAX 1. Income tax 2 8 7 7,586,906 7,434,8642. Profit from increase of deffered tax assets and decrease of deffered tax liabilities 2 8 8 0 03. Loss from decrease of deffered tax assets and increase of deffered tax liabilities 2 8 9 0 0PROFIT AFTER TAX (285+288-287-289) ili (288-286-287-289) 2 9 0 61,397,874 55,570,557LOSS AFTER TAX (286+287+289-288) ili (287+289-285-288) 2 9 1 0G. OTHER PROFIT AND LOSSES FOR THE PERIOD 1. Capital gains (293 to 298) 2 9 2 0 0a) Income from decrease of revalorisation reserves in fixed assets and intangible investments 2 9 3 0 0b) Income from change of fair value of securities available for sale 2 9 4 0 0c) Income from transferring financial reports of foreign operations 2 9 5 0 0d) Actuarial income from defined income scheme 2 9 6 0 0e) Effective part of income based on cash flow hedging 2 9 7 0 0f) Other capital gains 2 9 8 0 02. Capital losses (300 to 304) 2 9 9 168,758 261,465a) Losses from change in fair value of securities available for sale 3 0 0 168,758 261,465b) Losses from transferring financial reports of foreign operations 3 0 1 0 0c) Actuarial loss from defined income scheme 3 0 2 0 0d) Effective part of loss from cash flow hedging 3 0 3 0 0e) Other capital gains 3 0 4 0 0NET GAIN/ LOSSES TOTAL RESULT FOR THE PERIOD (292-299) or (299-292) 3 0 5 -168,758 -261,465H. INCOME TAX RELATING TO OTHER TOTAL RESULT FOR THE PERIOD 3 0 6 16,876 26,146OTHER TOTAL RESULT FOR THE PERIOD (305±306) 3 0 7 -151,882 -235,319TOTAL NET PROFIT FOR THE YEAR (290±307) 3 0 8 61,245,992 55,335,238TOTAL NET LOSS FOR THE PERIOD (291±307) 3 0 9 0 0Part od profit/loss attributable to majority shareholders 3 1 0 0 0Part od profit/loss attributable to minority shareholders 3 1 1 0 0Basic earnings per share 3 1 2 515 467Diluted earings per share 3 1 3 515 467Average number of employees based on hours worked 3 1 4 1,249 1,293Average number of employees based on periods end 3 1 5 1,259 1,281

108 Annual Report 2014 · UniCredit Bank d.d.
HEADQUARTERS
Address Kardinala Stepinca b.b. Mostar
Phone 00387 (0) 36 312 112
Fax 00387 (0) 36 356 227
SWITCHBOARD 00387 (0) 36 312 112
00387 (0) 36 312 116
RETAIL 00387 (0) 33 491 708
CORPORATE 00387 (0) 36 312 112
RISK MANAGEMENT 00387 (0) 33 491 708
FINANCE 00387 (0) 36 356 610
GBS 00387 (0) 36 312 112
Address and phone numbers
Appendix B
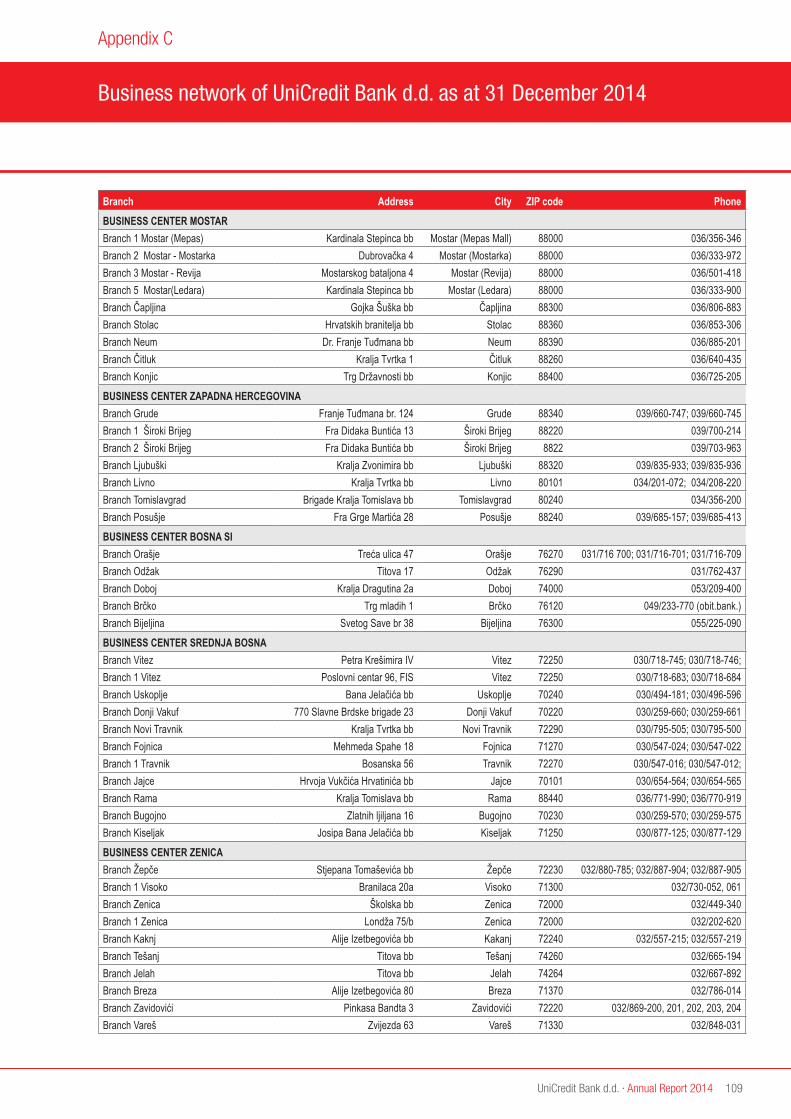
109UniCredit Bank d.d. · Annual Report 2014
Business network of UniCredit Bank d.d. as at 31 December 2014
Appendix C
Branch Address City ZIP code PhoneBUSINESS CENTER MOSTAR Branch 1 Mostar (Mepas) Kardinala Stepinca bb Mostar (Mepas Mall) 88000 036/356-346Branch 2 Mostar - Mostarka Dubrovačka 4 Mostar (Mostarka) 88000 036/333-972Branch 3 Mostar - Revija Mostarskog bataljona 4 Mostar (Revija) 88000 036/501-418Branch 5 Mostar(Ledara) Kardinala Stepinca bb Mostar (Ledara) 88000 036/333-900Branch Čapljina Gojka Šuška bb Čapljina 88300 036/806-883Branch Stolac Hrvatskih branitelja bb Stolac 88360 036/853-306Branch Neum Dr. Franje Tuđmana bb Neum 88390 036/885-201Branch Čitluk Kralja Tvrtka 1 Čitluk 88260 036/640-435Branch Konjic Trg Državnosti bb Konjic 88400 036/725-205BUSINESS CENTER ZAPADNA HERCEGOVINA Branch Grude Franje Tuđmana br. 124 Grude 88340 039/660-747; 039/660-745Branch 1 Široki Brijeg Fra Didaka Buntića 13 Široki Brijeg 88220 039/700-214Branch 2 Široki Brijeg Fra Didaka Buntića bb Široki Brijeg 8822 039/703-963Branch Ljubuški Kralja Zvonimira bb Ljubuški 88320 039/835-933; 039/835-936Branch Livno Kralja Tvrtka bb Livno 80101 034/201-072; 034/208-220Branch Tomislavgrad Brigade Kralja Tomislava bb Tomislavgrad 80240 034/356-200Branch Posušje Fra Grge Martića 28 Posušje 88240 039/685-157; 039/685-413BUSINESS CENTER BOSNA SI Branch Orašje Treća ulica 47 Orašje 76270 031/716 700; 031/716-701; 031/716-709 Branch Odžak Titova 17 Odžak 76290 031/762-437Branch Doboj Kralja Dragutina 2a Doboj 74000 053/209-400 Branch Brčko Trg mladih 1 Brčko 76120 049/233-770 (obit.bank.)Branch Bijeljina Svetog Save br 38 Bijeljina 76300 055/225-090BUSINESS CENTER SREDNJA BOSNA Branch Vitez Petra Krešimira IV Vitez 72250 030/718-745; 030/718-746; Branch 1 Vitez Poslovni centar 96, FIS Vitez 72250 030/718-683; 030/718-684Branch Uskoplje Bana Jelačića bb Uskoplje 70240 030/494-181; 030/496-596Branch Donji Vakuf 770 Slavne Brdske brigade 23 Donji Vakuf 70220 030/259-660; 030/259-661Branch Novi Travnik Kralja Tvrtka bb Novi Travnik 72290 030/795-505; 030/795-500Branch Fojnica Mehmeda Spahe 18 Fojnica 71270 030/547-024; 030/547-022Branch 1 Travnik Bosanska 56 Travnik 72270 030/547-016; 030/547-012;Branch Jajce Hrvoja Vukčića Hrvatinića bb Jajce 70101 030/654-564; 030/654-565Branch Rama Kralja Tomislava bb Rama 88440 036/771-990; 036/770-919Branch Bugojno Zlatnih ljiljana 16 Bugojno 70230 030/259-570; 030/259-575Branch Kiseljak Josipa Bana Jelačića bb Kiseljak 71250 030/877-125; 030/877-129BUSINESS CENTER ZENICA Branch Žepče Stjepana Tomaševića bb Žepče 72230 032/880-785; 032/887-904; 032/887-905Branch 1 Visoko Branilaca 20a Visoko 71300 032/730-052, 061Branch Zenica Školska bb Zenica 72000 032/449-340Branch 1 Zenica Londža 75/b Zenica 72000 032/202-620Branch Kaknj Alije Izetbegovića bb Kakanj 72240 032/557-215; 032/557-219Branch Tešanj Titova bb Tešanj 74260 032/665-194Branch Jelah Titova bb Jelah 74264 032/667-892Branch Breza Alije Izetbegovića 80 Breza 71370 032/786-014Branch Zavidovići Pinkasa Bandta 3 Zavidovići 72220 032/869-200, 201, 202, 203, 204Branch Vareš Zvijezda 63 Vareš 71330 032/848-031

110 Annual Report 2014 · UniCredit Bank d.d.
Business network of UniCredit Bank d.d. as at 31 December 2014 (continued)
Appendix C
Branch Address City ZIP code PhoneBUSINESS CENTER ZENICA (CONTINUED) Branch Olovo Branilaca 17 Olovo 71340 032/829-530Branch Maglaj Aleja ljiljana bb Maglaj 74250 032/609-810, 812, 815, 816BUSINESS CENTER BIHAĆ Branch Bihać Ulica V. Korpusa bb Bihać 77000 037/229-970Branch 1 Bihać Trg slobode 7 Bihać 77000 037/229-270Branch Velika Kladuša Maršala Tita 23 Velika Kladuša 77230 037/776-600Branch 1 Cazin Cazinskih brigada bb Cazin 77220 037/515-012Branch Bosanska Krupa Slavne brigade 511 Bosanska Krupa 77240 037/476-885Branch 1 Sanski Most Trg oslobodilaca bb Sanski Most 79260 037/688-540BUSINESS CENTER SARAJEVO STARI GRAD Branch 1 Sarajevo Maršala Tita 48 Sarajevo. 71000 033/253-375Branch 3 Sarajevo Zagrebačka 2-4 Sarajevo (Kovačići) 71000 033/253-970Branch 4 Sarajevo Alipašina 45a Sarajevo (Ciglane) 71000 033/560-794Branch 11 Sarajevo Gajev trg 2 Sarajevo 71000 033/251- 953Branch 12 Sarajevo Zelenih beretki 24 Sarajevo 71000 033/491-744Branch 13 Sarajevo Branilaca grada 53 Sarajevo 71000 033/491-932Branch 15 Sarajevo Bolnička 25 Sarajevo 71000 033/297-705Branch 16 Sarajevo Fra Anđela Zvizdovića 1 Sarajevo UNITIC 71000 033/ 252-284BUSINESS CENTER NOVO SARAJEVO Branch 2 Sarajevo Zmaja od Bosne 14C Sarajevo 71000 033/723-690Branch 7 Sarajevo Trg međunarodnog prijateljstva 14 Sarajevo 71000 033/776-134Branch 17 Sarajevo Dr.Fetaha Bećirbegovića 23A Sarajevo (OTOKA) 71000 033/721-800Branch 18 Novo Sarajevo Zmaja od Bosne 74 Sarajevo 71000 033/657-147Branch 19 Sarajevo Mustafe Kamarića 5 Sarajevo (Dobrinja ) 71000 033/775-853Branch 20 Sarajevo Brčanska 14 Sarajevo (OTOKA) 71000 033/721-973Branch Vogošća Igmanska 60 Vogošća 71320 033/476-360Branch Ilidža Mala Aleja 10 Ilidža 71210 033/776-146Branch Hadžići Hadželi 153 Hadžići 71240 033/475-390BUSINESS CENTER TUZLA Branch 1 Tuzla Džafer Mahala 53-55 Tuzla 75000 035/259-059; 035/259-044Branch 2 Tuzla Armije BiH 3 Tuzla 75000 035/306-471Branch 3 Tuzla Aleja Alije Izetbegovića 10 Tuzla 75000 035/302-470Branch Gradačac Ulica šehida 1 Gradačac 76250 035/822-500Branch Lukavac Kulina Bana bb Lukavac 75300 035/551-330Branch Gračanica 22 Divizije bb Gračanica 75320 035/701-470Branch Srebrenik 21 Srebreničke Brigade Srebrenik 75350 035/646-093Branch Živinice Ulica Oslobođenja bb Živinice 75270 035/743-145Branch Kalesija Trg šehida bb Kalesija 75260 035/610-110BUSINESS CENTER BANJA LUKA Branch Banja Luka I Krajiškog korpusa br.39 Banja Luka 78000 051/348-055Branch Laktaši Karađorđeva bb Laktaši 78250 051/535-961Branch Prijedor Zanatska bb Prijedor 79101 052/240-765

111UniCredit Bank d.d. · Annual Report 2014


