the workforce metrics & analytics toolkit extract 7-2013 · metrics 2. hr ... the workforce...
TRANSCRIPT

The Ultimate Reference Point for those Seeking to Develop, Implement and Maintain Highly Effective Management Reporting that Captures
Executive Attention
The Workforce Metrics & Analytics Toolkit
© 2013. This Toolkit is copyright and the information contained herein confidential. No part may be reproduced or transmitted in any form or by
any means whatsoever without prior consent
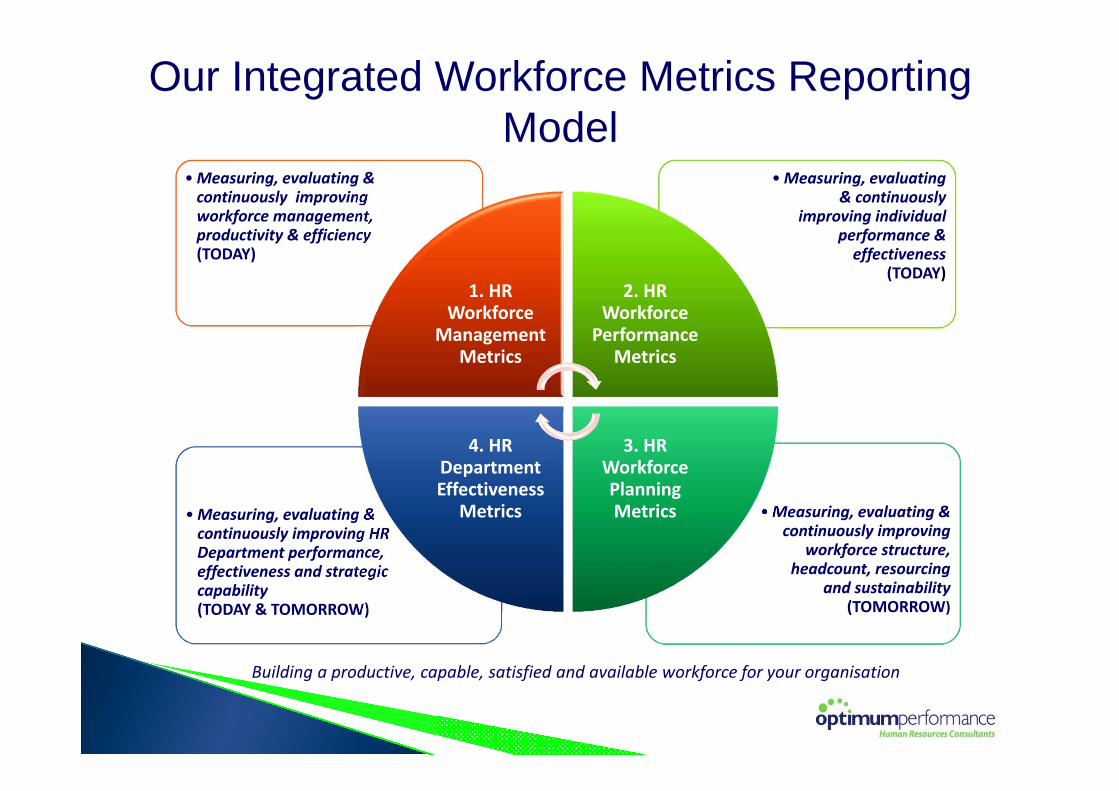
•Measuring, evaluating & continuously improving
workforce structure, headcount, resourcing
and sustainability (TOMORROW)
•Measuring, evaluating & continuously improving HR Department performance, effectiveness and strategic capability (TODAY & TOMORROW)
•Measuring, evaluating & continuously
improving individual performance & effectiveness
(TODAY)
•Measuring, evaluating & continuously improving workforce management, productivity & efficiency (TODAY)
1. HR Workforce
Management Metrics
2. HR Workforce Performance
Metrics
3. HR Workforce Planning Metrics
4. HR Department Effectiveness
Metrics
Our Integrated Workforce Metrics Reporting Model
Building a productive, capable, satisfied and available workforce for your organisation
To provide users with the knowledge, understanding &
practical reporting tools necessary to design, formulate,
format and produce quality workforce management
reporting at every level of their organisation
The Workforce Metrics & Analytics Toolkit Purpose
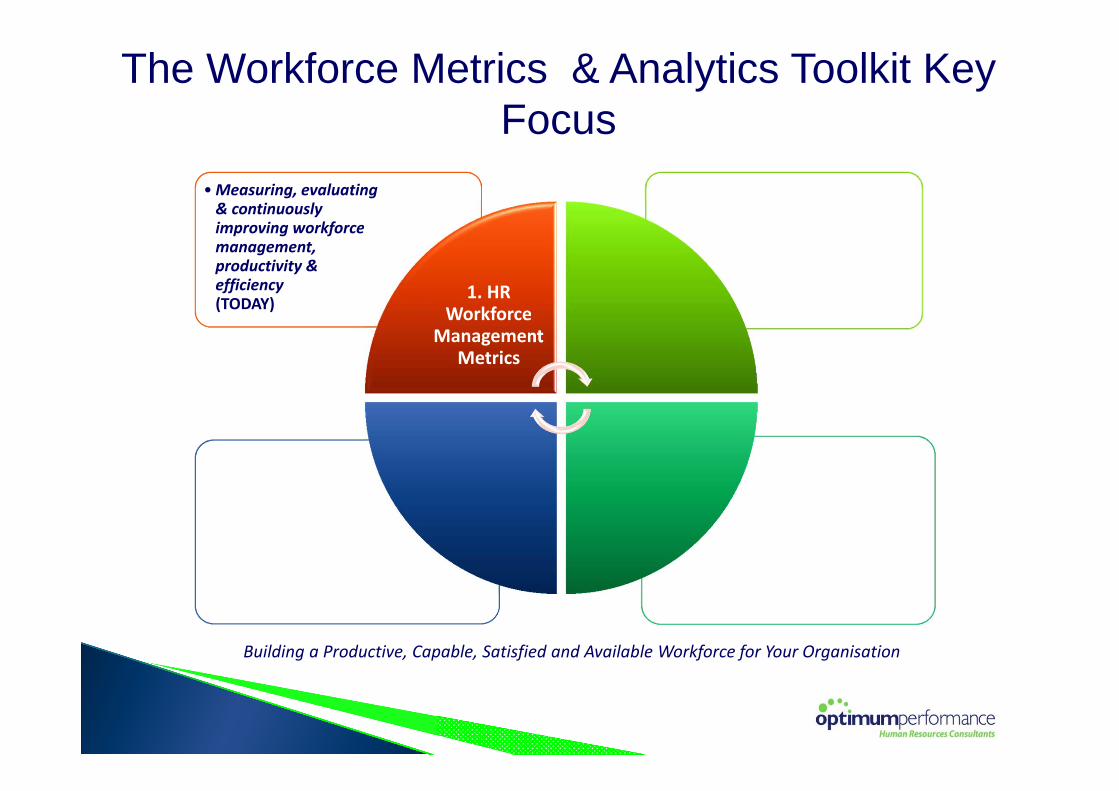
•Measuring, evaluating & continuously improving workforce management, productivity & efficiency (TODAY)
1. HR Workforce
Management Metrics
Building a Productive, Capable, Satisfied and Available Workforce for Your Organisation
The Workforce Metrics & Analytics Toolkit Key Focus
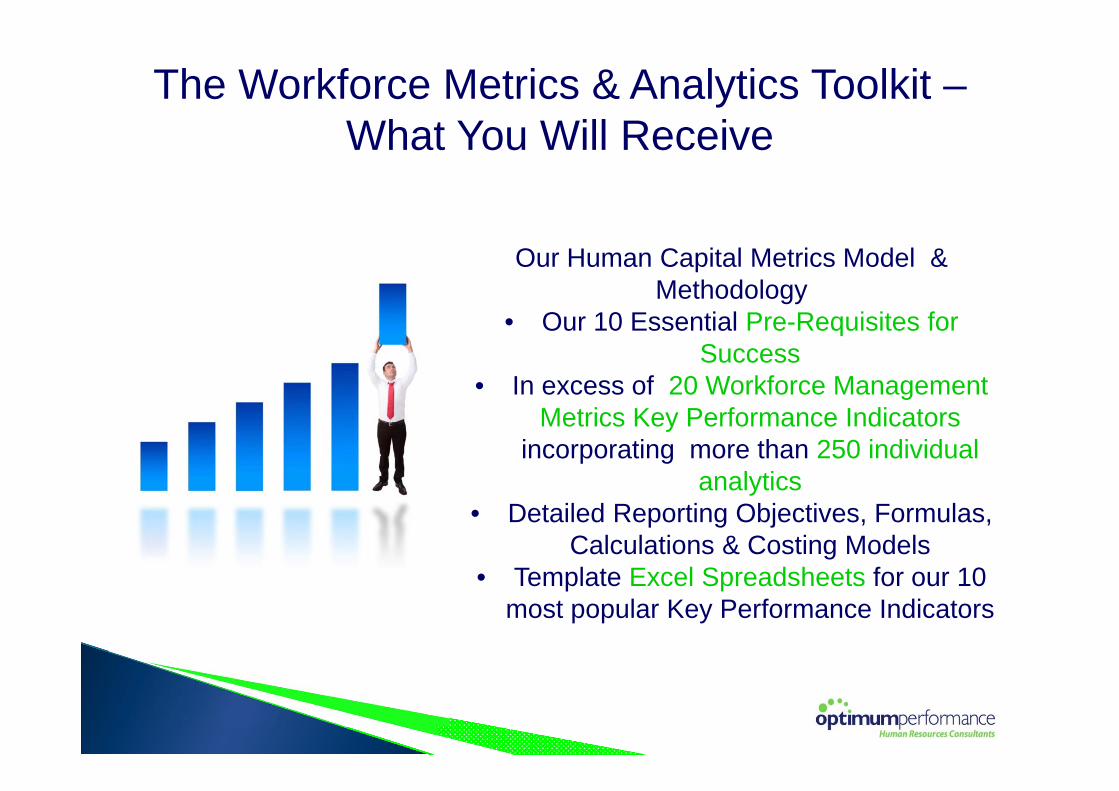
Our Human Capital Metrics Model & Methodology
• Our 10 Essential Pre-Requisites for Success
• In excess of 20 Workforce Management Metrics Key Performance Indicators
incorporating more than 250 individual analytics
• Detailed Reporting Objectives, Formulas, Calculations & Costing Models
• Template Excel Spreadsheets for our 10 most popular Key Performance Indicators
The Workforce Metrics & Analytics Toolkit –What You Will Receive
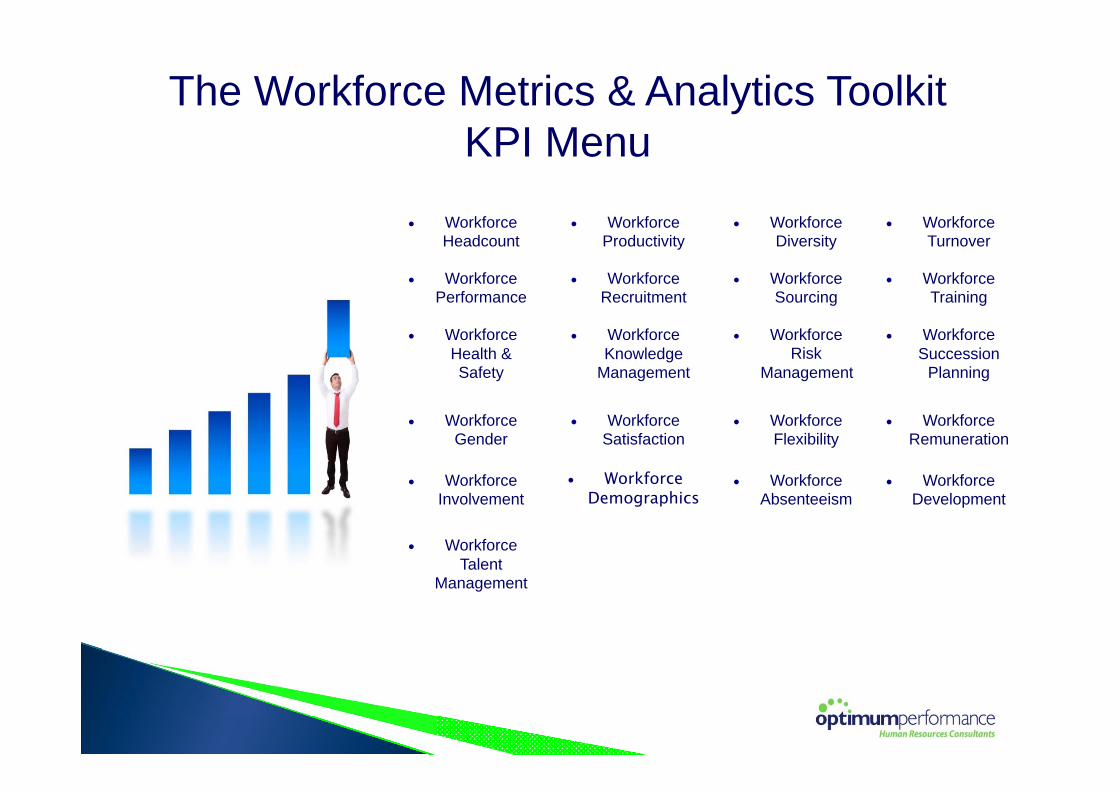
Workforce Headcount
Workforce Productivity
Workforce Diversity
Workforce Turnover
Workforce Performance
Workforce Recruitment
Workforce Sourcing
Workforce Training
Workforce Health & Safety
Workforce Knowledge
Management
Workforce Risk
Management
Workforce Succession
Planning
Workforce Gender
Workforce Satisfaction
Workforce Flexibility
Workforce Remuneration
Workforce Involvement
Workforce Demographics
Workforce Absenteeism
Workforce Development
Workforce Talent
Management
The Workforce Metrics & Analytics Toolkit KPI Menu
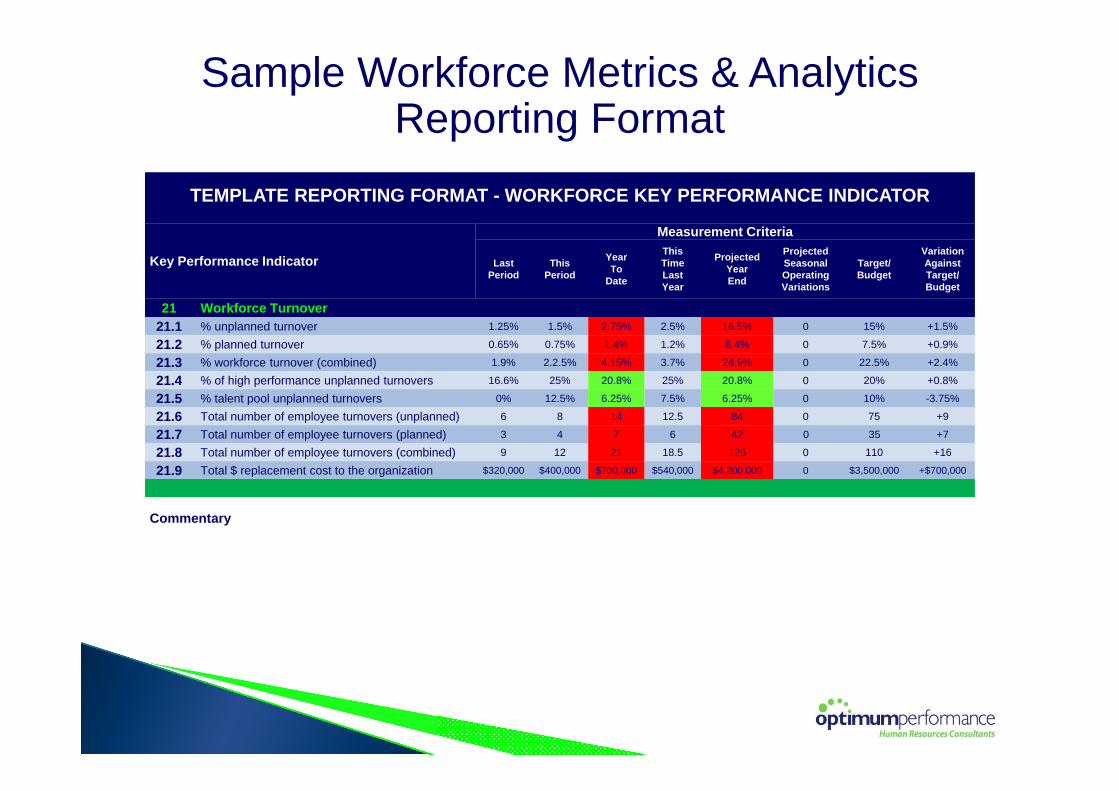
TEMPLATE REPORTING FORMAT - WORKFORCE KEY PERFORMANCE INDICATOR
Key Performance Indicator
Measurement Criteria
Last Period
This Period
Year To
Date
This Time Last Year
ProjectedYear End
Projected Seasonal Operating Variations
Target/Budget
VariationAgainst Target/Budget
21 Workforce Turnover21.1 % unplanned turnover 1.25% 1.5% 2.75% 2.5% 16.5% 0 15% +1.5%
21.2 % planned turnover 0.65% 0.75% 1.4% 1.2% 8.4% 0 7.5% +0.9%
21.3 % workforce turnover (combined) 1.9% 2.2.5% 4.15% 3.7% 24.9% 0 22.5% +2.4%
21.4 % of high performance unplanned turnovers 16.6% 25% 20.8% 25% 20.8% 0 20% +0.8%
21.5 % talent pool unplanned turnovers 0% 12.5% 6.25% 7.5% 6.25% 0 10% -3.75%
21.6 Total number of employee turnovers (unplanned) 6 8 14 12.5 84 0 75 +9
21.7 Total number of employee turnovers (planned) 3 4 7 6 42 0 35 +7
21.8 Total number of employee turnovers (combined) 9 12 21 18.5 126 0 110 +16
21.9 Total $ replacement cost to the organization $320,000 $400,000 $700,000 $540,000 $4,200,000 0 $3,500,000 +$700,000
Commentary
Sample Workforce Metrics & Analytics Reporting Format
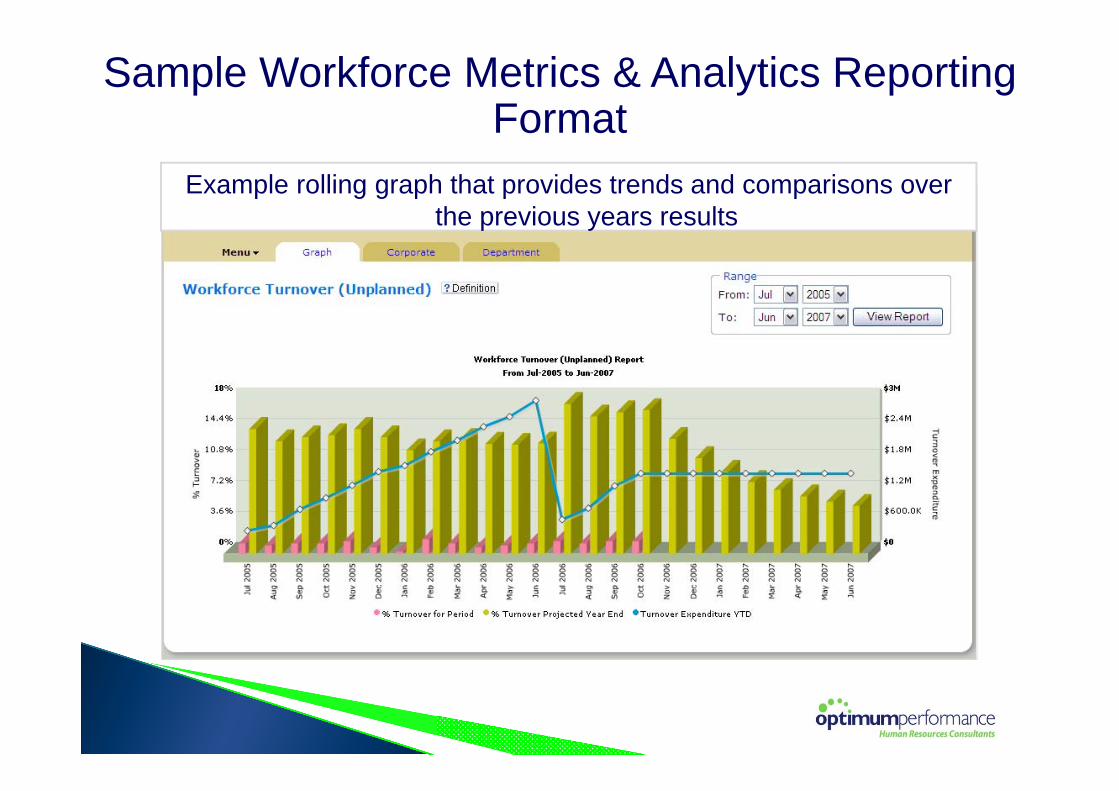
Example rolling graph that provides trends and comparisons over the previous years results
Sample Workforce Metrics & Analytics Reporting Format
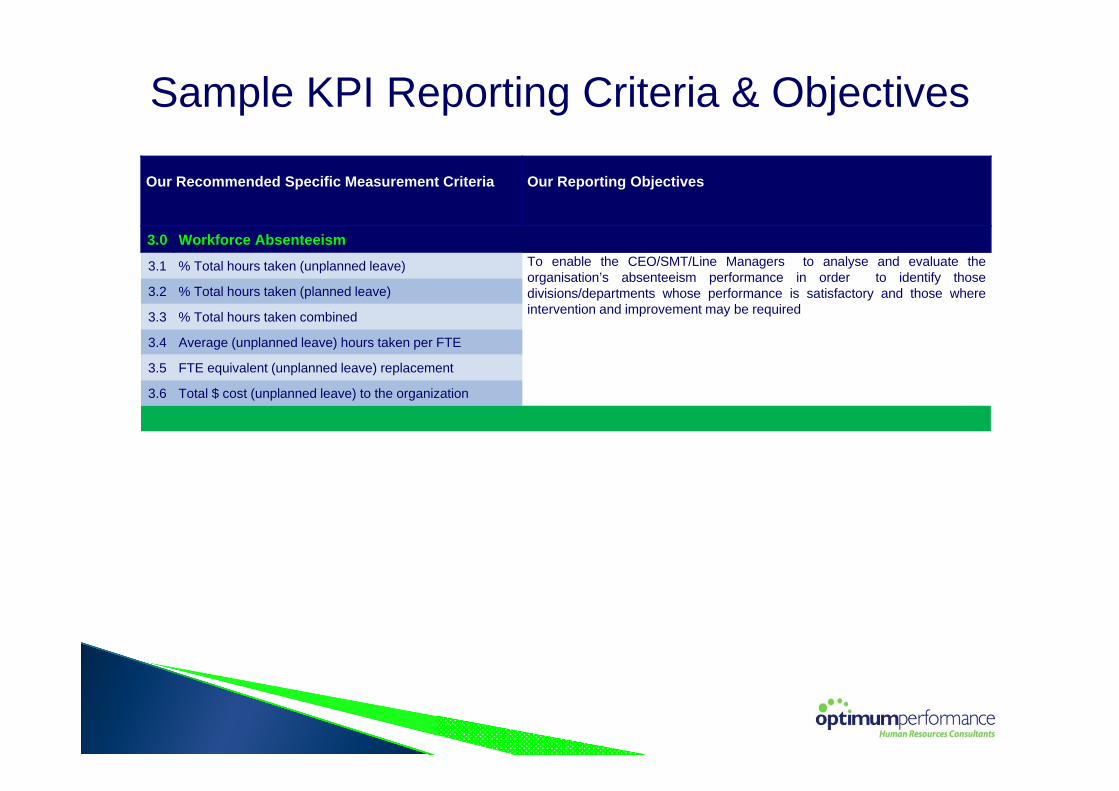
Sample KPI Reporting Criteria & Objectives
Our Recommended Specific Measurement Criteria Our Reporting Objectives
3.0 Workforce Absenteeism
3.1 % Total hours taken (unplanned leave) To enable the CEO/SMT/Line Managers to analyse and evaluate theorganisation’s absenteeism performance in order to identify thosedivisions/departments whose performance is satisfactory and those whereintervention and improvement may be required
3.2 % Total hours taken (planned leave)
3.3 % Total hours taken combined
3.4 Average (unplanned leave) hours taken per FTE
3.5 FTE equivalent (unplanned leave) replacement
3.6 Total $ cost (unplanned leave) to the organization
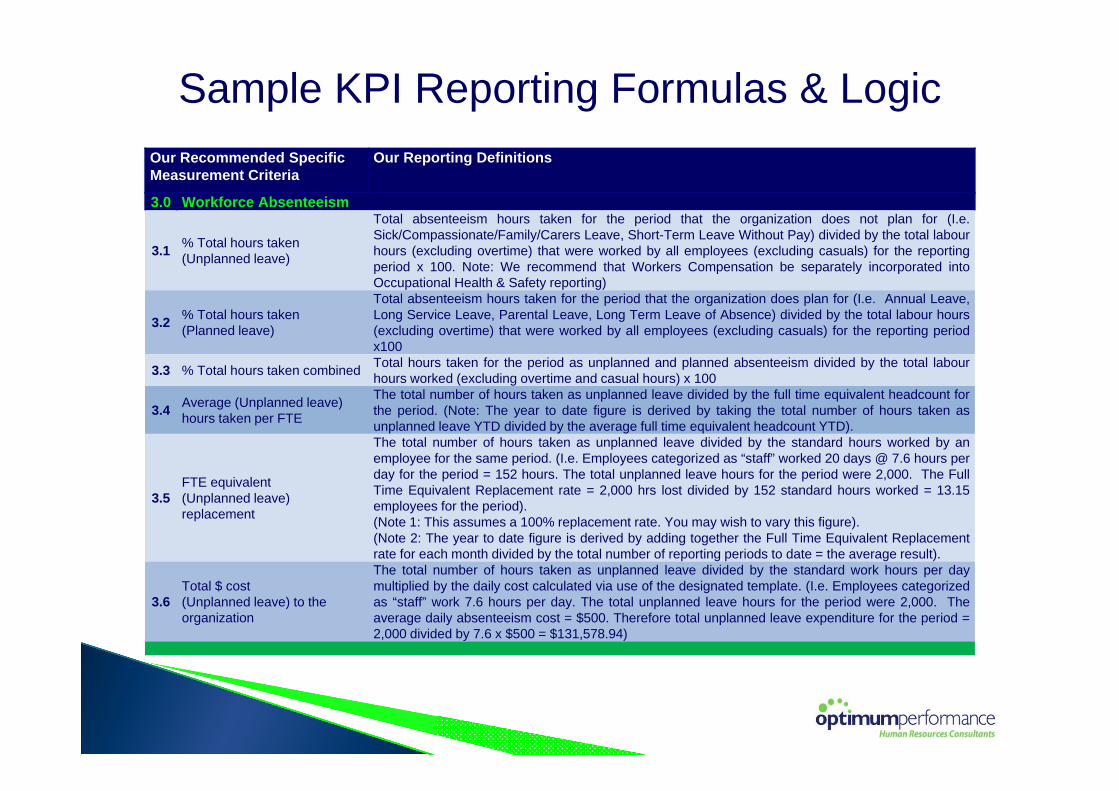
Sample KPI Reporting Formulas & LogicOur Recommended Specific Measurement Criteria
Our Reporting Definitions
3.0 Workforce Absenteeism
3.1 % Total hours taken (Unplanned leave)
Total absenteeism hours taken for the period that the organization does not plan for (I.e.Sick/Compassionate/Family/Carers Leave, Short-Term Leave Without Pay) divided by the total labourhours (excluding overtime) that were worked by all employees (excluding casuals) for the reportingperiod x 100. Note: We recommend that Workers Compensation be separately incorporated intoOccupational Health & Safety reporting)
3.2 % Total hours taken (Planned leave)
Total absenteeism hours taken for the period that the organization does plan for (I.e. Annual Leave,Long Service Leave, Parental Leave, Long Term Leave of Absence) divided by the total labour hours(excluding overtime) that were worked by all employees (excluding casuals) for the reporting periodx100
3.3 % Total hours taken combined Total hours taken for the period as unplanned and planned absenteeism divided by the total labourhours worked (excluding overtime and casual hours) x 100
3.4 Average (Unplanned leave) hours taken per FTE
The total number of hours taken as unplanned leave divided by the full time equivalent headcount forthe period. (Note: The year to date figure is derived by taking the total number of hours taken asunplanned leave YTD divided by the average full time equivalent headcount YTD).
3.5FTE equivalent (Unplanned leave) replacement
The total number of hours taken as unplanned leave divided by the standard hours worked by anemployee for the same period. (I.e. Employees categorized as “staff” worked 20 days @ 7.6 hours perday for the period = 152 hours. The total unplanned leave hours for the period were 2,000. The FullTime Equivalent Replacement rate = 2,000 hrs lost divided by 152 standard hours worked = 13.15employees for the period).(Note 1: This assumes a 100% replacement rate. You may wish to vary this figure).(Note 2: The year to date figure is derived by adding together the Full Time Equivalent Replacementrate for each month divided by the total number of reporting periods to date = the average result).
3.6Total $ cost (Unplanned leave) to the organization
The total number of hours taken as unplanned leave divided by the standard work hours per daymultiplied by the daily cost calculated via use of the designated template. (I.e. Employees categorizedas “staff” work 7.6 hours per day. The total unplanned leave hours for the period were 2,000. Theaverage daily absenteeism cost = $500. Therefore total unplanned leave expenditure for the period =2,000 divided by 7.6 x $500 = $131,578.94)
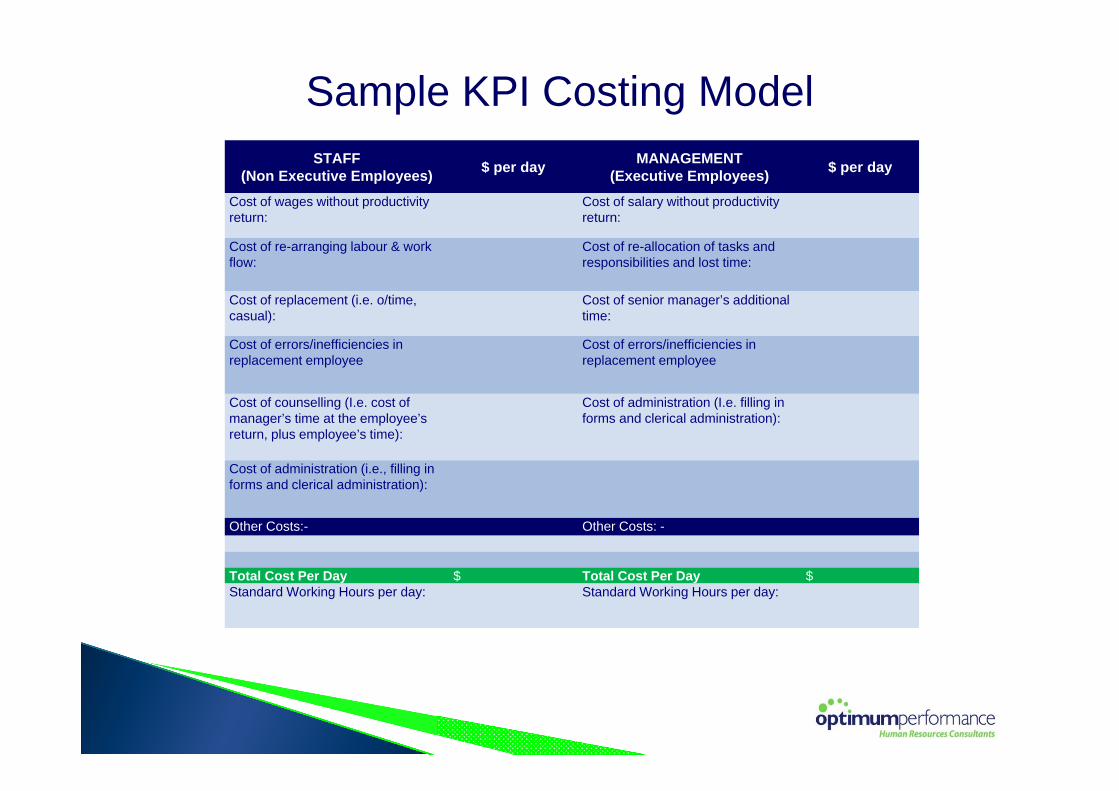
Sample KPI Costing Model STAFF
(Non Executive Employees) $ per day MANAGEMENT(Executive Employees) $ per day
Cost of wages without productivity return:
Cost of salary without productivity return:
Cost of re-arranging labour & work flow:
Cost of re-allocation of tasks and responsibilities and lost time:
Cost of replacement (i.e. o/time, casual):
Cost of senior manager’s additional time:
Cost of errors/inefficiencies in replacement employee
Cost of errors/inefficiencies in replacement employee
Cost of counselling (I.e. cost of manager’s time at the employee’s return, plus employee’s time):
Cost of administration (I.e. filling in forms and clerical administration):
Cost of administration (i.e., filling in forms and clerical administration):
Other Costs:- Other Costs: -
Total Cost Per Day $ Total Cost Per Day $Standard Working Hours per day: Standard Working Hours per day:
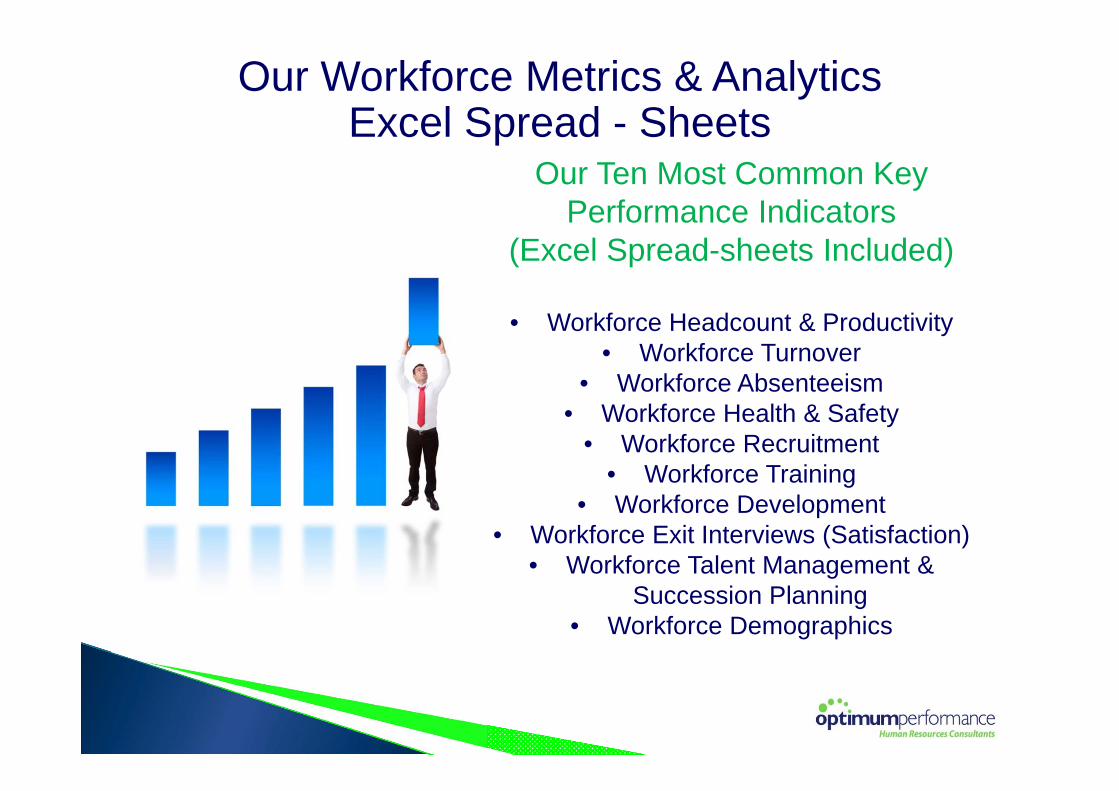
Our Workforce Metrics & Analytics Excel Spread - Sheets
Our Ten Most Common Key Performance Indicators
(Excel Spread-sheets Included)
• Workforce Headcount & Productivity• Workforce Turnover
• Workforce Absenteeism • Workforce Health & Safety
• Workforce Recruitment• Workforce Training
• Workforce Development• Workforce Exit Interviews (Satisfaction)
• Workforce Talent Management & Succession Planning
• Workforce Demographics
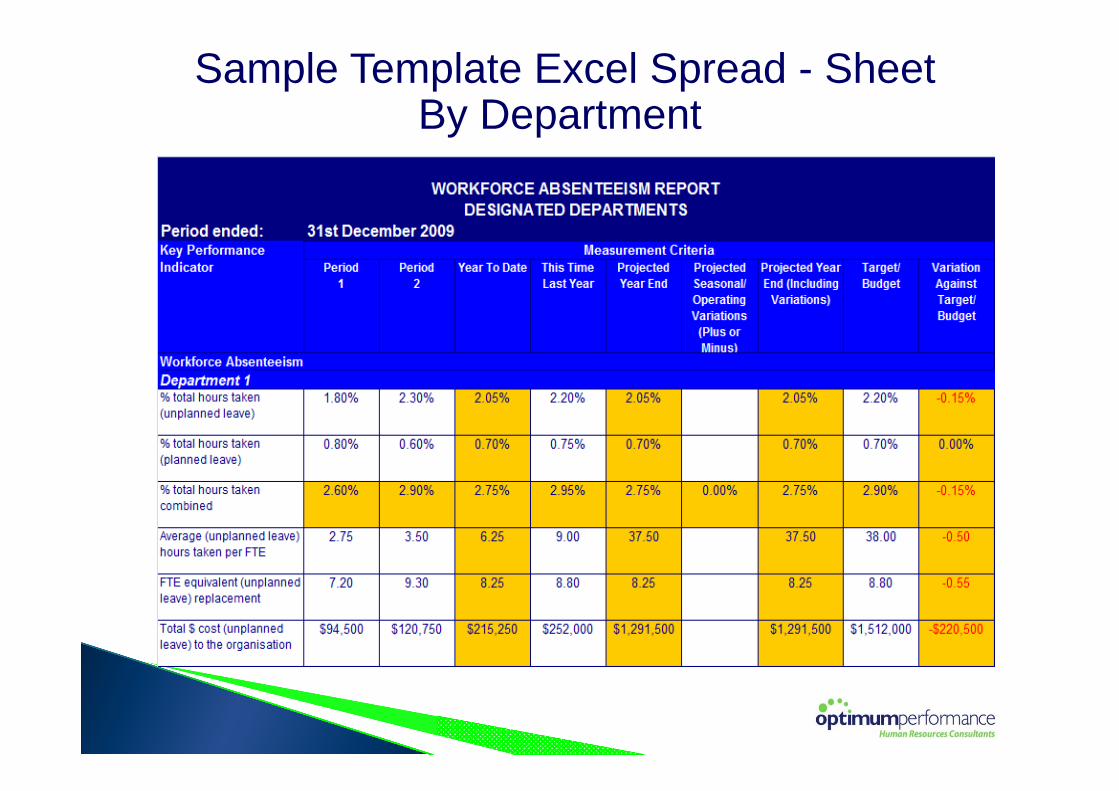
Sample Template Excel Spread - Sheet By Department

Sample Template Excel Spread - Sheet Corporate
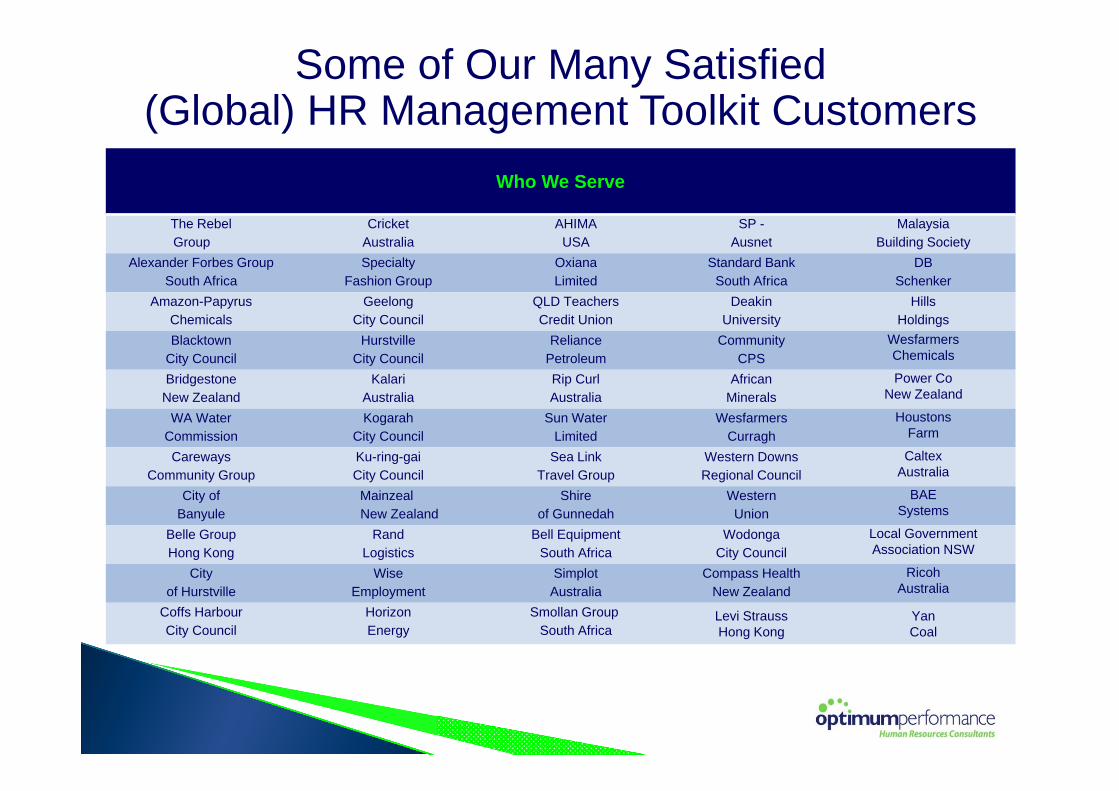
Some of Our Many Satisfied (Global) HR Management Toolkit Customers
Who We Serve
The Rebel Group
Cricket Australia
AHIMAUSA
SP -Ausnet
Malaysia Building Society
Alexander Forbes Group South Africa
Specialty Fashion Group
Oxiana Limited
Standard Bank South Africa
DB Schenker
Amazon-Papyrus Chemicals
Geelong City Council
QLD Teachers Credit Union
Deakin University
Hills Holdings
Blacktown City Council
Hurstville City Council
Reliance Petroleum
CommunityCPS
Wesfarmers Chemicals
Bridgestone New Zealand
Kalari Australia
Rip Curl Australia
African Minerals
Power Co New Zealand
WA Water Commission
Kogarah City Council
Sun WaterLimited
Wesfarmers Curragh
Houstons Farm
Careways Community Group
Ku-ring-gai City Council
Sea Link Travel Group
Western Downs Regional Council
Caltex Australia
City of Banyule
MainzealNew Zealand
Shire of Gunnedah
Western Union
BAE Systems
Belle Group Hong Kong
Rand Logistics
Bell Equipment South Africa
Wodonga City Council
Local Government Association NSW
City of Hurstville
Wise Employment
Simplot Australia
Compass Health New Zealand
Ricoh Australia
Coffs Harbour City Council
Horizon Energy
Smollan GroupSouth Africa
Levi Strauss Hong Kong
Yan Coal
Your Investment
You can purchase our Workforce Metrics &
Analytics Toolkit for just AU$599 (+ Gst)
The Workforce Metrics & Analytics
Toolkit
Placing Your Order
Please visit our website home-page and click on the Software Support Page then follow the links until you reach the Place Your Order page where you can pay on-line using PayPal, or request an invoice
be sent to you.For more information please email: -
www.optimumperformance.com.au
TheWorkforce Metrics & Analytics
Toolkit
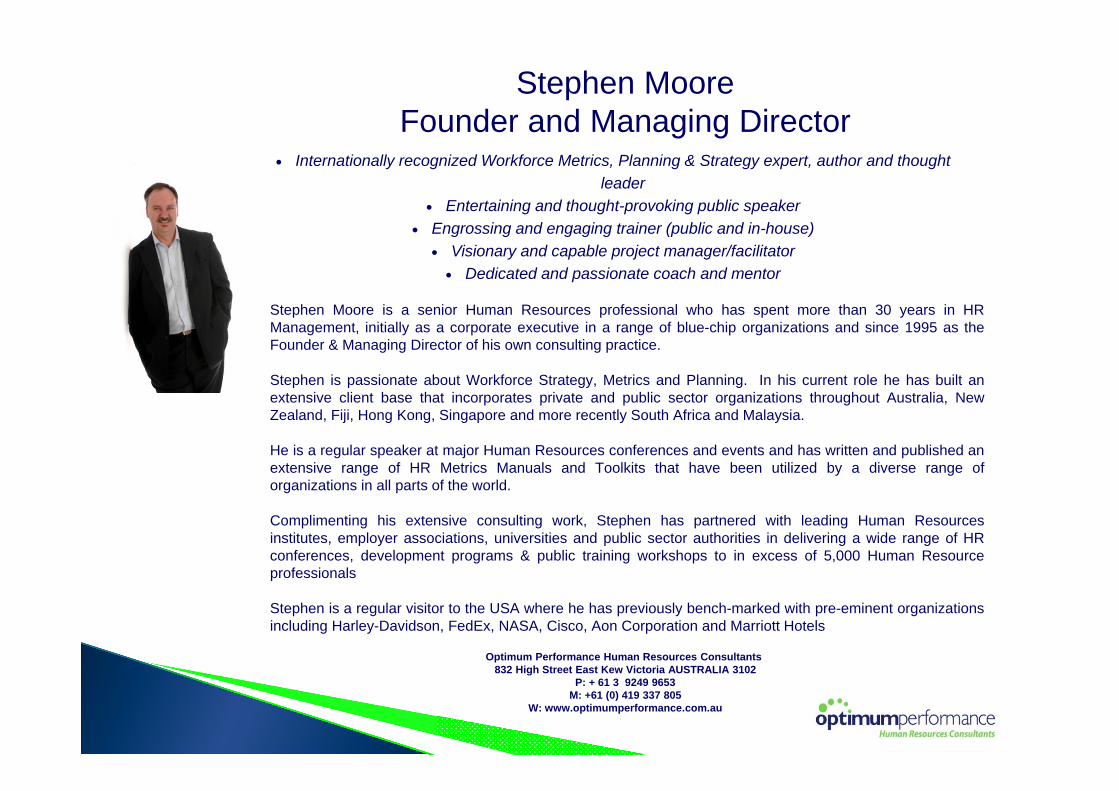
Stephen MooreFounder and Managing Director
Internationally recognized Workforce Metrics, Planning & Strategy expert, author and thought leader
Entertaining and thought-provoking public speaker Engrossing and engaging trainer (public and in-house)
Visionary and capable project manager/facilitator Dedicated and passionate coach and mentor
Stephen Moore is a senior Human Resources professional who has spent more than 30 years in HRManagement, initially as a corporate executive in a range of blue-chip organizations and since 1995 as theFounder & Managing Director of his own consulting practice.
Stephen is passionate about Workforce Strategy, Metrics and Planning. In his current role he has built anextensive client base that incorporates private and public sector organizations throughout Australia, NewZealand, Fiji, Hong Kong, Singapore and more recently South Africa and Malaysia.
He is a regular speaker at major Human Resources conferences and events and has written and published anextensive range of HR Metrics Manuals and Toolkits that have been utilized by a diverse range oforganizations in all parts of the world.
Complimenting his extensive consulting work, Stephen has partnered with leading Human Resourcesinstitutes, employer associations, universities and public sector authorities in delivering a wide range of HRconferences, development programs & public training workshops to in excess of 5,000 Human Resourceprofessionals
Stephen is a regular visitor to the USA where he has previously bench-marked with pre-eminent organizationsincluding Harley-Davidson, FedEx, NASA, Cisco, Aon Corporation and Marriott Hotels
Optimum Performance Human Resources Consultants832 High Street East Kew Victoria AUSTRALIA 3102
P: + 61 3 9249 9653M: +61 (0) 419 337 805
W: www.optimumperformance.com.au