the use of sn-impregnated activated carbon for the removal ... · the use of sn-impregnated...
TRANSCRIPT

Juroal Kejuruteraan 13 (2001) 115-125
The Use of Sn-Impregnated Activated Carbon for The Removal of CO in PSA System
S. E. Iyuke, A. B. Mohamad and W. R. W. Daud
ABSTRACf
Inevitable increase of carbon monoxide (CO) in the atmosphere as a result of its emission from process gases, has remained a threat to the world ecosystem. It is then expedient to develop technologies to either eliminate or at least reduce the concentration of co to a minimum bearable level in onier to protect the world from its pollution. Consequently, Sn-Activated carbon adsorbent was developed and its CO-sorption and thermodynamic properties were studied and then applied in PSA system. Activated carbon was impregnated with 34.57% SnCHr 2H,o salt to improve its adsorptive interaction with CO. It was observed that the amount of co adsorbed was almost equal to thai de.orbed which could imply that the adsorption of co on the prepared adsorbents seems to be reversible. Further exploitalion of the impregnated activated carbon in pressure swing adsorption (PSA)
experiments showed that adsorption of carbon monoxide was higher with the impregnated carbon than in the pure carbon. It was seen that the concentration of carbon monoxide, which was 1000 ppm, was successfully reduced to 40.2 and 10.4 ppm by the pure and the impregnated activated carbons, respectively. These results confirmed that Sn-Activated Carbon in Pressure Swing Adsorption system can be used in the purification of H,for PEM Fuel Cell.
Key words: separation, adsorption, purification, impregnated activated carbon.
INTRODUCfION
The importance of removal of carbon monoxide (CO) in the purification of hydrogen from steam refonner effiuent, as process fuel for fuel cell power plant has been an emerging research interest in the past few years. The majority of pressure swing adsorption (PSA) process are 'equilibrium driven'in the sense that the selectivity of the adsorbent to sorbates depends on differences in the equilibrium affinities, This is true because it is a common phenomenen that when a gas molecule comes near a solid surface, it experiences a reduction in potential energy as a consequence of interaction with the atoms (or molecule) in the solid. The result is that the gas molecules tend to concentrate in this region so that the molecular density in the vicinity of the surface is substantially greater than in the free-gas phase. The strength of the surface forces depends on the nature of both the solid and the sorbate. These forces are relatively weak due to van der Waals interactions, which could be supplemented in the case of polar, or quadrupolar species by electrostatic forces (dipole or quadropole interactions).

116
Solid adsorbents have been for gas separation and purification since the history of gas adsorption. Further exploitation of solid-gas processes hhas unveiled the reality of impregnating metal halides onto solid adsorbent to increase its adsorptive capability towards adsorbate gas. Various authors, such as Huang (1973), Rabo et aI . (1977), Hirai et al. (1982), and Toman et ai. (1996) have reported several impregnated solid adsorbents for co.
In this paper therefore, Sn-Activated carbon adsorbent, which is apparently new in the history of adsorbent synthesis for co adsorption was developed and its carbon monoxide-sorption and thermodynamic properties were studied and then applied in PSA system by: I. Comparing the selectivity coefficients of the various gas components of
the steam reformer effluent (co, co, and CH" while H, was regarded as inert component) on adsorption on activated carbon,
2. Activated carbon was impregnated with SnCI,.2H,0 and the adsorptiondesortion characteristics of the adsorbable component of the selected gas mixture on the prepared carbon were determined by PSA experiments.
THEORY
The equilibrium adsorption from COIH, and CHlco/H, mixtures on !'CD activated carbon have been measured (Ritter 1985) and exhaustively discussed by Cen and Yen (1986), and Doong and Yang (1986). In both publications, the loading ratio correlation (LRC) model was found to reliably represent their respective experiments. On this basis therefore, the LRC model was used and given as,
q.,B,(Py, )'"
l+rB, (Py,)" (I)
where q",.= a + bT; i = 1,2, .. . n; B = c exp (d/["); T is absolute temperature (K), n = constant
A concise description on the LRC model was made elsewhere (Iyuke et ai. 2000a). The constant B, can be modified empirically to account for the lateral interactions on the surface (Doong and Yang 1986):
B B,=-1/,
where TJ; is the interaction parameter.
(2)
The values of 1/, for the ternary mixture adsorption systems have been determined by Ritter (1985). The constants for co, CO, and CH, on PCB activated carbon reported by Cen and Yang (1986) and Saunders and Yang (1985) as presented in Table I were adopted to estimate the selectivity of co to this carbon in CO2, ~ and eH. environments.
In adsorption work, a selectivity coefficient has been defined by Bering and Serpenskii (1952) as;
(3)

117
where x.and y. are the mole fraction of component i in the adsorbed and gas phases 'respedtively. The selectivity coefficient Su for component 1 is greater than unity if component 1 is the more strongly adsorbed of the two gasses.
TABLE 1. Parameters used in Loading Ratio Correlation equation for adsorption on a(;tivaled carbon
Component n a b c d 6H (ke. l/mal)
CO 1.02 1.I3E·02 ·1.89E·05 3.42E·05 1541.2 3.0 CO, 1.00 1.68E·02 ·2.49E·OS 3.67E·05 1892.6 1 5.0 CH. 1.00 9.68E·03 ·l.25E·OS 3.S2E·OS 1731.29 5.0
The PSA process employed in this paper resembles the Skarstrom (1960) cycle in its basis form, which utilises two paCked bed adsorbent beds, which is evaluated in terms of the effluent purity, product recovery, the reliability of the systems' components and the cycle time.
EXPERIMENTAL
The materials, some major adsorber specifications and other essential parameters used in this study are presented in Table 2.
CHARACTERIZATION OF ACTIVATED CARBON
BET·AUTOSORB·I (QUANTA CHROME) was used to characterize the activated carbon (BDH Laboratory Supplies), which has the capability of measuring
TABLE 2. Materials and apparatus specifications
Column: Insulated stainless steel (type 304) Internal diameter 4.0 em Packed bed length 66.0 em Mixed gas flow rate 2.033 Lmin Adsorbent Activated carbon (BDH) Particle sizes 0.85·1.70 mm (BS 41O:IS mesh to 10
Bed voidage Heat capacity of carbon; Adsorbate Carrier gas Purge gas Impregnant
Pressure ranges Temperature range Adsorption time Purge flow Purge time Equipment:
mesh) 0.43 1.046kJlkg K CO (commercially available grade) H2 (commercially available grade) N2 (commercially available grade) SnClr 2H
20 (commercia lly available
grade) 1.0 to ISatm. 299 to 306 K 4.0 min 8.0 to 1O.0Umin 2.0 min UV· Visible Recording Spectrophotometer BET·AUTOSORB·I (QUANTA CHROME)
118
adsorbed or desorbed volumes of nitrogen at relative pressure in the range 0.001 to slightly under 1.0. This volume-pressure data can be reduced by the AUTOSORB-l software into BED surface area (single andlor multipoint), Langmuir surface area, adsorption and/or desorption isotherms, pore size and surface area distributions, micropore volume and surface area using an extensive set of built-in data reduction procedures.
IMPREGNATION OF ACTIVATED CARBON WITH SN
Tin was chosen as the impregnated in this work because, It IS locally available, such that with little or no cost it can be obtained. SnCI,.2H,G salt as a So ion precursor was used for the impregnation experiment. The activated carbon (BDH Laboratory supplies) was used as the support. 100g of SnCI,.2H,O salt was magnetically and mechanically stirred in IN HCI aqueous solution of 1.4 liters under dry nitrogen (N2) surrounding at room temperature and I (0.02kg) of activated carbon was addded to the mixture. The carbon was impregnated wath the solution for a day. It was washed with distilled water until the pH of the water became around 4.5 and was dried in free air at 180°C for 12 hours. The impregnation and drying were camed out for long period of 24 hours and 12 hours respectively, to ensure a unifonn and proper anchorage of the metal ions onto the active sites of the carbon. Aliquots were taken before and after impregnation, and then analyzed using uv-Visible Recording Spectrophotometer, model uv-265 (Shimadzu) at the absorption band of 317.5 nm. The initial concentration of tin was 48.3847 x 10" mol dm'" while after impregnation the tin concentration dropped to 31.6574 x 10" mol dm·'. This shows that 34.57 ± 5% of tin was impregnated on the activated carbon.
EXPERIMENTAL APPARATUS
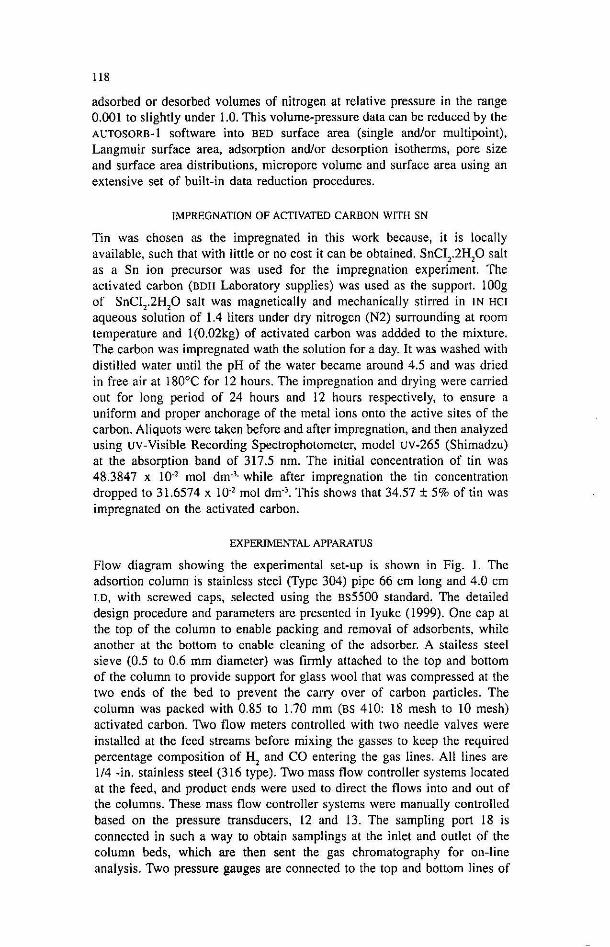
Flow diagram showing the experimental set-up is shown in Fig. 1. The adsortion column is stainless steel (Type 304) pipe 66 cm long and 4.0 cm 1.0, with screwed caps, selected using the Bs5500 standard. The detailed design procedure and parameters are presented in Iyuke (1999). One cap at the top of the column to enable packing and removal of adsorbents, while another at the bottom to enable cleaning of the adsorber. A stailess steel sieve (0.5 to 0.6 mm diameter) was firmly attached to the top and bottom of the column to provide support for glass wool that was compressed at the two ends of the bed to prevent the carry over of carbon particles. The column was packed with 0.85 to 1.70 mm (BS 410: 18 mesh to 10 mesh) activated carbon. Two flow meters controlled with two needle valves were installed at the feed streams before mixing the gasses to keep the required percentage composition of H2 and CO entering the gas lines. All lines are 114 -in. stainless steel (316 type). Two mass flow controller systems located at the feed, and product ends were used to direct the flows into and out of the columns. These mass flow controller systems were manually controlled based on the pressure transducers, 12 and 13. The sampling port 18 is connected in such a way to obtain samplings at the inlet and outlet of the column beds, which are then sent the gas chromatography for on-line analysis. Two pressure gauges are connected to the top and bottom lines of
purge ga.
16
BED A
BED
B -I-I TC
11
SYMBOLS I: linear mass flow controller 2: Pressure regulator for feed 3: Needle valve 4: FlowmctCl"
119
5: Feed on-line GC sampling port 6: Pressure guage for bed A 7: 4-way valves system 8: Purge on-line GC sampling port 9: Pressure guaae for bed B
10: Flow meter for purged product \1: Thennocouples 12: Pressure transducer for bed A 13: Pressure transducer fur bed B 14: 4-way 'Valve system 15; Purge: flow meter 16:Prcssim: regulator for purge gas 17:Line-pressurc-regulator 18:Product on-line GC sampling port 19:Product flow meter 2O:Two stage vacuum pump 21: Digital computer
FIGURE 1. Flow diagram of two alternating PSA Beds for hydrogen purification
the columns, which provide the pressure history of the process. A layer of glass wool insulation covering the columns helps to make the temperature gradient in the radial direction as small as possible and to simulate nonadiabatic operation. These are approximately the conditions existing in commercial processes where large-diameter beds are used. The axial temperature distribution were measured and recorded at three locations (top, middle, and bottom) in the bed. This was done using three fine thermocouplers sheathed in a 1/8-in thin stainless steel protection tube that was inserted in the center of the packed column. Gas sample ports, 8 and 18 were connected to two-chambers gas chromatograph (GC) to allow on-line concentration analysis at the two sampling ports.
PROCEDURE
This procedure describes bulk separation of a H!CO (75/25- volume %) mixture. This ratio approximately represents the H!CO compositions of the steam reformer effluent. The bed was cleaned before each ron by degassing with a mechanical pump, 20 through the needle valve, as shown in the Fig 1. Step I, pressurization, was initiated by opening a 4-way valves system connected to the feed. The pressure regulator, 2 connected to the feed cylinder controlled the desired column pressure. The sampling port, 5 is connected to the GC where the feed concentration was obtained in an on-line GC basis, and the feed flow was measured by the flow meter, 4. Step II, highpressure adsorption, started when the bottom 4 way valves system, 14 was opened to enable the pressure in pressure transducer, 12 attain the operating pressure of 15 atmosphere. The adsorption pressure was controlled and maintained by controlling the product rate with the aid of the line pressureregulator (pressure controller, model 5866; Brooks Instrument), 17. Step III, cocurrent depressurization or blowdown, was effected by closing the feed to bed A and then directed to bed B to pressurize bed B, by the feed valve, 7.
120
Step IV, countercurrent purge, was achieved by simultaneously closing the flow to product end, 19 and directing it from purge line through bed A, via valve, 7 to the vent line. Here samples were analyzed by on-line GC, 8 and the flow rate recorded on the flow meter, 19. N, was used for purge to avoid every means of contamination of the adsorbent bed and also for safety
-purposes. Similar operations were also carried out in bed B in phase.
RESULT AND DISCUSSION
In the analysis of the activated carbon used in this study using the AUTOSORB
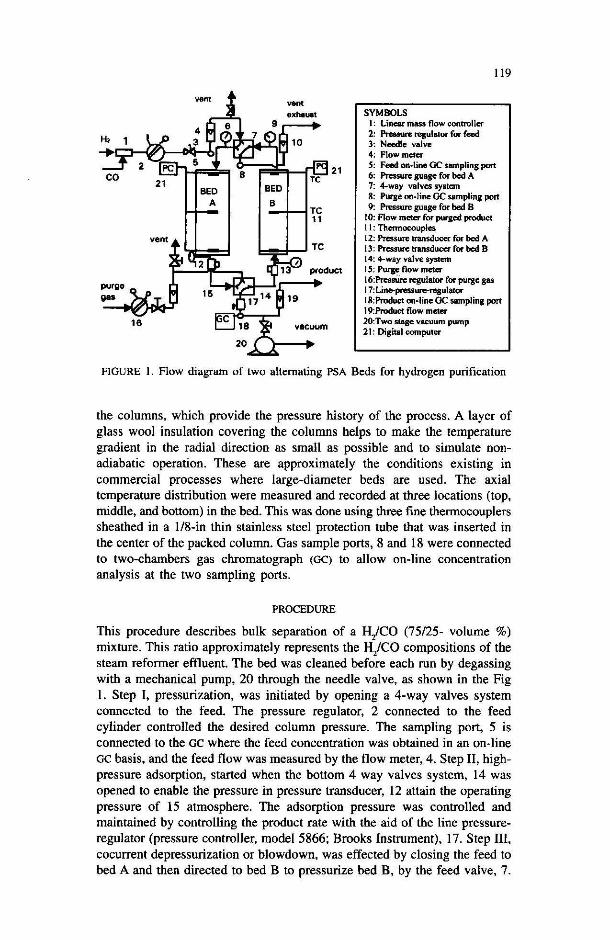
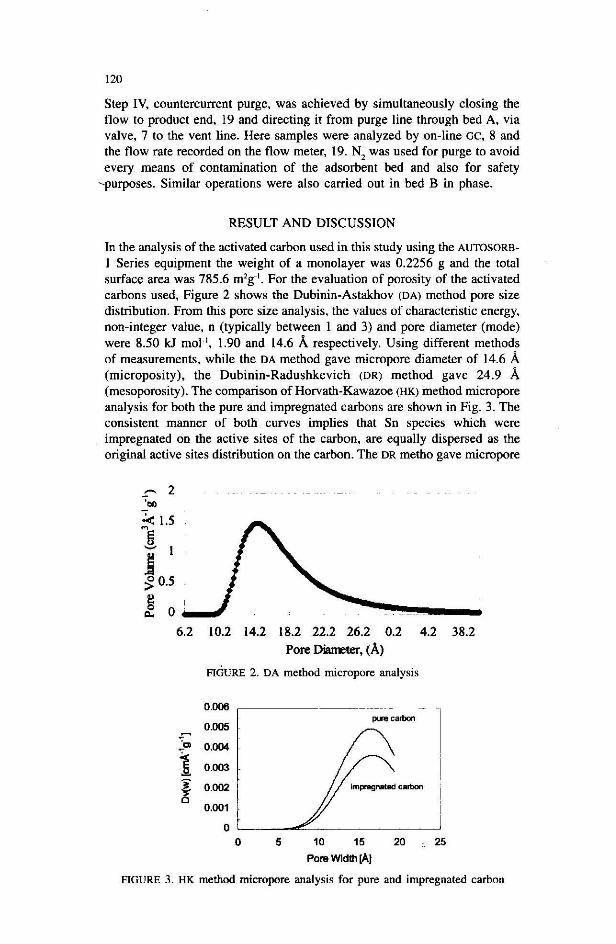
I Series equipment the weight of a monolayer was 0.2256 g and the total surface area was 785.6 m'g-t. For the evaluation of porosity of the activated carbons used, Figure 2 shows the Dubinin-Astakhov (DA) method pore size distribution. From this pore size analysis, the values of characteristic energy, non-integer value, n (typically between I and 3) and pore diameter (mode) were 8.50 kJ mol- t, 1.90 and 14.6 A respectively. Using different methods of measurements, while the DA method gave micropore diameter of 14.6 A (microposity), the Dubinin-Radushkevich (DR) method gave 24.9 A (mesoporosity). The comparison of Horvath-Kawazoe (HK) method micropore analysis for both the pure and impregnated carbons are shown in Fig. 3. The consistent manner of both curves implies that So species which were impregnated on the active sites of the carbon, are equally dispersed as the original active sites distribution on the carbon. The DR metha gave micropore
::--- 2 'co
.:.: 1.5
'"5 ~I
j ~ 0.5
~ O __ ~
6.2 10.2 14.2 18.2 22.2 26.2 0.2 4.2 38.2 Pore Diatreter, (A)
FIGURE 2. DA method micropore analysis
0.006 ,--------------- -
0.005 pmtcarbon
1 0.004
0.003
I 0.002 impregnated cllrbon
0.001
0 0 5 10 15 20 25
Pore Width IAI
FIGURE 3. HK method. micropore analysis for pure and impregnated carbon
121
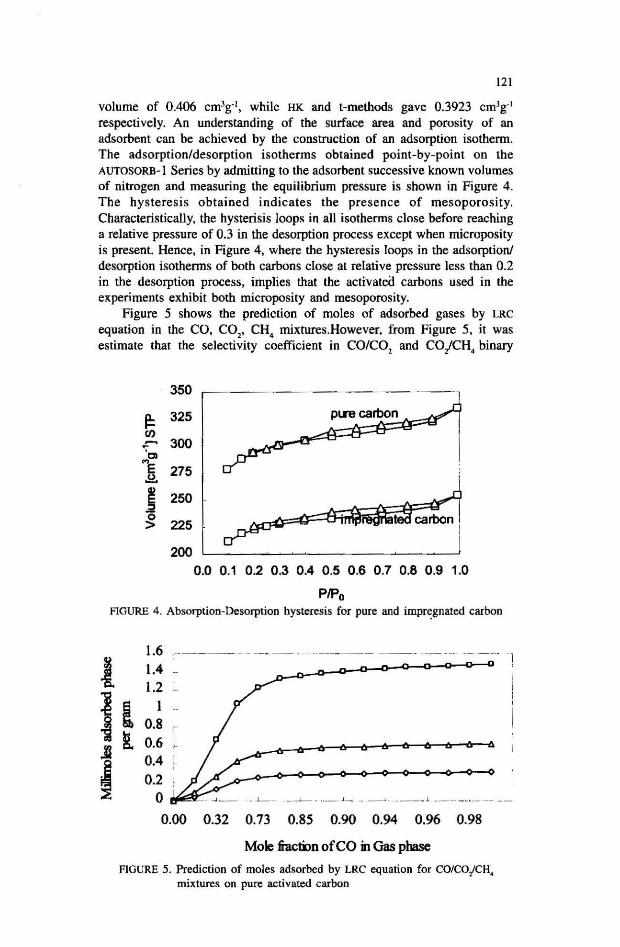
volume of 0.406 cm'g-', while HK and t-methods gave 0.3923 cm'g-' respectively. An understanding of the surface area and porosity of an adsorbent can be achieved by the construction of an adsorption isotherm. The adsorption/desorption isotherms obtained point-by-point on the AUTOSORB-I Series by admitting to the adsorbent successive known volumes of nitrogen and measuring the equilibrium pressure is shown in Figure 4. The hysteresis obtained indicates the presence of mesoporosity. Characteristically, the hysterisis loops in all isotherms close before reaching a relative pressure of 0.3 in the desorption process except when microposity is present. Hence, in Figure 4, where the hysteresis loops in the adsorption! desorption isotherms of both carbons close at relative pressure less than 0.2 in the desorption process, implies that the activatea carbons used in the experiments exhibit both microposity and mesoporosity.
Figure 5 shows the prediction of moles of adsorbed gases by LRC
equation in the CO, CO" CH. mixtures. However, from Figure 5, it was estimate that the selectivity coefficient in CO/CO, and CO/CH, binary
j: en ~
"'" 1 S 0 >
350
325
300
275
250
225
200
plnIcarbon
carbon
0.0 0.1 0.2 0.3 0.4 0.5 0.6 0.7 0.8 0.9 1.0
PlPo FIGURE 4 . Absorption-Desorption hystereSis for pure and impr~gnated carbon
1.6 1.4 1.2 _
I 0.8 r 0.6 _
0.4 f 0.2
o 0.00 0.32 0.73 0.85 0.90 0.94 0.96 0.98
Mole fiacti>n of CO n Gas phase
FIGURE 5. Prediction of moles adsorbed by LRC equation for COICO/CH4
mixtures on pure activated carbon
I

122
mixtures were 0.29, 0.48 and 1.57 respectively. These values of selectivity sigrtify that CO has the least selectivity on adsorption into activated carbon when compared to CO, and CH,. Since CO is the main interest of this rese«rch, it is then necessary to improve CO selectivity on activated carbon .. and this can be done by increasing CO molecules affinity to the active sites on the surfaces and pores of the activated carbon through impregnation wilh metal halides.
Iyuke et al. (2000 b) reponed that the species responsible for the improved gas phase CO adsorption with Sn-impregnated carbon was SnO, and that SnO, can be obtained naturally as cassiterite, which has the rutile structure; it may be prepated in the laboratory by dissolving tin in nitric acid and heating the product; and it is produced from the reaction of tin with stearn at high temperature. However, SnO, synthesised from SnCI,.2HO, was preferred in the study over the others mentioned above because, the former is less risky, less costly and the SnO, ligand is more easily available for impregnation on activated carbon. This is because, the naturally occuring cassiterite and the anificially prepared oxide after igrtition are quite insoluble in water, and are attacked only by hot concentrated acids and alkalis Jyuke et al. (2000 b).
In the experiments conducted, both pressure and temperatures profiles in the bed were measured continuously. This allowed a direct comparison between the resullS oblained for pure and activated carbon impregnated with
303.5 ~ 303 ~ 302.5 J"---
t--
i 3~~~ _: _:_:_7~: ~ t 300.5 300 '
1200 , -,0- P1R carl>on _ iIq>regnated carl>on
Ii. 1000 ~-o-....... -q"
,!I 800
20
15
81 600 i it ~ ~"I>-........ _e:~~,..".;;a;;;;;;8;="i'""'~' :0 I 8 -200
-400 o o 30 60 90 120 240 360 480 600 720 840 960
TIlE (s)
FIGURE 6. Comparison of experimenral breakthrough curves and temperature profiles along with pressure profile for pure and impregnated activated carbon
_. _- -----
123
Sn for each PSA cycles. Figure 6 shows the breakthrough curves, temperature profiles and pressure profile measured experimentally under the following conditions; lemperalure, 301 K for column with pure carbon and 301.6 for column with impregnated carbon, pressure, ranging from almospheric to 6 atm., pure carbon, carbon impregnaled with 34.57 (1.5% of Slannous chloride salt, and initial concentralion of carbon monoxide equal to 1000 ppm, which corresponds to about 0.1 % of carbon monoxide in the steam reformer effluent. The consumption or adsorption of carbon monoxide into both carbons was monitored with HP 5890 Series II Gas Chromatograph with automatic injection valves in on-line basis. It is clearly evident from Figure 6 that adsorption of carbon monoxide is higber with the impregnated carbon than in the pure carbon. It can be seen thaI the concentralion of carbon monoxide thaI was 1000 ppm was successfully reduced 10 40.2 and 10.4 ppm by the pure and the impregnated activated carbons, respeclively. This is in apparent consonance with the facl earlier eSlablished (Tamon el at. 1996), thaI the adsorptive capacity of activated carbon can be improved when impregnated with metal halides. The desorption curves in Figure 6 are nearly the mirror images of the adsorption vurves, which could imply reversibilily of the lalter process due to pressure reduction during the desorption process. The adsorption process in pbysisorption in both pure and impregnated carbons, since the adsorplion processes could be reversed by ordinary pressure reduction.
100 100
~ e 90 !IS l
f 80 90 f "-
J 70 85 I 0-
60 80 500 600 '720 840 1000
~ (.)
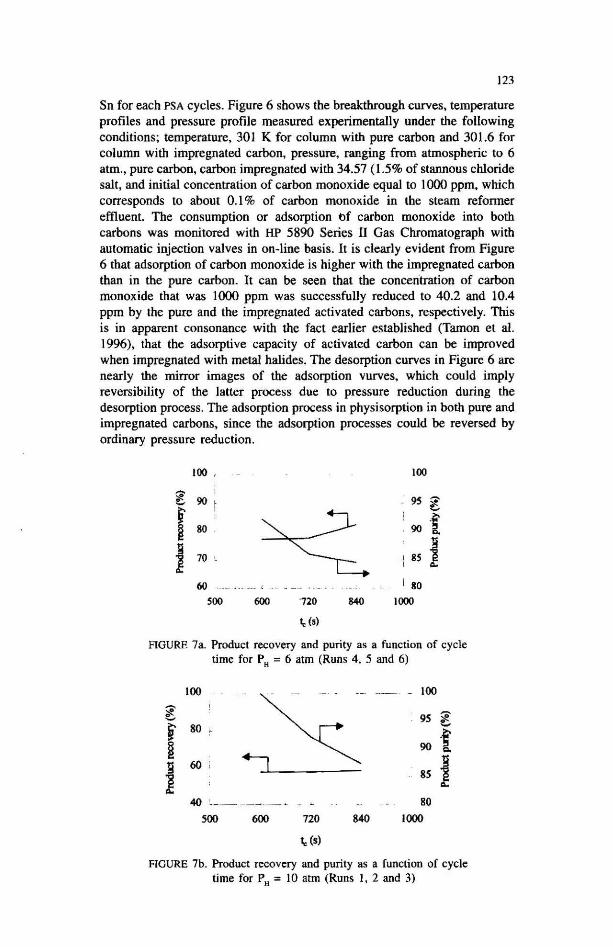
RGURE 7a. Product recovery and purity as a function of cycle time for PH ; 6 atm (Runs 4, 5 and 6)
100 .- -_. - 100 ~
0!1 95 l "-i 80 ·f ~ 90 .. II 60 ~ J ~
85
40 ' _ ____ _ , 80 sao 600 720 840 1000
r" (.)
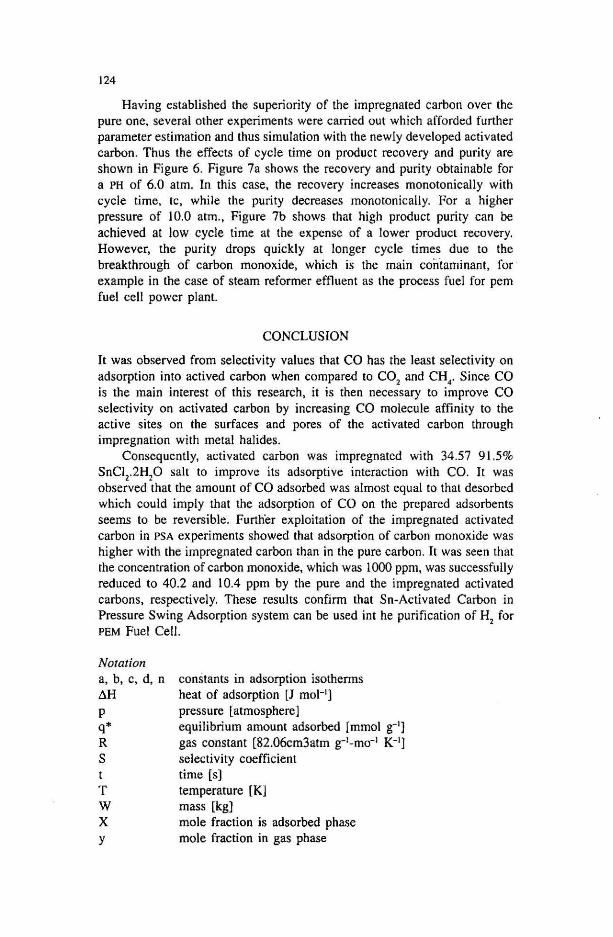
FIGURE 7b. Product recovery and purity as a function of cycle time for PH ; 10 aIm (Runs I, 2 and 3)
124
Having established the superiority of the impregnated carbon over the pure one, several other experiments were carried out which afforded further parameter estimation and thus simulation with the newly developed activated carbon. Thus the effects of cycle time on product recovery and purity are shown in Figure 6. Figure 7a shows the recovery and purity obtainable for a PH of 6.0 atm. In this case, the recovery increases monotonically with cycle time, te, while the purity decreases monotonically. For a higher pressure of 10.0 atm., Figure 7b shows that high product purity can be achieved at low cycle time at the expense of a lower product recovery. However, the purity drops quickly at longer cycle times due to the breakthrough of carbon monoxide, which is the main contaminant, for example in the case of steam reformer effluent as the process fuel for pem fuel cell power plant.
CONCLUSION
It was observed from selectivity values that CO has the least selectivity on adsorption into actived carbon when compared to CO, and CH,. Since CO is the main interest of this research, it is then necessary to improve CO selectivity on activated carbon by increasing CO molecule affinity to the active sites on the surfaces and pores of the activated carbon through impregnation with metal halides.
Consequently, activated carbon was impregnated with 34.57 91.5% SnCI,.2H,O salt to improve its adsorptive interaction with CO. II was observed that the amount of CO adsorbed was almost equal to that desorbed which could imply that the adsorption of CO on the prepared adsorbents seems to be reversible. Further exploitation of the impregnated activated carbon in PSA experiments showed that adsorption of carbon monoxide was higher with the impregnated carbon than in the pure carbon. It was seen that the concentration of carbon monoxide, which was 1000 ppm, was successfully reduced to 40.2 and 10.4 ppm by the pure and the impregnated activated carbons, respectively. These results confirm that Sn-Activated Carbon in Pressure Swing Adsorption system can be used int he purification of H, for PEM Fuel Cell .
Notation a. b, c, d. n l>H p q* R S t
T W X Y
constants in adsorption isothenns heat of adsorption [J mol-II pressure [atmospherel eqUilibrium amount adsorbed [mmol g-II gas constant [82.06cm3atm g-I_mo-I K-II selectivity coefficient time [sl temperature [KI mass [kgl mole fraction is adsorbed phase mole fraction in gas phase
Subsripts C cycle
H highesl
L lowest
m monolayer coverage
125
REFERENCES
Cen, P, & Yang. R.T. 1968. Bulk gas separation by pressure swing adsorption. Ind. Eng. Fund. , 25: 758-767.
DoongS, S.J. & Yang. R.T. 1986. Bulk separation of multicomponent gas mixtures by pressure swing adsorption: Pore/surface difussion and equilibrium models. AlChE J. 32: 397-410.
Hirai. H. , Kamiyama, M. & Hara, S. 1982. Polystrene-supported copper aluminate complex as solid carbon monoxide adsorbent. Makromal. Chem. Rapid Comun. 3: 95.
Huang, Y. Y. 1973, Selective adsorption of Carbon Monoxide and complex formation of Cuprous-Ammines in Cu(I)Y Zeolites. 1. Calal. 30: 187,
Iyuke, S. E. 1999. Purification Qf Hydrogen from H/eo mixture by pressure swing adsorption using activated carbon impregnated with tin. PhD Dissertation, Universiti Kebangsaan Malaysia.
Mohamad, A.B., Iyuke, S.E., Daud, W.R.W .. Kadhum, A.A.H., Fisal, Z., AL-Khalib, M.E, & Shariff, A.M. 2000b. Adsorption of Carbon monoxie on activated Carbon-tin ligand. Journal of Molecular Structure 550(551): 511-519.
Iyuke, S.E.; Daud, W.R.W. Mohamad, A.B., Khadum, A.A.H., Fisal, & Z. Shariff, A.M. 2000. Application of Sn-Activated Carbon in pressure swing adsorption for purification of H2. Chern. Eng. Sci. 55(20): 4745-4755.
Rabo, l.A., Francis, l.N. & Angell, c.L. 1977. US Patent 4019879. Ritter, 1, A. 1985. Adsorption of mUlticomponent gas mixture on activated carbon.
M.S. Thesis, Slate Univ. New York, Buffalo. Saunders. 1.T. & Yang. R.T. 1985. Equilibrium adsorption of gas mixture on
carbons. Fuel 64: 621. Skarstom, C.W. 1960. U.S. Patent. 2: 944.627. Taman. H., Kitamura, K. & Okazaki, M. 1996. Adsorption of Carbon Monoxide on
activated carbon impregnated with metal halide. AIChE J. 42(2): 422-430.
S.E. Iyuke Depanment of Chemical & Environmental Engineering Faculty of Engineering Universiti Putra Malaysia 43400 UPM Serdang Selangor D.E. Email: [email protected]
A.B . Mohammad
W.R.W. Daud Fuel Cell Technology Laboratary, Department of Chemical and Process Engineering Faculty of Engineering, Universiti Kebangsaan Malaysia, 43600 UKM Bangi Selangor D.E.