the use of remote sensing in habitat management for wildlife · the use of remote sensing in...
TRANSCRIPT
THE USE OF REMOTE SENSING IN HABITAT MANAGEMENT FOR WILDLIFE Helen Holdsworth
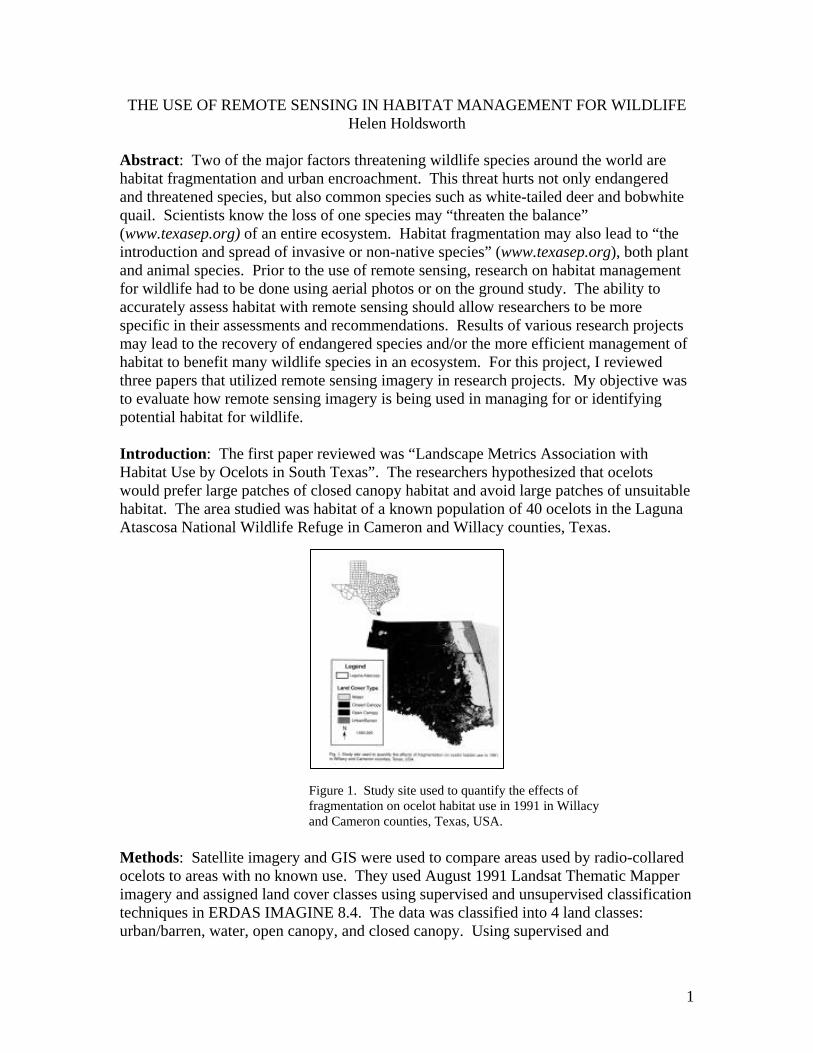
Abstract: Two of the major factors threatening wildlife species around the world are habitat fragmentation and urban encroachment. This threat hurts not only endangered and threatened species, but also common species such as white-tailed deer and bobwhite quail. Scientists know the loss of one species may “threaten the balance” (www.texasep.org) of an entire ecosystem. Habitat fragmentation may also lead to “the introduction and spread of invasive or non-native species” (www.texasep.org), both plant and animal species. Prior to the use of remote sensing, research on habitat management for wildlife had to be done using aerial photos or on the ground study. The ability to accurately assess habitat with remote sensing should allow researchers to be more specific in their assessments and recommendations. Results of various research projects may lead to the recovery of endangered species and/or the more efficient management of habitat to benefit many wildlife species in an ecosystem. For this project, I reviewed three papers that utilized remote sensing imagery in research projects. My objective was to evaluate how remote sensing imagery is being used in managing for or identifying potential habitat for wildlife. Introduction: The first paper reviewed was “Landscape Metrics Association with Habitat Use by Ocelots in South Texas”. The researchers hypothesized that ocelots would prefer large patches of closed canopy habitat and avoid large patches of unsuitable habitat. The area studied was habitat of a known population of 40 ocelots in the Laguna Atascosa National Wildlife Refuge in Cameron and Willacy counties, Texas. Figure 1. Study site used to quantify the effects of
fragmentation on ocelot habitat use in 1991 in Willacy and Cameron counties, Texas, USA.
Methods: Satellite imagery and GIS were used to compare areas used by radio-collared ocelots to areas with no known use. They used August 1991 Landsat Thematic Mapper imagery and assigned land cover classes using supervised and unsupervised classification techniques in ERDAS IMAGINE 8.4. The data was classified into 4 land classes: urban/barren, water, open canopy, and closed canopy. Using supervised and
1
unsupervised techniques increased accuracy by “teasing apart land cover types with similar reflectance patterns.” Researchers conducted an accuracy assessment using a stratified sampling design with ground reference data and aerial photography from Texas Natural Resource Information Service (TNRIS). They also used aerial photos or digital orthophoto quadrangles (DOQs) to determine land cover. Researchers tracked radio-collared ocelots to determine frequency of habitat use. They used the following landscape metrics because they represent the degree of fragmentation occurring in the landscape: number of patches, mean patch size, shape, edge, and mean nearest neighbor. Shape was calculated with the following formula: MSI = sum of each patch perimeter divided by the square root of the patch area. MSI = 1 indicates a circle or square, with deviations from 1 indicating a more complex shape. Mean nearest neighbor measures the shortest distance between patches of similar class values. Patches of each land cover class were divided into three categories: small: <28 ha, medium: 29 – 2,461 ha, and large: 4,930 – 10,614 ha. Results: Closed canopy, the ocelots preferred habitat, showed the second highest degree of fragmentation (urban/barren had the greatest). There were 3,309 patches with a mean size of 2.9 ha. Mean shape index was similar for all land classes. Mean nearest neighbor ranged from 42.52 m (open canopy) to 116.3 m (water). Patches used by the ocelots had longer edge lengths (mean = 15 km). Ocelots preferred small (<28 ha) patches of water and medium-sized (29 to 2,461 ha) patches of closed canopy. 1,000 random points located throughout the study site determined the use of patches. Discussion and Management Implications: Results indicate that ocelots were choosing areas of greater fragmentation that were smaller, less contiguous patches with greater amounts of edge. But the ocelots utilized the largest patches of closed canopy available to them, which only had a mean of 2.9 ha. The rarity of large patches (4,930 to 10,614 ha) may mislead interpretation of the results. For wildlife managers, the researchers suggested considering the size, shape, and amount of edge for each patch of suitable habitat. Scarcity of large tracts of suitable habitat may necessitate consideration of conserving areas with smaller patches. Introduction: The next paper reviewed was “Landscape Models to Predict the Influence of Forest Structure on Tassel-Eared Squirrel Populations”. One of the research goals was to assess which forest structural characteristics (basel area, tree density, and canopy cover) were the best for modeling tassel-eared squirrel density and recruitment. The study area was approximately 800,000 ha of forested land on the Mogollon Plateau, north and west of Flagstaff, Arizona. Methods: Researchers used data collected by the Forest Ecosystem Restoration Analysis project, which mapped the vegetation composition and structure over the study area. They derived the vegetation layers from imagery using associated ground measurements of forest structure as training areas, derived the canopy-cover layer from digital orthophoto quadrangles, and derived the basel area and tree-density layers from ETM imagery. The resolution of each layer was 90 m. Squirrel density was measured by a feeding-sign index technique and recruitment was measured by trapping.
2

Figure 2. Basel area estimates for Mogollon Plateau
Figure 2. Canopy cover estimates for Mogollon Plateau
Results: Correlations between all three forest variables were high (0.87 – 0.93). Basel area showed the strongest relationship with both density and recruitment. Results indicated that high basel area (mature trees) and overhead canopy (cover) work in combination to influence squirrel population parameters. Discussion and Management Implications: Researchers concluded that squirrel density is best predicted using only basel area at the plot level. Basel area is probably the best predictor of the presence of mature pines, on which the squirrels depend in part for survival. They also inferred from the data that canopy cover of around 40-50% has a great deal of influence on squirrel recruitment. To minimize any decline in the tassel-eared squirrel population when thinning forests, it is suggested that efforts focus on the removal of smaller trees and maintain areas with high basel area. They also recommended leaving large areas of habitat (>160 ha) with moderate to high canopy (>40%). Introduction: The third paper reviewed was “Identifying Suitable Sites for Florida Panther Reintroduction”. The researchers hypothesized that some sites within the historic range of the Florida panther would provide more suitable habitat conditions for the panther than others. The study area was the entire historic range of the Florida panther (most of the southeastern United States) and the current distribution of the panther (South Florida) served as a reference area. Methods: Researchers generated GIS map layers with a resolution of 500 x 500 m to examine habitat conditions in the historic range of the panther. They created a map using land-cover classes from the 1992 National Land Cover Data. They selected sever variables for their habitat model: (1) percentage of natural land cover (calculated as the proportion of natural land cover patches within an area), (2) contagion (3) patch density (higher patch density indicated an increase in fragmentation), (4) human population density, (5) minor road density, (6) major road density, and (7) percentage of urban land cover. Data for (4), (5), and (6) came from the U.S. Census Bureau. Telemetry data was
3
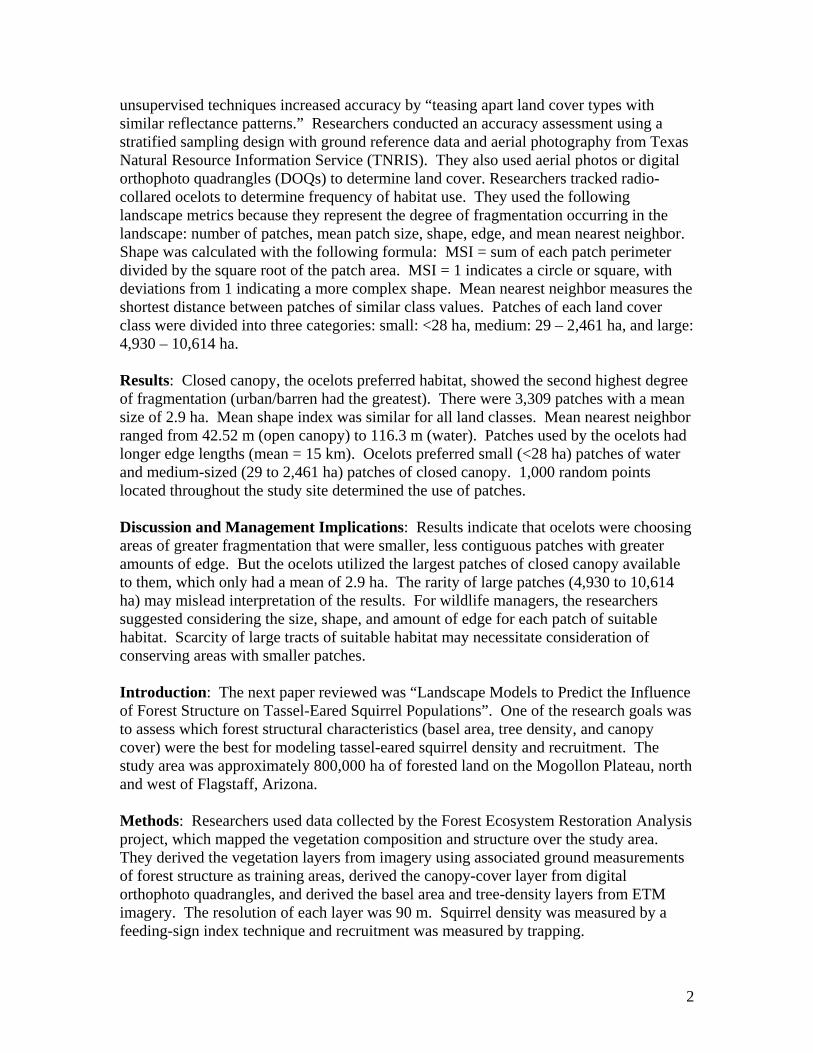
collected from radio-collared panthers in south Florida. A survey of Florida panther experts was also conducted.
Figure 4. Distribution of Florida panther telemetry locations, south Fla., USA, 1981-2001.
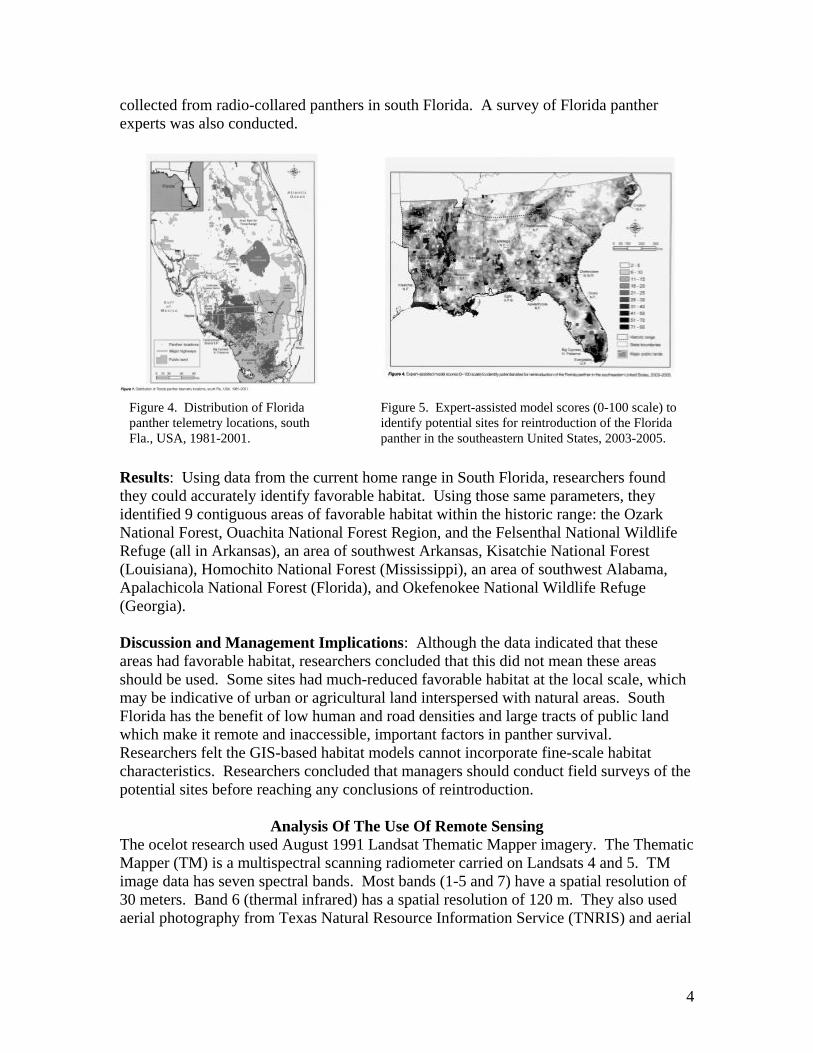
Figure 5. Expert-assisted model scores (0-100 scale) to identify potential sites for reintroduction of the Florida panther in the southeastern United States, 2003-2005.
Results: Using data from the current home range in South Florida, researchers found they could accurately identify favorable habitat. Using those same parameters, they identified 9 contiguous areas of favorable habitat within the historic range: the Ozark National Forest, Ouachita National Forest Region, and the Felsenthal National Wildlife Refuge (all in Arkansas), an area of southwest Arkansas, Kisatchie National Forest (Louisiana), Homochito National Forest (Mississippi), an area of southwest Alabama, Apalachicola National Forest (Florida), and Okefenokee National Wildlife Refuge (Georgia). Discussion and Management Implications: Although the data indicated that these areas had favorable habitat, researchers concluded that this did not mean these areas should be used. Some sites had much-reduced favorable habitat at the local scale, which may be indicative of urban or agricultural land interspersed with natural areas. South Florida has the benefit of low human and road densities and large tracts of public land which make it remote and inaccessible, important factors in panther survival. Researchers felt the GIS-based habitat models cannot incorporate fine-scale habitat characteristics. Researchers concluded that managers should conduct field surveys of the potential sites before reaching any conclusions of reintroduction.
Analysis Of The Use Of Remote Sensing The ocelot research used August 1991 Landsat Thematic Mapper imagery. The Thematic Mapper (TM) is a multispectral scanning radiometer carried on Landsats 4 and 5. TM image data has seven spectral bands. Most bands (1-5 and 7) have a spatial resolution of 30 meters. Band 6 (thermal infrared) has a spatial resolution of 120 m. They also used aerial photography from Texas Natural Resource Information Service (TNRIS) and aerial
4
photos or digital orthophoto quadrangles (DOQs). Researchers did not report any limitations or problems with the use of this imagery. The tassel-eared squirrel research used data collected by the Forest Ecosystem Restoration Analysis (ForestERA) project. This is a collaborative effort of university, government, non-profit organizations, landowners, citizens, and other stakeholders. The project develops recommendations and assessments that may be used by any stakeholders to develop plans for forest restoration. ForestERA has developed and acquired spatial data for the western Mogollon Plateau in north-central Arizona, the White Mountains region in eastern Arizona and north-central New Mexico area. The maps shown are from the ForestERA project. The canopy cover layer was derived from Digital Orthophoto Quadrangles. Each 1 m pixel was classified as canopy foliage, shadow, or ground vegetation. The pixels were then aggregated across larger areas to determine percent cover. The basel area and tree density layers were developed from the Landsat 7 Enhanced Thematic Mapper (ETM) imagery using training data from over 560 ground locations. The ETM is a multispectral scanning radiometer with eight spectral bands. Most bands (1-5 and 7) have a spatial resolution of 30 meters. Band 6 (thermal infrared) has a spatial resolution of 120 m. Band 8 (panochromatic) has a spatial resolution of 15 m. Researchers did not report any limitations or problems with the use of this imagery. The Florida panther research used GIS map layers with a resolution of 500 x 500 m. Because the habitat and landscape conditions of southern Florida are so unique, they felt they could not use those specific variables to define the necessary parameters. They used the 1992 National Land Cover Data, which is project sponsored by the Multi-Resolution Land Characteristics (MRLC) consortium. The land cover data area derived from images acquired by Landsat-5 Thematic Mapper sensor and some other data sources. It was the first national land cover data produced since the early 1970’s. Currently, new land cover data is being processed from 2000 data collected from Landsat-7 Enhanced Thematic Mapper. The researchers believed that the GIS-based habitat could not incorporate fine scale characteristics such as vegetation structure and detailed information on prey availability. Therefore, they suggested on-the-ground field study be undertaken at the suggested sites prior to any reintroductions. It is my conclusion that there are many remote sensing tools available to researchers. The exact data you use depends on the type of information you are looking for and the tools available to assess that data. As better sensors and better software are developed, there is no doubt that more work will be done in this area of habitat evaluation. All three projects did have to undertake some ground-truth work and that will probably always be necessary to validate the data.
5
References Environmental Protection Agency, Multi-Resolution Land Characteristics Consortium. http://www.epa.gov/mrlc/nlcd.html. Forest Ecosystem Restoration Analysis Project. http://forestera.nau.edu. Jackson, Victoria L., Linda L. Laack, and Earl G. Zimmerman. 2005. Landscape Metrics Associated with Habitat Use by Ocelots in South Texas. Journal of Wildlife Management 69:733 – 738. Prather, John W., Norris L. Dodd, Brett G. Dickson, Haydee M. Hampton, Yaguang Xi, Ethan N. Aumuck, and Thomas D. Sisk. 2006. Landscape Models to Predict the Influence of Forest Structure on Tassel-Eared Squirrel Populations. Journal of Wildlife Management 70:723-731. Texas Environmental Profiles. http://www.texasep.org. Thatcher, Cindy A., Frank T. Van Manen, and Joseph D. Clark. 2006. Identifying Suitable Sites for Florida Panther Reintroduction. Journal of Wildlife Management 70:752 – 763. United States Geological Survey. http://edc.usgs.gov/products/satellite/tm.html. United States Geological Survey. http://eros.usgs.gov/products/satellite/landsat7.html.
6