the use of garch models in var estimationmacro.soc.uoc.gr/8conf/docs/the use of garch models in...
TRANSCRIPT

The Use of GARCH Models in VaR Estimation
Timotheos Angelidis ∗
Alexandros Benos †
andStavros Degiannakis‡
December 2003.
Abstract
We evaluate the performance of an extensive family of ARCH models in modeling daily Value-at-Risk (VaR) of perfectly diversified portfolios in five stock indices, using a number of distri-butional assumptions and sample sizes. We find, first, that leptokurtic distributions are ableto produce better one-step-ahead VaR forecasts; the choice of sample size is important for theaccuracy of the forecast, whereas the specification of the conditional mean is indifferent. Finally,despite the claims for the contrary, a different and specific structure of ARCH model producesthe most accurate VaR forecast for each index portfolio.
JEL Nos.: C22; C52; C53; G15Keywords: Value at Risk, GARCH estimation, Backtesting, Volatility forecasting, Quantile LossFunction.
∗Dept. of Banking and Financial Management, University of Piraeus, 80, Karaoli & Dimitriou street,University of Piraeus, Piraeus GR-185 34, Greece. Email: [email protected] Tel.:+30-6932-897664. Cor-responding author.
†Dept. of Banking and Financial Management, University of Piraeus, 80, Karaoli & Dimitriou street,University of Piraeus, Piraeus GR-185 34, Greece. Email: [email protected] Tel.:+30-210-4142-187.
‡Dept. of Statistics, Athens University of Economics and Business, 76, Patision street, Athens GR-10434 Email: [email protected] Tel.:+30-210-8203-120. The usual disclaimer applies.

1 Introduction
Following the increase in financial uncertainty in the 90’s, resulting to famous financial disasters,(see Jorion (1997), Dowd (1998) and Crouhy et al. (2001) for more information), there has beenintensive research from financial institutions, regulators and academics to better develop sophis-ticated models for market risk estimation. The most well known risk measure is Value-at-Risk(VaR), which refers to a portfolio’s worst outcome that is expected to occur over a predeterminedperiod and at a given confidence level.
In general, VaR is an estimation of the tails of the empirical distribution. Many applicationspresume that asset returns are normally distributed, while it is widely documented that they ex-hibit skewness and excess kurtosis, resulting in an underestimation or overestimation of the trueVaR. Venkataraman (1996) and Zangari (1996) proposed the use of a mixture of normal distribu-tions, which is fatted tailed and able to capture the extreme events compared to the ”classical”approaches more easily. Billio and Pelizzon (2000) introduced a multivariate switching regimemodel in order to calculate the VaR for 10 Italian stocks and for several portfolios that have beengenerated by them. They contrasted their model under two backtesting measures and they con-cluded that switching regimes are more accurate than the other known methods (RiskMetricsTM
and Garch (1,1) under Normal and Student-t distribution). Gurmat and Harris (2002) estimatedan exponentially weighted maximum likehood model for three equity portfolios and its forecastsimproved the VaR numbers at higher confidence levels. Giot and Laurent (2002) estimated dailyVaR for stock index returns by using a skewed student distribution and pointed out that it per-formed better than the pure symmetric one, as it reproduced the characteristics of the empiricaldistribution more precise. One year later, Giot and Laurent (2003) used the same distributionalassumption for six commodities and proposed to market practitioners to use the Skewed Student-tARCH model because its estimation is easily implemented even in a spreadsheet-like environmentand the predicted VaR numbers were close to the expected ones. However, they stated that themost complex model (APARCH) performed better overall. Based on the influence of asymmetriceffects in the accuracy of the VaR estimates, Brooks and Persand (2003) concluded that mod-els, which do not allow for asymmetries either in the unconditional return distribution or in thevolatility specification, underestimate the true VaR.
Many researchers prefer to conduct simulations in order to calculate VaR, than to explicitly usea specific parametric distribution. Lambadiaris et al. (2003) performed historical and Monte Carlosimulations in Greek stocks and bonds market, by using two different sample sizes. They concludedthat the Monte Carlo method was more appropriate for the stock market, while for the bonds theresults were depending on the backtesting procedure and the given confidence level. Similarly,Cabedo and Moya (2003) developed an ARMA historical simulation method, which improved thesimple historical VaR estimation. They used eight years of daily oil prices in order to estimatethe coefficients of their model and one year to conduct the out of sample forecasts. Both worksused different sample sizes as the importance of them has been examined and pointed out byseveral authors. Jackson et al. (1998) provided evidence that at higher confidence levels, historicalsimulation based methods work better than other methods. On the contrary, Hendricks (1996)and Vlaar (2000) supported that the increase of the sample size tends to generate more accurateVaR estimations. Hoppe (1998) also examined the issue of the sample size and argued that theuse of smaller sample size would lead to more accurate VaR estimates than the longer one. Freyand Michaud (1997) in their study supported the use of short sample sizes in order to capture the
1

structural changes over time due to changes in trading behaviour. To sum up, the choice of anappropriate historical sample size as well as an adequate model for forecasting volatility should beconsidered far from resolved.
The purpose of our paper is twofold. First to implement several volatility models under threedistributional assumptions and four historical sample sizes in order to estimate the 95% and 99%one-day VaR for five completely diversified index portfolios (S&P 500, Nikkei 225, FTSE 100,CAC 40 and DAX 30). The different distributions (Normal, Student-t and Generalized ErrorDistribution) will allow the selection of a more flexible model for the return tails, while the foursample sizes (500, 1000, 1500 and 2000 observations) will reveal the importance of past data.For robustness purposes, we have used five different stock indices, to avoid results dependenton a specific financial market. Combined with three different interpretations of the ARCH family(GARCH, TARCH and EGARCH) and more than 1800 one-step-ahead VaR estimate, it brings thetotal of estimated models to more than 4 millions ! Despite the enormous set of estimated models(484 models for each index), we did not include all the ARCH specifications that are availablein the literature. However, we estimated models that are able to capture the most importantcharacteristics of financial markets.
Second, to evaluate the predictive accuracy of various models under a risk management frame-work. We employ a two stage procedure to investigate the forecasting power of each volatilityforecasting technique. Specifically, in the first stage, two backtesting criteria are implementedto test the statistical accuracy of the models. In the second stage, we employ standard forecastevaluation methods in order to examine whether the differences between the models, which havebeen converged sufficiently, are statistically significant. We focus on out-sample evaluation criteriabecause we believe that an inadequate model, according to in-sample evaluation criteria, can yieldbetter forecasts than a correctly specified one.
Our study shows that more flexible GARCH models are more adequate in volatility forecastingthan parsimonious models for all indices, distributional assumptions and both confidence levels.The asymmetric models fare better than the simpler ones, as they capture the characteristics of theunderlying series more efficiently. As concerns the choice of the distribution, the leptokurtic onesprovide better estimators of VaR since they perform better in the low probability regions that Valueat Risk tries to measure. Moreover, although the use of all available data in forecasting volatility iscommon practice, we find out that, at least for some cases, a restricted sample size could generatemore accurate one-step-ahead VaR forecasts as it could incorporate changes in trading behaviourmore efficiently.
The rest of the paper is organized as follows. Section 2 provides a description of the ARCHmodels, while the third section describes the evaluation framework for VaR estimates. Section 4presents preliminary statistics for the dataset, explains the estimation procedure and presents theresults of the empirical investigation of the estimated models for the five equity indices. Section 5concludes the paper.
2 Volatility Models
Let yt = ln(St/St−1) denote the continuously compound rate of return from time t− 1 to t, whereSt is the asset price at time t. We assume that the time series of interest, yt, is decomposed intotwo parts, the predictable and unpredictable component, yt = E (yt|It−1) + εt, where It−1 is theinformation set at time t− 1, E is the conditional mean operator and εt is the unpredictable part,
2

or innovation process. The conditional mean return is considered as a k-th order autoregressiveprocess, AR(k):
E (yt|It−1) ≡ c0 +k∑
i=1
ciyt−i.
The autoregressive process allows for the autocorrelation induced by discontinuous (or non-synchronous)trading in the stocks making up an index (Scholes and Williams (1977), Lo and MacKinlay (1988)).The unpredictable component, εt, can be expressed as an ARCH process in the following form:
εt = ztσt,
where zt is a sequence of independently and identically distributed random variables with zero meanand unit variance. The conditional variance of εt is σt, is a time-varying, positive and measurablefunction of the information set at time t − 1. Note that, even though the innovation process forthe conditional mean is serially uncorrelated, it is not time independent.
Engle (1982) introduced the ARCH(q) model and expressed the conditional variance as a linearfunction of the past q squared innovations
σ2t = a0 +
q∑i=1
aiε2t−i.
For the conditional variance to be positive, the parameters must satisfy a0 > 0 and ai ≥ 0 fori = 1, . . . , q. Empirical evidence has shown that a high q must be selected in order to estimatethe conditional variance properly. To circumvent this problem, Bollerslev (1986) proposed thegeneralized ARCH, or GARCH(p,q), model:
σ2t = a0 +
q∑i=1
aiε2t−i +
p∑j=1
bjσ2t−j , (1)
where a0 > 0, ai ≥ 0 for i = 1, . . . , q, and bj ≥ 0 for j = 1, . . . , p. If∑q ai +
∑p bj < 1, then theprocess εt is covariance stationary and its unconditional variance is equal to
σ2 =a0
1−∑q ai −
∑p bj.
A special case of the GARCH family is the Exponentially Weighted Moving Average (EWMA) al-ternative, used by the company RiskMetricsTM, when they introduced their analytic VaR method-ology. The volatility forecast is the weighted average of the previous period’s forecast and thecurrent squared return. They calculate return variance as an exponentially declining processσ2
t = λσ2t−1 + (1 − λ)ε2
t−1, a special case of GARCH(1,1) with a zero intercept and the two re-maining parameters summing to one. RiskMetricsTM use λ = 0.94 for daily data and go 75 datapoints backwards in their estimation horizon.
The GARCH(p,q) model successfully captures several characteristics of financial time series,such as thick tailed returns and volatility clustering, as noted by Mandelbrot (1963): “. . . largechanges tend to be followed by large changes of either sign, and small changes tend to be followedby small changes. . . ”. On the other hand, the GARCH structure present some drawbacks onimplementation, since it (a) requires large numbers of observations to produce reliable estimates,
3

and (b) may be unstable out of sample. It also imposes important limitations since variancedepends on the magnitude and not on the sign of εt, which is somewhat at odds with the empiricalbehaviour of stock market prices where a leverage effect may be present.1 The term leverage effect,first noted by Black (1976), refers to the tendency for changes in stock returns to be negativelycorrelated with changes in returns volatility, i.e. volatility tends to rise in response to bad news,(εt < 0), and to fall in response to good news (εt > 0). Moreover, Brooks and Persand (2003a)stated that a VaR model which does not account for asymmetries in the volatility specification, itis most likely to generate inaccurate forecasts.
In order to capture the asymmetry exhibited in the data, a new class of models was intro-duced, termed the asymmetric ARCH models. The most popular model proposed to capture theasymmetric effects is Nelson’s (1991) exponential GARCH, or EGARCH(p,q), model:
ln(σ2t ) = a0 +
q∑i=1
(ai|
εt−i
σt−i|+ γi
εt−i
σt−i
)+
p∑j=1
(bj ln(σ2
t−j)). (2)
In contrast to the GARCH model, no restrictions need to be imposed on the model estimation,since the logarithmic transformation ensures that the forecasts of the variance are non-negative.The parameters γi allow for the asymmetric effect. If γ1 = 0 then a positive surprise, εt > 0, hasthe same effect on volatility as a negative surprise, εt < 0. The presence of leverage effect can beinvestigated by testing the hypothesis that γ1 < 0.
The number of possible conditional volatility formulations is vast. The threshold GARCH, orTARCH(p,q), model is one of the widely used models:
σ2t = a0 +
q∑i=1
aiε2t−i + γ1ε
2t−1dt−1 +
p∑j=1
bjσ2t−j , (3)
where dt = 1 if εt < 0, and dt = 0 otherwise and hence it allows a response of volatility to newswith different coefficients for good and bad news.
Although, there are various ways to parameterise the asymmetry effect, the EGARCH andTARCH models are the most widely known models (see Engle and Patton (2001), Brooks andPersand (2003a) and Brooks and Persand (2003b) among others.). Furthemore, the most econo-metric packages include routines for the estimation of these two asymmetric specifications of theconditional variance and therefore they can be used by a risk manager effortlessly.
A wide range of ARCH models proposed in the literature has been reviewed by Bollerslev etal. (1992), Bera and Higgins (1993), Bollerslev et al. (1994), Hamilton (1994), and Degiannakisand Xekalaki (2003).
As concers the distribution of zt, Engle (1982) who introduced the ARCH process assumed thatthey are normally distributed. Bollerslev (1987), however, proposed the standardized t-distributionwith v > 2 degrees of freedom
D(zt; v) =Γ ((v + 1)/2)
Γ(v/2)√
π(v − 2)(1 +
z2t
v − 2)−
v+12 , (4)
1In such a case, a stochastic volatility model may be more appropriate. There is some evidence that thesemodels may perform better than multivariate GARCH models (Danielsson (1996)) but they are also more difficultto estimate.
4

where Γ(v) =∫∞0 e−xxv−1dx is the gamma function and v is the degree of freedom. The t-
distribution is symmetric around zero and, for v > 4, the conditional kurtosis equals 3(v − 2)(v −4)−1, which exceeds the normal value of three, but for v →∞, the density function of the standard-ized t-distribution converges to the density function of the standard normal distribution. Nelson(1991), on the other hand, suggested the use of the generalized error distribution, or GED:
D(zt; v) =v exp (−0.5 |zt/λ|v)
2(1+1/v)Γ(v−1)λ, v > 0, (5)
where v is the tail-thickness parameter and λ ≡√
2−2/vΓ(v−1)Γ(3v−1). When v = 2, zt is standardnormally distributed. For v < 2, the distribution of zt has thicker tails than the normal distribution(e.g., for v = 1, zt has a double exponential distribution) while for v > 2, the distribution of zt hasthinner tails than the normal distribution (e.g., for v = ∞, zt has a uniform distribution on theinterval (−
√3,√
3)). Guermat and Harris (2002) applied the Student t-distribution and Longer-stay (1996) used a mixture of normal distributions. The Gram-Charlier type distribution (Leeand Tse (1991)), the generalized t-distribution (Bollerslev et al. (1994)), the skewed t-distribution(Lambert and Laurent (2000, 2001)), the normal Poisson mixture distribution (Jorion (1988))and the normal lognormal mixture (Hsieh (1989)) among others are distributions that have beenemployed.
Maximum likelihood estimation is commonly used to estimate ARCH models. Under the as-sumption of independently and identically distributed standardized innovations, zt, and for D(zt; v)denoting their density function, the log-likelihood function of {yt(θ)} for a sample of T observationsis given by:
LT ({yt}; θ) =T∑
t=1
[ln [D (zt(θ); v)]− 1
2ln
(σ2
t (θ))]
, (6)
where θ is the vector of the parameters that have to be estimated for the conditional mean, condi-tional variance and density function. The maximum likelihood estimator θ̂ for the true parametervector is found by maximizing (6). Hence, we have the following results for the log-likelihoodfunction applied to a sample of T observations:
1. For normally distributed standardized innovations:
LT ({yt}; θ) = −12
[T ln(2π) +
T∑t=1
z2t +
T∑t=1
ln(σ2t )
]. (7)
2. For standardized t-distributed innovations:
LT ({yt}; θ) = T
[ln Γ
(v + 1
2
)− ln Γ
(v
2
)− 1
2ln[π(v − 2)]
]−
12
T∑t=1
[ln(σ2
t ) + (1 + v) ln(
1 +z2t
v − 2
)]. (8)
3. For GED distributed innovations:
LT ({yt}; θ) =T∑
t=1
[ln
(v
λ
)− 1
2
∣∣∣zt
λ
∣∣∣v −5

(1 + v−1) ln(2)− ln Γ(
1v
)− 1
2ln(σ2
t )]
, (9)
Maximum likelihood estimates of the parameters are obtained by numerical maximization of thelog-likelihood function using the Marquardt algorithm (Marquardt (1963)). We use the quasi-maximum likelihood estimator (QMLE) since, according to Bollerslev and Wooldridge (1992), itis generally consistent, has a normal limiting distribution and provides asymptotic standard errorsthat are valid under non-normality.
For the GARCH(p,q) model the one-step-ahead conditional variance forecast, σ̂2t+1|t, is:
σ̂2t+1|t = a
(t)0 +
q∑i=1
a(t)i ε2
t−i+1 +p∑
j=1
b(t)j σ2
t−j+1. (10)
For the EGARCH(p,q) model, we get instead:
σ̂2t+1|t = exp
a(t)0 +
q∑i=1
[a
(t)i
∣∣∣∣ εt−i+1
σt−i+1
∣∣∣∣ + γ(t)i
(εt−i+1
σt−i+1
)]+
p∑j=1
b(t)j ln(σ2
t−i+1)
. (11)
Notice that the value of E|zt| depends on the density function of zt. For example, for the standardnormal distribution, E|zt| =
√2/π; for the Student t-distribution,
E|zt| =2Γ[(1 + v)/2]
√v − 2
1 + (v − 1)Γ(v/2)√
π,
and for the GED distribution,
E|zt| = λ 21/v Γ(2/v)Γ(1/v)
.
However, the quantity εt−i+1σ−1t−i+1, both with and without the absolute value operator, for i ≥ 1,
can be straightforwardly computed by the model, as the values of both the innovation and itsconditional standard deviation are available. Finally, the corresponding one-step-ahead conditionalvariance forecast in the case of the TARCH(p,q) model is:
σ̂2t+1|t = a
(t)0 +
q∑i=1
[a
(t)i ε2
t−i+1
]+ γ(t)ε2
t dt +p∑
j=1
[b(t)j σ2
t−j+1
]. (12)
Therefore, it is straightforward to compute the one-step-ahead VaR forecast, since under all distri-butions, we can compute the corresponding quantiles, which we then multiply by our conditionalstandard deviation forecast:
V aRt+1|t = F (α)σ̂t+1|t, (13)
given that F (α) is the corresponding quantile of the assumed distribution, and σ̂t+1|t is the forecastof conditional standard deviation at time t.
6

3 Evaluating the different approaches
Our objective is to test these different volatility forecasting techniques in a risk management en-vironment. The quality of our VaR forecast and, naturally, anything else depending on theseforecasts, depends on the quality of our volatility forecasts. We must, nevertheless, first choosea metric by which we will judge the ”quality” of VaR forecasts. It is well known that there aremany sources of error in VaR figures: sampling errors, data problems, inappropriate models orspecifications, etc. All these factors will make our VaR estimate often to be biased. We must alsotackle the fact that we never actually observe any realized VaR value after the event, since ourmodel forecasts an inherently unobservable variable. We, therefore, have to monitor VaR forecastsand, afterwards, judge volatility models, not by checking whether our forecasts are realized, butwhether they are consistent with subsequently realized returns given the confidence interval onwhich the forecasts were constructed in the first place.
Moreover, an adequate model must not only generate statistical accurate VaR forecasts, but ithas to be preferred over the others. The statistical adequacy will be tested based on Kupiec’s (1995)and Christoffersen’s (1998) backtesting measures, while the comparison between models of equiv-alent ability, in terms of statistical adequacy, will be performed via a loss function.
3.1 Unconditional Coverage
Let N =∑T
t=1 It be the number of days over a T period that the portfolio loss was larger than theVaR estimate, where
It+1 ={
1, if yt+1 < VaRt+1|t0, if yt+1 ≥ VaRt+1|t.
Hence, N is the observed number of exceptions in the sample. As argued in Kupiec (1995), thefailure number follows a binomial distribution, N ∼ B(T, p), and consequently the appropriatelikelihood ratio statistic, under the null hypothesis that the expected exception frequency N/T =p, is:
2 ln[(1− N
T)T−N (
N
T)N ]− 2 ln[(1− p)T−NpN ].
Asymptotically, this test is x2 distributed with one degree of freedom, while, in Table 3.1, wepresent the no rejection regions of N for various sample sizes and confidence levels. This test canreject a model for both high and low failures but, as stated by Kupiec (1995), its power is generallypoor. So we turn to a more elaborate criterion.
3.2 Conditional coverage
A more complete test was made by Christoffersen (1998), who developed a likelihood ratio statisticto test the joint assumption of unconditional coverage and independence of failures. Its mainadvantage over the previous statistic is that it takes account of any conditionality in our forecast:if volatilities are low in some period and high in others, the forecast should respond to this clusteringevent. The Christoffersen procedure enables us to separate clustering effects from distributionalassumption effects. His statistic is computed as:
−2 ln[(1− p)T−NpN ] + 2 ln[(1− π01)n00πn0101 (1− π11)n10πn11
11 ] ∼ χ22, (14)
7

Confidence level Evaluation sample size250 500 750 1000
5% 7 ≤ N ≤ 19 17 ≤ N ≤ 35 27 ≤ N ≤ 49 38 ≤ N ≤ 641% 1 ≤ N ≤ 6 2 ≤ N ≤ 9 3 ≤ N ≤ 13 5 ≤ N ≤ 16
0.5% 0 ≤ N ≤ 4 1 ≤ N ≤ 6 1 ≤ N ≤ 8 2 ≤ N ≤ 90.1% 0 ≤ N ≤ 1 0 ≤ N ≤ 2 0 ≤ N ≤ 3 0 ≤ N ≤ 3
0.01% 0 ≤ N ≤ 0 0 ≤ N ≤ 0 0 ≤ N ≤ 1 0 ≤ N ≤ 1
Table 1: Kupiec’s (1995) unconditional coverage test. No rejection regions for a 5% test size.
where nij is the number of observations with value i followed by j, for i, j = 0, 1 and
πij =nij∑j nij
are the corresponding probabilities. i, j = 1 denotes that an exception has been made, while i, j = 0indicates the opposite. If the sequence of It is independent, then the probabilities to observe ornot a VaR violation in the next period must be equal, which can be written more formally asπ01 = π11 = p. The main advantage of this test is that it can reject a VaR model that generateseither too many or too few clustered violations, although it needs several hundred observations inorder for the test to be accurate.
3.3 Loss Functions
The evaluation of the VaR forecasts is obtained by two hypothesis testing procedures. Whenthe null hypothesis is not rejected, the model is characterized as an adequate model for volatilityforecasting. Although the backtesting measures are used to check the adequacy of the models, theycannot conclude if a model is more accurate than another.
Lopez (1998) suggested measuring the accuracy of VaR forecasts on the basis of the distancebetween the observed returns and the forecasted VaR value:
Ψt+1 ={
1 + (yt+1 −VaRt+1|t)2, if yt+1 < VaRt+1|t0, if yt+1 ≥ VaRt+1|t.
According to Lopez (1998), a VaR model is penalized when an exception takes place and is preferredwhen it minimizes the total loss, Ψ =
∑Tt=1 Ψt. The loss function, Ψ, incorporates both the
cumulative number of the exceptions and the magnitude of them. Compared to Kupiec’s (1995)binomial loss function, Ψ adds up the magnitude term, so the larger the failure the more the penaltythat is added. The VaR forecast must not overestimate or underestimate the ”true” VaR number asin both cases the firm must allocate more or less capital than it is needed. So, a model is consideredappropriate if it forecasts accurately the ”true” but unobservable VaR. The ”true” VaR is proxiedby the empirical distribution of the future realised returns. For example, if T observations areavailable for out-of-sample evaluation, then the p-quantile of them will approximate the ”true”VaR. The proposed loss function, named Quantile Loss, or QL, function, has the following form:
Ψt+1 ={
(yt+1 −VaRt+1|t)2, if yt+1 < VaRt+1|t(Percentile{y, 100p}T
1 − V aRt+1|t)2, if yt+1 ≥ VaRt+1|t,
8

At each time t a model is penalized according to either a) the distance between the V aRt+1|t forecastand the future 100p percentile of yt, which remains constant through the out-of-sample period orb) the total loss magnitude ((yt+1 − V aRt+1)2) term. Under the framework of the QL function,a model is considered adequate when it minimizes the QL function. Moreover, by constructing atest for the differences of the forecast errors, we can provide statistical inference for the forecastingability of the models. Based on Diebold and Mariano (1995) and Sarma et al. (2001), we derivehypothesis testing of the forecasting ability of the models. Let zt+1 = ΨAt+1 −ΨBt+1 , where ΨAt+1
and ΨBt+1 are the loss function indicators of models A and B, respectively. Note that, a negativevalue of zt+1 indicates that model A is superior to model B. The Diebold-Mariano (1995) statisticis the ”t-statistic” on a regression of zt+1 on a constant with HAC standard errors2.
4 Data and Results
In order to evaluate the volatility models, we generate out-of-sample VaR forecasts for five equityindices (CAC40, DAX30, FTSE100, NIKKEI225 and S&P500), obtained from DataStream for theperiod of July 9th, 1987 to October 18th, 2002. For all indices, we compute daily log returns andplot them. Volatility clustering is clearly visible in Figure 1.
Table 2 provides summary statistics as well as the Jarque–Bera statistic for testing normality.In all cases, the null hypothesis of normality is rejected at any level of significance, as there isevidence of significant excess kurtosis and negative skewness.
S&P 500 NIKKEI 225 DAX 30 CAC 40 FTSE 100Mean 0.00027 -0.00026 0.00021 0.00020 0.00014Median 0.00042 -0.00011 0.00079 0.00034 0.00048Maximum 0.08709 0.12430 0.07553 0.08225 0.07597Minimum -0.22833 -0.16135 -0.13710 -0.10138 -0.13029Std. Deviation 0.01140 0.01494 0.01455 0.01377 0.01091Skewness -2.28112 -0.05997 -0.57695 -0.32182 -0.87756Kurtosis 49.28424 10.10980 9.78510 7.39398 14.39124Jarque - Bera 347,258.8 7,936.4 7,569.2 3,143.9 21,348.6Probability 0.0000 0.0000 0.0000 0.0000 0.0000
Table 2: Descriptive statistics of the daily log returns, for the period of July 9th, 1987 to October18th, 2002
2For more details about heteroskedastic and autocorrelated consistent standard errors (HAC), see at White (1980)and Newey and West (1987).
9

Figure 1. Continuously Compounded Daily Returns of Equity Indices (S&P500, NIKKEI225, DAX30, CAC40 and FTSE100) from July 9th, 1987 to October 18th, 2002
-0.2
-0.15
-0.1
-0.05
0
0.05
0.1
0.15
7/10
/87
7/10
/88
7/10
/89
7/10
/90
7/10
/91
7/10
/92
7/10
/93
7/10
/94
7/10
/95
7/10
/96
7/10
/97
7/10
/98
7/10
/99
7/10
/00
7/10
/01
7/10
/02
NIKKEI 225 STOCKAVERAGE
-0.25
-0.2
-0.15
-0.1
-0.05
0
0.05
0.1
0.15
7/10
/87
7/10
/88
7/10
/89
7/10
/90
7/10
/91
7/10
/92
7/10
/93
7/10
/94
7/10
/95
7/10
/96
7/10
/97
7/10
/98
7/10
/99
7/10
/00
7/10
/01
7/10
/02
S&P 500 COMPOSITE
-0.15
-0.1
-0.05
0
0.05
0.1
7/10
/87
7/10
/88
7/10
/89
7/10
/90
7/10
/91
7/10
/92
7/10
/93
7/10
/94
7/10
/95
7/10
/96
7/10
/97
7/10
/98
7/10
/99
7/10
/00
7/10
/01
7/10
/02
CAC 40
-0.15
-0.1
-0.05
0
0.05
0.1
7/10
/87
7/10
/88
7/10
/89
7/10
/90
7/10
/91
7/10
/92
7/10
/93
7/10
/94
7/10
/95
7/10
/96
7/10
/97
7/10
/98
7/10
/99
7/10
/00
7/10
/01
7/10
/02
DAX 30
-0.15
-0.1
-0.05
0
0.05
0.1
7/10
/87
7/10
/88
7/10
/89
7/10
/90
7/10
/91
7/10
/92
7/10
/93
7/10
/94
7/10
/95
7/10
/96
7/10
/97
7/10
/98
7/10
/99
7/10
/00
7/10
/01
7/10
/02
FTSE 100
10

We estimate the most frequently applied model to empirical studies, the AR(1) GARCH(1,1)speciffication:
yt = c0 + c1yt−1 + ztσt (15)
ztiid∼ D(0, 1) (16)
σ2t = a0 + a1ε
2t−1 + b1σ
2t−1 (17)
assuming three different density functions for zt: the normal, the Student-t and the GeneralizedError Distribution as presented in section 2. The models are estimated using the entire datasetavailable and results are presented in Table 3. We note, first, that the conditional variance param-eters are highly significant; second, that the distribution of the zt is significantly thicker tailed thanthe normal distribution and, finally, that the parameter c1, which allows for the autocorrelationinduced by discontinuous trading, is not significant in all cases.
In what follows, we model the conditional mean as a k-th order autoregressive process andthe conditional variance as a GARCH, EGARCH or TARCH process. Using equations (7, 8, 9)presented in Section 2, we will first apply ARCH processes to a GARCH, an EGARCH and aTARCH model, all with parameters (p, q) and assuming a normal underlying distribution. Weapply these models to the data using parameter values of k = 0, . . . , 4, p = 0, 1, 2 and q = 1, 2,yielding a total of 85 models.3 Moreover, under the additional assumptions of standardized resid-uals following a thicker tailed distribution (Student and GED), we reapply the AR(1) model toGARCH(p, q), EGARCH(p, q) and TARCH(p, q) frameworks, yielding another 34 models. Thesemodels (a) are able to capture several characteristics of financial markets, such as volatility clus-tering, non-synchronous trading, leverage effect, thick tailed returns and (b) do not fail to convergefrequently (at least in the case of the normal distribution). Cases, for which the numerical maxi-mization of the log-likelihood function failed to converge more than four times4, were excluded. Onthe other hand, for the models that the non-converged cases were less than four, the VaR forecastswere computed based on previous trading day parameter estimations.
For all models and all equity indices, we used a rolling sample of 500, 1000, 1500 and 2000observations with the same number of VaR forecasts for each sample size. We generated one-dayVaR forecasts for both 95% and 99% confidence levels, as recommended by the Basel Committee.The parameters of the models are re-estimated every trading day and all tests are performed usingthe information that would have been available at the time the estimate was made. Klaassen(2002) and Hansen and Lunde (2003), among others, have estimated the in-sample parametersof the models and based on them, they derived the one-step-ahead volatility forecasts. However,we assume that the estimated parameters incorporate information about the trading behaviour,which alters across time. Thus, their estimation should be based on the most recently availableinformation set.
We did not use classical in-sample model selection criteria, such as the Akaike Information Cri-terion (Akaike (1973)) and the Schwarz Bayesian Criterion (Schwarz (1978)), which have widelybeen used in the ARCH literature for model selection, because a good in-sample performance of amodel does not necessarily lead to a good out-sample performance. Pagan and Schwert (1990) used
3Numerical maximization of the log-likelihood function, for the EGARCH(2,2) model, frequently failed to con-verge. The five EGARCH models for these parameters were, therefore, excluded.
4Four times were the maximum number that one model failed to converge under the normal distribution assump-tion.
11

Parameter S&P 500 NIKKEI 225 DAX 30 CAC 40 FTSE 100Normal Distribution
c0 0.000557 0.000549 0.000614 0.000432 0.000395(0.000132) (0.000192) (0.000199) (0.000197) (0.000150)
c1 0.028859 0.015127 0.037770 0.047177 0.058032(0.017917) (0.019737) (0.019223) (0.017319) (0.017804)
a0 1.64E-06 4.43E-06 6.76E-06 5.57E-06 3.22E-06(5.53E-07) (1.68E-06) (3.07E-06) (1.95E-06) (1.01E-06)
a1 0.103524 0.159935 0.136356 0.105451 0.116497(0.037118) (0.049919) (0.035324) (0.018500) (0.026331)
b1 0.890270 0.838772 0.837132 0.865466 0.859395(0.030393) (0.040506) (0.033176) (0.023878) (0.026836)
Log Likelihood 12468.68 10913.64 11357.62 11397.68 12492.48Student-t Distribution
c0 0.000594 0.000275 0.000711 0.000531 0.000409(0.000121) (0.000171) (0.000163) (0.000178) (0.000135)
c1 0.012507 -0.006850 0.017391 0.042970 0.049854(0.016490) (0.016965) (0.017283) (0.017279) (0.017128)
a0 8.77E-07 2.07E-06 2.61E-06 3.70E-06 2.21E-062.23E-07 (5.11E-07) (6.01E-07) (8.47E-07) (4.60E-07)
a1 0.070246 0.103547 0.103558 0.086050 0.087884(0.008139) (0.011004) (0.011609) (0.010117) (0.010318)
b1 0.925879 0.895057 0.886968 0.894520 0.891897(0.007779) (0.009965) (0.011657) (0.012412) (0.011782)
v 5.60013 6.097681 7.947894 10.49132 11.07864(0.429782) (0.473549 (0.547896) (1.124427) (0.927738)
Log Likelihood 12638.65 11076.65 11532.06 11445.73 12578.62Generalized Error Distribution
c0 0.000560 0.000306 0.000733 0.000454 0.000432(0.000116) (0.000166) (0.000163) (0.000178) (0.000135)
c1 -0.000820 -0.006770 0.017969 0.038205 0.046718(0.015669) (0.016497) (0.017162) (0.017206) (0.017111)
a0 1.11E-06 3.19E-06 4.13E-06 4.78E-06 2.67E-06(2.60E-07) (5.96E-07) (8.16E-07) (9.61E-07) (5.60E-07)
a1 0.078919 0.119683 0.118569 0.094767 0.098021(0.007099) (0.012156) (0.011676) (0.010579) (0.011616)
b1 0.915449 0.875434 0.866873 0.879949 0.879750(0.007706) (0.011438) (0.013691) (0.013724) (0.013507)
v 1.250571 1.305231 1.395110 1.552809 1.545649(0.024604) (0.023113) (0.021377) (0.035018) (0.019470)
Log Likelihood 12616.52 11040.99 11471.80 11429.26 12541.29Observations 3853 3767 3835 3826 3857
Table 3: Parameter estimates of the AR(1) GARCH(1,1) model for the five indices, using the entiredataset (9th July 1987 to 18th October 2002) and assuming three different distributions for thestandardized residuals. Standard errors are presented in parentheses.
12

a collection of parametric and nonparametric models of volatility forecasting (including Kernels,Fourier series and two-stage least squares regressions) and found that although the non-parametricmethods did good job as concerns the in-sample forecasting, the parametric models yielded su-perior out-of-sample forecasting ability. Hansen and Lunde (2003) noted that ”a model, whichaccommodates a significant in-sample relation need not result in better out-of-sample forecasts,compared to the forecasts obtained from a more parsimonious model”. Given these facts, we donot restrict our analysis to models that have been pre-selected by any in-sample method of modelselection.
Due to the enormous size of the results that have been generated, we will proceed as follows.First, we present the VaR forecasts estimated using the standard normal distribution assumptionfor all sample sizes and we will examine whether the performance of the models is invariant tothe choice of the sample size. We will then go on to present the contributions of alternativedistributions, namely the standardized Student-t and the generalized error distribution, to theVaR framework.
4.1 Normal Distribution
The assumption of normality produces very weak results: the vast majority of models, irrespectiveof sample size chosen, understate the true one-day 95% VaR estimate and the exception rates arehigher than the 5% predicted level. The performance of the models is heavily dependent on thestock index, with the Nikkei 225 index faring somewhat better than the others. The p-values forboth conditional and unconditional coverage are relatively low for all indices, with the Europeanmarkets showing the lowest probability values.
More specifically, we observe that, in 2000 and 1500 sample sizes, none out of the 85 modelsproduces an exception rate below the predicted 5%. In very few cases, the estimated exceptionrate is close enough to the expected one (e.g. for the S&P 500 and the NIKKEI 225 indices, theAR(1) GARCH(1,1) and the AR(1) EGARCH(1,2) models achieve the closest fit, respectively).Moreover, in almost all cases, the different specification of the conditional mean or the introduc-tion of only ARCH terms in the conditional variance does not improve significantly either theunconditional or the conditional coverage of the models. In the case of the S&P 500, the averagep-value for the null hypothesis of unconditional coverage of the GARCH(1,1) family is 56%, whilethe best performing family for the NIKKEI 225 and the CAC 40 indices is the EGARCH(1,2) one,with corresponding average p-values equal to 79,1% and 13,6%, respectively. Similarly, for theDAX 30 and the FTSE 100 indices, we conclude that the null hypothesis of correct unconditionalcoverage is rejected for all the models at the 10% level of significance, while the hypothesis of con-ditional coverage is rejected at the 15% level. It is also interesting to point out that, although theEGARCH structure captures better the asymmetric relation between returns and volatility changesand produces better unconditional VaR predictions than the TARCH family, it does not producemore accurate 95% daily VaR forecasts than the much simpler and less flexible GARCH (p, q)structure.
As for the effect of the sample size, it seems that as the latter gets smaller, the results improveat all levels. This is due to the weight given to the latest observations when using a smaller sample:the smaller sample size captures only the latest market movements and the produced VaR estimateis, hence, less dependent on the long run volatility trend, in the same sense that a 200-point movingaverage is smoother than a 50-point one. Consequently, the VaR estimate is less often rejected
13

Unconditional Coverage Conditional Coverage95% daily VaR forecasts
Index Size Model Pr. Size Model Pr.S&P 500 2000 AR(1) GARCH(1,1) 72.25% 2000 AR(1) GARCH(1,1) 79.48%
NIKKEI 225 1000 AR(0) EGARCH(1,1) 96.95% 500 AR(3) EGARCH(1,2) 93.14%DAX 30 500 AR(3) TARCH(1,2) 32.92% 500 AR(3) TARCH(1,2) 57.61%CAC 40 1000 AR(1) EGARCH(1,2) 54.44% 1000 AR(1) EGARCH(1,2) 56.38%
FTSE 100 500 AR(0) EGARCH(2,1) 33.72% 500 AR(1) TARCH(2,1) 53.27%99% daily VaR forecasts
Index Size Model Pr. Size Model Pr.S&P 500 1000 AR(0) EGARCH(1,2) 1.40% 1000 AR(0) EGARCH(1,2) 1.19%
NIKKEI 225 2000 AR(0) EGARCH(2,1) 31.87% 2000 AR(0) EGARCH(2,1) 45.51%DAX 30 500 AR(3) GARCH(1,1) 13.92% 500 AR(3) GARCH(1,1) 23.40%CAC 40 500 AR(2) GARCH(1,2) 8.70% 500 AR(2) GARCH(1,2) 15.60%
FTSE 100 1000 AR(0) EGARCH(1,1) 22.56% 1000 AR(0) EGARCH(1,1) 34.59%
Table 4: Best performed models and the relative probability values of coverage metrics for normallydistributed innovations.
at the 95% confidence level, for all models and indices. Such behavioural trend is traced even atthe 1000 observations sample, and becomes clearer at the 500 observations level, at least for threeout of five indices. The only exception to this ”rule of thumb” is the S&P 500, where the highestp-values are achieved for the largest sample size.
For the 99% VaR estimates, the exception rates are all higher than the predicted 1% for allsample sizes, with the sample size having no effect at all in improving results. As for the coveragemetrics, they are very low, ranging from 45.51% conditional coverage, for the EGARCH family onthe Nikkei 225 index, down to 1.19% for the same metric with the same modeling family applied tothe S&P 500 index. Such performance, at least for the latter index, is suggestive of a hump in thetail distribution of returns: this means it seriously underestimates risk at a high level of confidencewhereas it produces somewhat better results at the lower confidence level, yielding respectablep-values for the 95% VaR metric but extremely low ones for the 99% one.
Table 4 shows the most appropriate5 models according to conditional and unconditional cov-erage, defined as the one with the highest p-value among all the estimated models for all samplesizes6. Both coverage measures suggest the same models in most of the cases. For all indices,p-values are deemed relatively low, with the weakest ones for the European indices: we believethis is due to the inadequate description of such data using the normal distribution. The normaldistribution performs best with the Nikkei 225 index in both the 95% and the 99% level, since thenormality assumption does not significantly increase exception rates, although, through the Jarque- Bera test, it is strictly rejected as a null hypothesis.
The main points of this thorough investigation of ARCH processes can be summarized in the5Brooks and Persand (2003b) also ranked their competitive models, based on the following rule. They excluded
the volatility forecasting techniques that produced exception rate greater than the expected one, while they preferredthe models which generated proportion of failures closer to the expected exception frequency.
6In case of identical p-values being achieved by more than one model, only one of these models is given. In theappendix we present the results for all models and distribution assumptions.
14

following points. First of all, the GARCH term in the conditional variance plays an important rolesince it provides models with a longer memory and a more flexible lag structure. Secondly, thechoice of the sample size is important in generating adequant conditional variance forecasts. To ourbest knowledge, there is no persistent method in the literature for choosing the appropriate samplesize. In most studies, researchers make an arbitrary choice of a rolling sample. Nevertheless,Engle et al. (1993) applied three different sample sizes of 300, 1000 and 5000 observations andnoted, ”that some restrictions on the length of forecasting sample may be profitable”. Our studyreaches to a similar result, as different sample sizes seem to be the most appropriate for differentindices.
Generally speaking, the conditional mean specification is invariant to the VaR forecast accuracy,because the adequacy of the models does not depend on the autoregressive order. However, thereare some cases where the mean specification offers an increasing precision in VaR predictions.An example worth noting is the AR(2) GARCH(1,2) model with a 500-point sample size for theCAC 40 index, which produces the most accurate forecasts for the 99% daily VaR, though the restof the models of the GARCH(1,2) family, as presentd in Table 8.A in Appendix, do not produceadequate forecasts.
Lastly, the assumption of normally distributed standardized residuals provides us with adequateforecasts only at the 95% level. For each index, there is at least one family of ARCH processes,producing convenient predictions. On the other hand, normal distribution fails to produce usefulestimations at the 99% level. Under the assumption that the residuals are conditionally normaldistributed, their unconditional distribution has thicker tails than the normal one. However, thedegree of leptokurtosis induced by the ARCH process does not often capture all of the leptokurtosispresent in the data. In the next section, we introduce non-normality for the conditional distributionof the residuals in order to produce unconditional distribution with thicker tails.
4.2 Leptokurtic Distributions
As we have already pointed out, the normal distribution assumption does not generate accu-rately one-step-ahead VaR numbers. In order to model more adequately the thickness of tails, wewill use two different distributional assumptions for the standardized residuals: Student’s-t andthe Generalized Error Distribution (GED). In the previous section, we found out that the precisionof forecasts did not depend on the various structures of the conditional mean. We will, therefore,apply only the AR(1) specification for the conditional mean, consistent with the non-synchronoustrading effect. Models that failed to converge more than four times are totally excluded from thestudy.
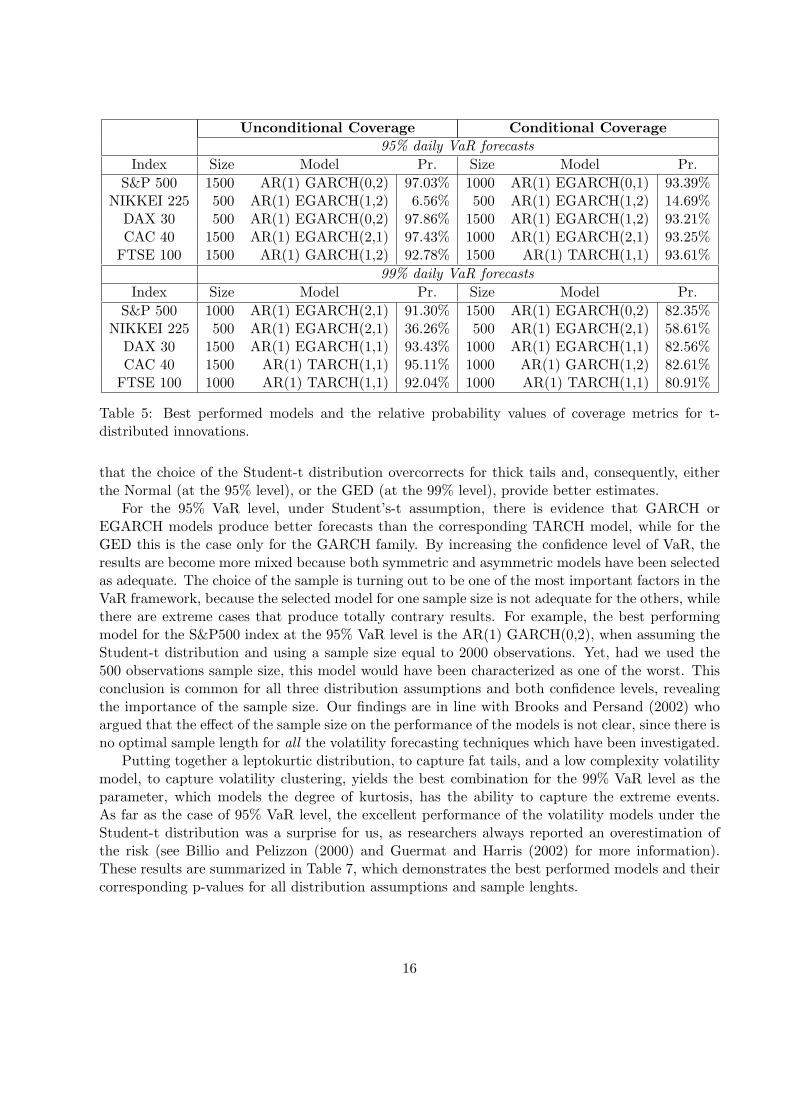
Turning now to the distribution used for the innovations, it seems that the Student’s-t is abetter choice overall, based on Tables 5 and 6 which present the models with the highest p-valuesfor the two leptokurtic distributions. Given that the fat tails are observed in all indices, the normaldistribution fails prominently if no leptokurtosis is added implicitly to a model. The GED behavessimilarly to the normal for the 95% confidence level but yields better results at the 99% confidencelevel: given that such a distribution exhibits thicker tails than the normal, it seems that the humpproblem is resolved. Its p-values for both conditional and unconditional coverage are, however,still in the 20-70% range for the S&P 500, DAX 30, CAC 40 and FTSE 100 indices. The use ofthe Student’s-t distribution, improves probability values, as they range from 80% to 95%, for allvolatility models and all sample sizes, for these four indices. In the case of the Nikkei 225, it seems
15
Unconditional Coverage Conditional Coverage95% daily VaR forecasts
Index Size Model Pr. Size Model Pr.S&P 500 1500 AR(1) GARCH(0,2) 97.03% 1000 AR(1) EGARCH(0,1) 93.39%
NIKKEI 225 500 AR(1) EGARCH(1,2) 6.56% 500 AR(1) EGARCH(1,2) 14.69%DAX 30 500 AR(1) EGARCH(0,2) 97.86% 1500 AR(1) EGARCH(1,2) 93.21%CAC 40 1500 AR(1) EGARCH(2,1) 97.43% 1000 AR(1) EGARCH(2,1) 93.25%
FTSE 100 1500 AR(1) GARCH(1,2) 92.78% 1500 AR(1) TARCH(1,1) 93.61%99% daily VaR forecasts
Index Size Model Pr. Size Model Pr.S&P 500 1000 AR(1) EGARCH(2,1) 91.30% 1500 AR(1) EGARCH(0,2) 82.35%
NIKKEI 225 500 AR(1) EGARCH(2,1) 36.26% 500 AR(1) EGARCH(2,1) 58.61%DAX 30 1500 AR(1) EGARCH(1,1) 93.43% 1000 AR(1) EGARCH(1,1) 82.56%CAC 40 1500 AR(1) TARCH(1,1) 95.11% 1000 AR(1) GARCH(1,2) 82.61%
FTSE 100 1000 AR(1) TARCH(1,1) 92.04% 1000 AR(1) TARCH(1,1) 80.91%
Table 5: Best performed models and the relative probability values of coverage metrics for t-distributed innovations.
that the choice of the Student-t distribution overcorrects for thick tails and, consequently, eitherthe Normal (at the 95% level), or the GED (at the 99% level), provide better estimates.
For the 95% VaR level, under Student’s-t assumption, there is evidence that GARCH orEGARCH models produce better forecasts than the corresponding TARCH model, while for theGED this is the case only for the GARCH family. By increasing the confidence level of VaR, theresults are become more mixed because both symmetric and asymmetric models have been selectedas adequate. The choice of the sample is turning out to be one of the most important factors in theVaR framework, because the selected model for one sample size is not adequate for the others, whilethere are extreme cases that produce totally contrary results. For example, the best performingmodel for the S&P500 index at the 95% VaR level is the AR(1) GARCH(0,2), when assuming theStudent-t distribution and using a sample size equal to 2000 observations. Yet, had we used the500 observations sample size, this model would have been characterized as one of the worst. Thisconclusion is common for all three distribution assumptions and both confidence levels, revealingthe importance of the sample size. Our findings are in line with Brooks and Persand (2002) whoargued that the effect of the sample size on the performance of the models is not clear, since there isno optimal sample length for all the volatility forecasting techniques which have been investigated.
Putting together a leptokurtic distribution, to capture fat tails, and a low complexity volatilitymodel, to capture volatility clustering, yields the best combination for the 99% VaR level as theparameter, which models the degree of kurtosis, has the ability to capture the extreme events.As far as the case of 95% VaR level, the excellent performance of the volatility models under theStudent-t distribution was a surprise for us, as researchers always reported an overestimation ofthe risk (see Billio and Pelizzon (2000) and Guermat and Harris (2002) for more information).These results are summarized in Table 7, which demonstrates the best performed models and theircorresponding p-values for all distribution assumptions and sample lenghts.
16

Unconditional Coverage Conditional Coverage95% daily VaR forecasts
Index Size Model Pr. Size Model Pr.S&P 500 2000 AR(1) GARCH(1,1) 72.25% 2000 AR(1) GARCH(1,1) 79.48%
NIKKEI 225 500 AR(1) GARCH(1,2) 61.47% 500 AR(1) GARCH(1,2) 52.22%DAX 30 500 AR(1) GARCH(2,2) 72.92% 500 AR(1) GARCH(2,2) 57.66%CAC 40 1500 AR(1) GARCH(2,1) 21.79% 1500 AR(1) GARCH(2,1) 38.84%
FTSE 100 500 AR(1) GARCH(2,2) 20.47% 500 AR(1) GARCH(2,2) 38.15%99% daily VaR forecasts
Index Size Model Pr. Size Model Pr.S&P 500 2000 AR(1) GARCH(1,1) 57.23% 2000 AR(1) GARCH(1,1) 66.25%
NIKKEI 225 500 AR(1) GARCH(1,2) 93.73% 1500 AR(1) GARCH(0,1) 82.87%DAX 30 2000 AR(1) TARCH(1,1) 54.33% 2000 AR(1) TARCH(1,1) 64.44%CAC 40 2000 AR(1) TARCH(1,1) 19.78% 2000 AR(1) TARCH(1,1) 26.41%
FTSE 100 1500 AR(1) TARCH(1,1) 57.88% 1500 AR(1) TARCH(1,1) 66.64%
Table 6: Best performed models and the relative probability values of coverage metrics for GED-distributed innovations.
4.3 Model Selection
The two backtesting measures can not compare different VaR models directly, as a greater p-value of a model, does not indicate the superiority of that model among its competitors. Therefore,in order to evaluate the reported differences statistically, for each model that has a p-value forboth tests greater than 10% we compute the QL function and carry out the equality test that wasdescribed in section 3.3. We preferred a high cut-off point for the p-value, in order to ensure that”successful” models will not statistically over or under estimate the ”true” VaR, since a high (low)VaR estimation implies that a firm must allocate more (less) capital than it is actually necessary.Under this framework, the proposed loss function evaluates all the models that converged bothconditionally and unconditionally.
Table 8 summarizes the results of the loss function approach. For each index and confidence levelwe present the six7 models with the lowest loss value, while we compare the first one with the rest ofthem based on the procedure that is explained in section 3.3. For example, for the S&P 500 indexand 95% VaR level, the best performed model is the AR(1) EGARCH(0,1) which is statisticallydifferent from the other five according to the corresponding t-statistics. In most of the cases, themodel with the lowest loss value is significantly better than the others, as the t-statistic indicates,while the preferred distribution is the Student-t. Moreover, the simplest asymmetric volatilityspecifications seems to be preferred over the most complex ones, while there is no indication whichsample length is the optimal. To summarize, the combination of a leptokurtic distribution and asimple asymmetric volatility model yields the best combination.
7The results for all the compared models are available from the authors upon request.
17

Unco
ndit
ional
Cov
erag
eC
ondit
ional
Cov
erag
e95
%da
ilyVaR
fore
cast
sIn
dex
Size
Dis
trib
utio
nM
odel
Pr.
Size
Dis
trib
utio
nM
odel
Pr.
S&P
500
2000
TA
R(1
)G
AR
CH
(0,2
)97
.03%
2000
TA
R(1
)G
AR
CH
(0,1
)93
.39%
NIK
KE
I22
510
00N
AR
(0)
EG
AR
CH
(1,1
)96
.95%
500
NA
R(3
)E
GA
RC
H(1
,2)
93.1
4%D
AX
3050
0T
AR
(1)
EG
AR
CH
(0,2
)97
.86%
1500
TA
R(1
)E
GA
RC
H(1
,2)
93.2
1%C
AC
4015
00T
AR
(1)
EG
AR
CH
(1,2
)97
.43%
1000
TA
R(1
)E
GA
RC
H(2
,1)
93.2
5%FT
SE10
015
00T
AR
(1)
GA
RC
H(1
,2)
92.7
8%15
00T
AR
(1)
TA
RC
H(1
,1)
93.6
1%99
%da
ilyVaR
fore
cast
sIn
dex
Size
Dis
trib
utio
nM
odel
Pr.
Size
Dis
trib
utio
nM
odel
Pr.
S&P
500
1000
TA
R(1
)E
GA
RC
H(2
,1)
91.3
0%15
00T
AR
(1)
EG
AR
CH
(0,2
)82
.35%
NIK
KE
I22
520
00G
AR
(1)
EG
AR
CH
(0,1
)93
.73%
2000
GA
R(1
)G
AR
CH
(0,1
)82
.87%
DA
X30
2000
TA
R(1
)G
AR
CH
(0,2
)93
.43%
2000
TA
R(1
)G
AR
CH
(0,2
)82
.56%
CA
C40
1500
TA
R(1
)TA
RC
H(1
,1)
95.1
1%10
00T
AR
(1)
GA
RC
H(1
,2)
82.6
1%FT
SE10
010
00T
AR
(1)
TA
RC
H(1
,1)
92.0
4%10
00T
AR
(1)
TA
RC
H(1
,1)
80.9
1%
Tab
le7:
Bes
tpe
rfor
med
mod
els
acco
rdin
gto
prob
abili
tyva
lues
ofco
vera
gem
etri
csfo
rN
orm
al(N
),St
uden
t(T
)or
GE
D(G
)di
stri
bute
din
nova
tion
s.
18

S&P 50095% daily VaR forecasts 99% daily VaR forecasts
Model Size Distr. Loss Value t-stat. Model Size Distr. Loss Value t-stat.AR(1) EGARCH(0,1) 2000 T 5.61% - AR(1) GARCH(0,1) 500 T 16.00% -AR(1) EGARCH(0,1) 1500 T 6.51% -1.95*** AR(1) EGARCH(0,1) 500 T 16.04% -0.08AR(1) GARCH(0,1) 1500 T 7.10% -4.13* AR(1) EGARCH(0,1) 1500 T 17.03% -0.51AR(1) GARCH(0,1) 2000 T 7.28% -3.76* AR(1) EGARCH(0,1) 1000 T 17.24% -1.05
AR(1) EGARCH(0,1) 1000 T 7.54% -4.83 AR(1) GARCH(0,1) 1000 T 18.21% -1.90***AR(1) EGARCH(0,1) 500 T 7.54% -4.63* AR(1) EGARCH(0,1) 2000 T 18.24% -1.39
NIKKEI 22595% daily VaR forecasts 99% daily VaR forecasts
Model Size Distr. Loss Value t-stat. Model Size Distr. Loss Value t-stat.AR(1) GARCH(0,1) 500 GED 4.85% - AR(1) EGARCH(0,1) 1500 GED 4.28% -AR(1) GARCH(0,2) 1000 GED 5.41% -2.34** AR(1) EGARCH(0,1) 1000 GED 5.08% -3.66*AR(1) TARCH(0,2) 1000 GED 5.64% -2.82* AR(1) EGARCH(0,1) 2000 GED 5.61% -5.40*AR(0) GARCH(0,2) 1000 Normal 5.72% -1.53 AR(1) EGARCH(0,1) 500 GED 6.71% -4.56*AR(1) GARCH(0,2) 500 GED 5.95% -4.11* AR(1) EGARCH(0,2) 1500 GED 7.31% -7.75*
AR(1) EGARCH(2,1) 500 GED 6.07% -3.61* AR(1) EGARCH(0,2) 1000 GED 7.37% -8.96*DAX 30
95% daily VaR forecasts 99% daily VaR forecastsModel Size Distr. Loss Value t-stat. Model Size Distr. Loss Value t-stat.
AR(1) EGARCH(0,1) 2000 T 7.39% - AR(1) EGARCH(0,1) 2000 T 22.08% -AR(1) EGARCH(0,1) 500 T 11.86% -8.21* AR(1) EGARCH(0,1) 1500 T 27.47% -4.37*AR(1) GARCH(0,1) 1500 T 13.20% -7.17* AR(1) EGARCH(0,2) 2000 T 35.10% -7.13*AR(1) GARCH(0,1) 2000 T 14.64% -4.91* AR(1) GARCH(0,1) 1500 T 38.26% -8.47*AR(1) GARCH(0,1) 1000 T 15.34% -7.74* AR(1) EGARCH(0,1) 500 T 40.70% -7.47*AR(1) TARCH(0,1) 2000 T 15.65% -5.71* AR(1) GARCH(0,1) 2000 T 41.20% -5.18*
CAC 4095% daily VaR forecasts 99% daily VaR forecasts
Model Size Distr. Loss Value t-stat. Model Size Distr. Loss Value t-stat.AR(1) EGARCH(0,1) 2000 T 3.96% - AR(1) GARCH(0,2) 2000 T 21.66% -AR(1) EGARCH(0,1 1500 T 4.73% -7.54* AR(1) GARCH(0,2) 1500 T 26.34% -12.59*AR(1) EGARCH(0,2) 2000 T 4.81% -4.09* AR(1) EGARCH(1,2) 2000 T 27.85% -5.48*AR(1) GARCH(0,1) 2000 T 5.10% -3.89* AR(1) EGARCH(1,1) 2000 T 27.95% -5.86*AR(1) GARCH(0,1) 1500 T 5.44% -5.53* AR(1) EGARCH(2,1) 2000 T 27.96% -5.68*
AR(1) EGARCH(0,2) 1500 T 5.56% -6.38* AR(1) GARCH(1,1) 1500 T 30.37% -5.48*FTSE 100
95% daily VaR forecasts 99% daily VaR forecastsModel Size Distr. Loss Value t-stat. Model Size Distr. Loss Value t-stat.
AR(1) GARCH(0,1) 1500 T 6.30% - AR(1) EGARCH(2,1) 1500 T 23.19% -AR(1) GARCH(0,2) 1500 T 7.66% -5.14* AR(1) EGARCH(1,2) 1500 T 23.32% -0.69
AR(1) EGARCH(1,2) 1500 T 7.70% -3.66* AR(1) EGARCH(1,1) 2000 T 23.68% -0.92AR(1) EGARCH(1,1) 1500 T 7.72% -4.12* AR(1) EGARCH(1,2) 2000 T 23.75% -1.06AR(1) EGARCH(1,1) 2000 T 7.79% -3.76* AR(1) EGARCH(2,1) 2000 T 23.80% -1.20AR(1) EGARCH(1,2) 2000 T 7.85% -3.65* AR(1) GARCH(1,1) 1500 T 26.19% -1.82***
Table 8: Statistical comparison between the six best performed models according to the quantileloss function. *, **, *** indicate significance at the 1%, 5% and 10% levels, respectively. Thet-statistics are calculated according to the procedure that is explained in section 3.3.
19

5 Conclusions
Following the extensive and detailed investigation of a plethora of volatility modeling techniques,briefly presented in the preceding sections, a number of comments are of order, aiming to summarizeour results and give, both to the researcher and the practitioner, some fundamental guidelines withwhich to proceed in VaR estimation.
We have strong indications that the mean process specification plays no important role. Tryingto extract autoregressive phenomena from the returns such that only the underlying volatility isleft in the residuals, we experimented with a number of AR processes. Our results show that sucha methodology does not add anything significant to the VaR framework other than complexity inthe estimation procedure. Moreover, using only an ARCH term (without any lagged conditionalvariances) yields acceptable results only when residuals are modeled under either the Student’s-tdistribution or the GED; it is never the case for a Normal distribution. Generally speaking, in theVaR framework the leptokurtic distributions and especially the Student’s-t, are more appropriatethan the Normal assumption, as they generate more accurate forecasts, while there is no volatilitymodel which is clearly superior than the others. However, under the evaluation framework thatwas developed based on the proposed quantile loss function, there is strong evidence that thecombination of the Student-t distribution with the simplest EGARCH models produces the mostadequate VaR forecasts for the majority of the markets. Furthermore, the size of the rolling sampleused in estimation turns out to be rather important: in simpler models and low confidence levelsa sample size smaller than 2000 improves probability values. In more complex models, whereleptokurtic distributions are used or where the confidence level chosen is high, a small sample sizemay lead to lack of convergence in the estimation algorithms. Finally, there is no consistent relationbetween the sample sizes and the optimal models, as we observe significant differences in the VaRforecasts for the same model under the four sample sizes.
20

6 References
Akaike, H. (1973). Information Theory and the Extension of the Maximum LikelihoodPrinciple. Proceeding of the Second International Symposium on Information Theory,Budapest, 267-281.
Bera, A.K. and M.L. Higgins (1993). ARCH Models: Properties, Estimation and Testing.Journal of Economic Surveys, 7, 305-366.
Billio, M. and L. Pelizzon (2000). Value-at-Risk: A multivariate switching regime ap-proach. Journal of Empirical Finance, 7, 531-554.
Black, F. (1976). Studies of Stock Market Volatility Changes. Proceedings of the Amer-ican Statistical Association, Business and Economic Statistics Section, 177-181.
Bollerslev, T. (1986). Generalized Autoregressive Conditional Heteroscedasticity. Journalof Econometrics, 31, 307-327.
Bollerslev, T. (1987). A Conditional Heteroscedastic Time Series Model for SpeculativePrices and Rates of Return. Review of Economics and Statistics, 69, 542-547.
Bollerslev, T. and J.M. Wooldridge (1992). Quasi-maximum Likelihood Estimation andInference in Dynamic Models with Time-Varying Covariances. Econometric Reviews, 11, 143-172.
Bollerslev, T., R. Chou and K.F. Kroner (1992). ARCH Modeling in Finance: A Reviewof the Theory and Empirical Evidence. Journal of Econometrics, 52, 5-59.
Bollerslev, T., R.F. Engle and D. Nelson (1994). ARCH Models, in Handbook ofEconometrics, Volume 4, eds. R. Engle and D. McFadden, Elsevier Science, Amsterdam, 2959-3038.
Brooks, C., and G. Persand (2002). Model Choise and Value-at-Risk Performance. Fi-nancial Analysts Journal, September/October 2002 Volume 58 Number 5.
Brooks, C., and G. Persand (2003a). The effect of Asymmetries on Stock Index ReturnValue-at-Risk Estimates. The Journal of Risk Finance, Winter 2003.
Brooks, C., and G. Persand (2003b). Volatility Forecasting for Risk Management. Jour-nal of Forecasting, 22, 1-22.
Cabedo, D., J. and Moya, I. (2003). Estimating oil price ’Value at Risk’ using the historicalsimulation approach. Energy Economics, 25, 239-253.
Christoffersen, P. (1998). Evaluating interval forecasts. International Economic Re-view, 39, 841-862.
Crouhy, M., D. Galai and R. Mark (2001). Risk Management. McGraw Hill, NewYork.
Danielsson, S. (1996).Multivariate stochastic volatility models: estimation and a comparisonwith VGARCH models, Mimeo. Department of Economics, University of Iceland.
Degiannakis, S. and E. Xekalaki, (2003). Autoregressive Conditional HeteroskedasticityModels: Review of the Literature, Athens University of Economics and Business, Depart-ment of Statistics, Technical Report, 197.
Diebold, F.X., and R. Mariano, (1995). Comparing Predictive Accuracy. Journal ofBusiness and Economic Statistics 13(3), 253-263.
Dowd, K. (1998). Beyond Value at Risk: The New Science of Risk Management. JohnWiley & Sons, New York.
21

Engle, R.F. (1982). Autoregressive Conditional Heteroscedasticity with Estimates of theVariance of U.K. Inflation. Econometrica, 50, 987-1008.
Engle, R.F., C.H. Hong, A. Kane and J. Noh (1993). Arbitrage Valuation of VarianceForecasts with Simulated Options, Advances in Futures and Options Research, 6, 393-415.
Engle, R.F., AJ. Patton (2001). What Good is a Volatility Model? Quantitative Fi-nance, 1(2), 237-245.
Frey, R. and Michaud, P. (1997). The Effect of GARCH-type Volatilities on Prices and Payoff-Distributions of Derivative Assets - a Simulation Study, Working Paper, ETH Zurich.
Giot ,P. and S. Laurent (2002). Value-at-Risk for long and short trading positions. Journalof Applied Econometrics.
Giot ,P. and S. Laurent (2003). Market risk in commodity markets: a VaR approach.Energy Economics, forthcoming.
Guermat, C. and R.D.F. Harris (2002). Forecasting value at risk allowing for time varia-tion in the variance and kurtosis portfolio returns, International Journal of Forecasting,18,409-419.
Hamilton, J.D., (1994). Time Series Analysis. New Jersey: Princeton UniversityPress.
Hansen, P.R. and A. Lunde (2003). A Forecast Comparison of Volatility Models: DoesAnything Beat a GARCH(1,1)? Brown University, Working Paper.
Hendricks, D. (1996). Evaluation of value-at-risk models using historical data. FederalReserve Bank of New York. Economic Police Review 2, 39-70.
Hoppe, R. (1998). VAR and the Unreal Unreal World. Risk 11, 45-50.Hsieh, D.A. (1989). Modeling Heteroscedasticity in Daily Foreign-Exchange Rates. Journal
of Business and Economic Statistics, 7, 307-317.Jackson, P., Maude, DJ, Perraudin, W. (1998). Testing Value-at-Risk approaches to
capital adequacy. Bank of England Quarterly Bulletin 38: 256-266.Jorion, P. (1988). On Jump Processes in the Foreign Exchange and Stock Markets. Review
of Financial Studies, 1, 427-445.Jorion, P. (1997). Value at Risk. The New Benchmark for Controlling Derivatives Risk.
McGraw Hill, New York.Klaassen, F. (2002). Improving GARCH Volatility Forecasts with Regime-Switching GARCH,
in Advances in Markov-Switching Models, eds. J.D. Hamilton and B. Raj, Physica Verlag,New York, 223-254.
Kupiec, P.H. (1995). Techniques for verifying the accuracy of risk measurement models.The Journal of Derivatives, 3, 73-84.
Lambadiaris, G., Papadopoulou, L., Skiadopoulos, G. and Zoulis, Y. (2003). VAR:history or simulation? Risk, September 2002.
Lambert, P. and S. Laurent (2000). Modeling Skewness Dynamics in Series of FinancialData. Discussion Paper, Institut de Statistique, Louvain-la-Neuve.
Lambert, P. and S. Laurent (2001). Modeling Financial Time Series Using GARCH-TypeModels and a Skewed Student Density. Universite de Liege, Mimeo.
Lee, T.K.Y. and Y.K. Tse (1991). Term Structure of Interest Rates in the SingaporeAsian Dollar Market. Journal of Applied Econometrics, 6, 143-152.
Lo, A. and A.C. MacKinlay (1988). Stock Market Prices Do Not Follow Random Walks:Evidence from a Simple Specification Test. Review of Financial Studies, 1, 41-66.
22

Longerstay, J., (1996). An improved methodology for measuring VaR. RiskMetrics Mon-itor Second Quarter, J.P. Morgan.
Lopez, J.A. (1998). Methods for evaluating Value-at-Risk Estimates. Federal ReserveBank of New York. Economic Policy Review.
Mandelbrot, B. (1963). The Variation of Certain Speculative Prices. Journal of Business,36, 394-419.
Marquardt, D.W. (1963). An Algorithm for Least Squares Estimation of Nonlinear Param-eters. Journal of the Society for Industrial and Applied Mathematics, 11, 431-441.
Nelson, D. (1991). Conditional Heteroskedasticity in Asset Returns: A New Approach.Econometrica, 59, 347-370.
Newey, W. and K. West (1987). A Simple Positive Semi-Definite, Heteroskedasticity andAutocorrelation Consistent Covariance Matrix, Econometrica, 55, 703-708.
Pagan, A.R. and G.W. Schwert (1990). Alternative Models for Conditional Stock Volatil-ity. Journal of Econometrics, 45, 267-290.
RiskMetrics (1995). Technical Document, J.P. Morgan. New York, USA.Sarma, M., S. Thomas, and A. Shah. (2001). Selection of VaR models. Journal of
Forecasting, forthcoming.Scholes, M., and J. Williams (1977). Estimating Betas from Non-Synchronous Data.
Journal of Financial Economics, 5, 309-328.Schwarz, G. (1978). Estimating the Dimension of a Model. Annals of Statistics, 6,
461-464.Venkataraman, S. (1996). Value at risk for a mixture of normals distributions: The use of
quasi-Bayesian estimation techniques. Economic Perspective.Vlaar, P. (2000). Value at Risk models for Dutch bond portfolios. Journal of Banking
and Finance 24, 131-154.White, H. (1980). A Heteroskedasticity-Consistent Covariance Matrix and a Direct Test for
Heteroskedasticity. Econometrica, 48, 817-838.Zangari, P. (1996). An improved methodology for measuring VAR. RiskMetrics Monitor,
Reuters/JP Morgan.
23

t p_uc p_cc t p_uc p_cc t p_uc p_cc t p_uc p_cc t p_uc p_ccAR(0)GARCH(0,1) 8.96% 0.00% 0.00% 6.11% 3.79% 0.96% 8.28% 0.00% 0.00% 7.72% 0.00% 0.00% 7.97% 0.00% 0.00%AR(1)GARCH(0,1) 8.96% 0.00% 0.00% 6.11% 3.79% 0.96% 8.39% 0.00% 0.00% 7.72% 0.00% 0.00% 7.92% 0.00% 0.00%AR(2)GARCH(0,1) 8.96% 0.00% 0.00% 6.23% 2.26% 0.51% 8.50% 0.00% 0.00% 7.67% 0.00% 0.00% 8.02% 0.00% 0.00%AR(3)GARCH(0,1) 9.01% 0.00% 0.00% 6.17% 2.94% 0.70% 8.45% 0.00% 0.00% 7.61% 0.00% 0.00% 8.02% 0.00% 0.00%AR(4)GARCH(0,1) 8.96% 0.00% 0.00% 6.17% 2.94% 0.70% 8.66% 0.00% 0.00% 7.56% 0.00% 0.00% 8.02% 0.00% 0.00%AR(0)GARCH(0,2) 8.09% 0.00% 0.00% 5.83% 11.88% 0.86% 7.52% 0.00% 0.00% 7.34% 0.00% 0.01% 7.65% 0.00% 0.00%AR(1)GARCH(0,2) 8.09% 0.00% 0.00% 5.83% 11.88% 0.86% 7.57% 0.00% 0.00% 7.17% 0.01% 0.03% 7.65% 0.00% 0.00%AR(2)GARCH(0,2) 8.04% 0.00% 0.00% 5.94% 7.72% 0.49% 7.57% 0.00% 0.00% 7.28% 0.00% 0.01% 7.65% 0.00% 0.00%AR(3)GARCH(0,2) 8.20% 0.00% 0.00% 5.89% 9.62% 0.65% 7.57% 0.00% 0.00% 7.34% 0.00% 0.01% 7.65% 0.00% 0.00%AR(4)GARCH(0,2) 8.26% 0.00% 0.00% 5.89% 9.62% 0.65% 7.52% 0.00% 0.00% 7.28% 0.00% 0.01% 7.65% 0.00% 0.00%AR(0)GARCH(1,1) 5.40% 43.90% 56.23% 6.17% 2.94% 8.36% 5.99% 5.77% 15.04% 6.08% 4.05% 7.80% 6.35% 1.00% 0.24%AR(1)GARCH(1,1) 5.18% 72.25% 79.48% 6.17% 2.94% 8.36% 6.05% 4.56% 12.18% 6.08% 4.05% 7.80% 6.14% 2.94% 0.80%AR(2)GARCH(1,1) 5.23% 64.53% 74.32% 6.23% 2.26% 6.55% 6.10% 3.58% 9.75% 6.13% 3.16% 6.60% 6.19% 2.28% 0.72%AR(3)GARCH(1,1) 5.34% 50.30% 62.51% 6.28% 1.72% 5.07% 6.10% 3.58% 9.75% 6.08% 4.05% 5.25% 6.19% 2.28% 0.72%AR(4)GARCH(1,1) 5.29% 57.20% 44.47% 6.23% 2.26% 6.55% 5.99% 5.77% 15.04% 6.24% 1.87% 3.26% 6.30% 1.33% 0.56%AR(0)GARCH(1,2) 5.45% 38.00% 49.95% 6.17% 2.94% 6.66% 5.99% 5.77% 13.23% 6.02% 5.14% 6.00% 5.98% 6.05% 1.00%AR(1)GARCH(1,2) 5.29% 57.20% 44.47% 6.23% 2.26% 5.11% 6.05% 4.56% 11.17% 6.08% 4.05% 5.25% 6.25% 1.75% 0.30%AR(2)GARCH(1,2) 5.40% 43.90% 56.23% 6.23% 2.26% 5.11% 6.16% 2.78% 7.67% 6.13% 3.16% 4.53% 6.09% 3.77% 0.87%AR(3)GARCH(1,2) 5.18% 72.25% 79.48% 6.17% 2.94% 6.66% 6.10% 3.58% 10.34% 6.13% 3.16% 4.53% 6.19% 2.28% 1.40%AR(4)GARCH(1,2) 5.29% 57.20% 44.47% 6.23% 2.26% 5.11% 6.16% 2.78% 7.67% 6.35% 1.08% 2.23% 6.14% 2.94% 1.58%AR(0)GARCH(2,1) 5.61% 23.50% 18.48% 6.11% 3.79% 5.59% 6.21% 2.14% 6.65% 5.97% 6.48% 10.49% 6.14% 2.94% 1.58%AR(1)GARCH(2,1) 5.23% 64.53% 49.27% 6.11% 3.79% 5.59% 6.27% 1.64% 5.02% 6.13% 3.16% 6.60% 6.09% 3.77% 1.77%AR(2)GARCH(2,1) 5.40% 43.90% 34.87% 6.17% 2.94% 4.25% 6.32% 1.24% 4.08% 6.13% 3.16% 6.60% 6.19% 2.28% 1.40%AR(3)GARCH(2,1) 5.50% 32.64% 57.55% 6.23% 2.26% 5.11% 6.10% 3.58% 9.75% 6.24% 1.87% 3.26% 6.09% 3.77% 1.77%AR(4)GARCH(2,1) 5.40% 43.90% 56.23% 6.17% 2.94% 6.66% 6.21% 2.14% 6.65% 6.24% 1.87% 3.26% 6.14% 2.94% 1.58%AR(0)GARCH(2,2) 5.72% 16.38% 35.74% 6.23% 2.26% 6.55% 6.10% 3.58% 10.34% 6.19% 2.44% 3.87% 6.14% 2.94% 0.80%AR(1)GARCH(2,2) 5.61% 23.50% 46.52% 6.23% 2.26% 5.11% 6.10% 3.58% 10.34% 6.13% 3.16% 4.53% 6.19% 2.28% 0.72%AR(2)GARCH(2,2) 5.61% 23.50% 43.44% 6.28% 1.72% 3.87% 6.21% 2.14% 6.24% 6.24% 1.87% 3.26% 6.30% 1.33% 0.27%AR(3)GARCH(2,2) 5.50% 32.64% 43.82% 6.17% 2.94% 6.66% 6.10% 3.58% 10.34% 6.13% 3.16% 4.53% 6.30% 1.33% 0.27%AR(4)GARCH(2,2) 5.56% 27.81% 52.07% 6.17% 2.94% 6.66% 6.16% 2.78% 8.34% 6.13% 3.16% 4.53% 6.25% 1.75% 0.64%AR(0)TARCH(0,1) 9.07% 0.00% 0.00% 6.23% 2.26% 0.10% 8.28% 0.00% 0.00% 7.45% 0.00% 0.00% 7.97% 0.00% 0.00%AR(1)TARCH(0,1) 9.07% 0.00% 0.00% 6.23% 2.26% 0.10% 8.28% 0.00% 0.00% 7.45% 0.00% 0.00% 7.97% 0.00% 0.00%AR(2)TARCH(0,1) 9.07% 0.00% 0.00% 6.11% 3.79% 0.19% 8.23% 0.00% 0.00% 7.45% 0.00% 0.00% 8.19% 0.00% 0.00%AR(3)TARCH(0,1) 8.96% 0.00% 0.00% 6.17% 2.94% 0.14% 8.23% 0.00% 0.00% 7.50% 0.00% 0.00% 8.08% 0.00% 0.00%AR(4)TARCH(0,1) 9.07% 0.00% 0.00% 6.17% 2.94% 0.14% 8.28% 0.00% 0.00% 7.50% 0.00% 0.00% 8.19% 0.00% 0.00%AR(0)TARCH(0,2) 8.20% 0.00% 0.00% 5.89% 9.62% 0.04% 7.41% 0.00% 0.00% 7.17% 0.01% 0.03% 7.65% 0.00% 0.00%AR(1)TARCH(0,2) 8.26% 0.00% 0.00% 5.89% 9.62% 0.04% 7.47% 0.00% 0.00% 7.23% 0.00% 0.02% 7.86% 0.00% 0.00%AR(2)TARCH(0,2) 8.20% 0.00% 0.00% 5.83% 11.88% 0.05% 7.52% 0.00% 0.00% 7.28% 0.00% 0.01% 7.86% 0.00% 0.00%AR(3)TARCH(0,2) 8.04% 0.00% 0.00% 5.83% 11.88% 0.05% 7.52% 0.00% 0.00% 7.28% 0.00% 0.01% 7.81% 0.00% 0.00%AR(4)TARCH(0,2) 8.09% 0.00% 0.00% 5.83% 11.88% 0.05% 7.47% 0.00% 0.00% 7.28% 0.00% 0.01% 7.81% 0.00% 0.00%AR(0)TARCH(1,1) 6.15% 2.78% 5.81% 5.83% 11.88% 10.06% 5.94% 7.24% 10.16% 5.81% 12.34% 27.00% 5.98% 6.05% 10.47%AR(1)TARCH(1,1) 6.15% 2.78% 5.81% 5.77% 14.55% 12.56% 5.94% 7.24% 10.16% 5.91% 8.10% 19.88% 6.14% 2.94% 4.56%AR(2)TARCH(1,1) 6.21% 2.15% 4.46% 5.72% 17.66% 15.48% 5.99% 5.77% 8.00% 5.91% 8.10% 19.88% 6.14% 2.94% 4.56%AR(3)TARCH(1,1) 6.04% 4.55% 6.06% 5.72% 17.66% 15.48% 6.05% 4.56% 6.22% 5.91% 8.10% 19.88% 6.19% 2.28% 3.87%AR(4)TARCH(1,1) 6.10% 3.57% 7.49% 5.72% 17.66% 15.48% 5.99% 5.77% 8.00% 5.86% 10.04% 23.31% 6.19% 2.28% 3.87%AR(0)TARCH(1,2) 6.15% 2.78% 3.54% 5.83% 11.88% 3.87% 5.99% 5.77% 15.31% 5.86% 10.04% 19.03% 5.92% 7.56% 7.74%AR(1)TARCH(1,2) 5.88% 8.96% 6.38% 5.72% 17.66% 6.21% 6.10% 3.58% 10.34% 6.02% 5.14% 12.11% 6.14% 2.94% 2.84%AR(2)TARCH(1,2) 6.04% 4.55% 6.06% 5.89% 9.62% 7.97% 6.05% 4.56% 12.66% 5.91% 8.10% 16.58% 6.03% 4.80% 6.09%AR(3)TARCH(1,2) 6.04% 4.55% 6.06% 5.72% 17.66% 15.48% 5.99% 5.77% 15.31% 6.02% 5.14% 12.11% 6.03% 4.80% 6.09%AR(4)TARCH(1,2) 6.15% 2.78% 1.65% 5.83% 11.88% 10.06% 6.10% 3.58% 10.34% 5.91% 8.10% 16.58% 6.09% 3.77% 5.30%AR(0)TARCH(2,1) 6.04% 4.55% 6.06% 5.83% 11.88% 3.87% 6.05% 4.56% 9.72% 6.02% 5.14% 9.10% 6.09% 3.77% 7.70%AR(1)TARCH(2,1) 5.94% 7.21% 9.90% 5.83% 11.88% 3.87% 6.05% 4.56% 9.72% 5.86% 10.04% 23.31% 6.03% 4.80% 9.04%AR(2)TARCH(2,1) 5.88% 8.96% 12.43% 5.83% 11.88% 3.87% 6.10% 3.58% 4.78% 5.75% 15.04% 33.50% 5.98% 6.05% 10.47%AR(3)TARCH(2,1) 6.10% 3.57% 4.66% 5.83% 11.88% 3.87% 6.16% 2.78% 5.91% 5.86% 10.04% 23.31% 6.09% 3.77% 5.30%AR(4)TARCH(2,1) 5.94% 7.21% 9.90% 5.89% 9.62% 3.00% 6.05% 4.56% 6.22% 5.86% 10.04% 23.31% 6.19% 2.28% 5.40%AR(0)TARCH(2,2) 5.94% 7.21% 4.98% 5.94% 7.72% 2.29% 5.94% 7.24% 15.25% 5.81% 12.34% 28.68% 5.98% 6.05% 10.47%AR(1)TARCH(2,2) 5.88% 8.96% 6.38% 5.89% 9.62% 3.00% 6.10% 3.58% 9.75% 5.81% 12.34% 28.68% 5.98% 6.05% 10.47%AR(2)TARCH(2,2) 5.94% 7.21% 4.98% 5.72% 17.66% 6.21% 5.99% 5.77% 15.04% 5.70% 18.18% 38.65% 5.98% 6.05% 10.47%AR(3)TARCH(2,2) 5.88% 8.96% 6.38% 5.89% 9.62% 3.00% 6.10% 3.58% 9.75% 5.86% 10.04% 24.24% 5.98% 6.05% 6.91%AR(4)TARCH(2,2) 5.99% 5.75% 3.84% 5.72% 17.66% 6.21% 6.05% 4.56% 12.18% 5.91% 8.10% 19.88% 6.03% 4.80% 6.09%AR(0)EGARCH(0,1) 9.23% 0.00% 0.00% 6.06% 4.85% 1.30% 8.50% 0.00% 0.00% 7.56% 0.00% 0.00% 8.35% 0.00% 0.00%AR(1)EGARCH(0,1) 9.28% 0.00% 0.00% 6.06% 4.85% 1.30% 8.56% 0.00% 0.00% 7.45% 0.00% 0.00% 8.40% 0.00% 0.00%AR(2)EGARCH(0,1) 9.28% 0.00% 0.00% 6.17% 2.94% 0.70% 8.56% 0.00% 0.00% 7.50% 0.00% 0.00% 8.35% 0.00% 0.00%AR(3)EGARCH(0,1) 9.34% 0.00% 0.00% 6.11% 3.79% 0.96% 8.50% 0.00% 0.00% 7.50% 0.00% 0.00% 8.35% 0.00% 0.00%AR(4)EGARCH(0,1) 9.39% 0.00% 0.00% 6.17% 2.94% 0.70% 8.56% 0.00% 0.00% 7.50% 0.00% 0.00% 8.35% 0.00% 0.00%AR(0)EGARCH(0,2) 8.80% 0.00% 0.00% 6.06% 4.85% 0.27% 8.12% 0.00% 0.00% 7.45% 0.00% 0.00% 8.13% 0.00% 0.00%AR(1)EGARCH(0,2) 8.85% 0.00% 0.00% 6.11% 3.79% 0.19% 8.01% 0.00% 0.00% 7.45% 0.00% 0.00% 8.13% 0.00% 0.00%AR(2)EGARCH(0,2) 8.85% 0.00% 0.00% 6.11% 3.79% 0.01% 8.07% 0.00% 0.00% 7.56% 0.00% 0.00% 8.19% 0.00% 0.00%AR(3)EGARCH(0,2) 8.74% 0.00% 0.00% 6.06% 4.85% 0.01% 8.12% 0.00% 0.00% 7.50% 0.00% 0.00% 8.08% 0.00% 0.00%AR(4)EGARCH(0,2) 8.69% 0.00% 0.00% 6.11% 3.79% 0.01% 8.07% 0.00% 0.00% 7.39% 0.00% 0.00% 8.13% 0.00% 0.00%AR(0)EGARCH(1,1) 5.56% 27.81% 49.69% 5.21% 69.22% 57.31% 6.16% 2.78% 7.71% 5.91% 8.10% 16.58% 6.30% 1.33% 1.78%AR(1)EGARCH(1,1) 5.50% 32.64% 43.82% 5.21% 69.22% 57.31% 6.10% 3.58% 9.75% 5.86% 10.04% 19.03% 6.41% 0.75% 1.23%AR(2)EGARCH(1,1) 5.61% 23.50% 43.44% 5.21% 69.22% 57.31% 6.32% 1.24% 3.98% 5.86% 10.04% 19.03% 6.41% 0.75% 1.23%AR(3)EGARCH(1,1) 5.72% 16.38% 31.98% 5.15% 77.34% 62.05% 6.10% 3.58% 9.75% 5.91% 8.10% 11.94% 6.41% 0.75% 1.23%AR(4)EGARCH(1,1) 5.56% 27.81% 37.96% 5.21% 69.22% 57.31% 6.10% 3.58% 9.75% 5.91% 8.10% 11.94% 6.35% 1.00% 1.49%AR(0)EGARCH(1,2) 5.61% 23.50% 18.48% 5.15% 77.34% 62.05% 6.32% 1.24% 3.56% 5.81% 12.34% 14.88% 6.30% 1.33% 1.78%AR(1)EGARCH(1,2) 5.61% 23.50% 18.48% 5.09% 85.75% 66.26% 6.21% 2.14% 6.03% 5.81% 12.34% 14.88% 6.30% 1.33% 1.78%AR(2)EGARCH(1,2) 5.72% 16.38% 12.51% 5.15% 77.34% 62.05% 6.32% 1.24% 4.08% 5.86% 10.04% 13.42% 6.30% 1.33% 1.78%AR(3)EGARCH(1,2) 5.61% 23.50% 18.48% 5.21% 69.22% 57.31% 6.27% 1.64% 4.66% 5.75% 15.04% 16.29% 6.30% 1.33% 1.78%AR(4)EGARCH(1,2) 5.61% 23.50% 18.48% 5.09% 85.75% 66.26% 6.32% 1.24% 3.56% 5.70% 18.18% 17.60% 6.30% 1.33% 1.78%AR(0)EGARCH(2,1) 5.61% 23.50% 32.48% 5.38% 47.31% 41.66% 6.21% 2.14% 4.53% 6.02% 5.14% 12.11% 6.09% 3.77% 5.30%AR(1)EGARCH(2,1) 5.61% 23.50% 18.48% 5.38% 47.31% 41.66% 6.38% 0.94% 2.69% 5.97% 6.48% 16.75% 6.52% 0.41% 0.81%AR(2)EGARCH(2,1) 5.77% 13.51% 26.95% 5.32% 54.14% 46.95% 6.27% 1.64% 4.66% 5.97% 6.48% 14.26% 6.19% 2.28% 6.61%AR(3)EGARCH(2,1) 5.56% 27.81% 37.96% 5.26% 61.47% 25.06% 6.43% 0.70% 2.39% 5.97% 6.48% 14.26% 6.30% 1.33% 2.69%AR(4)EGARCH(2,1) 5.67% 19.70% 15.30% 5.26% 61.47% 25.06% 6.49% 0.52% 1.80% 5.97% 6.48% 10.49% 6.19% 2.28% 5.40%Note: The table reports for each model, sample size and equity index, the exception rate (t) and the p-values of unconditional (p_uc) and conditionalcoverage (p_cc)
AppendixFTSE100
Table (1.A). Normal Distribution, 2000 sample size, 95%-VaRS&P500 NIKKEI225 DAX30 CAC40Models
Page 1 of 12

t p_uc p_cc t p_uc p_cc t p_uc p_cc t p_uc p_cc t p_uc p_ccAR(0)GARCH(0,1) 8.31% 0.00% 0.00% 6.23% 2.26% 0.51% 8.45% 0.00% 0.00% 7.12% 0.01% 0.04% 7.38% 0.00% 0.00%AR(1)GARCH(0,1) 8.31% 0.00% 0.00% 6.23% 2.26% 0.51% 8.56% 0.00% 0.00% 7.06% 0.01% 0.06% 7.54% 0.00% 0.00%AR(2)GARCH(0,1) 8.36% 0.00% 0.00% 6.40% 0.98% 0.18% 8.50% 0.00% 0.00% 7.12% 0.01% 0.04% 7.65% 0.00% 0.00%AR(3)GARCH(0,1) 8.36% 0.00% 0.00% 6.28% 1.72% 0.36% 8.45% 0.00% 0.00% 7.12% 0.01% 0.04% 7.54% 0.00% 0.00%AR(4)GARCH(0,1) 8.42% 0.00% 0.00% 6.40% 0.98% 0.18% 8.45% 0.00% 0.00% 7.12% 0.01% 0.04% 7.59% 0.00% 0.00%AR(0)GARCH(0,2) 8.09% 0.00% 0.00% 6.28% 1.72% 0.36% 7.41% 0.00% 0.00% 7.06% 0.01% 0.04% 7.38% 0.00% 0.00%AR(1)GARCH(0,2) 8.20% 0.00% 0.00% 6.17% 2.94% 0.70% 7.36% 0.00% 0.01% 7.23% 0.00% 0.01% 7.49% 0.00% 0.00%AR(2)GARCH(0,2) 8.15% 0.00% 0.00% 6.06% 4.85% 1.30% 7.36% 0.00% 0.01% 7.23% 0.00% 0.01% 7.43% 0.00% 0.00%AR(3)GARCH(0,2) 8.09% 0.00% 0.00% 6.06% 4.85% 1.30% 7.41% 0.00% 0.00% 7.34% 0.00% 0.01% 7.43% 0.00% 0.00%AR(4)GARCH(0,2) 8.15% 0.00% 0.00% 6.06% 4.85% 1.30% 7.36% 0.00% 0.01% 7.39% 0.00% 0.00% 7.49% 0.00% 0.00%AR(0)GARCH(1,1) 5.34% 50.30% 62.51% 5.89% 9.62% 23.55% 6.10% 3.58% 9.75% 5.86% 10.04% 13.42% 6.14% 2.94% 0.80%AR(1)GARCH(1,1) 5.34% 50.30% 62.51% 5.94% 7.72% 19.63% 6.16% 2.78% 7.71% 5.81% 12.34% 21.57% 6.14% 2.94% 0.80%AR(2)GARCH(1,1) 5.45% 38.00% 49.95% 5.94% 7.72% 19.63% 6.16% 2.78% 7.71% 5.91% 8.10% 7.54% 6.09% 3.77% 0.39%AR(3)GARCH(1,1) 5.40% 43.90% 56.23% 5.94% 7.72% 19.63% 6.16% 2.78% 7.71% 5.91% 8.10% 7.54% 6.09% 3.77% 0.87%AR(4)GARCH(1,1) 5.40% 43.90% 56.23% 5.89% 9.62% 23.55% 6.16% 2.78% 7.71% 5.86% 10.04% 13.42% 6.19% 2.28% 0.14%AR(0)GARCH(1,2) 5.40% 43.90% 68.94% 5.66% 21.26% 32.06% 6.05% 4.56% 12.18% 5.91% 8.10% 11.94% 5.92% 7.56% 0.44%AR(1)GARCH(1,2) 5.56% 27.81% 49.69% 5.60% 25.37% 37.71% 6.16% 2.78% 7.71% 5.91% 8.10% 11.94% 5.98% 6.05% 0.43%AR(2)GARCH(1,2) 5.45% 38.00% 62.61% 5.60% 25.37% 37.71% 6.10% 3.58% 9.75% 5.86% 10.04% 8.29% 5.92% 7.56% 0.44%AR(3)GARCH(1,2) 5.45% 38.00% 62.61% 5.66% 21.26% 32.06% 6.10% 3.58% 9.75% 6.02% 5.14% 6.00% 6.03% 4.80% 0.41%AR(4)GARCH(1,2) 5.34% 50.30% 74.95% 5.60% 25.37% 37.71% 6.10% 3.58% 9.75% 6.08% 4.05% 3.13% 5.98% 6.05% 1.00%AR(0)GARCH(2,1) 5.61% 23.50% 43.44% 5.77% 14.55% 22.32% 6.27% 1.64% 4.66% 5.86% 10.04% 13.42% 5.98% 6.05% 1.00%AR(1)GARCH(2,1) 5.40% 43.90% 56.23% 5.77% 14.55% 22.32% 6.27% 1.64% 4.66% 5.91% 8.10% 11.94% 6.09% 3.77% 0.87%AR(2)GARCH(2,1) 5.40% 43.90% 56.23% 5.77% 14.55% 12.56% 6.32% 1.24% 3.56% 5.91% 8.10% 11.94% 5.92% 7.56% 2.27%AR(3)GARCH(2,1) 5.34% 50.30% 62.51% 5.72% 17.66% 15.48% 6.49% 0.52% 1.48% 6.02% 5.14% 3.50% 5.98% 6.05% 2.12%AR(4)GARCH(2,1) 5.50% 32.64% 43.82% 5.72% 17.66% 26.92% 6.10% 3.58% 7.63% 5.97% 6.48% 6.77% 6.09% 3.77% 0.16%AR(0)GARCH(2,2) 5.77% 13.51% 18.92% 5.77% 14.55% 30.16% 6.27% 1.64% 5.24% 5.81% 12.34% 14.88% 6.03% 4.80% 0.41%AR(1)GARCH(2,2) 5.61% 23.50% 32.48% 5.60% 25.37% 37.71% 6.16% 2.78% 7.71% 5.75% 15.04% 16.29% 5.98% 6.05% 0.43%AR(2)GARCH(2,2) 5.67% 19.70% 37.50% 5.72% 17.66% 26.92% 6.43% 0.70% 2.00% 5.86% 10.04% 8.29% 5.92% 7.56% 1.05%AR(3)GARCH(2,2) 5.72% 16.38% 33.10% 5.72% 17.66% 35.59% 6.54% 0.38% 1.08% 6.02% 5.14% 6.00% 6.19% 2.28% 0.14%AR(4)GARCH(2,2) 5.61% 23.50% 43.44% 5.72% 17.66% 26.92% 6.16% 2.78% 7.71% 6.02% 5.14% 6.00% 6.09% 3.77% 0.16%AR(0)TARCH(0,1) 8.36% 0.00% 0.00% 6.34% 1.30% 0.26% 8.45% 0.00% 0.00% 7.17% 0.01% 0.03% 7.65% 0.00% 0.00%AR(1)TARCH(0,1) 8.42% 0.00% 0.00% 6.34% 1.30% 0.26% 8.39% 0.00% 0.00% 7.17% 0.01% 0.03% 7.70% 0.00% 0.00%AR(2)TARCH(0,1) 8.42% 0.00% 0.00% 6.40% 0.98% 0.18% 8.45% 0.00% 0.00% 7.23% 0.00% 0.02% 7.75% 0.00% 0.00%AR(3)TARCH(0,1) 8.36% 0.00% 0.00% 6.34% 1.30% 0.26% 8.45% 0.00% 0.00% 7.17% 0.01% 0.03% 7.75% 0.00% 0.00%AR(4)TARCH(0,1) 8.47% 0.00% 0.00% 6.34% 1.30% 0.26% 8.50% 0.00% 0.00% 7.17% 0.01% 0.03% 7.75% 0.00% 0.00%AR(0)TARCH(0,2) 8.31% 0.00% 0.00% 6.17% 2.94% 0.70% 7.25% 0.00% 0.02% 7.12% 0.01% 0.04% 7.54% 0.00% 0.00%AR(1)TARCH(0,2) 8.31% 0.00% 0.00% 6.17% 2.94% 0.70% 7.25% 0.00% 0.01% 7.28% 0.00% 0.01% 7.75% 0.00% 0.00%AR(2)TARCH(0,2) 8.26% 0.00% 0.00% 6.06% 4.85% 1.30% 7.30% 0.00% 0.01% 7.23% 0.00% 0.02% 7.70% 0.00% 0.00%AR(3)TARCH(0,2) 8.15% 0.00% 0.00% 6.06% 4.85% 1.30% 7.30% 0.00% 0.01% 7.23% 0.00% 0.02% 7.65% 0.00% 0.00%AR(4)TARCH(0,2) 8.15% 0.00% 0.00% 6.11% 3.79% 0.96% 7.30% 0.00% 0.01% 7.23% 0.00% 0.02% 7.59% 0.00% 0.00%AR(0)TARCH(1,1) 6.31% 1.25% 3.53% 5.66% 21.26% 18.85% 5.89% 9.00% 12.76% 5.75% 15.04% 24.13% 6.03% 4.80% 3.64%AR(1)TARCH(1,1) 6.31% 1.25% 3.53% 5.77% 14.55% 12.56% 5.89% 9.00% 12.76% 5.81% 12.34% 21.57% 6.14% 2.94% 2.84%AR(2)TARCH(1,1) 6.37% 0.94% 2.67% 5.66% 21.26% 18.85% 5.89% 9.00% 12.76% 5.70% 18.18% 34.85% 6.46% 0.56% 1.43%AR(3)TARCH(1,1) 6.53% 0.38% 1.07% 5.72% 17.66% 15.48% 5.89% 9.00% 12.76% 5.81% 12.34% 21.57% 6.25% 1.75% 4.44%AR(4)TARCH(1,1) 6.37% 0.94% 2.67% 5.60% 25.37% 22.66% 5.89% 9.00% 12.76% 5.81% 12.34% 14.88% 6.19% 2.28% 3.87%AR(0)TARCH(1,2) 6.04% 4.55% 9.55% 5.43% 40.99% 16.34% 5.94% 7.24% 15.25% 5.59% 25.90% 31.26% 6.03% 4.80% 6.09%AR(1)TARCH(1,2) 6.04% 4.55% 2.93% 5.49% 35.23% 13.80% 5.94% 7.24% 15.25% 5.59% 25.90% 31.26% 5.98% 6.05% 10.47%AR(2)TARCH(1,2) 6.26% 1.64% 1.98% 5.43% 40.99% 16.34% 5.94% 7.24% 15.25% 5.64% 21.79% 29.06% 6.19% 2.28% 2.46%AR(3)TARCH(1,2) 6.21% 2.15% 2.67% 5.49% 35.23% 13.80% 5.94% 7.24% 15.25% 5.75% 15.04% 16.29% 5.87% 9.38% 8.56%AR(4)TARCH(1,2) 6.26% 1.64% 1.98% 5.60% 25.37% 9.49% 5.89% 9.00% 18.76% 5.75% 15.04% 16.29% 5.92% 7.56% 4.43%AR(0)TARCH(2,1) 6.26% 1.64% 1.98% 5.60% 25.37% 9.49% 5.78% 13.59% 27.39% 5.81% 12.34% 27.00% 6.09% 3.77% 5.30%AR(1)TARCH(2,1) 6.37% 0.94% 1.88% 5.49% 35.23% 13.80% 5.89% 9.00% 12.76% 5.81% 12.34% 27.00% 5.98% 6.05% 10.47%AR(2)TARCH(2,1) 6.37% 0.94% 1.88% 5.49% 35.23% 31.53% 5.94% 7.24% 10.16% 5.70% 18.18% 34.85% 6.03% 4.80% 6.09%AR(3)TARCH(2,1) 6.26% 1.64% 3.38% 5.49% 35.23% 13.80% 6.05% 4.56% 6.22% 5.64% 21.79% 38.84% 6.03% 4.80% 9.04%AR(4)TARCH(2,1) 6.31% 1.25% 2.53% 5.55% 30.02% 11.52% 6.05% 4.56% 9.72% 5.81% 12.34% 21.57% 5.98% 6.05% 6.91%AR(0)TARCH(2,2) 6.21% 2.15% 1.22% 5.60% 25.37% 9.49% 5.94% 7.24% 15.25% 5.81% 12.34% 27.00% 5.98% 6.05% 4.04%AR(1)TARCH(2,2) 6.26% 1.64% 0.89% 5.55% 30.02% 11.52% 6.10% 3.58% 7.63% 5.81% 12.34% 21.57% 6.03% 4.80% 3.64%AR(2)TARCH(2,2) 6.21% 2.15% 1.22% 5.60% 25.37% 9.49% 5.99% 5.77% 12.25% 5.81% 12.34% 27.00% 6.03% 4.80% 3.64%AR(3)TARCH(2,2) 6.31% 1.25% 0.64% 5.43% 40.99% 16.34% 5.99% 5.77% 12.25% 5.81% 12.34% 21.57% 6.03% 4.80% 3.64%AR(4)TARCH(2,2) 6.42% 0.70% 0.32% 5.43% 40.99% 16.34% 6.05% 4.56% 9.72% 5.64% 21.79% 44.02% 6.03% 4.80% 3.64%AR(0)EGARCH(0,1) 8.74% 0.00% 0.00% 6.11% 3.79% 0.96% 8.45% 0.00% 0.00% 7.28% 0.00% 0.00% 7.75% 0.00% 0.00%AR(1)EGARCH(0,1) 8.74% 0.00% 0.00% 6.06% 4.85% 1.30% 8.56% 0.00% 0.00% 7.17% 0.01% 0.01% 7.86% 0.00% 0.00%AR(2)EGARCH(0,1) 8.74% 0.00% 0.00% 6.11% 3.79% 0.96% 8.50% 0.00% 0.00% 7.28% 0.00% 0.01% 7.92% 0.00% 0.00%AR(3)EGARCH(0,1) 8.80% 0.00% 0.00% 6.00% 6.14% 1.74% 8.50% 0.00% 0.00% 7.23% 0.00% 0.01% 7.86% 0.00% 0.00%AR(4)EGARCH(0,1) 8.74% 0.00% 0.00% 6.06% 4.85% 1.30% 8.56% 0.00% 0.00% 7.23% 0.00% 0.01% 7.81% 0.00% 0.00%AR(0)EGARCH(0,2) 8.20% 0.00% 0.00% 6.00% 6.14% 0.36% 7.85% 0.00% 0.00% 7.12% 0.01% 0.03% 7.75% 0.00% 0.00%AR(1)EGARCH(0,2) 8.09% 0.00% 0.00% 6.06% 4.85% 0.27% 7.79% 0.00% 0.00% 7.17% 0.01% 0.02% 7.65% 0.00% 0.00%AR(2)EGARCH(0,2) 8.15% 0.00% 0.00% 6.11% 3.79% 0.19% 7.79% 0.00% 0.00% 7.23% 0.00% 0.01% 7.86% 0.00% 0.00%AR(3)EGARCH(0,2) 8.09% 0.00% 0.00% 6.00% 6.14% 0.36% 7.79% 0.00% 0.00% 7.23% 0.00% 0.01% 7.75% 0.00% 0.00%AR(4)EGARCH(0,2) 7.99% 0.00% 0.00% 6.06% 4.85% 0.27% 7.90% 0.00% 0.00% 7.23% 0.00% 0.01% 7.75% 0.00% 0.00%AR(0)EGARCH(1,1) 5.88% 8.96% 18.44% 5.15% 77.34% 62.05% 6.38% 0.94% 2.69% 5.81% 12.34% 14.88% 5.87% 9.38% 13.53%AR(1)EGARCH(1,1) 5.83% 11.05% 22.43% 5.15% 77.34% 62.05% 6.43% 0.70% 2.00% 5.64% 21.79% 29.06% 6.19% 2.28% 2.46%AR(2)EGARCH(1,1) 5.83% 11.05% 22.43% 5.15% 77.34% 62.05% 6.38% 0.94% 2.69% 5.70% 18.18% 26.65% 6.25% 1.75% 2.11%AR(3)EGARCH(1,1) 5.83% 11.05% 22.43% 5.15% 77.34% 62.05% 6.38% 0.94% 2.69% 5.86% 10.04% 13.42% 6.25% 1.75% 2.11%AR(4)EGARCH(1,1) 5.88% 8.96% 18.44% 5.15% 77.34% 62.05% 6.32% 1.24% 3.56% 5.86% 10.04% 13.42% 6.25% 1.75% 2.11%AR(0)EGARCH(1,2) 5.94% 7.21% 4.98% 5.15% 77.34% 62.05% 6.05% 4.56% 9.72% 5.48% 35.72% 34.76% 6.03% 4.80% 3.64%AR(1)EGARCH(1,2) 6.04% 4.55% 6.06% 5.15% 77.34% 62.05% 6.05% 4.56% 9.72% 5.48% 35.72% 34.76% 6.35% 1.00% 0.49%AR(2)EGARCH(1,2) 5.99% 5.75% 7.79% 5.21% 69.22% 81.16% 6.10% 3.58% 7.63% 5.59% 25.90% 31.26% 6.30% 1.33% 1.06%AR(3)EGARCH(1,2) 6.10% 3.57% 4.66% 5.09% 85.75% 66.26% 6.05% 4.56% 9.72% 5.59% 25.90% 31.26% 6.35% 1.00% 0.49%AR(4)EGARCH(1,2) 6.04% 4.55% 6.06% 5.15% 77.34% 62.05% 6.27% 1.64% 3.43% 5.53% 30.55% 33.18% 6.35% 1.00% 0.49%AR(0)EGARCH(2,1) 5.94% 7.21% 14.99% 5.21% 69.22% 57.31% 6.54% 0.38% 1.41% 5.81% 12.34% 14.88% 5.76% 14.09% 16.62%AR(1)EGARCH(2,1) 5.88% 8.96% 12.43% 5.15% 77.34% 62.05% 6.59% 0.28% 0.98% 5.81% 12.34% 14.88% 6.03% 4.80% 9.04%AR(2)EGARCH(2,1) 5.83% 11.05% 15.42% 5.21% 69.22% 57.31% 6.54% 0.38% 1.08% 5.81% 12.34% 14.88% 6.14% 2.94% 6.49%AR(3)EGARCH(2,1) 5.88% 8.96% 12.43% 5.09% 85.75% 66.26% 6.54% 0.38% 1.08% 5.81% 12.34% 21.57% 6.03% 4.80% 9.04%AR(4)EGARCH(2,1) 5.99% 5.75% 7.79% 5.15% 77.34% 62.05% 6.43% 0.70% 2.00% 5.81% 12.34% 21.57% 6.03% 4.80% 9.04%Note: The table reports for each model, sample size and equity index, the exception rate (t) and the p-values of unconditional (p_uc) and conditional coverage(p cc)
FTSE100Table (2.A). Normal Distribution, 1500 sample size, 95%-VaR
S&P500 NIKKEI225 DAX30 CAC40Models
Page 2 of 12

t p_uc p_cc t p_uc p_cc t p_uc p_cc t p_uc p_cc t p_uc p_ccAR(0)GARCH(0,1) 7.66% 0.00% 0.00% 5.77% 14.55% 4.93% 7.47% 0.00% 0.00% 6.68% 0.17% 0.53% 6.89% 0.04% 0.04%AR(1)GARCH(0,1) 7.61% 0.00% 0.00% 5.89% 9.62% 3.00% 7.52% 0.00% 0.00% 6.63% 0.23% 0.70% 7.05% 0.01% 0.01%AR(2)GARCH(0,1) 7.61% 0.00% 0.00% 6.00% 6.14% 1.74% 7.47% 0.00% 0.00% 6.79% 0.08% 0.30% 6.95% 0.03% 0.02%AR(3)GARCH(0,1) 7.72% 0.00% 0.00% 5.89% 9.62% 3.00% 7.47% 0.00% 0.00% 6.85% 0.06% 0.22% 7.00% 0.02% 0.01%AR(4)GARCH(0,1) 7.72% 0.00% 0.00% 6.00% 6.14% 1.74% 7.52% 0.00% 0.00% 6.85% 0.06% 0.22% 6.89% 0.04% 0.04%AR(0)GARCH(0,2) 7.34% 0.00% 0.00% 5.83% 11.88% 10.06% 6.70% 0.14% 0.36% 6.35% 1.08% 2.99% 6.89% 0.04% 0.02%AR(1)GARCH(0,2) 7.39% 0.00% 0.00% 5.89% 9.62% 7.97% 6.65% 0.20% 0.46% 6.35% 1.08% 2.99% 6.89% 0.04% 0.02%AR(2)GARCH(0,2) 7.34% 0.00% 0.00% 5.83% 11.88% 3.87% 6.70% 0.14% 0.36% 6.41% 0.81% 1.22% 7.00% 0.02% 0.01%AR(3)GARCH(0,2) 7.23% 0.00% 0.01% 5.77% 14.55% 4.93% 6.70% 0.14% 0.36% 6.46% 0.60% 1.45% 6.84% 0.06% 0.03%AR(4)GARCH(0,2) 7.23% 0.00% 0.01% 6.06% 4.85% 3.67% 6.76% 0.10% 0.27% 6.35% 1.08% 2.23% 6.84% 0.06% 0.03%AR(0)GARCH(1,1) 5.45% 38.00% 62.61% 5.77% 14.55% 22.32% 5.99% 5.77% 15.04% 5.81% 12.34% 21.57% 5.87% 9.38% 8.56%AR(1)GARCH(1,1) 5.45% 38.00% 62.61% 5.77% 14.55% 22.32% 5.99% 5.77% 12.25% 6.02% 5.14% 12.11% 6.03% 4.80% 3.64%AR(2)GARCH(1,1) 5.40% 43.90% 68.94% 5.83% 11.88% 25.23% 6.05% 4.56% 9.72% 5.64% 21.79% 29.06% 6.03% 4.80% 6.09%AR(3)GARCH(1,1) 5.40% 43.90% 68.94% 5.83% 11.88% 25.23% 5.99% 5.77% 12.25% 5.81% 12.34% 14.88% 6.09% 3.77% 5.30%AR(4)GARCH(1,1) 5.34% 50.30% 74.95% 5.83% 11.88% 25.23% 5.99% 5.77% 12.25% 5.81% 12.34% 14.88% 6.19% 2.28% 1.40%AR(0)GARCH(1,2) 5.40% 43.90% 68.94% 6.00% 6.14% 13.70% 5.83% 11.11% 26.32% 5.70% 18.18% 17.60% 5.98% 6.05% 4.04%AR(1)GARCH(1,2) 5.40% 43.90% 68.94% 6.00% 6.14% 13.70% 5.89% 9.00% 21.59% 5.91% 8.10% 11.94% 5.87% 9.38% 4.80%AR(2)GARCH(1,2) 5.45% 38.00% 62.61% 6.00% 6.14% 16.15% 5.89% 9.00% 22.11% 5.75% 15.04% 16.29% 5.92% 7.56% 7.74%AR(3)GARCH(1,2) 5.56% 27.81% 45.19% 6.00% 6.14% 16.15% 5.89% 9.00% 21.59% 5.86% 10.04% 13.42% 5.92% 7.56% 7.74%AR(4)GARCH(1,2) 5.56% 27.81% 49.69% 5.94% 7.72% 17.00% 5.94% 7.24% 18.29% 5.86% 10.04% 13.42% 5.87% 9.38% 4.80%AR(0)GARCH(2,1) 5.56% 27.81% 49.69% 5.66% 21.26% 18.85% 5.89% 9.00% 18.76% 5.97% 6.48% 14.26% 5.98% 6.05% 10.47%AR(1)GARCH(2,1) 5.45% 38.00% 62.61% 5.66% 21.26% 7.72% 5.83% 11.11% 22.81% 5.91% 8.10% 16.58% 6.14% 2.94% 4.56%AR(2)GARCH(2,1) 5.40% 43.90% 68.94% 5.77% 14.55% 22.32% 5.89% 9.00% 18.76% 6.02% 5.14% 9.10% 5.92% 7.56% 11.97%AR(3)GARCH(2,1) 5.40% 43.90% 68.94% 5.77% 14.55% 22.32% 5.94% 7.24% 15.25% 5.81% 12.34% 14.88% 6.09% 3.77% 5.30%AR(4)GARCH(2,1) 5.40% 43.90% 68.94% 5.66% 21.26% 18.85% 5.99% 5.77% 12.25% 6.02% 5.14% 9.10% 6.14% 2.94% 4.56%AR(0)GARCH(2,2) 5.94% 7.21% 18.32% 5.94% 7.72% 17.00% 5.89% 9.00% 21.59% 5.64% 21.79% 18.77% 5.82% 11.54% 9.35%AR(1)GARCH(2,2) 6.04% 4.55% 12.66% 5.89% 9.62% 20.84% 5.89% 9.00% 22.11% 5.59% 25.90% 19.74% 5.98% 6.05% 6.91%AR(2)GARCH(2,2) 5.99% 5.75% 15.32% 5.89% 9.62% 20.84% 5.94% 7.24% 18.29% 5.70% 18.18% 17.60% 5.87% 9.38% 8.56%AR(3)GARCH(2,2) 5.94% 7.21% 15.67% 5.83% 11.88% 25.23% 5.94% 7.24% 18.29% 5.81% 12.34% 21.57% 6.03% 4.80% 1.95%AR(4)GARCH(2,2) 5.88% 8.96% 21.64% 5.89% 9.62% 20.84% 5.89% 9.00% 18.76% 5.97% 6.48% 14.26% 6.14% 2.94% 1.58%AR(0)TARCH(0,1) 7.77% 0.00% 0.00% 5.77% 14.55% 1.12% 7.68% 0.00% 0.00% 6.63% 0.23% 0.85% 7.16% 0.01% 0.01%AR(1)TARCH(0,1) 7.83% 0.00% 0.00% 5.77% 14.55% 1.12% 7.74% 0.00% 0.00% 6.68% 0.17% 0.64% 7.22% 0.00% 0.01%AR(2)TARCH(0,1) 7.93% 0.00% 0.00% 5.94% 7.72% 2.29% 7.85% 0.00% 0.00% 6.63% 0.23% 0.85% 7.16% 0.01% 0.01%AR(3)TARCH(0,1) 7.83% 0.00% 0.00% 5.83% 11.88% 3.87% 7.79% 0.00% 0.00% 6.96% 0.03% 0.13% 7.22% 0.00% 0.01%AR(4)TARCH(0,1) 7.88% 0.00% 0.00% 5.94% 7.72% 2.29% 7.79% 0.00% 0.00% 6.79% 0.08% 0.35% 7.22% 0.00% 0.01%AR(0)TARCH(0,2) 7.50% 0.00% 0.00% 5.66% 21.26% 7.72% 6.54% 0.38% 1.41% 6.35% 1.08% 2.99% 7.05% 0.01% 0.02%AR(1)TARCH(0,2) 7.50% 0.00% 0.00% 5.66% 21.26% 7.72% 6.54% 0.38% 1.41% 6.46% 0.60% 1.87% 7.11% 0.01% 0.01%AR(2)TARCH(0,2) 7.61% 0.00% 0.00% 5.77% 14.55% 4.93% 6.65% 0.20% 0.74% 6.41% 0.81% 1.81% 7.22% 0.00% 0.01%AR(3)TARCH(0,2) 7.39% 0.00% 0.00% 5.77% 14.55% 4.93% 6.59% 0.28% 0.99% 6.41% 0.81% 2.38% 7.11% 0.01% 0.01%AR(4)TARCH(0,2) 7.29% 0.00% 0.00% 5.89% 9.62% 3.00% 6.49% 0.52% 1.80% 6.35% 1.08% 2.99% 7.11% 0.01% 0.01%AR(0)TARCH(1,1) 6.21% 2.15% 4.46% 5.32% 54.14% 22.01% 5.61% 23.69% 44.06% 5.70% 18.18% 26.65% 6.03% 4.80% 9.04%AR(1)TARCH(1,1) 6.21% 2.15% 4.46% 5.43% 40.99% 36.48% 5.56% 28.04% 50.35% 5.75% 15.04% 16.29% 5.98% 6.05% 13.90%AR(2)TARCH(1,1) 6.37% 0.94% 1.88% 5.32% 54.14% 46.95% 5.61% 23.69% 44.06% 5.64% 21.79% 29.06% 6.09% 3.77% 7.70%AR(3)TARCH(1,1) 6.21% 2.15% 4.46% 5.26% 61.47% 52.22% 5.61% 23.69% 44.06% 5.70% 18.18% 26.65% 6.14% 2.94% 4.56%AR(4)TARCH(1,1) 6.37% 0.94% 1.88% 5.26% 61.47% 52.22% 5.67% 19.85% 38.07% 5.91% 8.10% 11.94% 6.09% 3.77% 7.70%AR(0)TARCH(1,2) 6.31% 1.25% 2.53% 5.38% 47.31% 19.08% 5.61% 23.69% 44.06% 5.75% 15.04% 24.13% 6.03% 4.80% 6.09%AR(1)TARCH(1,2) 6.26% 1.64% 3.38% 5.49% 35.23% 31.53% 5.61% 23.69% 44.06% 5.64% 21.79% 18.77% 6.14% 2.94% 4.56%AR(2)TARCH(1,2) 6.26% 1.64% 3.38% 5.38% 47.31% 41.66% 5.78% 13.59% 27.39% 5.86% 10.04% 13.42% 5.98% 6.05% 6.91%AR(3)TARCH(1,2) 6.42% 0.70% 1.38% 5.43% 40.99% 36.48% 5.78% 13.59% 27.39% 5.81% 12.34% 14.88% 6.03% 4.80% 6.09%AR(4)TARCH(1,2) 6.48% 0.52% 1.00% 5.43% 40.99% 36.48% 5.72% 16.49% 32.49% 5.86% 10.04% 13.42% 5.92% 7.56% 7.74%AR(0)TARCH(2,1) 6.37% 0.94% 1.88% 5.60% 25.37% 9.49% 5.56% 28.04% 50.35% 5.70% 18.18% 26.65% 5.71% 17.05% 34.04%AR(1)TARCH(2,1) 6.37% 0.94% 1.88% 5.32% 54.14% 22.01% 5.78% 13.59% 27.39% 5.75% 15.04% 24.13% 5.82% 11.54% 26.10%AR(2)TARCH(2,1) 6.26% 1.64% 3.38% 5.43% 40.99% 16.34% 5.67% 19.85% 38.07% 5.70% 18.18% 34.85% 5.76% 14.09% 16.62%AR(3)TARCH(2,1) 6.37% 0.94% 1.88% 5.38% 47.31% 19.08% 5.67% 19.85% 38.07% 5.59% 25.90% 42.72% 5.92% 7.56% 16.24%AR(4)TARCH(2,1) 6.48% 0.52% 1.00% 5.38% 47.31% 19.08% 5.83% 11.11% 22.81% 5.86% 10.04% 19.03% 6.09% 3.77% 9.82%AR(0)TARCH(2,2) 6.26% 1.64% 1.98% 5.43% 40.99% 36.48% 5.67% 19.85% 38.07% 5.64% 21.79% 38.84% 5.71% 17.05% 18.07%AR(1)TARCH(2,2) 6.10% 3.57% 4.66% 5.43% 40.99% 36.48% 5.72% 16.49% 32.49% 5.81% 12.34% 21.57% 5.76% 14.09% 24.02%AR(2)TARCH(2,2) 6.26% 1.64% 1.98% 5.43% 40.99% 16.34% 5.67% 19.85% 38.07% 5.91% 8.10% 11.94% 5.87% 9.38% 8.56%AR(3)TARCH(2,2) 6.37% 0.94% 1.06% 5.26% 61.47% 25.06% 5.67% 19.85% 38.07% 5.97% 6.48% 10.49% 5.92% 7.56% 7.74%AR(4)TARCH(2,2) 6.31% 1.25% 1.46% 5.49% 35.23% 13.80% 5.78% 13.59% 27.39% 5.91% 8.10% 11.94% 5.92% 7.56% 7.74%AR(0)EGARCH(0,1) 7.93% 0.00% 0.00% 5.66% 21.26% 7.72% 7.63% 0.00% 0.00% 6.52% 0.44% 1.15% 7.22% 0.00% 0.00%AR(1)EGARCH(0,1) 7.88% 0.00% 0.00% 5.72% 17.66% 6.21% 7.63% 0.00% 0.00% 6.57% 0.32% 0.90% 7.27% 0.00% 0.00%AR(2)EGARCH(0,1) 7.93% 0.00% 0.00% 5.77% 14.55% 4.93% 7.63% 0.00% 0.00% 6.63% 0.23% 0.70% 7.27% 0.00% 0.00%AR(3)EGARCH(0,1) 7.88% 0.00% 0.00% 5.89% 9.62% 3.00% 7.68% 0.00% 0.00% 6.74% 0.12% 0.40% 7.32% 0.00% 0.00%AR(4)EGARCH(0,1) 7.88% 0.00% 0.00% 5.83% 11.88% 3.87% 7.68% 0.00% 0.00% 6.74% 0.12% 0.40% 7.32% 0.00% 0.00%AR(0)EGARCH(0,2) 7.45% 0.00% 0.00% 5.89% 9.62% 7.97% 6.98% 0.02% 0.04% 6.30% 1.43% 2.71% 7.00% 0.02% 0.01%AR(1)EGARCH(0,2) 7.56% 0.00% 0.00% 5.89% 9.62% 7.97% 6.92% 0.03% 0.03% 6.35% 1.08% 2.23% 7.00% 0.02% 0.01%AR(2)EGARCH(0,2) 7.56% 0.00% 0.00% 6.00% 6.14% 4.81% 6.81% 0.07% 0.09% 6.41% 0.81% 1.81% 7.00% 0.02% 0.01%AR(3)EGARCH(0,2) 7.66% 0.00% 0.00% 5.94% 7.72% 6.23% 6.92% 0.03% 0.03% 6.35% 1.08% 2.23% 7.05% 0.01% 0.01%AR(4)EGARCH(0,2) 7.61% 0.00% 0.00% 6.06% 4.85% 3.67% 6.92% 0.03% 0.03% 6.35% 1.08% 2.23% 7.11% 0.01% 0.00%AR(0)EGARCH(1,1) 6.04% 4.55% 9.55% 4.98% 96.95% 72.50% 5.67% 19.85% 38.07% 5.48% 35.72% 34.76% 6.09% 3.77% 5.30%AR(1)EGARCH(1,1) 6.04% 4.55% 9.55% 5.04% 94.35% 91.91% 5.67% 19.85% 38.07% 5.37% 47.69% 36.59% 6.14% 2.94% 2.84%AR(2)EGARCH(1,1) 6.04% 4.55% 9.55% 5.21% 69.22% 81.16% 5.72% 16.49% 32.49% 5.48% 35.72% 20.97% 6.14% 2.94% 2.84%AR(3)EGARCH(1,1) 6.04% 4.55% 9.55% 5.21% 69.22% 81.16% 5.72% 16.49% 32.49% 5.59% 25.90% 19.74% 6.14% 2.94% 2.84%AR(4)EGARCH(1,1) 6.10% 3.57% 7.49% 5.38% 47.31% 63.30% 5.72% 16.49% 32.49% 5.64% 21.79% 18.77% 6.14% 2.94% 2.84%AR(0)EGARCH(1,2) 5.83% 11.05% 8.08% 5.32% 54.14% 69.71% 5.99% 5.77% 15.04% 5.37% 47.69% 54.80% 5.92% 7.56% 7.74%AR(1)EGARCH(1,2) 5.94% 7.21% 4.98% 5.38% 47.31% 73.05% 5.94% 7.24% 18.34% 5.31% 54.44% 56.38% 5.92% 7.56% 7.74%AR(2)EGARCH(1,2) 5.83% 11.05% 8.08% 5.38% 47.31% 73.05% 5.89% 9.00% 22.11% 5.42% 41.44% 35.91% 5.92% 7.56% 7.74%AR(3)EGARCH(1,2) 5.94% 7.21% 4.98% 5.43% 40.99% 67.00% 6.05% 4.56% 12.18% 5.53% 30.55% 33.18% 5.98% 6.05% 6.91%AR(4)EGARCH(1,2) 5.83% 11.05% 8.08% 5.38% 47.31% 73.05% 5.99% 5.77% 15.04% 5.42% 41.44% 35.91% 6.03% 4.80% 6.09%AR(0)EGARCH(2,1) 6.04% 4.55% 9.55% 5.32% 54.14% 46.95% 5.94% 7.24% 10.16% 5.48% 35.72% 34.76% 6.14% 2.94% 6.49%AR(1)EGARCH(2,1) 6.10% 3.57% 7.49% 5.21% 69.22% 81.16% 5.72% 16.49% 23.53% 5.48% 35.72% 34.76% 6.19% 2.28% 6.61%AR(2)EGARCH(2,1) 5.94% 7.21% 9.90% 5.26% 61.47% 75.73% 5.78% 13.59% 19.42% 5.48% 35.72% 34.76% 6.19% 2.28% 5.40%AR(3)EGARCH(2,1) 6.10% 3.57% 4.66% 5.26% 61.47% 75.73% 5.72% 16.49% 23.53% 5.42% 41.44% 35.91% 6.25% 1.75% 4.44%AR(4)EGARCH(2,1) 6.10% 3.57% 4.66% 5.43% 40.99% 56.72% 5.72% 16.49% 23.53% 5.42% 41.44% 35.91% 6.19% 2.28% 5.40%Note: The table reports for each model, sample size and equity index, the exception rate (t) and the p-values of unconditional (p_uc) and conditional coverage(p cc)
FTSE100Table (3.A). Normal Distribution, 1000 sample size, 95%-VaR
S&P500 NIKKEI225 DAX30 CAC40Models
Page 3 of 12

t p_uc p_cc t p_uc p_cc t p_uc p_cc t p_uc p_cc t p_uc p_ccAR(0)GARCH(0,1) 6.26% 1.64% 5.24% 5.83% 11.88% 3.87% 6.54% 0.38% 0.47% 6.52% 0.44% 1.15% 6.62% 0.22% 0.11%AR(1)GARCH(0,1) 6.26% 1.64% 5.24% 5.89% 9.62% 7.97% 6.70% 0.14% 0.24% 6.57% 0.32% 0.65% 6.73% 0.11% 0.02%AR(2)GARCH(0,1) 6.42% 0.70% 2.40% 6.00% 6.14% 9.31% 6.81% 0.07% 0.09% 6.52% 0.44% 1.15% 6.73% 0.11% 0.01%AR(3)GARCH(0,1) 6.48% 0.52% 1.80% 6.00% 6.14% 9.31% 6.87% 0.05% 0.07% 6.63% 0.23% 0.51% 6.84% 0.06% 0.01%AR(4)GARCH(0,1) 6.42% 0.70% 2.40% 6.00% 6.14% 9.31% 6.92% 0.03% 0.06% 6.63% 0.23% 0.51% 6.95% 0.03% 0.00%AR(0)GARCH(0,2) 6.31% 1.25% 3.53% 5.66% 21.26% 18.85% 6.27% 1.64% 5.02% 6.30% 1.43% 2.71% 6.35% 1.00% 0.90%AR(1)GARCH(0,2) 6.26% 1.64% 4.62% 5.77% 14.55% 12.56% 6.27% 1.64% 5.02% 6.24% 1.87% 3.26% 6.35% 1.00% 0.49%AR(2)GARCH(0,2) 6.31% 1.25% 4.09% 5.72% 17.66% 15.48% 6.54% 0.38% 1.41% 6.24% 1.87% 3.26% 6.52% 0.41% 0.16%AR(3)GARCH(0,2) 6.37% 0.94% 3.15% 5.77% 14.55% 12.56% 6.43% 0.70% 2.43% 6.30% 1.43% 2.71% 6.52% 0.41% 0.16%AR(4)GARCH(0,2) 6.42% 0.70% 2.40% 5.89% 9.62% 7.97% 6.49% 0.52% 1.86% 6.35% 1.08% 2.23% 6.52% 0.41% 0.30%AR(0)GARCH(1,1) 5.56% 27.81% 49.69% 5.43% 40.99% 36.48% 6.05% 4.56% 12.66% 5.97% 6.48% 10.49% 5.71% 17.05% 26.68%AR(1)GARCH(1,1) 5.50% 32.64% 56.13% 5.38% 47.31% 41.66% 5.99% 5.77% 15.31% 5.97% 6.48% 10.49% 5.76% 14.09% 24.02%AR(2)GARCH(1,1) 5.56% 27.81% 49.69% 5.43% 40.99% 36.48% 6.10% 3.58% 10.34% 5.64% 21.79% 18.77% 5.65% 20.47% 38.15%AR(3)GARCH(1,1) 5.50% 32.64% 56.13% 5.38% 47.31% 41.66% 6.16% 2.78% 8.34% 5.91% 8.10% 7.54% 5.71% 17.05% 34.04%AR(4)GARCH(1,1) 5.50% 32.64% 56.13% 5.38% 47.31% 41.66% 6.05% 4.56% 12.66% 5.86% 10.04% 13.42% 5.82% 11.54% 26.10%AR(0)GARCH(1,2) 5.61% 23.50% 31.04% 5.72% 17.66% 26.92% 5.94% 7.24% 7.27% 5.81% 12.34% 9.00% 5.76% 14.09% 10.07%AR(1)GARCH(1,2) 5.72% 16.38% 26.01% 5.77% 14.55% 22.32% 5.99% 5.77% 6.48% 5.81% 12.34% 9.00% 5.76% 14.09% 10.07%AR(2)GARCH(1,2) 5.72% 16.38% 33.10% 5.72% 17.66% 26.92% 6.10% 3.58% 4.96% 5.91% 8.10% 11.94% 5.82% 11.54% 9.35%AR(3)GARCH(1,2) 5.67% 19.70% 18.99% 5.66% 21.26% 32.06% 6.16% 2.78% 4.25% 5.64% 21.79% 18.77% 5.87% 9.38% 8.56%AR(4)GARCH(1,2) 5.67% 19.70% 18.99% 5.60% 25.37% 37.71% 6.10% 3.58% 7.25% 5.75% 15.04% 16.29% 5.87% 9.38% 8.56%AR(0)GARCH(2,1) 5.40% 43.90% 68.94% 5.49% 35.23% 31.53% 6.05% 4.56% 12.66% 5.86% 10.04% 8.29% 5.60% 24.37% 31.69%AR(1)GARCH(2,1) 5.61% 23.50% 43.44% 5.43% 40.99% 36.48% 6.05% 4.56% 12.66% 5.86% 10.04% 23.31% 5.82% 11.54% 15.09%AR(2)GARCH(2,1) 5.56% 27.81% 49.69% 5.43% 40.99% 36.48% 6.27% 1.64% 5.24% 6.19% 2.44% 3.87% 5.76% 14.09% 29.99%AR(3)GARCH(2,1) 5.67% 19.70% 41.03% 5.38% 47.31% 41.66% 6.21% 2.14% 6.65% 6.30% 1.43% 3.71% 5.82% 11.54% 26.10%AR(4)GARCH(2,1) 5.50% 32.64% 56.13% 5.49% 35.23% 31.53% 6.10% 3.58% 10.34% 6.19% 2.44% 3.87% 5.87% 9.38% 22.43%AR(0)GARCH(2,2) 5.61% 23.50% 31.04% 5.66% 21.26% 32.06% 5.83% 11.11% 20.43% 5.91% 8.10% 16.58% 5.60% 24.37% 42.22%AR(1)GARCH(2,2) 5.72% 16.38% 26.01% 5.66% 21.26% 32.06% 5.78% 13.59% 23.02% 6.02% 5.14% 9.10% 5.98% 6.05% 1.00%AR(2)GARCH(2,2) 5.77% 13.51% 29.09% 5.66% 21.26% 32.06% 6.16% 2.78% 6.10% 6.02% 5.14% 9.10% 5.98% 6.05% 6.91%AR(3)GARCH(2,2) 5.77% 13.51% 16.20% 5.66% 21.26% 32.06% 6.10% 3.58% 4.96% 5.97% 6.48% 10.49% 6.09% 3.77% 3.23%AR(4)GARCH(2,2) 5.83% 11.05% 14.67% 5.83% 11.88% 18.27% 6.10% 3.58% 7.25% 6.13% 3.16% 6.60% 5.82% 11.54% 15.09%AR(0)TARCH(0,1) 6.69% 0.14% 0.25% 5.89% 9.62% 7.97% 6.70% 0.14% 0.56% 6.41% 0.81% 2.75% 6.73% 0.11% 0.13%AR(1)TARCH(0,1) 6.64% 0.20% 0.36% 5.94% 7.72% 6.23% 6.81% 0.07% 0.30% 6.52% 0.44% 1.62% 6.84% 0.06% 0.08%AR(2)TARCH(0,1) 6.64% 0.20% 0.36% 5.94% 7.72% 11.80% 6.87% 0.05% 0.19% 6.63% 0.23% 0.85% 6.89% 0.04% 0.04%AR(3)TARCH(0,1) 6.75% 0.10% 0.17% 6.00% 6.14% 9.31% 6.87% 0.05% 0.19% 6.68% 0.17% 0.53% 7.00% 0.02% 0.02%AR(4)TARCH(0,1) 6.64% 0.20% 0.36% 6.06% 4.85% 3.67% 6.81% 0.07% 0.26% 6.68% 0.17% 0.64% 7.00% 0.02% 0.02%AR(0)TARCH(0,2) 6.69% 0.14% 0.12% 5.72% 17.66% 15.48% 6.16% 2.78% 8.34% 6.19% 2.44% 6.89% 6.52% 0.41% 0.81%AR(1)TARCH(0,2) 6.42% 0.70% 0.76% 5.72% 17.66% 15.48% 6.32% 1.24% 4.08% 6.30% 1.43% 4.46% 6.62% 0.22% 0.51%AR(2)TARCH(0,2) 6.48% 0.52% 0.54% 5.77% 14.55% 12.56% 6.32% 1.24% 4.08% 6.30% 1.43% 3.71% 6.79% 0.08% 0.16%AR(3)TARCH(0,2) 6.53% 0.38% 0.71% 5.89% 9.62% 7.97% 6.43% 0.70% 2.39% 6.35% 1.08% 2.99% 6.73% 0.11% 0.21%AR(4)TARCH(0,2) 6.64% 0.20% 0.36% 5.89% 9.62% 7.97% 6.54% 0.38% 1.34% 6.24% 1.87% 4.55% 6.79% 0.08% 0.16%AR(0)TARCH(1,1) 5.77% 13.51% 26.95% 5.32% 54.14% 46.95% 5.67% 19.85% 38.07% 6.08% 4.05% 7.80% 5.55% 28.78% 46.12%AR(1)TARCH(1,1) 5.77% 13.51% 26.95% 5.21% 69.22% 57.31% 5.78% 13.59% 27.39% 5.86% 10.04% 13.42% 5.71% 17.05% 34.04%AR(2)TARCH(1,1) 5.61% 23.50% 43.44% 5.21% 69.22% 57.31% 5.94% 7.24% 15.25% 6.19% 2.44% 3.87% 5.60% 24.37% 31.69%AR(3)TARCH(1,1) 5.77% 13.51% 26.95% 5.04% 94.35% 69.80% 5.78% 13.59% 27.39% 6.30% 1.43% 2.71% 5.82% 11.54% 21.35%AR(4)TARCH(1,1) 5.94% 7.21% 18.20% 4.92% 88.26% 74.26% 5.83% 11.11% 22.81% 6.35% 1.08% 2.23% 5.76% 14.09% 29.99%AR(0)TARCH(1,2) 5.94% 7.21% 18.20% 5.55% 30.02% 26.90% 5.61% 23.69% 40.96% 6.57% 0.32% 1.12% 5.87% 9.38% 13.53%AR(1)TARCH(1,2) 5.88% 8.96% 21.94% 5.66% 21.26% 32.06% 5.67% 19.85% 41.22% 6.30% 1.43% 4.46% 5.71% 17.05% 26.68%AR(2)TARCH(1,2) 5.94% 7.21% 18.20% 5.60% 25.37% 37.71% 5.56% 28.04% 52.20% 6.30% 1.43% 3.71% 5.65% 20.47% 19.39%AR(3)TARCH(1,2) 5.83% 11.05% 26.13% 5.72% 17.66% 26.92% 5.50% 32.92% 57.61% 6.35% 1.08% 2.23% 5.87% 9.38% 13.53%AR(4)TARCH(1,2) 5.94% 7.21% 18.20% 5.60% 25.37% 37.71% 5.67% 19.85% 41.22% 6.35% 1.08% 2.23% 5.76% 14.09% 24.02%AR(0)TARCH(2,1) 5.72% 16.38% 35.74% 4.98% 96.95% 39.22% 5.78% 13.59% 27.39% 6.08% 4.05% 11.45% 5.55% 28.78% 33.86%AR(1)TARCH(2,1) 5.99% 5.75% 14.91% 5.09% 85.75% 66.26% 5.78% 13.59% 27.39% 6.30% 1.43% 3.71% 5.55% 28.78% 53.27%AR(2)TARCH(2,1) 5.94% 7.21% 18.20% 5.09% 85.75% 66.26% 5.94% 7.24% 15.25% 6.57% 0.32% 1.12% 5.82% 11.54% 20.96%AR(3)TARCH(2,1) 5.99% 5.75% 14.91% 5.32% 54.14% 46.95% 5.89% 9.00% 22.11% 6.57% 0.32% 1.12% 5.82% 11.54% 21.35%AR(4)TARCH(2,1) 6.04% 4.55% 12.66% 5.26% 61.47% 52.22% 5.83% 11.11% 22.81% 6.57% 0.32% 1.12% 5.87% 9.38% 13.53%AR(0)TARCH(2,2) 5.72% 16.38% 31.98% 5.32% 54.14% 46.95% 5.72% 16.49% 35.94% 6.13% 3.16% 8.42% 5.65% 20.47% 29.27%AR(1)TARCH(2,2) 5.94% 7.21% 14.99% 5.38% 47.31% 63.30% 5.83% 11.11% 25.17% 6.13% 3.16% 6.60% 5.60% 24.37% 31.69%AR(2)TARCH(2,2) 5.99% 5.75% 12.04% 5.38% 47.31% 63.30% 5.56% 28.04% 52.20% 6.41% 0.81% 2.38% 5.76% 14.09% 24.02%AR(3)TARCH(2,2) 5.88% 8.96% 21.94% 5.26% 61.47% 52.22% 5.61% 23.69% 40.96% 6.02% 5.14% 13.93% 5.76% 14.09% 24.02%AR(4)TARCH(2,2) 5.94% 7.21% 18.20% 5.55% 30.02% 26.90% 5.56% 28.04% 44.80% 6.41% 0.81% 1.81% 5.76% 14.09% 24.02%AR(0)EGARCH(0,1) 6.58% 0.28% 0.99% 5.89% 9.62% 14.77% 6.87% 0.05% 0.04% 6.35% 1.08% 2.99% 6.89% 0.04% 0.01%AR(1)EGARCH(0,1) 6.64% 0.20% 0.72% 6.00% 6.14% 9.31% 7.03% 0.02% 0.02% 6.41% 0.81% 2.38% 7.11% 0.01% 0.00%AR(2)EGARCH(0,1) 6.64% 0.20% 0.72% 5.94% 7.72% 11.80% 6.98% 0.02% 0.03% 6.52% 0.44% 1.46% 7.16% 0.01% 0.00%AR(3)EGARCH(0,1) 6.75% 0.10% 0.42% 5.94% 7.72% 11.80% 7.08% 0.01% 0.01% 6.52% 0.44% 1.46% 7.22% 0.00% 0.00%AR(4)EGARCH(0,1) 6.80% 0.07% 0.30% 5.94% 7.72% 11.80% 7.03% 0.02% 0.01% 6.52% 0.44% 1.46% 7.27% 0.00% 0.00%AR(0)EGARCH(0,2) 6.42% 0.70% 2.45% 5.94% 7.72% 11.80% 6.38% 0.94% 1.37% 6.24% 1.87% 4.55% 6.79% 0.08% 0.03%AR(1)EGARCH(0,2) 6.42% 0.70% 2.17% 6.00% 6.14% 9.31% 6.43% 0.70% 1.13% 6.30% 1.43% 3.71% 6.84% 0.06% 0.03%AR(2)EGARCH(0,2) 6.48% 0.52% 1.70% 6.06% 4.85% 7.25% 6.54% 0.38% 0.74% 6.30% 1.43% 3.71% 6.84% 0.06% 0.03%AR(3)EGARCH(0,2) 6.64% 0.20% 0.48% 6.06% 4.85% 7.25% 6.54% 0.38% 0.74% 6.46% 0.60% 1.45% 7.00% 0.02% 0.01%AR(4)EGARCH(0,2) 6.64% 0.20% 0.48% 6.11% 3.79% 5.59% 6.65% 0.20% 0.46% 6.52% 0.44% 1.15% 7.05% 0.01% 0.01%AR(0)EGARCH(1,1) 5.94% 7.21% 18.20% 5.26% 61.47% 52.22% 6.10% 3.58% 10.34% 6.63% 0.23% 0.20% 5.65% 20.47% 19.39%AR(1)EGARCH(1,1) 5.99% 5.75% 14.91% 5.38% 47.31% 41.66% 6.16% 2.78% 8.34% 6.52% 0.44% 0.51% 5.76% 14.09% 16.62%AR(2)EGARCH(1,1) 6.04% 4.55% 12.08% 5.66% 21.26% 18.85% 6.05% 4.56% 12.18% 6.74% 0.12% 0.31% 6.09% 3.77% 3.23%AR(3)EGARCH(1,1) 6.04% 4.55% 12.08% 5.32% 54.14% 46.95% 6.10% 3.58% 10.34% 6.46% 0.60% 1.00% 5.92% 7.56% 7.74%AR(4)EGARCH(1,1) 6.04% 4.55% 12.08% 5.38% 47.31% 41.66% 6.10% 3.58% 10.34% 6.46% 0.60% 1.45% 6.03% 4.80% 3.64%AR(0)EGARCH(1,2) 5.99% 5.75% 15.32% 4.92% 88.26% 93.04% 6.05% 4.56% 12.18% 5.97% 6.48% 6.77% 5.76% 14.09% 16.62%AR(1)EGARCH(1,2) 6.15% 2.78% 8.34% 4.92% 88.26% 93.04% 6.05% 4.56% 12.18% 5.91% 8.10% 7.54% 5.82% 11.54% 9.35%AR(2)EGARCH(1,2) 6.26% 1.64% 4.62% 4.81% 71.30% 88.86% 6.16% 2.78% 7.71% 6.30% 1.43% 2.71% 5.92% 7.56% 4.43%AR(3)EGARCH(1,2) 6.31% 1.25% 3.53% 4.98% 96.95% 93.14% 6.05% 4.56% 12.18% 6.08% 4.05% 5.25% 5.92% 7.56% 7.74%AR(4)EGARCH(1,2) 6.37% 0.94% 2.67% 5.15% 77.34% 85.79% 6.21% 2.14% 6.03% 6.13% 3.16% 2.76% 5.98% 6.05% 6.91%AR(0)EGARCH(2,1) 6.48% 0.52% 1.00% 5.38% 47.31% 19.08% 6.05% 4.56% 9.72% 6.41% 0.81% 1.81% 5.49% 33.72% 35.71%AR(1)EGARCH(2,1) 6.26% 1.64% 3.38% 5.66% 21.26% 18.85% 6.05% 4.56% 9.72% 6.41% 0.81% 2.38% 5.49% 33.72% 35.71%AR(2)EGARCH(2,1) 6.48% 0.52% 0.54% 5.55% 30.02% 26.90% 5.99% 5.77% 12.25% 6.41% 0.81% 1.81% 5.65% 20.47% 19.39%AR(3)EGARCH(2,1) 6.42% 0.70% 0.76% 5.60% 25.37% 22.66% 5.99% 5.77% 12.25% 6.46% 0.60% 1.87% 5.98% 6.05% 10.47%AR(4)EGARCH(2,1) 6.31% 1.25% 1.46% 5.72% 17.66% 15.48% 5.83% 11.11% 22.81% 6.63% 0.23% 0.70% 5.92% 7.56% 11.97%Note: The table reports for each model, sample size and equity index, the exception rate (t) and the p-values of unconditional (p_uc) and conditional coverage(p cc)
FTSE100Table (4.A). Normal Distribution, 500 sample size, 95%-VaR
S&P500 NIKKEI225 DAX30 CAC40Models
Page 4 of 12

t p_uc p_cc t p_uc p_cc t p_uc p_cc t p_uc p_cc t p_uc p_ccAR(0)GARCH(0,1) 3.94% 0.00% 0.00% 1.53% 3.85% 7.60% 3.38% 0.00% 0.00% 3.45% 0.00% 0.00% 3.55% 0.00% 0.00%AR(1)GARCH(0,1) 3.99% 0.00% 0.00% 1.53% 3.85% 7.60% 3.43% 0.00% 0.00% 3.45% 0.00% 0.00% 3.50% 0.00% 0.00%AR(2)GARCH(0,1) 4.10% 0.00% 0.00% 1.53% 3.85% 7.60% 3.49% 0.00% 0.00% 3.45% 0.00% 0.00% 3.55% 0.00% 0.00%AR(3)GARCH(0,1) 4.10% 0.00% 0.00% 1.58% 2.28% 4.70% 3.49% 0.00% 0.00% 3.45% 0.00% 0.00% 3.55% 0.00% 0.00%AR(4)GARCH(0,1) 4.05% 0.00% 0.00% 1.64% 1.32% 2.80% 3.54% 0.00% 0.00% 3.40% 0.00% 0.00% 3.55% 0.00% 0.00%AR(0)GARCH(0,2) 3.40% 0.00% 0.00% 1.64% 1.32% 2.80% 3.11% 0.00% 0.00% 2.90% 0.00% 0.00% 3.12% 0.00% 0.00%AR(1)GARCH(0,2) 3.29% 0.00% 0.00% 1.70% 0.73% 1.61% 3.11% 0.00% 0.00% 2.96% 0.00% 0.00% 3.12% 0.00% 0.00%AR(2)GARCH(0,2) 3.29% 0.00% 0.00% 1.58% 2.28% 4.70% 3.11% 0.00% 0.00% 2.96% 0.00% 0.00% 3.18% 0.00% 0.00%AR(3)GARCH(0,2) 3.29% 0.00% 0.00% 1.64% 1.32% 2.80% 3.16% 0.00% 0.00% 2.85% 0.00% 0.00% 3.39% 0.00% 0.00%AR(4)GARCH(0,2) 3.24% 0.00% 0.00% 1.64% 1.32% 2.80% 3.22% 0.00% 0.00% 2.85% 0.00% 0.00% 3.45% 0.00% 0.00%AR(0)GARCH(1,1) 2.16% 0.00% 0.00% 1.64% 1.32% 2.80% 1.58% 2.12% 1.56% 1.81% 0.18% 0.26% 1.72% 0.45% 0.99%AR(1)GARCH(1,1) 2.10% 0.00% 0.00% 1.70% 0.73% 1.61% 1.53% 3.56% 8.11% 1.86% 0.09% 0.15% 1.67% 0.82% 1.76%AR(2)GARCH(1,1) 2.16% 0.00% 0.00% 1.70% 0.73% 1.61% 1.58% 2.12% 1.56% 1.81% 0.18% 0.26% 1.67% 0.82% 1.76%AR(3)GARCH(1,1) 2.10% 0.00% 0.00% 1.70% 0.73% 1.61% 1.63% 1.23% 1.08% 1.81% 0.18% 0.26% 1.72% 0.45% 0.99%AR(4)GARCH(1,1) 2.16% 0.00% 0.00% 1.64% 1.32% 2.80% 1.58% 2.12% 1.56% 1.81% 0.18% 0.26% 1.67% 0.82% 1.76%AR(0)GARCH(1,2) 2.10% 0.00% 0.00% 1.64% 1.32% 2.80% 1.69% 0.69% 2.14% 1.75% 0.35% 0.43% 1.62% 1.44% 3.01%AR(1)GARCH(1,2) 1.94% 0.03% 0.02% 1.64% 1.32% 2.80% 1.74% 0.38% 1.28% 1.64% 1.15% 3.28% 1.62% 1.44% 3.01%AR(2)GARCH(1,2) 2.10% 0.00% 0.00% 1.64% 1.32% 2.80% 1.74% 0.38% 1.28% 1.70% 0.64% 2.01% 1.67% 0.82% 1.76%AR(3)GARCH(1,2) 2.21% 0.00% 0.00% 1.70% 0.73% 1.61% 1.69% 0.69% 2.14% 1.75% 0.35% 1.19% 1.67% 0.82% 1.76%AR(4)GARCH(1,2) 2.16% 0.00% 0.00% 1.64% 1.32% 2.80% 1.69% 0.69% 2.14% 1.75% 0.35% 0.43% 1.67% 0.82% 1.76%AR(0)GARCH(2,1) 2.21% 0.00% 0.00% 1.64% 1.32% 2.80% 1.69% 0.69% 0.71% 1.81% 0.18% 0.26% 1.72% 0.45% 0.99%AR(1)GARCH(2,1) 2.16% 0.00% 0.00% 1.64% 1.32% 2.80% 1.80% 0.20% 0.28% 1.81% 0.18% 0.26% 1.67% 0.82% 1.76%AR(2)GARCH(2,1) 2.10% 0.00% 0.00% 1.64% 1.32% 2.80% 1.74% 0.38% 1.28% 1.81% 0.18% 0.26% 1.67% 0.82% 1.76%AR(3)GARCH(2,1) 2.16% 0.00% 0.00% 1.64% 1.32% 2.80% 1.58% 2.12% 5.40% 1.75% 0.35% 0.43% 1.62% 1.44% 3.01%AR(4)GARCH(2,1) 2.16% 0.00% 0.00% 1.64% 1.32% 2.80% 1.69% 0.69% 2.14% 1.81% 0.18% 0.26% 1.67% 0.82% 1.76%AR(0)GARCH(2,2) 2.10% 0.00% 0.00% 1.64% 1.32% 2.80% 1.69% 0.69% 2.14% 1.75% 0.35% 0.43% 1.62% 1.44% 3.01%AR(1)GARCH(2,2) 2.10% 0.00% 0.00% 1.64% 1.32% 2.80% 1.74% 0.38% 1.28% 1.81% 0.18% 0.26% 1.56% 2.46% 4.97%AR(2)GARCH(2,2) 2.16% 0.00% 0.00% 1.64% 1.32% 2.80% 1.69% 0.69% 2.14% 1.75% 0.35% 0.43% 1.62% 1.44% 3.01%AR(3)GARCH(2,2) 2.05% 0.01% 0.00% 1.64% 1.32% 2.80% 1.74% 0.38% 1.28% 1.75% 0.35% 0.43% 1.62% 1.44% 3.01%AR(4)GARCH(2,2) 2.10% 0.00% 0.00% 1.64% 1.32% 2.80% 1.69% 0.69% 2.14% 1.75% 0.35% 0.43% 1.72% 0.45% 0.99%AR(0)TARCH(0,1) 3.83% 0.00% 0.00% 1.53% 3.85% 7.60% 3.43% 0.00% 0.00% 3.34% 0.00% 0.00% 3.45% 0.00% 0.00%AR(1)TARCH(0,1) 3.83% 0.00% 0.00% 1.53% 3.85% 7.60% 3.43% 0.00% 0.00% 3.40% 0.00% 0.00% 3.50% 0.00% 0.00%AR(2)TARCH(0,1) 3.78% 0.00% 0.00% 1.58% 2.28% 4.70% 3.49% 0.00% 0.00% 3.34% 0.00% 0.00% 3.55% 0.00% 0.00%AR(3)TARCH(0,1) 3.72% 0.00% 0.00% 1.58% 2.28% 4.70% 3.54% 0.00% 0.00% 3.29% 0.00% 0.00% 3.50% 0.00% 0.00%AR(4)TARCH(0,1) 3.72% 0.00% 0.00% 1.58% 2.28% 4.70% 3.54% 0.00% 0.00% 3.29% 0.00% 0.00% 3.50% 0.00% 0.00%AR(0)TARCH(0,2) 2.97% 0.00% 0.00% 1.64% 1.32% 2.80% 2.89% 0.00% 0.00% 2.85% 0.00% 0.00% 3.28% 0.00% 0.00%AR(1)TARCH(0,2) 3.08% 0.00% 0.00% 1.64% 1.32% 2.80% 2.89% 0.00% 0.00% 2.85% 0.00% 0.00% 3.07% 0.00% 0.00%AR(2)TARCH(0,2) 3.02% 0.00% 0.00% 1.64% 1.32% 2.80% 2.89% 0.00% 0.00% 2.85% 0.00% 0.00% 3.12% 0.00% 0.00%AR(3)TARCH(0,2) 3.13% 0.00% 0.00% 1.64% 1.32% 2.80% 2.89% 0.00% 0.00% 2.79% 0.00% 0.00% 3.28% 0.00% 0.00%AR(4)TARCH(0,2) 3.13% 0.00% 0.00% 1.64% 1.32% 2.80% 2.94% 0.00% 0.00% 2.79% 0.00% 0.00% 3.28% 0.00% 0.00%AR(0)TARCH(1,1) 1.94% 0.03% 0.14% 1.47% 6.27% 11.82% 1.63% 1.23% 2.60% 1.81% 0.18% 0.26% 1.40% 10.22% 17.93%AR(1)TARCH(1,1) 1.94% 0.03% 0.06% 1.47% 6.27% 11.82% 1.69% 0.69% 1.50% 1.75% 0.35% 0.43% 1.40% 10.22% 17.93%AR(2)TARCH(1,1) 1.89% 0.06% 0.26% 1.53% 3.85% 7.60% 1.63% 1.23% 2.60% 1.75% 0.35% 0.43% 1.40% 10.22% 17.93%AR(3)TARCH(1,1) 1.94% 0.03% 0.06% 1.47% 6.27% 11.82% 1.63% 1.23% 2.60% 1.81% 0.18% 0.26% 1.40% 10.22% 17.93%AR(4)TARCH(1,1) 1.89% 0.06% 0.26% 1.47% 6.27% 11.82% 1.63% 1.23% 2.60% 1.81% 0.18% 0.26% 1.40% 10.22% 17.93%AR(0)TARCH(1,2) 1.94% 0.03% 0.14% 1.53% 3.85% 7.60% 1.80% 0.20% 0.73% 1.75% 0.35% 0.43% 1.45% 6.56% 12.14%AR(1)TARCH(1,2) 2.00% 0.01% 0.03% 1.53% 3.85% 7.60% 1.80% 0.20% 0.73% 1.75% 0.35% 0.43% 1.51% 4.08% 7.91%AR(2)TARCH(1,2) 1.94% 0.03% 0.06% 1.53% 3.85% 7.60% 1.80% 0.20% 0.73% 1.81% 0.18% 0.26% 1.45% 6.56% 12.14%AR(3)TARCH(1,2) 2.05% 0.01% 0.00% 1.53% 3.85% 7.60% 1.80% 0.20% 0.73% 1.81% 0.18% 0.26% 1.51% 4.08% 7.91%AR(4)TARCH(1,2) 2.00% 0.01% 0.03% 1.58% 2.28% 4.70% 1.80% 0.20% 0.73% 1.81% 0.18% 0.26% 1.51% 4.08% 7.91%AR(0)TARCH(2,1) 1.78% 0.23% 0.53% 1.47% 6.27% 11.82% 1.63% 1.23% 2.60% 1.92% 0.05% 0.20% 1.40% 10.22% 17.93%AR(1)TARCH(2,1) 1.89% 0.06% 0.26% 1.47% 6.27% 11.82% 1.63% 1.23% 2.60% 1.81% 0.18% 0.68% 1.40% 10.22% 17.93%AR(2)TARCH(2,1) 1.78% 0.23% 0.84% 1.47% 6.27% 11.82% 1.63% 1.23% 2.60% 1.81% 0.18% 0.68% 1.40% 10.22% 17.93%AR(3)TARCH(2,1) 1.78% 0.23% 0.53% 1.47% 6.27% 11.82% 1.63% 1.23% 2.60% 1.81% 0.18% 0.68% 1.45% 6.56% 12.14%AR(4)TARCH(2,1) 2.00% 0.01% 0.03% 1.53% 3.85% 7.60% 1.69% 0.69% 2.14% 1.86% 0.09% 0.38% 1.40% 10.22% 17.93%AR(0)TARCH(2,2) 2.00% 0.01% 0.07% 1.53% 3.85% 7.60% 1.80% 0.20% 0.73% 1.64% 1.15% 3.28% 1.56% 2.46% 4.97%AR(1)TARCH(2,2) 1.94% 0.03% 0.14% 1.53% 3.85% 7.60% 1.85% 0.10% 0.41% 1.75% 0.35% 1.19% 1.51% 4.08% 7.91%AR(2)TARCH(2,2) 1.89% 0.06% 0.26% 1.47% 6.27% 11.82% 1.74% 0.38% 1.28% 1.75% 0.35% 0.78% 1.45% 6.56% 12.14%AR(3)TARCH(2,2) 1.89% 0.06% 0.26% 1.47% 6.27% 11.82% 1.74% 0.38% 1.28% 1.64% 1.15% 2.45% 1.51% 4.08% 7.91%AR(4)TARCH(2,2) 2.05% 0.01% 0.00% 1.53% 3.85% 7.60% 1.74% 0.38% 1.28% 1.64% 1.15% 3.28% 1.56% 2.46% 4.97%AR(0)EGARCH(0,1) 4.05% 0.00% 0.00% 1.47% 6.27% 11.82% 3.43% 0.00% 0.00% 3.40% 0.00% 0.00% 3.50% 0.00% 0.00%AR(1)EGARCH(0,1) 4.05% 0.00% 0.00% 1.47% 6.27% 11.82% 3.54% 0.00% 0.00% 3.40% 0.00% 0.00% 3.50% 0.00% 0.00%AR(2)EGARCH(0,1) 4.05% 0.00% 0.00% 1.47% 6.27% 11.82% 3.54% 0.00% 0.00% 3.40% 0.00% 0.00% 3.50% 0.00% 0.00%AR(3)EGARCH(0,1) 4.10% 0.00% 0.00% 1.47% 6.27% 11.82% 3.60% 0.00% 0.00% 3.40% 0.00% 0.00% 3.55% 0.00% 0.00%AR(4)EGARCH(0,1) 4.05% 0.00% 0.00% 1.64% 1.32% 2.80% 3.60% 0.00% 0.00% 3.40% 0.00% 0.00% 3.61% 0.00% 0.00%AR(0)EGARCH(0,2) 3.99% 0.00% 0.00% 1.75% 0.40% 0.89% 3.38% 0.00% 0.00% 3.01% 0.00% 0.00% 3.66% 0.00% 0.00%AR(1)EGARCH(0,2) 3.94% 0.00% 0.00% 1.75% 0.40% 0.89% 3.38% 0.00% 0.00% 3.01% 0.00% 0.00% 3.77% 0.00% 0.00%AR(2)EGARCH(0,2) 3.99% 0.00% 0.00% 1.75% 0.40% 0.89% 3.43% 0.00% 0.00% 3.01% 0.00% 0.00% 3.77% 0.00% 0.00%AR(3)EGARCH(0,2) 4.05% 0.00% 0.00% 1.75% 0.40% 0.89% 3.38% 0.00% 0.00% 3.01% 0.00% 0.00% 3.72% 0.00% 0.00%AR(4)EGARCH(0,2) 4.05% 0.00% 0.00% 1.75% 0.40% 0.89% 3.38% 0.00% 0.00% 3.07% 0.00% 0.00% 3.72% 0.00% 0.00%AR(0)EGARCH(1,1) 1.94% 0.03% 0.14% 1.36% 15.12% 25.30% 1.74% 0.38% 0.46% 1.86% 0.09% 0.15% 1.45% 6.56% 12.14%AR(1)EGARCH(1,1) 2.00% 0.01% 0.03% 1.36% 15.12% 25.30% 1.80% 0.20% 0.28% 1.92% 0.05% 0.09% 1.51% 4.08% 7.91%AR(2)EGARCH(1,1) 1.94% 0.03% 0.06% 1.36% 15.12% 25.30% 1.69% 0.69% 0.71% 1.92% 0.05% 0.09% 1.56% 2.46% 4.97%AR(3)EGARCH(1,1) 1.94% 0.03% 0.06% 1.36% 15.12% 25.30% 1.74% 0.38% 0.46% 1.81% 0.18% 0.26% 1.51% 4.08% 7.91%AR(4)EGARCH(1,1) 1.94% 0.03% 0.06% 1.36% 15.12% 25.30% 1.74% 0.38% 0.46% 1.86% 0.09% 0.15% 1.51% 4.08% 7.91%AR(0)EGARCH(1,2) 1.78% 0.23% 0.84% 1.36% 15.12% 25.30% 1.69% 0.69% 0.71% 2.03% 0.01% 0.03% 1.40% 10.22% 17.93%AR(1)EGARCH(1,2) 1.83% 0.12% 0.47% 1.36% 15.12% 25.30% 1.74% 0.38% 0.46% 1.86% 0.09% 0.15% 1.40% 10.22% 17.93%AR(2)EGARCH(1,2) 1.83% 0.12% 0.47% 1.36% 15.12% 25.30% 1.74% 0.38% 0.46% 1.92% 0.05% 0.09% 1.40% 10.22% 17.93%AR(3)EGARCH(1,2) 1.78% 0.23% 0.84% 1.36% 15.12% 25.30% 1.80% 0.20% 0.28% 1.81% 0.18% 0.26% 1.40% 10.22% 17.93%AR(4)EGARCH(1,2) 1.83% 0.12% 0.47% 1.41% 9.90% 17.66% 1.80% 0.20% 0.28% 1.81% 0.18% 0.26% 1.40% 10.22% 17.93%AR(0)EGARCH(2,1) 1.83% 0.12% 0.47% 1.25% 31.87% 45.51% 1.63% 1.23% 3.46% 2.03% 0.01% 0.01% 1.67% 0.82% 2.48%AR(1)EGARCH(2,1) 1.89% 0.06% 0.26% 1.36% 15.12% 25.30% 1.53% 3.56% 8.11% 2.03% 0.01% 0.01% 1.62% 1.44% 3.96%AR(2)EGARCH(2,1) 1.89% 0.06% 0.26% 1.30% 22.33% 34.71% 1.63% 1.23% 1.08% 2.03% 0.01% 0.01% 1.67% 0.82% 1.76%AR(3)EGARCH(2,1) 1.94% 0.03% 0.14% 1.41% 9.90% 17.66% 1.63% 1.23% 3.46% 1.92% 0.05% 0.09% 1.62% 1.44% 3.96%AR(4)EGARCH(2,1) 1.89% 0.06% 0.26% 1.36% 15.12% 25.30% 1.53% 3.56% 8.11% 2.03% 0.01% 0.01% 1.51% 4.08% 7.91%Note: The table reports for each model, sample size and equity index, the exception rate (t) and the p-values of unconditional (p_uc) and conditionalcoverage (p cc)
FTSE100Table (5.A). Normal Distribution, 2000 sample size, 99%-VaR
S&P500 NIKKEI225 DAX30 CAC40Models
Page 5 of 12

t p_uc p_cc t p_uc p_cc t p_uc p_cc t p_uc p_cc t p_uc p_ccAR(0)GARCH(0,1) 3.78% 0.00% 0.00% 1.53% 3.85% 7.60% 3.38% 0.00% 0.00% 3.29% 0.00% 0.00% 3.34% 0.00% 0.00%AR(1)GARCH(0,1) 3.78% 0.00% 0.00% 1.53% 3.85% 7.60% 3.27% 0.00% 0.00% 3.23% 0.00% 0.00% 3.55% 0.00% 0.00%AR(2)GARCH(0,1) 3.72% 0.00% 0.00% 1.58% 2.28% 4.70% 3.32% 0.00% 0.00% 3.23% 0.00% 0.00% 3.55% 0.00% 0.00%AR(3)GARCH(0,1) 3.67% 0.00% 0.00% 1.58% 2.28% 4.70% 3.38% 0.00% 0.00% 3.29% 0.00% 0.00% 3.55% 0.00% 0.00%AR(4)GARCH(0,1) 3.78% 0.00% 0.00% 1.58% 2.28% 4.70% 3.49% 0.00% 0.00% 3.29% 0.00% 0.00% 3.50% 0.00% 0.00%AR(0)GARCH(0,2) 3.18% 0.00% 0.00% 1.53% 3.85% 7.60% 3.11% 0.00% 0.00% 2.79% 0.00% 0.00% 3.12% 0.00% 0.00%AR(1)GARCH(0,2) 3.18% 0.00% 0.00% 1.58% 2.28% 4.70% 3.11% 0.00% 0.00% 2.79% 0.00% 0.00% 3.02% 0.00% 0.00%AR(2)GARCH(0,2) 3.18% 0.00% 0.00% 1.53% 3.85% 7.60% 3.11% 0.00% 0.00% 2.85% 0.00% 0.00% 3.12% 0.00% 0.00%AR(3)GARCH(0,2) 3.24% 0.00% 0.00% 1.53% 3.85% 7.60% 3.11% 0.00% 0.00% 2.85% 0.00% 0.00% 3.23% 0.00% 0.00%AR(4)GARCH(0,2) 3.18% 0.00% 0.00% 1.53% 3.85% 7.60% 3.11% 0.00% 0.00% 2.85% 0.00% 0.00% 3.28% 0.00% 0.00%AR(0)GARCH(1,1) 2.16% 0.00% 0.00% 1.47% 6.27% 11.82% 1.69% 0.69% 2.14% 1.59% 2.00% 5.14% 1.56% 2.46% 4.97%AR(1)GARCH(1,1) 2.10% 0.00% 0.00% 1.53% 3.85% 7.60% 1.63% 1.23% 3.46% 1.64% 1.15% 3.28% 1.56% 2.46% 4.97%AR(2)GARCH(1,1) 2.16% 0.00% 0.00% 1.58% 2.28% 4.70% 1.63% 1.23% 3.46% 1.70% 0.64% 2.01% 1.67% 0.82% 1.76%AR(3)GARCH(1,1) 2.21% 0.00% 0.00% 1.53% 3.85% 7.60% 1.63% 1.23% 3.46% 1.70% 0.64% 2.01% 1.56% 2.46% 4.97%AR(4)GARCH(1,1) 2.16% 0.00% 0.00% 1.53% 3.85% 7.60% 1.63% 1.23% 3.46% 1.64% 1.15% 3.28% 1.56% 2.46% 4.97%AR(0)GARCH(1,2) 2.16% 0.00% 0.00% 1.53% 3.85% 7.60% 1.58% 2.12% 4.35% 1.59% 2.00% 5.14% 1.67% 0.82% 2.48%AR(1)GARCH(1,2) 2.16% 0.00% 0.00% 1.58% 2.28% 4.70% 1.63% 1.23% 3.46% 1.64% 1.15% 3.28% 1.72% 0.45% 1.49%AR(2)GARCH(1,2) 2.27% 0.00% 0.00% 1.58% 2.28% 4.70% 1.63% 1.23% 3.46% 1.59% 2.00% 4.11% 1.62% 1.44% 3.96%AR(3)GARCH(1,2) 2.27% 0.00% 0.00% 1.58% 2.28% 4.70% 1.63% 1.23% 3.46% 1.64% 1.15% 3.28% 1.62% 1.44% 3.01%AR(4)GARCH(1,2) 2.27% 0.00% 0.00% 1.58% 2.28% 4.70% 1.63% 1.23% 3.46% 1.59% 2.00% 4.11% 1.56% 2.46% 4.97%AR(0)GARCH(2,1) 2.21% 0.00% 0.00% 1.53% 3.85% 7.60% 1.58% 2.12% 5.40% 1.59% 2.00% 5.14% 1.72% 0.45% 0.99%AR(1)GARCH(2,1) 2.10% 0.00% 0.00% 1.53% 3.85% 7.60% 1.58% 2.12% 5.40% 1.70% 0.64% 2.01% 1.56% 2.46% 4.97%AR(2)GARCH(2,1) 2.27% 0.00% 0.00% 1.58% 2.28% 4.70% 1.58% 2.12% 5.40% 1.64% 1.15% 3.28% 1.62% 1.44% 3.01%AR(3)GARCH(2,1) 2.32% 0.00% 0.00% 1.41% 9.90% 17.66% 1.58% 2.12% 5.40% 1.64% 1.15% 3.28% 1.72% 0.45% 0.99%AR(4)GARCH(2,1) 2.16% 0.00% 0.00% 1.58% 2.28% 4.70% 1.58% 2.12% 5.40% 1.75% 0.35% 1.19% 1.72% 0.45% 0.99%AR(0)GARCH(2,2) 2.32% 0.00% 0.00% 1.53% 3.85% 7.60% 1.80% 0.20% 0.73% 1.70% 0.64% 2.01% 1.62% 1.44% 3.96%AR(1)GARCH(2,2) 2.27% 0.00% 0.00% 1.53% 3.85% 7.60% 1.69% 0.69% 2.14% 1.64% 1.15% 3.28% 1.45% 6.56% 12.14%AR(2)GARCH(2,2) 2.27% 0.00% 0.00% 1.53% 3.85% 7.60% 1.63% 1.23% 3.46% 1.59% 2.00% 4.11% 1.62% 1.44% 3.01%AR(3)GARCH(2,2) 2.32% 0.00% 0.00% 1.53% 3.85% 7.60% 1.63% 1.23% 3.46% 1.64% 1.15% 3.28% 1.62% 1.44% 3.01%AR(4)GARCH(2,2) 2.27% 0.00% 0.00% 1.53% 3.85% 7.60% 1.63% 1.23% 3.46% 1.70% 0.64% 1.40% 1.56% 2.46% 4.97%AR(0)TARCH(0,1) 3.62% 0.00% 0.00% 1.53% 3.85% 7.60% 3.32% 0.00% 0.00% 3.29% 0.00% 0.00% 3.39% 0.00% 0.00%AR(1)TARCH(0,1) 3.56% 0.00% 0.00% 1.53% 3.85% 7.60% 3.38% 0.00% 0.00% 3.29% 0.00% 0.00% 3.39% 0.00% 0.00%AR(2)TARCH(0,1) 3.56% 0.00% 0.00% 1.53% 3.85% 7.60% 3.38% 0.00% 0.00% 3.29% 0.00% 0.00% 3.45% 0.00% 0.00%AR(3)TARCH(0,1) 3.56% 0.00% 0.00% 1.58% 2.28% 4.70% 3.38% 0.00% 0.00% 3.23% 0.00% 0.00% 3.50% 0.00% 0.00%AR(4)TARCH(0,1) 3.56% 0.00% 0.00% 1.58% 2.28% 4.70% 3.38% 0.00% 0.00% 3.29% 0.00% 0.00% 3.45% 0.00% 0.00%AR(0)TARCH(0,2) 3.13% 0.00% 0.00% 1.53% 3.85% 7.60% 2.94% 0.00% 0.00% 2.96% 0.00% 0.00% 3.18% 0.00% 0.00%AR(1)TARCH(0,2) 3.13% 0.00% 0.00% 1.53% 3.85% 7.60% 3.00% 0.00% 0.00% 2.96% 0.00% 0.00% 3.02% 0.00% 0.00%AR(2)TARCH(0,2) 3.18% 0.00% 0.00% 1.53% 3.85% 7.60% 3.00% 0.00% 0.00% 2.90% 0.00% 0.00% 3.12% 0.00% 0.00%AR(3)TARCH(0,2) 3.18% 0.00% 0.00% 1.53% 3.85% 7.60% 3.00% 0.00% 0.00% 2.79% 0.00% 0.00% 3.23% 0.00% 0.00%AR(4)TARCH(0,2) 3.18% 0.00% 0.00% 1.58% 2.28% 4.70% 3.00% 0.00% 0.00% 2.85% 0.00% 0.00% 3.18% 0.00% 0.00%AR(0)TARCH(1,1) 2.00% 0.01% 0.07% 1.41% 9.90% 17.66% 1.74% 0.38% 0.84% 1.70% 0.64% 1.40% 1.45% 6.56% 12.14%AR(1)TARCH(1,1) 2.10% 0.00% 0.01% 1.41% 9.90% 17.66% 1.74% 0.38% 0.84% 1.81% 0.18% 0.42% 1.40% 10.22% 17.93%AR(2)TARCH(1,1) 2.00% 0.01% 0.07% 1.41% 9.90% 17.66% 1.69% 0.69% 1.50% 1.75% 0.35% 0.78% 1.40% 10.22% 17.93%AR(3)TARCH(1,1) 2.00% 0.01% 0.07% 1.41% 9.90% 17.66% 1.69% 0.69% 1.50% 1.81% 0.18% 0.68% 1.40% 10.22% 17.93%AR(4)TARCH(1,1) 2.00% 0.01% 0.07% 1.41% 9.90% 17.66% 1.69% 0.69% 1.50% 1.75% 0.35% 1.19% 1.40% 10.22% 17.93%AR(0)TARCH(1,2) 2.05% 0.01% 0.02% 1.36% 15.12% 25.30% 1.63% 1.23% 2.60% 1.70% 0.64% 2.01% 1.45% 6.56% 12.14%AR(1)TARCH(1,2) 2.10% 0.00% 0.01% 1.36% 15.12% 25.30% 1.63% 1.23% 2.60% 1.70% 0.64% 2.01% 1.51% 4.08% 7.91%AR(2)TARCH(1,2) 2.10% 0.00% 0.01% 1.36% 15.12% 25.30% 1.69% 0.69% 1.50% 1.70% 0.64% 2.01% 1.56% 2.46% 6.10%AR(3)TARCH(1,2) 2.16% 0.00% 0.00% 1.36% 15.12% 25.30% 1.63% 1.23% 2.60% 1.75% 0.35% 1.19% 1.51% 4.08% 7.91%AR(4)TARCH(1,2) 2.10% 0.00% 0.01% 1.41% 9.90% 17.66% 1.63% 1.23% 2.60% 1.97% 0.02% 0.05% 1.51% 4.08% 7.91%AR(0)TARCH(2,1) 2.10% 0.00% 0.02% 1.41% 9.90% 17.66% 1.69% 0.69% 1.50% 1.81% 0.18% 0.68% 1.45% 6.56% 12.14%AR(1)TARCH(2,1) 2.05% 0.01% 0.03% 1.47% 6.27% 11.82% 1.63% 1.23% 2.60% 1.81% 0.18% 0.68% 1.40% 10.22% 17.93%AR(2)TARCH(2,1) 2.00% 0.01% 0.07% 1.41% 9.90% 17.66% 1.74% 0.38% 1.28% 1.75% 0.35% 1.19% 1.40% 10.22% 17.93%AR(3)TARCH(2,1) 2.05% 0.01% 0.02% 1.41% 9.90% 17.66% 1.74% 0.38% 1.28% 1.81% 0.18% 0.68% 1.40% 10.22% 17.93%AR(4)TARCH(2,1) 2.05% 0.01% 0.02% 1.41% 9.90% 17.66% 1.74% 0.38% 1.28% 1.75% 0.35% 1.19% 1.40% 10.22% 17.93%AR(0)TARCH(2,2) 2.10% 0.00% 0.01% 1.36% 15.12% 25.30% 1.63% 1.23% 2.60% 1.64% 1.15% 2.45% 1.45% 6.56% 12.14%AR(1)TARCH(2,2) 2.10% 0.00% 0.01% 1.36% 15.12% 25.30% 1.69% 0.69% 1.50% 1.75% 0.35% 0.43% 1.45% 6.56% 12.14%AR(2)TARCH(2,2) 2.05% 0.01% 0.02% 1.41% 9.90% 17.66% 1.69% 0.69% 1.50% 1.75% 0.35% 0.78% 1.45% 6.56% 12.14%AR(3)TARCH(2,2) 2.05% 0.01% 0.02% 1.36% 15.12% 25.30% 1.69% 0.69% 2.14% 1.64% 1.15% 2.45% 1.45% 6.56% 12.14%AR(4)TARCH(2,2) 2.00% 0.01% 0.03% 1.41% 9.90% 17.66% 1.63% 1.23% 3.46% 1.75% 0.35% 1.19% 1.51% 4.08% 7.91%AR(0)EGARCH(0,1) 3.62% 0.00% 0.00% 1.47% 6.27% 12.19% 3.54% 0.00% 0.00% 3.18% 0.00% 0.00% 3.55% 0.00% 0.00%AR(1)EGARCH(0,1) 3.72% 0.00% 0.00% 1.47% 6.27% 12.19% 3.54% 0.00% 0.00% 3.23% 0.00% 0.00% 3.61% 0.00% 0.00%AR(2)EGARCH(0,1) 3.72% 0.00% 0.00% 1.53% 3.85% 8.47% 3.54% 0.00% 0.00% 3.18% 0.00% 0.00% 3.66% 0.00% 0.00%AR(3)EGARCH(0,1) 3.78% 0.00% 0.00% 1.47% 6.27% 11.82% 3.60% 0.00% 0.00% 3.18% 0.00% 0.00% 3.66% 0.00% 0.00%AR(4)EGARCH(0,1) 3.78% 0.00% 0.00% 1.47% 6.27% 12.19% 3.54% 0.00% 0.00% 3.18% 0.00% 0.00% 3.66% 0.00% 0.00%AR(0)EGARCH(0,2) 4.05% 0.00% 0.00% 1.81% 0.21% 0.48% 3.38% 0.00% 0.00% 3.01% 0.00% 0.00% 3.61% 0.00% 0.00%AR(1)EGARCH(0,2) 4.10% 0.00% 0.00% 1.75% 0.40% 0.89% 3.38% 0.00% 0.00% 3.01% 0.00% 0.00% 3.55% 0.00% 0.00%AR(2)EGARCH(0,2) 4.05% 0.00% 0.00% 1.87% 0.11% 0.25% 3.43% 0.00% 0.00% 3.01% 0.00% 0.00% 3.72% 0.00% 0.00%AR(3)EGARCH(0,2) 4.10% 0.00% 0.00% 1.87% 0.11% 0.25% 3.38% 0.00% 0.00% 2.96% 0.00% 0.00% 3.55% 0.00% 0.00%AR(4)EGARCH(0,2) 3.99% 0.00% 0.00% 1.87% 0.11% 0.25% 3.38% 0.00% 0.00% 2.96% 0.00% 0.00% 3.61% 0.00% 0.00%AR(0)EGARCH(1,1) 2.16% 0.00% 0.00% 1.25% 31.87% 45.51% 1.80% 0.20% 0.73% 1.75% 0.35% 1.19% 1.51% 4.08% 7.91%AR(1)EGARCH(1,1) 2.21% 0.00% 0.00% 1.25% 31.87% 45.51% 1.80% 0.20% 0.73% 1.86% 0.09% 0.15% 1.56% 2.46% 4.97%AR(2)EGARCH(1,1) 2.16% 0.00% 0.00% 1.25% 31.87% 45.51% 1.80% 0.20% 0.73% 1.97% 0.02% 0.05% 1.51% 4.08% 7.91%AR(3)EGARCH(1,1) 2.05% 0.01% 0.02% 1.25% 31.87% 45.51% 1.80% 0.20% 0.73% 1.92% 0.05% 0.09% 1.56% 2.46% 4.97%AR(4)EGARCH(1,1) 2.16% 0.00% 0.00% 1.30% 22.33% 34.71% 1.74% 0.38% 1.28% 1.86% 0.09% 0.15% 1.51% 4.08% 7.91%AR(0)EGARCH(1,2) 1.89% 0.06% 0.11% 1.30% 22.33% 34.71% 1.74% 0.38% 1.28% 1.81% 0.18% 0.68% 1.62% 1.44% 3.01%AR(1)EGARCH(1,2) 2.00% 0.01% 0.03% 1.30% 22.33% 34.71% 1.74% 0.38% 1.28% 1.75% 0.35% 1.19% 1.62% 1.44% 3.01%AR(2)EGARCH(1,2) 1.89% 0.06% 0.11% 1.30% 22.33% 34.71% 1.74% 0.38% 1.28% 1.81% 0.18% 0.68% 1.51% 4.08% 7.91%AR(3)EGARCH(1,2) 1.94% 0.03% 0.06% 1.30% 22.33% 34.71% 1.80% 0.20% 0.73% 1.81% 0.18% 0.68% 1.51% 4.08% 7.91%AR(4)EGARCH(1,2) 2.00% 0.01% 0.03% 1.25% 31.87% 45.51% 1.74% 0.38% 1.28% 1.75% 0.35% 1.19% 1.51% 4.08% 7.91%AR(0)EGARCH(2,1) 2.00% 0.01% 0.07% 1.36% 15.12% 25.30% 1.74% 0.38% 1.28% 1.81% 0.18% 0.68% 1.67% 0.82% 1.76%AR(1)EGARCH(2,1) 2.00% 0.01% 0.07% 1.30% 22.33% 34.71% 1.74% 0.38% 1.28% 1.86% 0.09% 0.15% 1.62% 1.44% 3.01%AR(2)EGARCH(2,1) 2.05% 0.01% 0.03% 1.36% 15.12% 25.30% 1.69% 0.69% 2.14% 1.81% 0.18% 0.68% 1.62% 1.44% 3.01%AR(3)EGARCH(2,1) 2.10% 0.00% 0.01% 1.36% 15.12% 25.30% 1.69% 0.69% 2.14% 1.86% 0.09% 0.15% 1.62% 1.44% 3.01%AR(4)EGARCH(2,1) 2.00% 0.01% 0.07% 1.30% 22.33% 34.71% 1.74% 0.38% 1.28% 1.81% 0.18% 0.68% 1.56% 2.46% 4.97%Note: The table reports for each model, sample size and equity index, the exception rate (t) and the p-values of unconditional (p_uc) and conditionalcoverage (p cc)
FTSE100Table (6.A). Normal Distribution, 1500 sample size, 99%-VaR
S&P500 NIKKEI225 DAX30 CAC40Models
Page 6 of 12

t p_uc p_cc t p_uc p_cc t p_uc p_cc t p_uc p_cc t p_uc p_ccAR(0)GARCH(0,1) 3.18% 0.00% 0.00% 1.58% 2.28% 5.65% 3.27% 0.00% 0.00% 3.23% 0.00% 0.00% 3.02% 0.00% 0.00%AR(1)GARCH(0,1) 3.13% 0.00% 0.00% 1.58% 2.28% 5.65% 3.27% 0.00% 0.00% 3.23% 0.00% 0.00% 2.96% 0.00% 0.00%AR(2)GARCH(0,1) 3.18% 0.00% 0.00% 1.53% 3.85% 8.47% 3.32% 0.00% 0.00% 3.23% 0.00% 0.00% 3.02% 0.00% 0.00%AR(3)GARCH(0,1) 3.18% 0.00% 0.00% 1.53% 3.85% 8.47% 3.32% 0.00% 0.00% 3.23% 0.00% 0.00% 3.12% 0.00% 0.00%AR(4)GARCH(0,1) 3.13% 0.00% 0.00% 1.53% 3.85% 8.47% 3.27% 0.00% 0.00% 3.29% 0.00% 0.00% 3.18% 0.00% 0.00%AR(0)GARCH(0,2) 3.08% 0.00% 0.00% 1.47% 6.27% 11.82% 2.89% 0.00% 0.00% 2.63% 0.00% 0.00% 2.69% 0.00% 0.00%AR(1)GARCH(0,2) 3.08% 0.00% 0.00% 1.58% 2.28% 4.70% 2.89% 0.00% 0.00% 2.63% 0.00% 0.00% 2.53% 0.00% 0.00%AR(2)GARCH(0,2) 3.13% 0.00% 0.00% 1.47% 6.27% 11.82% 2.94% 0.00% 0.00% 2.57% 0.00% 0.00% 2.64% 0.00% 0.00%AR(3)GARCH(0,2) 3.13% 0.00% 0.00% 1.47% 6.27% 11.82% 2.83% 0.00% 0.00% 2.63% 0.00% 0.00% 2.69% 0.00% 0.00%AR(4)GARCH(0,2) 3.13% 0.00% 0.00% 1.47% 6.27% 11.82% 3.00% 0.00% 0.00% 2.63% 0.00% 0.00% 2.80% 0.00% 0.00%AR(0)GARCH(1,1) 2.05% 0.01% 0.00% 1.64% 1.32% 3.62% 1.80% 0.20% 0.73% 1.81% 0.18% 0.42% 1.51% 4.08% 7.91%AR(1)GARCH(1,1) 2.10% 0.00% 0.00% 1.64% 1.32% 3.62% 1.74% 0.38% 1.28% 1.75% 0.35% 1.19% 1.51% 4.08% 7.91%AR(2)GARCH(1,1) 2.16% 0.00% 0.00% 1.64% 1.32% 3.62% 1.69% 0.69% 2.14% 1.64% 1.15% 2.45% 1.51% 4.08% 7.91%AR(3)GARCH(1,1) 2.16% 0.00% 0.00% 1.70% 0.73% 2.23% 1.69% 0.69% 2.14% 1.64% 1.15% 2.45% 1.56% 2.46% 4.97%AR(4)GARCH(1,1) 2.05% 0.01% 0.02% 1.70% 0.73% 2.23% 1.69% 0.69% 2.14% 1.64% 1.15% 2.45% 1.62% 1.44% 3.01%AR(0)GARCH(1,2) 2.10% 0.00% 0.00% 1.58% 2.28% 5.65% 1.63% 1.23% 2.60% 1.70% 0.64% 1.40% 1.56% 2.46% 4.97%AR(1)GARCH(1,2) 2.10% 0.00% 0.00% 1.64% 1.32% 3.62% 1.63% 1.23% 2.60% 1.59% 2.00% 4.11% 1.45% 6.56% 12.14%AR(2)GARCH(1,2) 2.10% 0.00% 0.00% 1.64% 1.32% 3.62% 1.63% 1.23% 2.60% 1.70% 0.64% 1.40% 1.56% 2.46% 4.97%AR(3)GARCH(1,2) 2.10% 0.00% 0.00% 1.64% 1.32% 3.62% 1.74% 0.38% 1.28% 1.64% 1.15% 2.45% 1.51% 4.08% 7.91%AR(4)GARCH(1,2) 2.16% 0.00% 0.00% 1.64% 1.32% 3.62% 1.69% 0.69% 1.50% 1.70% 0.64% 1.40% 1.62% 1.44% 3.01%AR(0)GARCH(2,1) 2.05% 0.01% 0.00% 1.58% 2.28% 4.70% 1.69% 0.69% 2.14% 1.81% 0.18% 0.68% 1.51% 4.08% 7.91%AR(1)GARCH(2,1) 2.10% 0.00% 0.00% 1.64% 1.32% 3.62% 1.63% 1.23% 3.46% 1.75% 0.35% 0.78% 1.56% 2.46% 4.97%AR(2)GARCH(2,1) 2.05% 0.01% 0.00% 1.58% 2.28% 5.65% 1.63% 1.23% 3.46% 1.81% 0.18% 0.42% 1.51% 4.08% 7.91%AR(3)GARCH(2,1) 2.10% 0.00% 0.00% 1.58% 2.28% 5.65% 1.69% 0.69% 2.14% 1.64% 1.15% 2.45% 1.56% 2.46% 4.97%AR(4)GARCH(2,1) 2.10% 0.00% 0.00% 1.64% 1.32% 3.62% 1.63% 1.23% 3.46% 1.86% 0.09% 0.22% 1.51% 4.08% 7.91%AR(0)GARCH(2,2) 2.21% 0.00% 0.00% 1.58% 2.28% 5.65% 1.69% 0.69% 1.50% 1.70% 0.64% 1.40% 1.51% 4.08% 7.91%AR(1)GARCH(2,2) 2.21% 0.00% 0.00% 1.64% 1.32% 3.62% 1.69% 0.69% 1.50% 1.70% 0.64% 1.40% 1.45% 6.56% 12.14%AR(2)GARCH(2,2) 2.21% 0.00% 0.00% 1.53% 3.85% 8.47% 1.63% 1.23% 2.60% 1.59% 2.00% 4.11% 1.51% 4.08% 7.91%AR(3)GARCH(2,2) 2.27% 0.00% 0.00% 1.47% 6.27% 12.19% 1.69% 0.69% 1.50% 1.64% 1.15% 2.45% 1.56% 2.46% 4.97%AR(4)GARCH(2,2) 2.27% 0.00% 0.00% 1.58% 2.28% 5.65% 1.63% 1.23% 2.60% 1.75% 0.35% 0.78% 1.51% 4.08% 7.91%AR(0)TARCH(0,1) 3.18% 0.00% 0.00% 1.58% 2.28% 5.65% 3.05% 0.00% 0.00% 3.29% 0.00% 0.00% 3.07% 0.00% 0.00%AR(1)TARCH(0,1) 3.08% 0.00% 0.00% 1.58% 2.28% 4.70% 3.05% 0.00% 0.00% 3.07% 0.00% 0.00% 3.07% 0.00% 0.00%AR(2)TARCH(0,1) 3.08% 0.00% 0.00% 1.53% 3.85% 7.60% 3.16% 0.00% 0.00% 3.07% 0.00% 0.00% 3.12% 0.00% 0.00%AR(3)TARCH(0,1) 3.02% 0.00% 0.00% 1.53% 3.85% 7.60% 3.16% 0.00% 0.00% 3.12% 0.00% 0.00% 3.07% 0.00% 0.00%AR(4)TARCH(0,1) 3.02% 0.00% 0.00% 1.64% 1.32% 3.62% 3.16% 0.00% 0.00% 3.01% 0.00% 0.00% 3.07% 0.00% 0.00%AR(0)TARCH(0,2) 2.91% 0.00% 0.00% 1.47% 6.27% 11.82% 2.62% 0.00% 0.00% 2.79% 0.00% 0.00% 2.58% 0.00% 0.00%AR(1)TARCH(0,2) 2.97% 0.00% 0.00% 1.41% 9.90% 17.66% 2.62% 0.00% 0.00% 2.74% 0.00% 0.00% 2.58% 0.00% 0.00%AR(2)TARCH(0,2) 2.86% 0.00% 0.00% 1.41% 9.90% 17.66% 2.67% 0.00% 0.00% 2.74% 0.00% 0.00% 2.69% 0.00% 0.00%AR(3)TARCH(0,2) 3.13% 0.00% 0.00% 1.41% 9.90% 17.66% 2.67% 0.00% 0.00% 2.63% 0.00% 0.00% 2.69% 0.00% 0.00%AR(4)TARCH(0,2) 3.13% 0.00% 0.00% 1.41% 9.90% 17.66% 2.67% 0.00% 0.00% 2.68% 0.00% 0.00% 2.75% 0.00% 0.00%AR(0)TARCH(1,1) 2.05% 0.01% 0.03% 1.58% 2.28% 4.70% 1.69% 0.69% 1.50% 1.81% 0.18% 0.42% 1.40% 10.22% 17.93%AR(1)TARCH(1,1) 2.00% 0.01% 0.07% 1.53% 3.85% 7.60% 1.69% 0.69% 1.50% 1.81% 0.18% 0.42% 1.45% 6.56% 12.14%AR(2)TARCH(1,1) 2.00% 0.01% 0.07% 1.53% 3.85% 7.60% 1.69% 0.69% 1.50% 1.81% 0.18% 0.42% 1.51% 4.08% 7.91%AR(3)TARCH(1,1) 1.94% 0.03% 0.14% 1.47% 6.27% 11.82% 1.69% 0.69% 1.50% 1.75% 0.35% 0.78% 1.51% 4.08% 7.91%AR(4)TARCH(1,1) 1.94% 0.03% 0.14% 1.53% 3.85% 7.60% 1.69% 0.69% 1.50% 1.86% 0.09% 0.22% 1.51% 4.08% 7.91%AR(0)TARCH(1,2) 1.83% 0.12% 0.19% 1.53% 3.85% 7.60% 1.63% 1.23% 2.60% 1.86% 0.09% 0.22% 1.40% 10.22% 17.93%AR(1)TARCH(1,2) 2.00% 0.01% 0.03% 1.47% 6.27% 11.82% 1.63% 1.23% 2.60% 1.86% 0.09% 0.22% 1.51% 4.08% 7.91%AR(2)TARCH(1,2) 1.94% 0.03% 0.06% 1.41% 9.90% 17.66% 1.69% 0.69% 1.50% 1.81% 0.18% 0.42% 1.56% 2.46% 4.97%AR(3)TARCH(1,2) 1.94% 0.03% 0.06% 1.47% 6.27% 11.82% 1.63% 1.23% 2.60% 1.70% 0.64% 1.40% 1.56% 2.46% 4.97%AR(4)TARCH(1,2) 1.94% 0.03% 0.06% 1.41% 9.90% 17.66% 1.69% 0.69% 1.50% 1.81% 0.18% 0.42% 1.56% 2.46% 4.97%AR(0)TARCH(2,1) 2.00% 0.01% 0.07% 1.58% 2.28% 4.70% 1.69% 0.69% 1.50% 1.75% 0.35% 0.78% 1.35% 15.43% 25.43%AR(1)TARCH(2,1) 1.94% 0.03% 0.14% 1.53% 3.85% 7.60% 1.74% 0.38% 1.28% 1.92% 0.05% 0.11% 1.45% 6.56% 12.14%AR(2)TARCH(2,1) 2.00% 0.01% 0.07% 1.58% 2.28% 4.70% 1.63% 1.23% 2.60% 1.86% 0.09% 0.22% 1.56% 2.46% 4.97%AR(3)TARCH(2,1) 1.94% 0.03% 0.14% 1.58% 2.28% 4.70% 1.63% 1.23% 2.60% 2.03% 0.01% 0.05% 1.56% 2.46% 4.97%AR(4)TARCH(2,1) 2.00% 0.01% 0.07% 1.53% 3.85% 7.60% 1.74% 0.38% 1.28% 1.86% 0.09% 0.22% 1.62% 1.44% 3.01%AR(0)TARCH(2,2) 2.05% 0.01% 0.02% 1.41% 9.90% 17.66% 1.63% 1.23% 2.60% 1.81% 0.18% 0.42% 1.51% 4.08% 7.91%AR(1)TARCH(2,2) 2.00% 0.01% 0.03% 1.41% 9.90% 17.66% 1.58% 2.12% 4.35% 1.86% 0.09% 0.22% 1.51% 4.08% 7.91%AR(2)TARCH(2,2) 2.00% 0.01% 0.03% 1.47% 6.27% 11.82% 1.63% 1.23% 2.60% 1.70% 0.64% 1.40% 1.56% 2.46% 4.97%AR(3)TARCH(2,2) 2.05% 0.01% 0.02% 1.41% 9.90% 17.66% 1.63% 1.23% 2.60% 1.92% 0.05% 0.20% 1.56% 2.46% 4.97%AR(4)TARCH(2,2) 2.10% 0.00% 0.01% 1.41% 9.90% 17.66% 1.63% 1.23% 2.60% 1.64% 1.15% 2.45% 1.45% 6.56% 12.14%AR(0)EGARCH(0,1) 3.02% 0.00% 0.00% 1.53% 3.85% 8.47% 3.00% 0.00% 0.00% 3.01% 0.00% 0.00% 3.02% 0.00% 0.00%AR(1)EGARCH(0,1) 3.08% 0.00% 0.00% 1.47% 6.27% 12.19% 3.00% 0.00% 0.00% 3.07% 0.00% 0.00% 3.02% 0.00% 0.00%AR(2)EGARCH(0,1) 3.08% 0.00% 0.00% 1.41% 9.90% 16.79% 3.05% 0.00% 0.00% 3.07% 0.00% 0.00% 3.07% 0.00% 0.00%AR(3)EGARCH(0,1) 3.02% 0.00% 0.00% 1.41% 9.90% 16.79% 3.05% 0.00% 0.00% 3.07% 0.00% 0.00% 3.23% 0.00% 0.00%AR(4)EGARCH(0,1) 3.02% 0.00% 0.00% 1.41% 9.90% 16.79% 3.05% 0.00% 0.00% 3.07% 0.00% 0.00% 3.28% 0.00% 0.00%AR(0)EGARCH(0,2) 3.62% 0.00% 0.00% 1.64% 1.32% 2.80% 3.05% 0.00% 0.00% 2.85% 0.00% 0.00% 3.23% 0.00% 0.00%AR(1)EGARCH(0,2) 3.62% 0.00% 0.00% 1.64% 1.32% 2.80% 2.94% 0.00% 0.00% 2.74% 0.00% 0.00% 3.23% 0.00% 0.00%AR(2)EGARCH(0,2) 3.67% 0.00% 0.00% 1.64% 1.32% 2.80% 3.00% 0.00% 0.00% 2.74% 0.00% 0.00% 3.34% 0.00% 0.00%AR(3)EGARCH(0,2) 3.62% 0.00% 0.00% 1.58% 2.28% 4.70% 3.00% 0.00% 0.00% 2.85% 0.00% 0.00% 3.28% 0.00% 0.00%AR(4)EGARCH(0,2) 3.72% 0.00% 0.00% 1.64% 1.32% 2.80% 2.94% 0.00% 0.00% 2.85% 0.00% 0.00% 3.34% 0.00% 0.00%AR(0)EGARCH(1,1) 2.10% 0.00% 0.01% 1.36% 15.12% 25.30% 1.69% 0.69% 2.14% 1.86% 0.09% 0.15% 1.29% 22.56% 34.59%AR(1)EGARCH(1,1) 1.94% 0.03% 0.14% 1.30% 22.33% 34.71% 1.69% 0.69% 2.14% 1.86% 0.09% 0.15% 1.40% 10.22% 17.93%AR(2)EGARCH(1,1) 1.89% 0.06% 0.26% 1.30% 22.33% 34.71% 1.69% 0.69% 2.14% 1.81% 0.18% 0.26% 1.35% 15.43% 25.43%AR(3)EGARCH(1,1) 1.89% 0.06% 0.26% 1.30% 22.33% 34.71% 1.74% 0.38% 1.28% 1.92% 0.05% 0.09% 1.35% 15.43% 25.43%AR(4)EGARCH(1,1) 1.94% 0.03% 0.14% 1.36% 15.12% 25.30% 1.80% 0.20% 0.73% 1.92% 0.05% 0.02% 1.40% 10.22% 17.93%AR(0)EGARCH(1,2) 1.62% 1.40% 1.19% 1.41% 9.90% 17.66% 1.74% 0.38% 1.28% 1.53% 3.37% 6.67% 1.40% 10.22% 17.93%AR(1)EGARCH(1,2) 1.62% 1.40% 1.19% 1.53% 3.85% 7.60% 1.69% 0.69% 2.14% 1.48% 5.50% 10.42% 1.29% 22.56% 34.59%AR(2)EGARCH(1,2) 1.62% 1.40% 1.19% 1.53% 3.85% 7.60% 1.69% 0.69% 2.14% 1.53% 3.37% 6.67% 1.40% 10.22% 17.93%AR(3)EGARCH(1,2) 1.67% 0.79% 0.80% 1.58% 2.28% 4.70% 1.80% 0.20% 0.73% 1.53% 3.37% 6.67% 1.40% 10.22% 17.93%AR(4)EGARCH(1,2) 1.73% 0.44% 0.51% 1.53% 3.85% 7.60% 1.80% 0.20% 0.73% 1.53% 3.37% 6.67% 1.40% 10.22% 17.93%AR(0)EGARCH(2,1) 2.05% 0.01% 0.03% 1.47% 6.27% 11.82% 1.63% 1.23% 3.46% 1.92% 0.05% 0.20% 1.51% 4.08% 7.91%AR(1)EGARCH(2,1) 1.89% 0.06% 0.14% 1.47% 6.27% 11.82% 1.69% 0.69% 2.14% 1.86% 0.09% 0.38% 1.40% 10.22% 17.93%AR(2)EGARCH(2,1) 1.89% 0.06% 0.26% 1.53% 3.85% 7.60% 1.69% 0.69% 2.14% 1.92% 0.05% 0.20% 1.51% 4.08% 9.03%AR(3)EGARCH(2,1) 1.83% 0.12% 0.28% 1.53% 3.85% 7.60% 1.80% 0.20% 0.73% 1.81% 0.18% 0.68% 1.45% 6.56% 12.86%AR(4)EGARCH(2,1) 1.89% 0.06% 0.14% 1.53% 3.85% 7.60% 1.74% 0.38% 1.28% 1.81% 0.18% 0.68% 1.45% 6.56% 12.86%Note: The table reports for each model, sample size and equity index, the exception rate (t) and the p-values of unconditional (p_uc) and conditionalcoverage (p cc)
FTSE100Table (7.A). Normal Distribution, 1000 sample size, 99%-VaR
S&P500 NIKKEI225 DAX30 CAC40Models
Page 7 of 12

t p_uc p_cc t p_uc p_cc t p_uc p_cc t p_uc p_cc t p_uc p_ccAR(0)GARCH(0,1) 2.27% 0.00% 0.00% 1.58% 2.28% 5.65% 2.67% 0.00% 0.00% 2.52% 0.00% 0.00% 2.58% 0.00% 0.00%AR(1)GARCH(0,1) 2.32% 0.00% 0.00% 1.64% 1.32% 3.62% 2.67% 0.00% 0.00% 2.57% 0.00% 0.00% 2.64% 0.00% 0.00%AR(2)GARCH(0,1) 2.43% 0.00% 0.00% 1.70% 0.73% 0.72% 2.72% 0.00% 0.00% 2.57% 0.00% 0.00% 2.75% 0.00% 0.00%AR(3)GARCH(0,1) 2.43% 0.00% 0.00% 1.75% 0.40% 0.46% 2.72% 0.00% 0.00% 2.46% 0.00% 0.00% 2.80% 0.00% 0.00%AR(4)GARCH(0,1) 2.48% 0.00% 0.00% 1.70% 0.73% 2.23% 2.72% 0.00% 0.00% 2.46% 0.00% 0.00% 2.75% 0.00% 0.00%AR(0)GARCH(0,2) 2.37% 0.00% 0.00% 1.53% 3.85% 8.47% 2.34% 0.00% 0.00% 2.52% 0.00% 0.00% 2.26% 0.00% 0.00%AR(1)GARCH(0,2) 2.43% 0.00% 0.00% 1.53% 3.85% 8.47% 2.34% 0.00% 0.00% 2.35% 0.00% 0.00% 2.37% 0.00% 0.00%AR(2)GARCH(0,2) 2.37% 0.00% 0.00% 1.58% 2.28% 5.65% 2.45% 0.00% 0.00% 2.46% 0.00% 0.00% 2.42% 0.00% 0.00%AR(3)GARCH(0,2) 2.37% 0.00% 0.00% 1.64% 1.32% 3.62% 2.45% 0.00% 0.00% 2.52% 0.00% 0.00% 2.42% 0.00% 0.00%AR(4)GARCH(0,2) 2.37% 0.00% 0.00% 1.64% 1.32% 3.62% 2.45% 0.00% 0.00% 2.52% 0.00% 0.00% 2.42% 0.00% 0.00%AR(0)GARCH(1,1) 1.94% 0.03% 0.06% 1.41% 9.90% 17.66% 1.63% 1.23% 2.60% 1.70% 0.64% 1.40% 1.51% 4.08% 7.91%AR(1)GARCH(1,1) 1.94% 0.03% 0.06% 1.47% 6.27% 11.82% 1.53% 3.56% 7.01% 1.64% 1.15% 2.45% 1.62% 1.44% 3.01%AR(2)GARCH(1,1) 1.94% 0.03% 0.06% 1.58% 2.28% 4.70% 1.47% 5.79% 10.90% 1.59% 2.00% 4.11% 1.62% 1.44% 3.01%AR(3)GARCH(1,1) 2.05% 0.01% 0.02% 1.58% 2.28% 4.70% 1.36% 13.92% 23.40% 1.59% 2.00% 4.11% 1.62% 1.44% 3.01%AR(4)GARCH(1,1) 2.00% 0.01% 0.03% 1.47% 6.27% 11.82% 1.36% 13.92% 23.40% 1.59% 2.00% 4.11% 1.62% 1.44% 3.01%AR(0)GARCH(1,2) 2.10% 0.00% 0.01% 1.70% 0.73% 2.23% 1.74% 0.38% 0.84% 1.70% 0.64% 2.01% 1.56% 2.46% 4.97%AR(1)GARCH(1,2) 2.10% 0.00% 0.01% 1.70% 0.73% 2.23% 1.69% 0.69% 1.50% 1.53% 3.37% 7.75% 1.56% 2.46% 4.97%AR(2)GARCH(1,2) 2.10% 0.00% 0.01% 1.70% 0.73% 2.23% 1.53% 3.56% 7.01% 1.42% 8.70% 15.60% 1.88% 0.06% 0.15%AR(3)GARCH(1,2) 2.16% 0.00% 0.00% 1.64% 1.32% 3.62% 1.58% 2.12% 4.35% 1.59% 2.00% 5.14% 1.72% 0.45% 0.99%AR(4)GARCH(1,2) 2.10% 0.00% 0.01% 1.64% 1.32% 3.62% 1.63% 1.23% 2.60% 1.59% 2.00% 5.14% 1.72% 0.45% 0.99%AR(0)GARCH(2,1) 2.05% 0.01% 0.02% 1.64% 1.32% 3.62% 1.74% 0.38% 0.84% 1.70% 0.64% 1.40% 1.62% 1.44% 3.01%AR(1)GARCH(2,1) 2.05% 0.01% 0.02% 1.58% 2.28% 5.65% 1.53% 3.56% 7.01% 1.64% 1.15% 3.28% 1.51% 4.08% 7.91%AR(2)GARCH(2,1) 2.05% 0.01% 0.02% 1.64% 1.32% 3.62% 1.53% 3.56% 7.01% 1.81% 0.18% 0.68% 1.62% 1.44% 3.01%AR(3)GARCH(2,1) 2.05% 0.01% 0.02% 1.58% 2.28% 5.65% 1.53% 3.56% 7.01% 1.70% 0.64% 1.40% 1.62% 1.44% 3.01%AR(4)GARCH(2,1) 2.00% 0.01% 0.03% 1.41% 9.90% 16.79% 1.47% 5.79% 10.90% 1.70% 0.64% 2.01% 1.62% 1.44% 3.01%AR(0)GARCH(2,2) 2.21% 0.00% 0.00% 1.64% 1.32% 3.62% 1.74% 0.38% 0.84% 1.64% 1.15% 3.28% 1.62% 1.44% 3.01%AR(1)GARCH(2,2) 2.10% 0.00% 0.00% 1.58% 2.28% 5.65% 1.69% 0.69% 1.50% 1.70% 0.64% 2.01% 1.62% 1.44% 3.01%AR(2)GARCH(2,2) 2.10% 0.00% 0.01% 1.58% 2.28% 5.65% 1.53% 3.56% 7.01% 1.75% 0.35% 1.19% 1.72% 0.45% 0.99%AR(3)GARCH(2,2) 2.16% 0.00% 0.00% 1.70% 0.73% 2.23% 1.47% 5.79% 10.90% 1.59% 2.00% 5.14% 1.67% 0.82% 1.76%AR(4)GARCH(2,2) 2.21% 0.00% 0.00% 1.58% 2.28% 5.65% 1.53% 3.56% 7.01% 1.59% 2.00% 5.14% 1.67% 0.82% 1.76%AR(0)TARCH(0,1) 2.32% 0.00% 0.00% 1.64% 1.32% 2.80% 2.78% 0.00% 0.00% 2.41% 0.00% 0.00% 2.69% 0.00% 0.00%AR(1)TARCH(0,1) 2.27% 0.00% 0.00% 1.70% 0.73% 1.61% 2.78% 0.00% 0.00% 2.46% 0.00% 0.00% 2.69% 0.00% 0.00%AR(2)TARCH(0,1) 2.32% 0.00% 0.00% 1.70% 0.73% 1.61% 2.62% 0.00% 0.00% 2.57% 0.00% 0.00% 2.69% 0.00% 0.00%AR(3)TARCH(0,1) 2.43% 0.00% 0.00% 1.70% 0.73% 1.61% 2.67% 0.00% 0.00% 2.57% 0.00% 0.00% 2.64% 0.00% 0.00%AR(4)TARCH(0,1) 2.48% 0.00% 0.00% 1.70% 0.73% 1.61% 2.67% 0.00% 0.00% 2.46% 0.00% 0.00% 2.64% 0.00% 0.00%AR(0)TARCH(0,2) 2.32% 0.00% 0.00% 1.53% 3.85% 7.60% 2.40% 0.00% 0.00% 2.14% 0.00% 0.01% 2.37% 0.00% 0.00%AR(1)TARCH(0,2) 2.32% 0.00% 0.00% 1.53% 3.85% 7.60% 2.40% 0.00% 0.00% 2.19% 0.00% 0.00% 2.53% 0.00% 0.00%AR(2)TARCH(0,2) 2.43% 0.00% 0.00% 1.53% 3.85% 7.60% 2.40% 0.00% 0.00% 2.19% 0.00% 0.00% 2.48% 0.00% 0.00%AR(3)TARCH(0,2) 2.43% 0.00% 0.00% 1.53% 3.85% 7.60% 2.40% 0.00% 0.00% 2.08% 0.01% 0.03% 2.48% 0.00% 0.00%AR(4)TARCH(0,2) 2.54% 0.00% 0.00% 1.53% 3.85% 7.60% 2.40% 0.00% 0.00% 2.14% 0.00% 0.01% 2.48% 0.00% 0.00%AR(0)TARCH(1,1) 1.83% 0.12% 0.28% 1.53% 3.85% 7.60% 1.58% 2.12% 4.35% 2.25% 0.00% 0.00% 1.35% 15.43% 25.43%AR(1)TARCH(1,1) 1.83% 0.12% 0.28% 1.58% 2.28% 4.70% 1.47% 5.79% 10.90% 2.14% 0.00% 0.01% 1.35% 15.43% 25.43%AR(2)TARCH(1,1) 1.89% 0.06% 0.14% 1.58% 2.28% 4.70% 1.47% 5.79% 10.90% 2.08% 0.01% 0.03% 1.51% 4.08% 7.91%AR(3)TARCH(1,1) 1.89% 0.06% 0.14% 1.64% 1.32% 2.80% 1.47% 5.79% 10.90% 2.19% 0.00% 0.01% 1.51% 4.08% 7.91%AR(4)TARCH(1,1) 1.94% 0.03% 0.07% 1.53% 3.85% 7.60% 1.47% 5.79% 10.90% 2.25% 0.00% 0.00% 1.45% 6.56% 12.14%AR(0)TARCH(1,2) 2.00% 0.01% 0.03% 1.47% 6.27% 11.82% 1.69% 0.69% 1.50% 2.03% 0.01% 0.03% 1.56% 2.46% 4.97%AR(1)TARCH(1,2) 2.05% 0.01% 0.02% 1.53% 3.85% 7.60% 1.63% 1.23% 2.60% 2.14% 0.00% 0.01% 1.51% 4.08% 7.91%AR(2)TARCH(1,2) 2.00% 0.01% 0.03% 1.36% 15.12% 25.30% 1.58% 2.12% 4.35% 2.03% 0.01% 0.03% 1.51% 4.08% 7.91%AR(3)TARCH(1,2) 2.05% 0.01% 0.02% 1.41% 9.90% 17.66% 1.53% 3.56% 7.01% 2.14% 0.00% 0.01% 1.45% 6.56% 12.14%AR(4)TARCH(1,2) 1.89% 0.06% 0.11% 1.53% 3.85% 7.60% 1.53% 3.56% 7.01% 2.35% 0.00% 0.00% 1.45% 6.56% 12.14%AR(0)TARCH(2,1) 2.00% 0.01% 0.03% 1.47% 6.27% 11.82% 1.63% 1.23% 2.60% 2.14% 0.00% 0.01% 1.40% 10.22% 17.93%AR(1)TARCH(2,1) 1.94% 0.03% 0.07% 1.58% 2.28% 4.70% 1.53% 3.56% 7.01% 2.14% 0.00% 0.01% 1.51% 4.08% 7.91%AR(2)TARCH(2,1) 1.94% 0.03% 0.07% 1.41% 9.90% 17.66% 1.47% 5.79% 10.90% 2.25% 0.00% 0.00% 1.56% 2.46% 4.97%AR(3)TARCH(2,1) 1.94% 0.03% 0.07% 1.47% 6.27% 11.82% 1.63% 1.23% 2.60% 2.30% 0.00% 0.00% 1.51% 4.08% 7.91%AR(4)TARCH(2,1) 1.89% 0.06% 0.14% 1.53% 3.85% 7.60% 1.69% 0.69% 1.50% 2.19% 0.00% 0.01% 1.40% 10.22% 17.93%AR(0)TARCH(2,2) 2.00% 0.01% 0.03% 1.47% 6.27% 11.82% 1.53% 3.56% 7.01% 2.19% 0.00% 0.01% 1.40% 10.22% 17.93%AR(1)TARCH(2,2) 1.89% 0.06% 0.11% 1.47% 6.27% 11.82% 1.53% 3.56% 7.01% 2.14% 0.00% 0.01% 1.51% 4.08% 7.91%AR(2)TARCH(2,2) 2.00% 0.01% 0.03% 1.36% 15.12% 25.30% 1.47% 5.79% 10.90% 2.14% 0.00% 0.01% 1.45% 6.56% 12.14%AR(3)TARCH(2,2) 1.94% 0.03% 0.06% 1.47% 6.27% 11.82% 1.53% 3.56% 7.01% 2.25% 0.00% 0.00% 1.45% 6.56% 12.14%AR(4)TARCH(2,2) 2.00% 0.01% 0.03% 1.75% 0.40% 0.89% 1.53% 3.56% 7.01% 2.30% 0.00% 0.00% 1.45% 6.56% 12.14%AR(0)EGARCH(0,1) 2.10% 0.00% 0.02% 1.70% 0.73% 2.23% 2.72% 0.00% 0.00% 2.41% 0.00% 0.00% 2.80% 0.00% 0.00%AR(1)EGARCH(0,1) 2.10% 0.00% 0.02% 1.75% 0.40% 1.32% 2.72% 0.00% 0.00% 2.41% 0.00% 0.00% 2.85% 0.00% 0.00%AR(2)EGARCH(0,1) 2.05% 0.01% 0.03% 1.81% 0.21% 0.76% 2.62% 0.00% 0.00% 2.41% 0.00% 0.00% 3.07% 0.00% 0.00%AR(3)EGARCH(0,1) 2.10% 0.00% 0.01% 1.81% 0.21% 0.76% 2.67% 0.00% 0.00% 2.41% 0.00% 0.00% 3.07% 0.00% 0.00%AR(4)EGARCH(0,1) 2.10% 0.00% 0.01% 1.81% 0.21% 0.76% 2.62% 0.00% 0.00% 2.41% 0.00% 0.00% 3.07% 0.00% 0.00%AR(0)EGARCH(0,2) 2.70% 0.00% 0.00% 1.75% 0.40% 1.32% 2.51% 0.00% 0.00% 2.41% 0.00% 0.00% 2.75% 0.00% 0.00%AR(1)EGARCH(0,2) 2.70% 0.00% 0.00% 1.75% 0.40% 1.32% 2.56% 0.00% 0.00% 2.35% 0.00% 0.00% 2.91% 0.00% 0.00%AR(2)EGARCH(0,2) 2.86% 0.00% 0.00% 1.75% 0.40% 1.32% 2.78% 0.00% 0.00% 2.41% 0.00% 0.00% 3.02% 0.00% 0.00%AR(3)EGARCH(0,2) 2.91% 0.00% 0.00% 1.70% 0.73% 2.23% 2.78% 0.00% 0.00% 2.30% 0.00% 0.00% 3.07% 0.00% 0.00%AR(4)EGARCH(0,2) 3.02% 0.00% 0.00% 1.75% 0.40% 1.32% 2.67% 0.00% 0.00% 2.41% 0.00% 0.00% 3.07% 0.00% 0.00%AR(0)EGARCH(1,1) 1.94% 0.03% 0.14% 1.58% 2.28% 4.70% 1.63% 1.23% 2.60% 1.97% 0.02% 0.05% 1.56% 2.46% 4.97%AR(1)EGARCH(1,1) 1.94% 0.03% 0.07% 1.64% 1.32% 2.80% 1.63% 1.23% 2.60% 1.86% 0.09% 0.38% 1.56% 2.46% 4.97%AR(2)EGARCH(1,1) 1.83% 0.12% 0.28% 1.58% 2.28% 4.70% 1.58% 2.12% 4.35% 2.03% 0.01% 0.03% 1.56% 2.46% 4.97%AR(3)EGARCH(1,1) 1.89% 0.06% 0.14% 1.64% 1.32% 2.80% 1.63% 1.23% 2.60% 2.08% 0.01% 0.01% 1.51% 4.08% 7.91%AR(4)EGARCH(1,1) 1.94% 0.03% 0.07% 1.70% 0.73% 1.61% 1.58% 2.12% 4.35% 2.08% 0.01% 0.01% 1.51% 4.08% 7.91%AR(0)EGARCH(1,2) 2.21% 0.00% 0.00% 1.81% 0.21% 0.48% 1.63% 1.23% 2.60% 1.81% 0.18% 0.26% 1.51% 4.08% 7.91%AR(1)EGARCH(1,2) 2.05% 0.01% 0.02% 1.98% 0.03% 0.12% 1.63% 1.23% 2.60% 1.81% 0.18% 0.26% 1.51% 4.08% 7.91%AR(2)EGARCH(1,2) 2.16% 0.00% 0.00% 1.87% 0.11% 0.25% 1.63% 1.23% 2.60% 1.86% 0.09% 0.15% 1.56% 2.46% 4.97%AR(3)EGARCH(1,2) 2.21% 0.00% 0.00% 1.87% 0.11% 0.25% 1.58% 2.12% 4.35% 1.86% 0.09% 0.15% 1.62% 1.44% 3.01%AR(4)EGARCH(1,2) 2.10% 0.00% 0.01% 1.87% 0.11% 0.25% 1.53% 3.56% 7.01% 1.81% 0.18% 0.26% 1.72% 0.45% 0.99%AR(0)EGARCH(2,1) 1.94% 0.03% 0.07% 1.81% 0.21% 0.76% 1.53% 3.56% 7.01% 1.92% 0.05% 0.20% 1.56% 2.46% 4.97%AR(1)EGARCH(2,1) 1.78% 0.23% 0.53% 1.92% 0.05% 0.22% 1.42% 9.12% 16.29% 1.92% 0.05% 0.20% 1.67% 0.82% 2.48%AR(2)EGARCH(2,1) 1.89% 0.06% 0.14% 1.98% 0.03% 0.12% 1.42% 9.12% 16.29% 2.03% 0.01% 0.05% 1.67% 0.82% 1.76%AR(3)EGARCH(2,1) 1.78% 0.23% 0.53% 1.92% 0.05% 0.22% 1.42% 9.12% 16.29% 1.92% 0.05% 0.20% 1.67% 0.82% 2.48%AR(4)EGARCH(2,1) 1.83% 0.12% 0.28% 1.92% 0.05% 0.22% 1.42% 9.12% 16.29% 1.81% 0.18% 0.68% 1.67% 0.82% 2.48%Note: The table reports for each model, sample size and equity index, the exception rate (t) and the p-values of unconditional (p_uc) and conditional coverage(p cc)
FTSE100Table (8.A). Normal Distribution, 500 sample size, 99%-VaR
S&P500 NIKKEI225 DAX30 CAC40Models
Page 8 of 12

Models t p_uc p_cc t p_uc p_cc t p_uc p_cc t p_uc p_cc t p_uc p_ccAR(1)GARCH(0,1) 5.07% 88.58% 93.39% 2.49% 0.00% 0.00% 5.45% 38.34% 63.29% 5.48% 35.72% 20.97% 5.76% 14.09% 5.41%AR(1)GARCH(0,2) 5.02% 97.03% 65.26% 2.94% 0.00% 0.00% 4.80% 68.60% 81.39% 5.42% 41.44% 35.91% 5.87% 9.38% 4.80%AR(1)GARCH(1,1) 3.35% 0.05% 0.20% 3.51% 0.24% 0.97% 4.20% 10.46% 23.39% 4.71% 56.57% 72.07% 4.85% 76.04% 86.48%AR(1)GARCH(1,2) 3.35% 0.05% 0.20% 3.51% 0.24% 0.97% 4.14% 8.25% 12.76% 4.71% 56.57% 51.27% 4.90% 84.34% 12.31%AR(1)GARCH(2,1) 3.35% 0.05% 0.20% 3.57% 0.36% 1.37% - - - 4.71% 56.57% 72.07% 4.85% 76.04% 86.48%AR(1)GARCH(2,2) 3.51% 0.19% 0.69% 3.51% 0.24% 0.97% 4.09% 6.43% 9.85% 4.65% 49.39% 65.60% 4.79% 67.99% 61.72%AR(1)TARCH(0,1) 4.70% 54.31% 38.90% 2.38% 0.00% 0.00% 5.40% 44.30% 69.60% - - - - - -AR(1)TARCH(0,2) - - - 3.23% 0.03% 0.02% 5.12% 81.03% 84.97% - - - - - -AR(1)TARCH(1,1) 3.62% 0.41% 1.46% 3.45% 0.16% 0.08% 4.31% 16.23% 34.13% 4.82% 72.15% 83.22% 4.74% 60.25% 82.85%AR(1)TARCH(1,2) - - - - - - - - - - - - - - -AR(1)TARCH(2,1) 3.62% 0.41% 1.46% 3.45% 0.16% 0.08% 4.31% 16.23% 34.13% 4.93% 88.87% 90.64% 4.90% 84.34% 71.39%AR(1)TARCH(2,2) - - - - - - - - - - - - - - -AR(1)EGARCH(0,1) 4.91% 86.00% 91.00% 2.32% 0.00% 0.00% 5.40% 44.30% 67.49% 5.48% 35.72% 11.07% 6.19% 2.28% 0.02%AR(1)EGARCH(0,2) 5.23% 64.53% 22.75% 3.06% 0.01% 0.01% 4.96% 93.59% 5.58% 5.37% 47.69% 36.59% 6.19% 2.28% 0.33%AR(1)EGARCH(1,1) 4.26% 13.59% 30.78% 3.68% 0.76% 0.23% 4.36% 19.86% 40.25% 5.15% 77.29% 56.51% 5.82% 11.54% 26.10%AR(1)EGARCH(1,2) 4.43% 24.73% 47.98% 3.51% 0.24% 0.10% 4.69% 53.38% 78.53% 5.15% 77.29% 56.51% 5.65% 20.47% 29.27%AR(1)EGARCH(2,1) 4.43% 24.73% 47.98% 3.74% 1.08% 0.29% 4.69% 53.38% 78.53% 5.31% 54.44% 56.38% 5.39% 45.19% 55.60%
Models t p_uc p_cc t p_uc p_cc t p_uc p_cc t p_uc p_cc t p_uc p_ccAR(1)GARCH(0,1) 5.40% 43.90% 67.63% 2.89% 0.00% 0.01% 5.56% 28.04% 32.60% 5.31% 54.44% 36.78% 5.60% 24.37% 20.54%AR(1)GARCH(0,2) 5.02% 97.03% 89.77% 3.06% 0.01% 0.01% 5.23% 65.13% 77.44% 5.42% 41.44% 21.17% 5.71% 17.05% 10.72%AR(1)GARCH(1,1) 3.56% 0.28% 1.02% 3.34% 0.07% 0.30% 4.47% 28.79% 50.62% 4.71% 56.57% 51.27% 5.12% 81.96% 58.05%AR(1)GARCH(1,2) 3.62% 0.41% 1.46% 3.51% 0.24% 0.97% 4.41% 24.04% 46.74% 4.82% 72.15% 62.33% 4.95% 92.78% 28.59%AR(1)GARCH(2,1) 3.51% 0.19% 0.69% 3.34% 0.07% 0.30% - - - 4.71% 56.57% 51.27% 5.06% 90.27% 56.17%AR(1)GARCH(2,2) 3.83% 1.63% 5.29% 3.45% 0.16% 0.66% 4.47% 28.79% 53.44% 4.87% 80.42% 67.20% 4.95% 92.78% 50.39%AR(1)TARCH(0,1) - - - 2.94% 0.00% 0.00% - - - - - - - - -AR(1)TARCH(0,2) - - - 3.17% 0.02% 0.01% - - - - - - - - -AR(1)TARCH(1,1) - - - 3.57% 0.36% 0.14% 4.25% 13.10% 22.04% 4.65% 49.39% 45.46% 5.06% 90.27% 93.61%AR(1)TARCH(1,2) - - - - - - - - - - - - - - -AR(1)TARCH(2,1) - - - 3.57% 0.36% 0.14% 4.20% 10.46% 19.14% 4.65% 49.39% 65.60% 5.06% 90.27% 79.77%AR(1)TARCH(2,2) - - - - - - - - - - - - - - -AR(1)EGARCH(0,1) 5.45% 38.00% 49.95% 2.77% 0.00% 0.00% 5.94% 7.24% 4.13% 5.31% 54.44% 20.68% 6.09% 3.77% 0.39%AR(1)EGARCH(0,2) 5.45% 38.00% 49.95% 3.06% 0.01% 0.01% 5.45% 38.34% 5.24% 5.48% 35.72% 49.70% 5.60% 24.37% 2.62%AR(1)EGARCH(1,1) 5.07% 88.58% 62.04% 3.51% 0.24% 0.10% 5.18% 72.92% 80.67% 5.04% 94.02% 52.72% 5.76% 14.09% 29.99%AR(1)EGARCH(1,2) 4.86% 77.66% 70.10% 3.62% 0.53% 1.19% 5.07% 89.37% 93.21% 5.09% 85.56% 7.40% 5.65% 20.47% 38.15%AR(1)EGARCH(2,1) 4.96% 94.47% 67.74% 3.45% 0.16% 0.08% 5.18% 72.92% 89.24% 4.98% 97.43% 49.83% 5.87% 9.38% 13.53%
Models t p_uc p_cc t p_uc p_cc t p_uc p_cc t p_uc p_cc t p_uc p_ccAR(1)GARCH(0,1) 4.86% 77.66% 87.14% 3.28% 0.04% 0.15% 5.29% 57.73% 37.26% 5.31% 54.44% 36.78% 5.55% 28.78% 2.56%AR(1)GARCH(0,2) 4.75% 61.73% 83.70% 3.34% 0.07% 0.22% 5.07% 89.37% 78.58% 5.37% 47.69% 21.07% 5.76% 14.09% 2.60%AR(1)GARCH(1,1) 3.78% 1.18% 3.94% 3.28% 0.04% 0.19% 4.58% 40.00% 66.74% 4.93% 88.87% 90.64% 5.22% 66.08% 59.45%AR(1)GARCH(1,2) 3.78% 1.18% 2.91% 3.51% 0.24% 0.97% 4.52% 34.11% 49.37% 5.04% 94.02% 30.47% 5.22% 66.08% 21.01%AR(1)GARCH(2,1) 3.83% 1.63% 5.29% 3.40% 0.10% 0.45% - - - - - - 5.17% 73.87% 59.15%AR(1)GARCH(2,2) 3.89% 2.22% 6.98% 3.57% 0.36% 1.37% 4.58% 40.00% 56.23% - - - 5.33% 51.69% 38.65%AR(1)TARCH(0,1) - - - 3.23% 0.03% 0.10% - - - - - - - - -AR(1)TARCH(0,2) - - - 3.34% 0.07% 0.04% - - - - - - - - -AR(1)TARCH(1,1) - - - 3.28% 0.04% 0.15% 4.36% 19.86% 40.25% - - - 5.28% 58.67% 58.93%AR(1)TARCH(1,2) - - - - - - - - - - - - - - -AR(1)TARCH(2,1) - - - 3.40% 0.10% 0.32% - - - - - - 5.33% 51.69% 57.63%AR(1)TARCH(2,2) - - - - - - - - - - - - - - -AR(1)EGARCH(0,1) 5.07% 88.58% 93.39% 3.11% 0.01% 0.04% 5.23% 65.13% 9.57% 5.31% 54.44% 56.38% 5.76% 14.09% 2.60%AR(1)EGARCH(0,2) 5.13% 80.30% 83.88% 3.40% 0.10% 0.32% 5.56% 28.04% 5.47% 5.37% 47.69% 21.07% 5.71% 17.05% 1.12%AR(1)EGARCH(1,1) 4.70% 54.31% 66.57% 3.79% 1.51% 0.36% 5.29% 57.73% 69.86% - - - 5.76% 14.09% 31.79%AR(1)EGARCH(1,2) 4.64% 47.33% 63.62% 3.79% 1.51% 2.63% 4.96% 93.59% 92.12% 5.09% 85.56% 32.57% 5.76% 14.09% 10.07%AR(1)EGARCH(2,1) 4.75% 61.73% 68.67% 3.85% 2.08% 3.32% 5.40% 44.30% 69.60% 5.04% 94.02% 93.25% 5.60% 24.37% 20.54%
Models t p_uc p_cc t p_uc p_cc t p_uc p_cc t p_uc p_cc t p_uc p_ccAR(1)GARCH(0,1) 4.16% 8.61% 7.46% 3.34% 0.07% 0.30% 4.63% 46.44% 63.08% - - - - - -AR(1)GARCH(0,2) 4.05% 5.20% 8.10% 3.74% 1.08% 3.55% 5.18% 72.92% 57.66% - - - - - -AR(1)GARCH(1,1) 3.83% 1.63% 4.03% 3.74% 1.08% 3.52% - - - - - - - - -AR(1)GARCH(1,2) 3.89% 2.22% 3.25% - - - 4.47% 28.79% 42.68% - - - - - -AR(1)GARCH(2,1) 3.89% 2.22% 5.49% 3.85% 2.08% 6.47% - - - - - - - - -AR(1)GARCH(2,2) 3.94% 2.99% 4.48% - - - - - - - - - - - -AR(1)TARCH(0,1) - - - - - - - - - - - - - - -AR(1)TARCH(0,2) - - - - - - - - - - - - - - -AR(1)TARCH(1,1) - - - 3.57% 0.36% 0.88% - - - - - - - - -AR(1)TARCH(1,2) - - - - - - - - - - - - - - -AR(1)TARCH(2,1) - - - - - - - - - - - - - - -AR(1)TARCH(2,2) - - - - - - - - - - - - - - -AR(1)EGARCH(0,1) 4.26% 13.59% 21.56% 3.28% 0.04% 0.15% 5.07% 89.37% 32.24% - - - - - -AR(1)EGARCH(0,2) 4.91% 86.00% 90.54% 3.79% 1.51% 4.70% 5.01% 97.86% 30.00% - - - - - -AR(1)EGARCH(1,1) 4.75% 61.73% 77.33% 3.62% 0.53% 1.92% - - - - - - - - -AR(1)EGARCH(1,2) 5.02% 97.03% 78.16% 4.07% 6.56% 14.69% - - - - - - - - -AR(1)EGARCH(2,1) 4.75% 61.73% 77.33% 3.62% 0.53% 1.92% - - - - - - - - -Note: The table reports for each model, sample size and equity index, the exception rate (t) and the p-values of unconditional (p_uc) and conditional coverage(p cc)
FTSE100Table (9.1.A). Student-t Distribution, 2000 sample size, 95%-VaR
S&P500 NIKKEI225 DAX30 CAC40
Table (9.2.A). Student-t Distribution, 1500 sample size, 95%-VaRS&P500 NIKKEI225
CAC40
DAX30 CAC40 FTSE100
Table (9.3.A). Student-t Distribution, 1000 sample size, 95%-VaRFTSE100S&P500 NIKKEI225 DAX30
Table (9.4.A). Student-t Distribution, 500 sample size, 95%-VaRS&P500 NIKKEI225 DAX30 CAC40 FTSE100
Page 9 of 12

Models t p_uc p_cc t p_uc p_cc t p_uc p_cc t p_uc p_cc t p_uc p_ccAR(1)GARCH(0,1) 0.70% 17.25% 35.72% 0.23% 0.01% 0.04% 1.04% 87.95% 80.19% 1.53% 3.37% 7.75% 1.88% 0.06% 0.15%AR(1)GARCH(0,2) 0.81% 39.40% 61.02% 0.28% 0.03% 0.16% 0.98% 93.43% 82.56% 1.48% 5.50% 11.22% 1.45% 6.56% 12.14%AR(1)GARCH(1,1) 0.59% 5.72% 15.25% 0.23% 0.01% 0.04% 0.60% 6.24% 16.40% 0.82% 42.88% 64.05% 0.92% 71.03% 79.03%AR(1)GARCH(1,2) 0.59% 5.72% 15.25% 0.23% 0.01% 0.04% 0.54% 3.20% 9.45% 0.82% 42.88% 64.05% 0.92% 71.03% 79.03%AR(1)GARCH(2,1) 0.59% 5.72% 15.25% 0.23% 0.01% 0.04% - - - 0.82% 42.88% 64.05% 0.92% 71.03% 79.03%AR(1)GARCH(2,2) 0.65% 10.32% 24.35% 0.23% 0.01% 0.04% 0.54% 3.20% 9.45% 0.82% 42.88% 64.05% 0.92% 71.03% 79.03%AR(1)TARCH(0,1) 0.70% 17.25% 35.72% 0.23% 0.01% 0.04% 0.93% 74.84% 32.98% - - - - - -AR(1)TARCH(0,2) - - - 0.28% 0.03% 0.16% 0.93% 74.84% 80.27% - - - - - -AR(1)TARCH(1,1) 0.59% 5.72% 15.25% 0.28% 0.03% 0.16% 0.60% 6.24% 16.40% 1.04% 86.27% 79.83% 0.75% 26.52% 47.96%AR(1)TARCH(1,2) - - - - - - - - - - - - - - -AR(1)TARCH(2,1) 0.59% 5.72% 15.25% 0.28% 0.03% 0.16% 0.60% 6.24% 16.40% 1.04% 86.27% 79.83% 0.75% 26.52% 47.96%AR(1)TARCH(2,2) - - - - - - - - - - - - - - -AR(1)EGARCH(0,1) 0.65% 10.32% 24.35% 0.23% 0.01% 0.04% 1.09% 70.28% 42.48% 1.53% 3.37% 7.75% 1.72% 0.45% 0.99%AR(1)EGARCH(0,2) 0.86% 54.53% 71.82% 0.40% 0.37% 1.42% 1.36% 13.92% 23.40% 1.53% 3.37% 7.75% 1.78% 0.24% 0.54%AR(1)EGARCH(1,1) 0.76% 26.90% 48.43% 0.11% 0.00% 0.00% 0.71% 18.54% 37.65% 1.26% 28.39% 32.06% 1.24% 31.92% 45.06%AR(1)EGARCH(1,2) 0.81% 39.40% 61.02% 0.28% 0.03% 0.16% 0.60% 6.24% 16.40% 1.26% 28.39% 32.06% 1.18% 43.70% 56.11%AR(1)EGARCH(2,1) 0.81% 39.40% 61.02% 0.11% 0.00% 0.00% 0.60% 6.24% 16.40% 1.20% 39.41% 37.05% 1.18% 43.70% 56.11%
Models t p_uc p_cc t p_uc p_cc t p_uc p_cc t p_uc p_cc t p_uc p_ccAR(1)GARCH(0,1) 0.81% 39.40% 61.02% 0.28% 0.03% 0.16% 1.31% 20.56% 27.08% 1.48% 5.50% 11.22% 1.78% 0.24% 0.54%AR(1)GARCH(0,2) 0.81% 39.40% 61.02% 0.28% 0.03% 0.16% 1.25% 29.39% 42.50% 1.31% 19.78% 26.41% 1.45% 6.56% 12.14%AR(1)GARCH(1,1) 0.65% 10.32% 24.35% 0.17% 0.00% 0.01% 0.82% 41.70% 63.05% 0.82% 42.88% 64.05% 0.92% 71.03% 79.03%AR(1)GARCH(1,2) 0.65% 10.32% 24.35% 0.17% 0.00% 0.01% 0.82% 41.70% 63.05% 0.82% 42.88% 64.05% 0.92% 71.03% 79.03%AR(1)GARCH(2,1) 0.65% 10.32% 24.35% 0.17% 0.00% 0.01% - - - 0.82% 42.88% 64.05% 0.92% 71.03% 79.03%AR(1)GARCH(2,2) 0.70% 17.25% 35.72% 0.17% 0.00% 0.01% 0.82% 41.70% 63.05% 0.82% 42.88% 64.05% 0.92% 71.03% 79.03%AR(1)TARCH(0,1) - - - 0.28% 0.03% 0.16% - - - - - - - - -AR(1)TARCH(0,2) - - - 0.34% 0.12% 0.52% - - - - - - - - -AR(1)TARCH(1,1) - - - 0.17% 0.00% 0.01% 0.82% 41.70% 63.05% 0.99% 95.11% 38.42% 0.81% 38.90% 60.57%AR(1)TARCH(1,2) - - - - - - - - - - - - - - -AR(1)TARCH(2,1) - - - 0.23% 0.01% 0.04% 0.82% 41.70% 63.05% 1.15% 52.91% 40.67% 0.81% 38.90% 60.57%AR(1)TARCH(2,2) - - - - - - - - - - - - - - -AR(1)EGARCH(0,1) 0.76% 26.90% 48.43% 0.28% 0.03% 0.16% 1.25% 29.39% 32.70% 1.53% 3.37% 7.75% 1.78% 0.24% 0.54%AR(1)EGARCH(0,2) 0.97% 90.11% 82.35% 0.51% 2.21% 6.92% 1.47% 5.79% 10.90% 1.53% 3.37% 7.75% 1.78% 0.24% 0.54%AR(1)EGARCH(1,1) 1.08% 73.47% 75.08% 0.23% 0.01% 0.04% 1.09% 70.28% 73.77% 1.53% 3.37% 2.09% 1.45% 6.56% 12.14%AR(1)EGARCH(1,2) 0.92% 71.72% 79.27% 0.17% 0.00% 0.01% 1.09% 70.28% 73.77% 1.53% 3.37% 2.09% 1.40% 10.22% 17.56%AR(1)EGARCH(2,1) 1.08% 73.47% 42.81% 0.11% 0.00% 0.00% 1.20% 40.63% 53.58% 1.53% 3.37% 2.09% 1.40% 10.22% 17.93%
Models t p_uc p_cc t p_uc p_cc t p_uc p_cc t p_uc p_cc t p_uc p_ccAR(1)GARCH(0,1) 0.97% 90.11% 82.35% 0.45% 0.96% 3.34% 1.31% 20.56% 27.08% 1.64% 1.15% 1.02% 1.62% 1.44% 3.01%AR(1)GARCH(0,2) 0.97% 90.11% 82.35% 0.34% 0.12% 0.52% 1.42% 9.12% 16.29% 1.37% 13.33% 20.76% 1.51% 4.08% 7.91%AR(1)GARCH(1,1) 0.92% 71.72% 79.27% 0.17% 0.00% 0.01% 0.82% 41.70% 63.05% 0.88% 58.71% 74.25% 1.18% 43.70% 56.11%AR(1)GARCH(1,2) 0.86% 54.53% 71.82% 0.17% 0.00% 0.01% 0.93% 74.84% 80.27% 0.99% 95.11% 82.61% 1.13% 57.88% 66.64%AR(1)GARCH(2,1) 0.86% 54.53% 71.82% 0.17% 0.00% 0.01% - - - - - - 1.18% 43.70% 56.11%AR(1)GARCH(2,2) 0.97% 90.11% 82.35% 0.17% 0.00% 0.01% 0.93% 74.84% 80.27% - - - 1.13% 57.88% 66.64%AR(1)TARCH(0,1) - - - 0.45% 0.96% 3.34% - - - - - - - - -AR(1)TARCH(0,2) - - - 0.34% 0.12% 0.52% - - - - - - - - -AR(1)TARCH(1,1) - - - 0.34% 0.12% 0.52% 0.82% 41.70% 63.05% - - - 1.02% 92.04% 80.91%AR(1)TARCH(1,2) - - - - - - - - - - - - - - -AR(1)TARCH(2,1) - - - 0.34% 0.12% 0.52% - - - - - - 1.02% 92.04% 80.91%AR(1)TARCH(2,2) - - - - - - - - - - - - - - -AR(1)EGARCH(0,1) 0.86% 54.53% 71.82% 0.51% 2.21% 6.92% 1.42% 9.12% 16.15% 1.59% 2.00% 5.14% 1.67% 0.82% 1.76%AR(1)EGARCH(0,2) 1.13% 57.23% 66.25% 0.51% 2.21% 6.92% 1.63% 1.23% 3.46% 1.70% 0.64% 0.67% 1.56% 2.46% 4.97%AR(1)EGARCH(1,1) 0.97% 90.11% 82.35% 0.28% 0.03% 0.16% 0.98% 93.43% 82.56% - - - 1.45% 6.56% 12.14%AR(1)EGARCH(1,2) 0.92% 71.72% 79.27% 0.28% 0.03% 0.16% 1.14% 54.33% 64.44% 1.53% 3.37% 2.09% 1.51% 4.08% 7.91%AR(1)EGARCH(2,1) 1.03% 91.30% 80.80% 0.34% 0.12% 0.52% 1.09% 70.28% 73.77% 1.42% 8.70% 15.60% 1.67% 0.82% 1.76%
Models t p_uc p_cc t p_uc p_cc t p_uc p_cc t p_uc p_cc t p_uc p_ccAR(1)GARCH(0,1) 0.86% 54.53% 71.82% 0.45% 0.96% 3.34% 1.14% 54.33% 64.44% - - - - - -AR(1)GARCH(0,2) 0.97% 90.11% 82.35% 0.51% 2.21% 6.92% 1.31% 20.56% 32.23% - - - - - -AR(1)GARCH(1,1) 0.86% 54.53% 71.82% 0.23% 0.01% 0.04% - - - - - - - - -AR(1)GARCH(1,2) 0.92% 71.72% 79.27% - - - 0.87% 57.30% 73.46% - - - - - -AR(1)GARCH(2,1) 0.86% 54.53% 71.82% 0.28% 0.03% 0.16% - - - - - - - - -AR(1)GARCH(2,2) 0.86% 54.53% 71.82% - - - - - - - - - - - -AR(1)TARCH(0,1) - - - - - - - - - - - - - - -AR(1)TARCH(0,2) - - - - - - - - - - - - - - -AR(1)TARCH(1,1) - - - 0.51% 2.21% 6.92% - - - - - - - - -AR(1)TARCH(1,2) - - - - - - - - - - - - - - -AR(1)TARCH(2,1) - - - - - - - - - - - - - - -AR(1)TARCH(2,2) - - - - - - - - - - - - - - -AR(1)EGARCH(0,1) 0.81% 39.40% 61.02% 0.68% 15.01% 32.48% 1.14% 54.33% 41.06% - - - - - -AR(1)EGARCH(0,2) 1.19% 43.13% 55.65% 0.74% 24.14% 45.38% 1.25% 29.39% 32.70% - - - - - -AR(1)EGARCH(1,1) 1.03% 91.30% 80.80% 0.74% 24.14% 45.38% - - - - - - - - -AR(1)EGARCH(1,2) 1.24% 31.45% 44.59% 0.68% 15.01% 32.48% - - - - - - - - -AR(1)EGARCH(2,1) 1.19% 43.13% 38.66% 0.79% 36.26% 58.61% - - - - - - - - -Note: The table reports for each model, sample size and equity index, the exception rate (t) and the p-values of unconditional (p_uc) and conditional coverage(p cc)
Table (10.4.A). Student-t Distribution, 500 sample size, 99%-VaRS&P500 NIKKEI225 DAX30 CAC40 FTSE100
Table (10.3.A). Student-t Distribution, 1000 sample size, 99%-VaRS&P500 NIKKEI225 DAX30 CAC40 FTSE100
Table (10.2.A). Student-t Distribution, 1500 sample size, 99%-VaRS&P500 NIKKEI225 DAX30 CAC40 FTSE100
FTSE100Table (10.1.A). Student-t Distribution, 2000 sample size, 99%-VaR
S&P500 NIKKEI225 DAX30 CAC40
Page 10 of 12

Models t p_uc p_cc t p_uc p_cc t p_uc p_cc t p_uc p_cc t p_uc p_ccAR(1)GARCH(0,1) 9.17% 0.00% 0.00% 6.17% 2.94% 0.70% 8.56% 0.00% 0.00% 7.67% 0.00% 0.00% 7.86% 0.00% 0.00%AR(1)GARCH(0,2) 8.36% 0.00% 0.00% 5.89% 9.62% 0.65% 7.47% 0.00% 0.00% 7.39% 0.00% 0.00% 7.59% 0.00% 0.00%AR(1)GARCH(1,1) 5.18% 72.25% 79.48% 6.17% 2.94% 8.36% 5.99% 5.77% 12.25% 6.08% 4.05% 11.45% 6.19% 2.28% 0.72%AR(1)GARCH(1,2) 5.56% 27.81% 49.69% 6.06% 4.85% 10.90% 5.94% 7.24% 18.34% 6.08% 4.05% 7.80% 6.25% 1.75% 0.13%AR(1)GARCH(2,1) 5.23% 64.53% 74.32% 6.06% 4.85% 7.25% - - - 5.97% 6.48% 16.75% 6.14% 2.94% 1.58%AR(1)GARCH(2,2) 5.34% 50.30% 74.95% 6.06% 4.85% 7.25% 5.89% 9.00% 18.76% 6.08% 4.05% 10.16% 6.14% 2.94% 0.80%AR(1)TARCH(0,1) 9.28% 0.00% 0.00% 6.23% 2.26% 0.00% 8.39% 0.00% 0.00% 7.50% 0.00% 0.00% - - -AR(1)TARCH(0,2) - - - 6.00% 6.14% 0.36% 7.47% 0.00% 0.00% 7.17% 0.01% 0.03% - - -AR(1)TARCH(1,1) 5.88% 8.96% 12.43% 5.60% 25.37% 9.49% 5.61% 23.69% 33.29% 5.81% 12.34% 28.68% 6.14% 2.94% 8.11%AR(1)TARCH(1,2) - - - - - - - - - - - - - - -AR(1)TARCH(2,1) 5.77% 13.51% 18.92% 5.77% 14.55% 4.93% 5.83% 11.11% 22.81% 5.81% 12.34% 28.68% 6.14% 2.94% 6.49%AR(1)TARCH(2,2) - - - - - - - - - - - - - - -AR(1)EGARCH(0,1) 9.39% 0.00% 0.00% 6.11% 3.79% 0.96% 8.83% 0.00% 0.00% 7.56% 0.00% 0.00% 8.24% 0.00% 0.00%AR(1)EGARCH(0,2) 8.69% 0.00% 0.00% 6.06% 4.85% 0.27% 8.12% 0.00% 0.00% 7.39% 0.00% 0.00% 8.02% 0.00% 0.00%AR(1)EGARCH(1,1) 6.75% 0.10% 0.27% 5.66% 21.26% 7.72% 6.65% 0.20% 0.36% 6.52% 0.44% 1.46% 6.79% 0.08% 0.33%AR(1)EGARCH(1,2) 6.75% 0.10% 0.27% 5.72% 17.66% 26.92% 6.49% 0.52% 1.80% 6.46% 0.60% 1.00% 6.89% 0.04% 0.02%AR(1)EGARCH(2,1) 6.80% 0.07% 0.19% 5.55% 30.02% 26.90% 6.54% 0.38% 1.29% 6.57% 0.32% 0.90% 6.89% 0.04% 0.06%
Models t p_uc p_cc t p_uc p_cc t p_uc p_cc t p_uc p_cc t p_uc p_ccAR(1)GARCH(0,1) 8.47% 0.00% 0.00% 6.23% 2.26% 0.51% 8.56% 0.00% 0.00% 7.12% 0.01% 0.04% 7.43% 0.00% 0.00%AR(1)GARCH(0,2) 8.15% 0.00% 0.00% 6.17% 2.94% 0.70% 7.47% 0.00% 0.00% 7.17% 0.01% 0.01% 7.49% 0.00% 0.00%AR(1)GARCH(1,1) 5.61% 23.50% 32.48% 5.72% 17.66% 26.92% 6.21% 2.14% 6.03% 5.75% 15.04% 24.13% 5.92% 7.56% 4.43%AR(1)GARCH(1,2) 5.88% 8.96% 21.94% 5.77% 14.55% 22.32% 6.05% 4.56% 12.18% 5.86% 10.04% 8.29% 6.14% 2.94% 0.15%AR(1)GARCH(2,1) 5.61% 23.50% 32.48% 5.77% 14.55% 22.32% - - - 5.64% 21.79% 38.84% 5.92% 7.56% 4.43%AR(1)GARCH(2,2) 5.61% 23.50% 32.48% 5.83% 11.88% 18.27% 6.05% 4.56% 9.72% 5.75% 15.04% 24.13% 5.98% 6.05% 4.04%AR(1)TARCH(0,1) - - - 6.28% 1.72% 0.36% 8.45% 0.00% 0.00% - - - - - -AR(1)TARCH(0,2) - - - 6.17% 2.94% 0.70% - - - - - - - - -AR(1)TARCH(1,1) 6.26% 1.64% 3.38% 5.49% 35.23% 13.80% 5.89% 9.00% 12.76% 5.86% 10.04% 23.31% 6.19% 2.28% 2.46%AR(1)TARCH(1,2) - - - - - - - - - - - - - - -AR(1)TARCH(2,1) 6.21% 2.15% 4.46% 5.49% 35.23% 13.80% - - - - - - 6.09% 3.77% 5.30%AR(1)TARCH(2,2) - - - - - - - - - - - - - - -AR(1)EGARCH(0,1) 8.80% 0.00% 0.00% 6.11% 3.79% 0.96% 8.50% 0.00% 0.00% 7.12% 0.01% 0.02% 7.70% 0.00% 0.00%AR(1)EGARCH(0,2) 7.99% 0.00% 0.00% 6.11% 3.79% 0.96% 7.79% 0.00% 0.00% 7.12% 0.01% 0.03% 7.59% 0.00% 0.00%AR(1)EGARCH(1,1) 7.02% 0.02% 0.06% 5.55% 30.02% 11.52% 6.65% 0.20% 0.36% 6.24% 1.87% 5.58% 7.00% 0.02% 0.08%AR(1)EGARCH(1,2) 6.85% 0.05% 0.21% 5.43% 40.99% 36.48% 6.65% 0.20% 0.56% 5.97% 6.48% 6.77% 6.84% 0.06% 0.08%AR(1)EGARCH(2,1) 7.07% 0.01% 0.05% 5.55% 30.02% 11.52% 6.70% 0.14% 0.52% 6.35% 1.08% 2.23% 6.73% 0.11% 0.30%
Models t p_uc p_cc t p_uc p_cc t p_uc p_cc t p_uc p_cc t p_uc p_ccAR(1)GARCH(0,1) 7.72% 0.00% 0.00% 5.89% 9.62% 3.00% 7.47% 0.00% 0.00% 6.63% 0.23% 0.70% 6.95% 0.03% 0.02%AR(1)GARCH(0,2) 7.23% 0.00% 0.01% 5.77% 14.55% 12.56% 6.76% 0.10% 0.27% 6.41% 0.81% 2.38% 6.84% 0.06% 0.03%AR(1)GARCH(1,1) 5.67% 19.70% 37.50% 5.72% 17.66% 26.92% 5.83% 11.11% 26.32% 5.91% 8.10% 16.58% 6.03% 4.80% 9.04%AR(1)GARCH(1,2) 5.56% 27.81% 49.69% 5.55% 30.02% 43.77% 5.72% 16.49% 35.94% 5.75% 15.04% 16.29% 5.92% 7.56% 4.43%AR(1)GARCH(2,1) 5.67% 19.70% 37.50% 5.55% 30.02% 11.52% - - - - - - 5.92% 7.56% 16.24%AR(1)GARCH(2,2) 5.83% 11.05% 22.43% 5.43% 40.99% 36.48% 5.78% 13.59% 30.95% 5.81% 12.34% 14.88% 5.87% 9.38% 4.80%AR(1)TARCH(0,1) - - - 5.83% 11.88% 3.87% - - - - - - - - -AR(1)TARCH(0,2) - - - 5.55% 30.02% 11.52% - - - - - - - - -AR(1)TARCH(1,1) - - - 5.38% 47.31% 19.08% - - - - - - 6.14% 2.94% 8.11%AR(1)TARCH(1,2) - - - - - - - - - - - - - - -AR(1)TARCH(2,1) - - - 5.49% 35.23% 13.80% - - - - - - - - -AR(1)TARCH(2,2) - - - - - - - - - - - - - - -AR(1)EGARCH(0,1) 7.93% 0.00% 0.00% 5.72% 17.66% 6.21% 7.57% 0.00% 0.00% 6.68% 0.17% 0.40% 7.16% 0.01% 0.01%AR(1)EGARCH(0,2) 7.61% 0.00% 0.00% 5.89% 9.62% 7.97% 6.98% 0.02% 0.00% 6.30% 1.43% 2.71% 7.00% 0.02% 0.01%AR(1)EGARCH(1,1) 6.85% 0.05% 0.08% 5.72% 17.66% 6.21% 6.27% 1.64% 3.43% 5.86% 10.04% 13.42% 6.73% 0.11% 0.30%AR(1)EGARCH(1,2) 7.02% 0.02% 0.07% 5.60% 25.37% 22.66% 6.27% 1.64% 4.66% 5.70% 18.18% 10.18% 6.52% 0.41% 0.52%AR(1)EGARCH(2,1) 7.02% 0.02% 0.04% 5.66% 21.26% 7.72% 6.21% 2.14% 4.53% 5.86% 10.04% 8.29% 6.25% 1.75% 3.25%
Models t p_uc p_cc t p_uc p_cc t p_uc p_cc t p_uc p_cc t p_uc p_ccAR(1)GARCH(0,1) 6.37% 0.94% 3.16% 5.72% 17.66% 26.92% 6.70% 0.14% 0.24% 6.57% 0.32% 0.90% 6.68% 0.16% 0.05%AR(1)GARCH(0,2) 6.31% 1.25% 3.53% 5.77% 14.55% 12.56% 6.16% 2.78% 7.67% 6.35% 1.08% 2.23% 6.41% 0.75% 0.42%AR(1)GARCH(1,1) 5.45% 38.00% 62.79% 5.49% 35.23% 31.53% 5.78% 13.59% 28.98% - - - 5.76% 14.09% 29.99%AR(1)GARCH(1,2) 5.50% 32.64% 57.55% 5.26% 61.47% 52.22% 5.29% 57.73% 57.43% - - - 5.71% 17.05% 26.68%AR(1)GARCH(2,1) 5.45% 38.00% 62.79% - - - - - - - - - - - -AR(1)GARCH(2,2) 5.45% 38.00% 62.79% - - - 5.18% 72.92% 57.66% - - - 5.65% 20.47% 38.15%AR(1)TARCH(0,1) - - - - - - - - - - - - - - -AR(1)TARCH(0,2) - - - - - - - - - - - - - - -AR(1)TARCH(1,1) - - - - - - - - - - - - - - -AR(1)TARCH(1,2) - - - - - - - - - - - - - - -AR(1)TARCH(2,1) - - - - - - - - - - - - - - -AR(1)TARCH(2,2) - - - - - - - - - - - - - - -AR(1)EGARCH(0,1) 6.53% 0.38% 1.34% 6.00% 6.14% 9.31% 7.03% 0.02% 0.02% 6.52% 0.44% 1.46% 7.11% 0.01% 0.00%AR(1)EGARCH(0,2) 6.26% 1.64% 4.23% 5.94% 7.72% 11.80% 6.43% 0.70% 1.13% 6.35% 1.08% 2.99% 6.84% 0.06% 0.03%AR(1)EGARCH(1,1) 6.10% 3.57% 7.49% 6.06% 4.85% 3.67% 6.54% 0.38% 1.41% 6.24% 1.87% 5.91% 6.73% 0.11% 0.13%AR(1)EGARCH(1,2) 6.42% 0.70% 2.45% 5.77% 14.55% 32.62% 6.27% 1.64% 5.02% 6.24% 1.87% 5.58% 6.73% 0.11% 0.13%AR(1)EGARCH(2,1) 6.42% 0.70% 2.40% 5.60% 25.37% 22.66% 6.59% 0.28% 0.81% 6.57% 0.32% 0.90% 6.79% 0.08% 0.10%Note: The table reports for each model, sample size and equity index, the exception rate (t) and the p-values of unconditional (p_uc) and conditional coverage(p cc)
Table (11.4.A). GED, 500 sample size, 95%-VaRS&P500 NIKKEI225 DAX30 CAC40 FTSE100
Table (11.3.A). GED, 1000 sample size, 95%-VaRS&P500 NIKKEI225 DAX30 CAC40 FTSE100
Table (11.2.A). GED, 1500 sample size, 95%-VaRS&P500 NIKKEI225 DAX30 CAC40 FTSE100
FTSE100Table (11.1.A). GED, 2000 sample size, 95%-VaR
S&P500 NIKKEI225 DAX30 CAC40
Page 11 of 12

Models t p_uc p_cc t p_uc p_cc t p_uc p_cc t p_uc p_cc t p_uc p_ccAR(1)GARCH(0,1) 2.37% 0.00% 0.00% 0.96% 87.19% 82.87% 2.67% 0.00% 0.00% 2.63% 0.00% 0.00% 2.80% 0.00% 0.00%AR(1)GARCH(0,2) 2.27% 0.00% 0.00% 1.02% 93.73% 81.98% 2.18% 0.00% 0.00% 2.14% 0.00% 0.01% 2.42% 0.00% 0.00%AR(1)GARCH(1,1) 1.13% 57.23% 66.25% 0.85% 51.22% 70.34% 1.25% 29.39% 42.50% 1.53% 3.37% 7.75% 1.35% 15.43% 25.43%AR(1)GARCH(1,2) 1.19% 43.13% 55.65% 0.74% 24.14% 45.38% 1.25% 29.39% 42.50% 1.48% 5.50% 11.22% 1.40% 10.22% 17.93%AR(1)GARCH(2,1) 1.24% 31.45% 44.59% 0.85% 51.22% 70.34% - - - 1.53% 3.37% 7.75% 1.35% 15.43% 25.43%AR(1)GARCH(2,2) 1.19% 43.13% 55.65% 0.85% 51.22% 70.34% 1.25% 29.39% 42.50% 1.53% 3.37% 7.75% 1.45% 6.56% 12.14%AR(1)TARCH(0,1) 2.37% 0.00% 0.00% 0.96% 87.19% 82.87% 2.67% 0.00% 0.00% 2.46% 0.00% 0.00% - - -AR(1)TARCH(0,2) - - - 1.13% 58.54% 67.75% 2.18% 0.00% 0.00% 2.14% 0.00% 0.01% - - -AR(1)TARCH(1,1) 1.24% 31.45% 44.59% 0.85% 51.22% 70.34% 1.14% 54.33% 64.44% 1.31% 19.78% 26.41% 1.18% 43.70% 56.11%AR(1)TARCH(1,2) - - - - - - - - - - - - - - -AR(1)TARCH(2,1) 1.19% 43.13% 55.65% 0.74% 24.14% 45.38% 1.20% 40.63% 53.58% 1.31% 19.78% 26.41% 1.24% 31.92% 45.06%AR(1)TARCH(2,2) - - - - - - - - - - - - - - -AR(1)EGARCH(0,1) 2.37% 0.00% 0.00% 1.02% 93.73% 81.98% 2.72% 0.00% 0.00% 2.41% 0.00% 0.00% 2.91% 0.00% 0.00%AR(1)EGARCH(0,2) 2.54% 0.00% 0.00% 1.19% 43.94% 56.92% 2.51% 0.00% 0.00% 2.52% 0.00% 0.00% 2.91% 0.00% 0.00%AR(1)EGARCH(1,1) 1.67% 0.79% 2.41% 0.91% 68.49% 78.84% 1.53% 3.56% 7.01% 2.03% 0.01% 0.03% 1.83% 0.13% 0.29%AR(1)EGARCH(1,2) 1.62% 1.40% 3.87% 0.91% 68.49% 78.84% 1.58% 2.12% 5.40% 1.75% 0.35% 0.43% 1.94% 0.03% 0.14%AR(1)EGARCH(2,1) 1.73% 0.44% 1.45% 0.96% 87.19% 82.87% 1.58% 2.12% 5.40% 1.92% 0.05% 0.09% 1.88% 0.06% 0.15%
Models t p_uc p_cc t p_uc p_cc t p_uc p_cc t p_uc p_cc t p_uc p_ccAR(1)GARCH(0,1) 2.32% 0.00% 0.00% 0.96% 87.19% 82.87% 2.89% 0.00% 0.00% 2.46% 0.00% 0.00% 2.75% 0.00% 0.00%AR(1)GARCH(0,2) 2.32% 0.00% 0.00% 0.91% 68.49% 78.84% 2.67% 0.00% 0.00% 2.25% 0.00% 0.00% 2.48% 0.00% 0.00%AR(1)GARCH(1,1) 1.40% 10.02% 17.62% 0.68% 15.01% 32.48% 1.31% 20.56% 32.23% 1.48% 5.50% 11.22% 1.29% 22.56% 34.59%AR(1)GARCH(1,2) 1.51% 3.98% 8.86% 0.62% 8.65% 21.35% 1.25% 29.39% 42.50% 1.48% 5.50% 11.22% 1.35% 15.43% 25.43%AR(1)GARCH(2,1) 1.46% 6.41% 11.91% 0.68% 15.01% 32.48% - - - 1.48% 5.50% 10.42% 1.29% 22.56% 34.59%AR(1)GARCH(2,2) 1.51% 3.98% 8.86% 0.68% 15.01% 32.48% 1.31% 20.56% 27.08% 1.48% 5.50% 11.22% 1.35% 15.43% 25.43%AR(1)TARCH(0,1) - - - 0.96% 87.19% 82.87% 2.78% 0.00% 0.00% - - - - - -AR(1)TARCH(0,2) - - - 1.02% 93.73% 81.98% - - - - - - - - -AR(1)TARCH(1,1) 1.40% 10.02% 17.62% 0.74% 24.14% 45.38% 1.42% 9.12% 16.29% 1.64% 1.15% 3.28% 1.13% 57.88% 66.64%AR(1)TARCH(1,2) - - - - - - - - - - - - - - -AR(1)TARCH(2,1) 1.40% 10.02% 17.62% 0.74% 24.14% 45.38% - - - - - - 1.18% 43.70% 56.11%AR(1)TARCH(2,2) - - - - - - - - - - - - - - -AR(1)EGARCH(0,1) 2.21% 0.00% 0.00% 0.96% 87.19% 82.87% 2.72% 0.00% 0.00% 2.52% 0.00% 0.00% 2.80% 0.00% 0.00%AR(1)EGARCH(0,2) 2.81% 0.00% 0.00% 1.25% 31.87% 45.51% 2.67% 0.00% 0.00% 2.46% 0.00% 0.00% 2.75% 0.00% 0.00%AR(1)EGARCH(1,1) 1.78% 0.23% 0.84% 1.02% 93.73% 81.98% 1.85% 0.10% 0.24% 2.25% 0.00% 0.00% 1.99% 0.02% 0.04%AR(1)EGARCH(1,2) 1.78% 0.23% 0.32% 0.96% 87.19% 82.87% 1.80% 0.20% 0.45% 1.97% 0.02% 0.05% 2.10% 0.00% 0.02%AR(1)EGARCH(2,1) 1.83% 0.12% 0.47% 0.96% 87.19% 82.87% 1.85% 0.10% 0.24% 2.08% 0.01% 0.01% 2.10% 0.00% 0.02%
Models t p_uc p_cc t p_uc p_cc t p_uc p_cc t p_uc p_cc t p_uc p_ccAR(1)GARCH(0,1) 2.32% 0.00% 0.00% 1.13% 58.54% 67.75% 2.29% 0.00% 0.00% 2.19% 0.00% 0.00% 2.42% 0.00% 0.00%AR(1)GARCH(0,2) 2.16% 0.00% 0.01% 1.08% 75.34% 76.58% 2.51% 0.00% 0.00% 2.14% 0.00% 0.01% 2.21% 0.00% 0.00%AR(1)GARCH(1,1) 1.62% 1.40% 3.87% 0.74% 24.14% 45.38% 1.42% 9.12% 16.29% 1.48% 5.50% 10.42% 1.45% 6.56% 12.14%AR(1)GARCH(1,2) 1.62% 1.40% 1.19% 0.74% 24.14% 45.38% 1.36% 13.92% 23.40% 1.53% 3.37% 6.67% 1.51% 4.08% 7.91%AR(1)GARCH(2,1) 1.57% 2.39% 5.97% 0.68% 15.01% 32.48% - - - - - - 1.45% 6.56% 12.14%AR(1)GARCH(2,2) 1.62% 1.40% 1.19% 0.74% 24.14% 45.38% 1.31% 20.56% 32.23% 1.53% 3.37% 6.67% 1.40% 10.22% 17.93%AR(1)TARCH(0,1) - - - 1.08% 75.34% 76.58% - - - - - - - - -AR(1)TARCH(0,2) - - - 1.08% 75.34% 76.58% - - - - - - - - -AR(1)TARCH(1,1) - - - 0.79% 36.26% 58.61% - - - - - - 1.18% 43.70% 56.11%AR(1)TARCH(1,2) - - - - - - - - - - - - - - -AR(1)TARCH(2,1) - - - 0.79% 36.26% 58.61% - - - - - - - - -AR(1)TARCH(2,2) - - - - - - - - - - - - - - -AR(1)EGARCH(0,1) 1.94% 0.03% 0.07% 1.19% 43.94% 37.70% 2.29% 0.00% 0.00% 2.08% 0.01% 0.00% 2.42% 0.00% 0.00%AR(1)EGARCH(0,2) 2.27% 0.00% 0.00% 1.25% 31.87% 45.51% 2.34% 0.00% 0.00% 2.14% 0.00% 0.01% 2.69% 0.00% 0.00%AR(1)EGARCH(1,1) 1.94% 0.03% 0.14% 1.08% 75.34% 76.58% 1.69% 0.69% 1.50% 1.97% 0.02% 0.10% 1.94% 0.03% 0.07%AR(1)EGARCH(1,2) 2.16% 0.00% 0.00% 0.96% 87.19% 82.87% 1.69% 0.69% 1.50% 2.03% 0.01% 0.03% 1.94% 0.03% 0.07%AR(1)EGARCH(2,1) 2.21% 0.00% 0.00% 1.08% 75.34% 76.58% 1.63% 1.23% 2.60% 2.14% 0.00% 0.01% 2.15% 0.00% 0.00%
Models t p_uc p_cc t p_uc p_cc t p_uc p_cc t p_uc p_cc t p_uc p_ccAR(1)GARCH(0,1) 1.67% 0.79% 2.41% 1.13% 58.54% 67.75% 2.13% 0.00% 0.01% 2.25% 0.00% 0.00% 2.05% 0.01% 0.02%AR(1)GARCH(0,2) 1.83% 0.12% 0.19% 1.08% 75.34% 76.58% 2.07% 0.01% 0.03% 1.92% 0.05% 0.09% 2.21% 0.00% 0.00%AR(1)GARCH(1,1) 1.30% 22.19% 28.41% 0.91% 68.49% 78.84% 1.25% 29.39% 42.50% - - - 1.51% 4.08% 7.91%AR(1)GARCH(1,2) 1.57% 2.39% 1.71% 1.02% 93.73% 81.98% 1.31% 20.56% 32.23% - - - 1.45% 6.56% 12.14%AR(1)GARCH(2,1) 1.30% 22.19% 28.41% - - - - - - - - - - - -AR(1)GARCH(2,2) 1.51% 3.98% 2.35% - - - 1.31% 20.56% 32.23% - - - 1.45% 6.56% 12.14%AR(1)TARCH(0,1) - - - - - - - - - - - - - - -AR(1)TARCH(0,2) - - - - - - - - - - - - - - -AR(1)TARCH(1,1) - - - - - - - - - - - - - - -AR(1)TARCH(1,2) - - - - - - - - - - - - - - -AR(1)TARCH(2,1) - - - - - - - - - - - - - - -AR(1)TARCH(2,2) - - - - - - - - - - - - - - -AR(1)EGARCH(0,1) 1.67% 0.79% 2.41% 1.30% 22.33% 27.76% 2.13% 0.00% 0.01% 2.14% 0.00% 0.01% 2.42% 0.00% 0.00%AR(1)EGARCH(0,2) 2.05% 0.01% 0.03% 1.53% 3.85% 7.60% 2.23% 0.00% 0.00% 2.08% 0.01% 0.01% 2.58% 0.00% 0.00%AR(1)EGARCH(1,1) 1.78% 0.23% 0.32% 1.25% 31.87% 33.19% 1.69% 0.69% 1.50% 2.14% 0.00% 0.01% 2.32% 0.00% 0.00%AR(1)EGARCH(1,2) 2.16% 0.00% 0.00% 1.19% 43.94% 56.92% 1.96% 0.03% 0.11% 2.30% 0.00% 0.00% 2.32% 0.00% 0.00%AR(1)EGARCH(2,1) 1.89% 0.06% 0.11% 1.13% 58.54% 40.55% 1.74% 0.38% 0.84% 2.14% 0.00% 0.01% 2.48% 0.00% 0.00%Note: The table reports for each model, sample size and equity index, the exception rate (t) and the p-values of unconditional (p_uc) and conditional coverage(p cc)
FTSE100Table (12.1.A). GED, 2000 sample size, 99%-VaR
S&P500 NIKKEI225 DAX30 CAC40
Table (12.2.A). GED, 1500 sample size, 99%-VaRS&P500 NIKKEI225
CAC40
DAX30 CAC40 FTSE100
Table (12.3.A). GED, 1000 sample size, 99%-VaRFTSE100S&P500 NIKKEI225 DAX30
Table (12.4.A). GED, 500 sample size, 99%-VaRS&P500 NIKKEI225 DAX30 CAC40 FTSE100
Page 12 of 12