the usda-ars conservation effects assessment project (ceap) · the usda-ars conservation effects...
TRANSCRIPT

National Soil Erosion Research Laboratory
The USDA-ARS Conservation Effects Assessment Project (CEAP):
Lessons learned from 10 years of water quality monitoring
D.R. Smith, G.C. Heathman, and S.J Livingston
USDA-ARS NSERL

National Soil Erosion Research Laboratory
Conservation Effects Assessment Project (CEAP) for the
St. Joseph River Watershed
D. Smith, R. Gillespie, Anonymous (farmers and landowners), S. Livingston, C. Huang, J. Knudson, A. Haynes, D. Frye, B.
Langston, J. Draper, E. Pappas, G. Lake, J. Loomis, S. Lovejoy, G. Heathman, S. Armstrong, D. Bucholtz, B. Zuercher, J.
Hardisty, S. Zezula, P. Owens, J. Lake, T. Bailey, B. Fisher, B. Clarizia, S. Naylor, J. Lemunyon, M. Zwonitzer, K. King, P.
Smiley, J. Frey, D. Flanagan, D. Norton, D. Stott, J. Ascough, M. Larose, M. Crawford, T. Cosby, S. Davis, D. Karlen, etc.

National Soil Erosion Research Laboratory
Why the St. Joseph River?
• Late 1990’s report: Ft. Wayne had the 2nd highest levels of Atrazine in drinking water
– high levels of NO3-N in Defiance, Ohio’s drinking water
– sediment, pesticides and nutrient loading to Lake Erie
• Congressional mandate for USDA-ARS NSERL to work in the St. Joseph River Watershed

National Soil Erosion Research Laboratory
Original Goal of SWPI
• Find voluntary practices to reduce pesticide (specifically atrazine) loads to drinking water sources
• In 2004, SWPI was rolled into CEAP (Conservation Effects Assessment Project) as a result of mandates from 2002 Farm Bill and OMB request to NRCS.
National Soil Erosion Research Laboratory
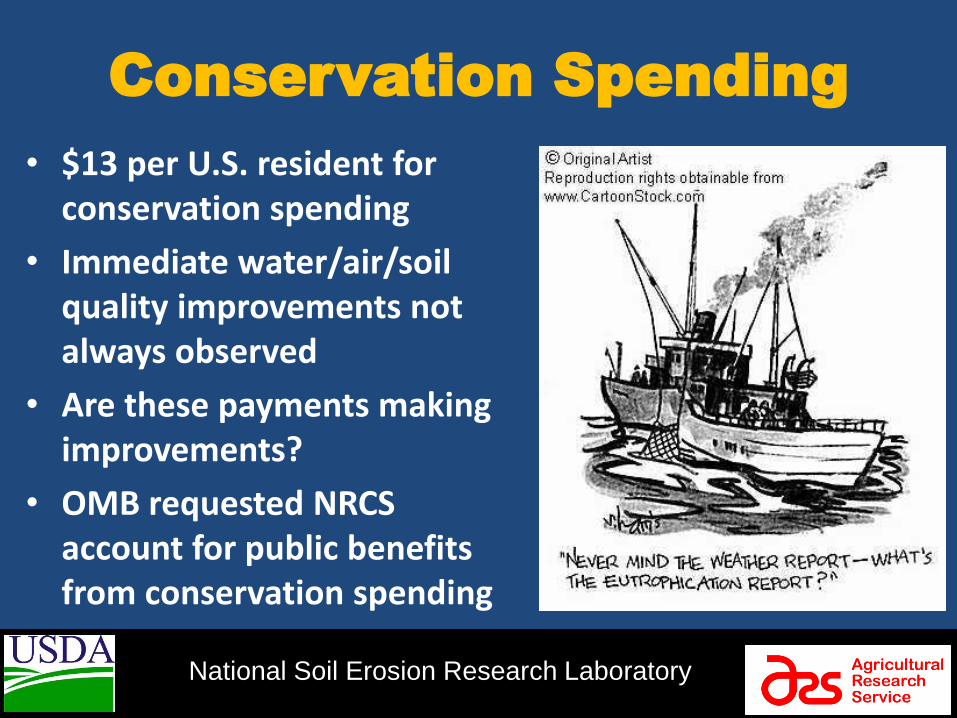
Conservation Spending
• $13 per U.S. resident for conservation spending
• Immediate water/air/soil quality improvements not always observed
• Are these payments making improvements?
• OMB requested NRCS account for public benefits from conservation spending

National Soil Erosion Research Laboratory
ARS 14 Cropland CEAP Watershed Assessment Studies
S. Fork Iowa River
Walnut Creek
Mark Twain Lake Goodwater Cr
U. Washita River
U. Leon River
Town Brook St Joseph River
Upper Big Walnut Creek
Yalobusha River
Little River
Goodwin Creek Beasley Lake
Choptank
Upper Snake R Rock Creek

National Soil Erosion Research Laboratory
Why is St. Joseph River Watershed Important to Present
Conservation Discussions?

National Soil Erosion Research Laboratory
Friday, March 13, 2009
18:09 GMT
About 4 inches of rain
on March 10, 2009
Sediment Loading into Lake Erie

National Soil Erosion Research Laboratory
Eutrophication in Lake Erie
This glass of water came from this
Microsistis bloom

National Soil Erosion Research Laboratory
Objectives
• Compare at field and watershed scale influence of:
– Buffer strips
– Blind Inlets
– Conservation Cropping
– Nutrient Management

National Soil Erosion Research Laboratory
!\
!\
!\!\
!\
!\
!\
!\
!\
!\
!\
!\!\
!\!\!\!\!\!\
Ma
tso
n D
itch
Swartz Ditch
W S
mith
Ditc
h
Cedar C
reek
Dib
bling D
itch
Lein
s Ditch
Ho
ffeld
er
Dit
ch
Ced
ar Cree
k
Mats
on Ditc
h
AD
AS2AS1
F34
CME
CLG
BME
BLG
AME
ALG
MI
IN
OH
MI
IN
OH
MI
Ontario
Tile Drainage
Direct Drainage
Pot-Hole
!
LowPoint
¯
0 50 100 150 200 250
Miles
0 5 10 15 20 25
Miles
0 0.5 1 1.5 2 2.5
Miles

National Soil Erosion Research Laboratory
Influence of Drainage Class on Nutrient Losses
• Nutrient losses were higher from watersheds with more:
– Direct Drainage
– Pothole Drainage

National Soil Erosion Research Laboratory
Ditch Spoil Blocks Flow to Drainage Ditch
Ditch Water
Runoff Water
National Soil Erosion Research Laboratory
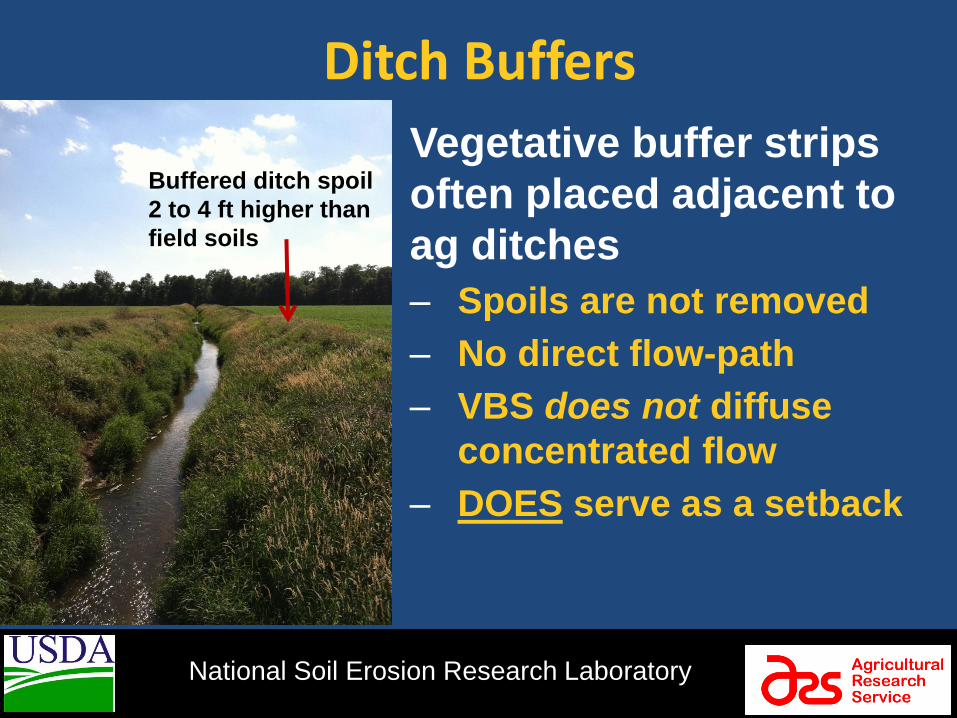
Ditch Buffers
Buffered ditch spoil
2 to 4 ft higher than
field soils
Vegetative buffer strips
often placed adjacent to
ag ditches
– Spoils are not removed
– No direct flow-path
– VBS does not diffuse
concentrated flow
– DOES serve as a setback
National Soil Erosion Research Laboratory
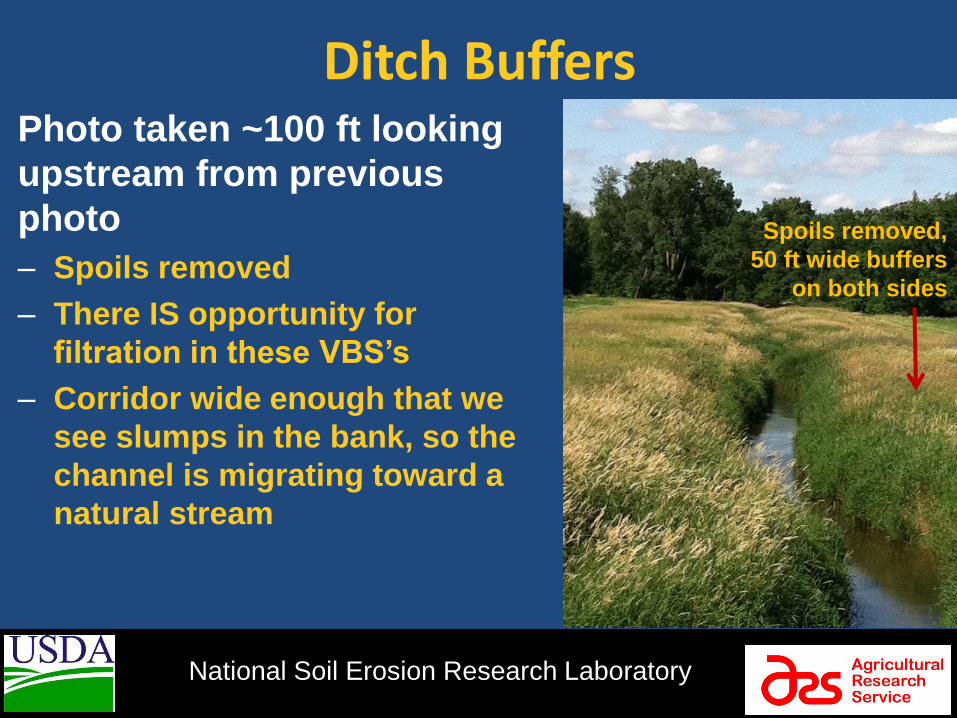
Ditch Buffers
Spoils removed,
50 ft wide buffers
on both sides
Photo taken ~100 ft looking
upstream from previous
photo
– Spoils removed
– There IS opportunity for
filtration in these VBS’s
– Corridor wide enough that we
see slumps in the bank, so the
channel is migrating toward a
natural stream

National Soil Erosion Research Laboratory
Modeling of Buffers on TP Loads
-9
-8
-7
-6
-5
-4
-3
-2
-1
0
All-practices CLU-grassland VBS-30.5 m VBS-61 m
Pe
rce
nt
red
uc
tio
n o
f T
P l
oad
(%
)
Modeling
indicates ~8%
decrease in TP
Loading from
buffer strips

National Soil Erosion Research Laboratory
Modeling of Buffers on TP Loads
Modeling also
suggests if all
fields were
buffered, could
achieve ~50%
decrease in TP
Loading

National Soil Erosion Research Laboratory
Traditional Tile Risers

National Soil Erosion Research Laboratory
Precipitation and Stage at One Monitored Site
Time of Day
23:00:00 07:00:00 15:00:00 23:00:00
Cu
mu
lative
Pre
cip
ita
tio
n (
mm
)
0
5
10
15
20
25
Ditch
Sta
ge
(m
m)
280
300
320
340
360
380
400
420
Precipitation
Stage
Su
rfa
ce
Ru
no
ff(I
nclu
de
s "
Po
t-H
ole
s")
Tile flow

National Soil Erosion Research Laboratory
Subsurface Tile & Tile Riser Flow
In our landscape, the hydrology has
been short circuited. Dating back to the mid-1800’s, settlers
had to drain the land to break the
sod. Pothole is 1.85 miles from ditch
(nearest point)

National Soil Erosion Research Laboratory
Rock Inlets
Rock inlets have been
tested in other locales as
an alternative to tile risers:
– Not very effective at
decreasing contaminant
loads
– Silt in with time
– Farm over them???

National Soil Erosion Research Laboratory

National Soil Erosion Research Laboratory
ADW ADE
Pothole Study Site

National Soil Erosion Research Laboratory
10’ x10’ Blind Inlet

National Soil Erosion Research Laboratory
Blind Inlet with riser alternate
Ris
er
inle
t

National Soil Erosion Research Laboratory
Blind Inlet with pit-run cover (coarse sand and gravel)
National Soil Erosion Research Laboratory
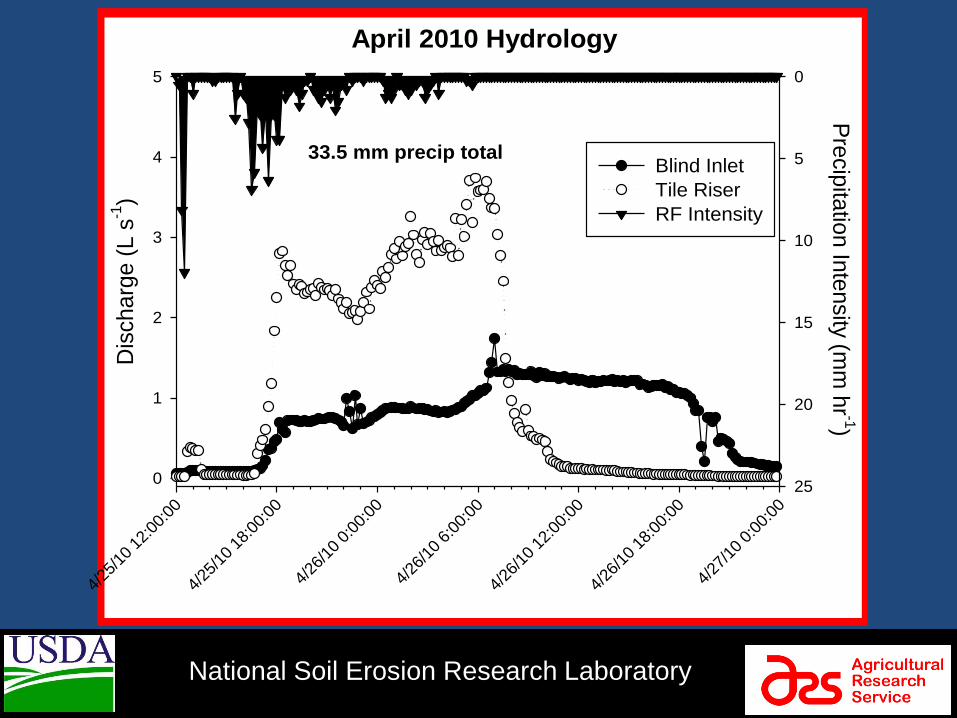
April 2010 Hydrology
4/25
/10
12:0
0:00
4/25
/10
18:0
0:00
4/26
/10
0:00
:00
4/26
/10
6:00
:00
4/26
/10
12:0
0:00
4/26
/10
18:0
0:00
4/27
/10
0:00
:00
Dis
ch
arg
e (
L s
-1)
0
1
2
3
4
5
Pre
cip
itatio
n In
tensity (m
m h
r-1)
0
5
10
15
20
25
Blind Inlet
Tile Riser
RF Intensity
33.5 mm precip total

National Soil Erosion Research Laboratory
Conditions prior to runoff event of April 5, 2009 • ADE (riser)
– No cultivation since spring 2008, – 100% residue cover, no disturbance
• ADW (blind Inlet) – No cultivation after spring 2008 – Silage harvest, late summer 2008 (10% residue cover) – Disturbance on lower portion late fall (10% disturbed)
ADW Residue estimate 10% ADW disturbed estimate 10% of lower section

National Soil Erosion Research Laboratory
Percent Reductions in Sediment and Nutrient Loads: blind inlet vs tile risers Nutrient
2009 % Reduction
2010 % Reduction
Sediment 11* 79
Ammonium-N 30 59
Nitrate-N 34% increase 24
Total Kjehldahl N 66 48
Soluble P 64 72
Total P 52 78

National Soil Erosion Research Laboratory
Watershed Scale Assessment
• Blanketed a 300 ha monitored watershed with blind inlets
• Work with Indiana NRCS for consideration as an approved conservation practice

National Soil Erosion Research Laboratory

National Soil Erosion Research Laboratory

National Soil Erosion Research Laboratory
Total Phosphorus as a Function of Discharge Before (2009) and After (2010) Watershed Installation of Blind Inlets
Discharge (L s-1
)
0 200 400 600 800 1000 1200 1400 1600
To
tal P
Co
nc
en
tra
tio
n (
mg
L-1
)
0.0
0.5
1.0
1.5
2.0
2.5
2009
2010
P < 0.0001 r2 = 0.44
P < 0.74; r2 = 0.001

National Soil Erosion Research Laboratory

National Soil Erosion Research Laboratory
SP Load by Management
No-Till Rotation Till Conv Till/8yr Rot
SP
Lo
ad
(g
ha
-1)
0
100
200
300
400
500

National Soil Erosion Research Laboratory
TP Load by Management
No-Till Rotation Till Conv Till/8yr Rot
TP
Lo
ad
(g
ha
-1)
0
200
400
600
800
1000
1200
1400

National Soil Erosion Research Laboratory
SP in Surface Runoff:Total Discharge Ratio by Management
No-Till Rotation Till Conv Till/8yr Rot
SP
Su
rfa
ce
Ru
no
ff /
To
tal
Dis
ch
arg
e
0.0
0.2
0.4
0.6
0.8
1.0

National Soil Erosion Research Laboratory
SP:TP Ratio by Management
No-Till Rotation Till Conv Till/8yr Rot
SP
/TP
0.0
0.2
0.4
0.6

National Soil Erosion Research Laboratory
0
500000
1000000
1500000
2000000
2500000
300 400 500 600 700 800 900
Dis
char
ge (
L)
Precip (mm)
Surface Runoff SP Load by Precip & Discharge
AS1
AS2
ADE
ADW

National Soil Erosion Research Laboratory
0
500000
1000000
1500000
2000000
2500000
300 400 500 600 700 800 900
Dis
char
ge (
L)
Precip (mm)
Surface Runoff SP Load by Precip & Discharge
AS1
AS2
ADE
ADW
Large Additions of P Every
2 yrs Smaller Annual P Applications

National Soil Erosion Research Laboratory
Western Lake Erie Basin
• WLEB = 7,700 mi2
• Aerial P Loadings
DRP (lb P/ac)
TP (lb P/ac)
Maumee 0.243 0.998
Sandusky 0.277 1.258
Honey Cr. 0.329 1.150
Rock Cr. 0.223 1.230

National Soil Erosion Research Laboratory
Common Fertilizer Management
• Most common rotation in St. Joe watershed is Corn-Soybean
• Most common fertilizer application is 100 lb of DAP (18-46-0) or MAP (11-52-0) in fall or spring before corn crop
– 46 lb P2O5 from DAP (20 lb P/ac)
– 52 lb P2O5 from MAP (22.7 lb P/ac)

National Soil Erosion Research Laboratory
2008.0 2009.0 2010.0 2011.0
To
tal P
in
Su
rfa
ce
Ru
no
ff (
kg P
/ha
)
0.0
0.5
1.0
1.5
2.0
2.5
3.0
Field 1
Field 2
Field 3
Field 4
Maumee
Total P in Surface Runoff & Maumee River

National Soil Erosion Research Laboratory
2008 2009 2010 2011
Tota
l P
in T
ile (
kg/h
a)
0.0
0.5
1.0
1.5
2.0
2.5
Field 1 Tile
Field 2 Tile
Field 3 Tile
Field 4 Tile
Maumee
Total P in Tile Discharge & Maumee River

National Soil Erosion Research Laboratory
What about our original goal?
y = -344.21x + 692929
0
5,000
10,000
15,000
20,000
25,000
30,000
35,000
40,000
45,000
2002 2004 2006 2008 2010 2012
Atrazine loads (g/mo)
Atrazine loads (g/mo)
Linear (Atrazine loads(g/mo))

National Soil Erosion Research Laboratory
Conclusions - Buffers
• Many buffers along streams serve predominately as setbacks
• Current buffering in watershed reduces TP Loading by ~8%
• Could increase to 50% reduction if all field buffered (Mega $$$)

National Soil Erosion Research Laboratory
Conclusions – Blind Inlets
• Distant fields with risers are directly connected to streams.
• Blind inlets reduce connectivity of contaminants
• Breaking connectivity appears to decrease TP loading to streams during runoff events
National Soil Erosion Research Laboratory
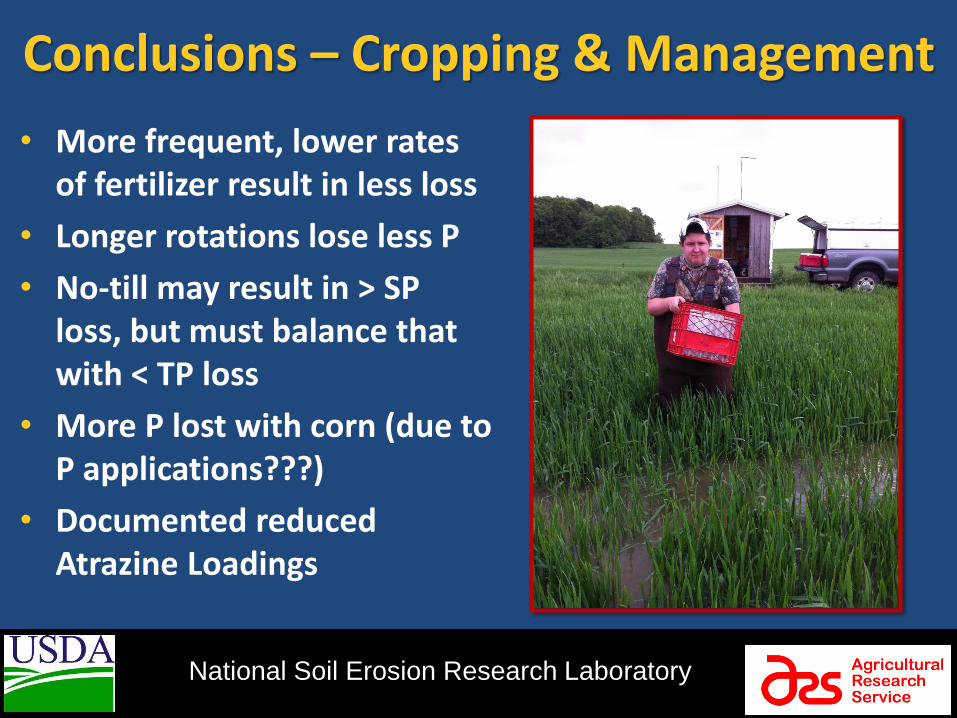
Conclusions – Cropping & Management
• More frequent, lower rates of fertilizer result in less loss
• Longer rotations lose less P
• No-till may result in > SP loss, but must balance that with < TP loss
• More P lost with corn (due to P applications???)
• Documented reduced Atrazine Loadings

National Soil Erosion Research Laboratory
? Questions?