the total economic impact™ of servicenow security operations · forrester makes no assumptions as...
TRANSCRIPT

A Forrester Total Economic Impact™
Study Commissioned by ServiceNow
January 2018
The Total Economic Impact™ Of ServiceNow Security Operations Achieving A 230% ROI By Prioritizing And Resolving Security Incidents And Vulnerabilities Fast

Table of Contents Executive Summary 1
Key Findings 1
TEI Framework and Methodology 4
The Customer Journey 5 Interviewed Organizations 5
Composite Organization 5
Key Challenges 5
Key Results 6
Financial Analysis 7 Increased Efficiency of Security Incident Response 8
Improved Vulnerability Management and Response Times 10
Opex Savings From Discontinuing Legacy Tools 11
Flexibility 12
About ServiceNow Security Operations 13
Appendix A: Total Economic Impact 14
Project Director:
Anish Shah
January 2018
ABOUT FORRESTER CONSULTING
Forrester Consulting provides independent and objective research-based
consulting to help leaders succeed in their organizations. Ranging in scope from a
short strategy session to custom projects, Forrester’s Consulting services connect
you directly with research analysts who apply expert insight to your specific
business challenges. For more information, visit forrester.com/consulting.
© 2018, Forrester Research, Inc. All rights reserved. Unauthorized reproduction
is strictly prohibited. Information is based on best available resources.
Opinions reflect judgment at the time and are subject to change. Forrester®,
Technographics®, Forrester Wave, RoleView, TechRadar, and Total Economic
Impact are trademarks of Forrester Research, Inc. The composite organization is
the trademark of The composite organization Software Corporation, registered in
the United States and certain other countries. All other trademarks are the
property of their respective companies. For additional information, go to
forrester.com.

1 | The Total Economic Impact™ Of ServiceNow Security Operations
Executive Summary
ServiceNow commissioned Forrester Consulting to conduct a Total
Economic Impact™ (TEI) study and examine the potential return on
investment (ROI) from deploying ServiceNow® Security Operations. This
study provides a framework for evaluating the potential financial impact of
investing in ServiceNow to improve security incident and vulnerability
response processes.
Forrester interviewed three customers about their experience using
ServiceNow. Prior to investing in ServiceNow, they spent several man-
hours gathering security event and incident data from multiple sources,
prioritizing and grouping incidents by criticality, identifying the locations of
vulnerable infrastructure assets, and working across cross-functional
teams to remediate issues.
ServiceNow Security Operations helped these customers 1) automate
manually intensive security incident and vulnerability response processes;
2) consolidate alerts from multiple security tools on to a single platform; 3)
quickly map security incidents and vulnerabilities to IT infrastructure; and
4) prioritize and resolve the most critical security incidents and
vulnerabilities first.
Forrester developed a representative or composite organization based on
the customer interviews to highlight the benefits realized from investing in
ServiceNow.
Key Findings
Quantified benefits. The composite organization expects the following
risk-adjusted quantified benefits over three years:
› Increased efficiency of prioritizing and resolving security incidents,
resulting in $4.7 million in benefits. It saw a 30% improvement in the
efficiency with which tier 1 security incidents are handled by front-line
security analysts. It also realized a 50% efficiency increase related to
managing tier 2 and higher security incidents that require coordination
across multiple IT and security resources. These efficiencies are gained
by automating workflows that span security and IT, prioritizing security
incidents based on business criticality, and tracking incidents and
assigning tasks using a single platform.
› Improved vulnerability management and response times, resulting
in $535,000 in benefits. The interviewed customers conduct routine
weekly scans to identify, classify, and prioritize vulnerabilities in their
environments. On average, they identify 100,000 vulnerabilities each
week. Previously, they resorted to manually intensive processes to
group vulnerabilities and have them analyzed by their security teams.
ServiceNow Security Operations allows these customers to
automatically pull all the data from a vulnerability scan into the solution
and then apply rules and logic to identify critical vulnerabilities that need
immediate action. It also links these vulnerabilities to existing assets.
The composite organization saw a 60% improvement in the way in
which it identifies and prioritizes vulnerabilities and assesses the impact
on existing assets. In addition, it realized a 25% improvement in
vulnerability response times by speeding the application of patches and
other remediation efforts with automated workflows.
Key Benefits
Increased efficiency of prioritizing and resolving security incidents:
$4.7 million in savings
Improved vulnerability management and response times:
60% increase
“ServiceNow allows us to be
much more strategic about how
we manage our security
environment. We have reduced
the time to assess the severity of
issues and significantly
improved our security response
times.”
- VP Information Security,
Global Financial Services firm

2 | The Total Economic Impact™ Of ServiceNow Security Operations
Opex savings by eliminating legacy security tools results in
$355,000 in benefits. The composite organization was able to
discontinue software licenses for legacy tools used to manage security
incident response processes. It is estimated that these tools cost the
organization $250,000 each year, and that it would be able to
discontinue and realize these savings beginning in Year 2.
Additional benefits. The composite organization expects to realize the
following additional benefits that were not quantified in the study:
› Improved IT productivity. Previously, its IT resources assisted the
security team by pulling data from multiple sources to identify security
incidents and vulnerabilities. ServiceNow Security Operations provides
the organization with a single platform to consolidate and integrate data
across its environment and route tasks to the right IT and security teams
using automated workflows.
› Better visibility into security posture. Intuitive, real-time dashboards
allow security teams and executives to understand the organization’s
current security posture. These dashboards make it easy to track in-
progress tasks, critical metrics, and key performance indicators (KPIs) to
make business decisions and mobilize resources around the highest
priority security incidents.
› Increased collaboration. ServiceNow Security Operations lets both IT
and security resources assign tasks and collaborate in real time using a
common system. Better collaboration improves security incident and
vulnerability response times.
$4.7M
$535.4K$355.0K
Increased efficiency inmanaging security incidents
Improved vulnerabilitymanagement and response
times
Opex savings related todiscontinuing security incident
management tool
Expected Benefits (Three-Year)
“We did not have consistent
criteria for evaluating credible
threats and were too reliant
on outside partners with poor
service to provide us with
critical security threats. We
were assuming more risk and
susceptible to security and
data breaches. We needed a
solution that would enable us
to take control of security
threats affecting our
business.” - Security Analyst,
Financial Services company
ROI 230%
Benefits PV $5.6 million
NPV $3.9 million
Payback <1 year

3 | The Total Economic Impact™ Of ServiceNow Security Operations
Costs. The composite organization experienced implementation costs and
annual license fees as highlighted below. For confidentiality reasons,
these costs are not quantified in the study (for more information regarding
ServiceNow Security Operations pricing, please contact your ServiceNow
representative):
› Initial implementation and ongoing resource costs. The composite
organization hired a professional services partner to help with the
implementation, as well as the process and system design of
ServiceNow Security Operations within their environment. Within four
months of signing the contract, it had successfully rolled out the solution
and begun realizing the benefits from its investment.
The organization dedicated internal support resources, including project
managers, security analysts, and IT, to gather requirements and collect
the data required to transition to ServiceNow Security Operations. It also
dedicated two full-time equivalents (FTEs) to support and administer the
ServiceNow solution.
› Annual license fees. The composite organization incurs an annual
license fee for ServiceNow Security Operations. This gives it access to
the ServiceNow Security Incident Response application, Vulnerability
Response application, Threat Intelligence applications, Performance
Analytics, dashboards, and communication tools. The annual license fee
also covers routine upgrades and maintenance.
“The ability to give our CSO
and CISO visibility into our
security environment and allow
them to see the risk profile of
our company at any given time
was all the economic
justification we needed to go
with ServiceNow.” - VP Information Security,
Financial Services firm

4 | The Total Economic Impact™ Of ServiceNow Security Operations
TEI Framework and Methodology
Based on the interviews, Forrester has constructed a Total Economic
Impact™ (TEI) framework for those organizations considering
implementing ServiceNow Security Operations.
The objective of the framework is to identify the cost, benefit, flexibility, and
risk factors that affect the investment decision. Forrester took a multistep
approach to evaluate the impact that ServiceNow Security Operations can
have on an organization:
DUE DILIGENCE
Interviewed ServiceNow stakeholders and Forrester analysts to gather data related to ServiceNow Security Operations.
CUSTOMER INTERVIEW
Interviewed three customers using ServiceNow Security Operations to obtain data with respect to the benefits and risks related to investing in ServiceNow Security Operations.
FINANCIAL MODEL FRAMEWORK
Constructed a financial model representative of the interview using the TEI methodology and risk-adjusted the financial model based on issues and concerns of the interviewed organizations.
CASE STUDY
Employed four fundamental elements of TEI in modeling the impact of ServiceNow Security Operations: benefits, costs, flexibility, and risks. Given the increasing sophistication that enterprises have regarding ROI analyses related to IT investments, Forrester’s TEI methodology serves to provide a complete picture of the total economic impact of purchase decisions. Please see Appendix A for additional information on the TEI methodology.
The TEI methodology
helps companies
demonstrate, justify, and
realize the tangible value
of IT initiatives to both
senior management and
other key business
stakeholders.
DISCLOSURES
Readers should be aware of the following:
This study is commissioned by ServiceNow and delivered by Forrester
Consulting. It is not meant to be used as a competitive analysis.
Forrester makes no assumptions as to the potential ROI that other
organizations will receive. Forrester strongly advises that readers use their own
estimates within the framework provided in the report to determine the
appropriateness of an investment in ServiceNow Security Operations.
ServiceNow reviewed and provided feedback to Forrester, but Forrester
maintains editorial control over the study and its findings and does not accept
changes to the study that contradict Forrester’s findings or obscure the
meaning of the study.
ServiceNow provided the customer names for the interviews but did not
participate in the interviews.

5 | The Total Economic Impact™ Of ServiceNow Security Operations
The Customer Journey
Interviewed Organizations
For this study, Forrester interviewed three organizations that have
implemented ServiceNow Security Operations:
*Includes contractors
Composite Organization
Based on interviews with three ServiceNow Security Operations
customers, Forrester constructed a composite organization to highlight
the financial benefits, costs, and associated ROI from implementing
ServiceNow Security Operations. The organization is described below.
› A U.S.-based organization with 10,000 FTEs (includes contractors)
› $1.5 billion in annual revenue
› 500 IT FTEs
› 65 security operations FTEs (analysts and security engineers)
Key Challenges
The composite organization faced the following challenges prior to
investing in ServiceNow Security Operations:
› Manual processes hindered security incident and vulnerability
response times. The organization’s security team was inundated with
alerts and information from multiple tools. Each incident required
manual effort to determine the risk level, business context, and priority.
Once the business criticality and priority of a security incident was
established, coordinating a response across IT and security and
tracking it through to resolution involved inefficient manual processes.
› Limited visibility into security posture. The composite organization
had a number of security products that monitor its environment and
alert it to potential security threats and risks. The security analysts
struggled with consolidating data and metrics across these multiple
products to provide the management team with real-time visibility into
the security posture of the organization.
› High costs associated with manual security response. The
organization spent days assessing each security incident or
vulnerability and then coordinating a remediation plan. In addition,
front-line security analysts were burdened with working on incidents
that could easily be addressed through automation.
INDUSTRY REGION TOTAL EMPLOYEES*
TOTAL SECURITY OPERATIONS EMPLOYEES
Financial services
Global (U.S. headquarters)
13,500
80
Financial services
Global bank (U.S. operations)
1,000
10
Healthcare services
U.S. headquarters
4,200
50
“Our vulnerabilities
management and response
process was archaic at best.
Once we identified a business-
critical vulnerability, the time to
implement and remediate was
often too slow. We had to
identify the vulnerable asset,
get the necessary patches, test
across multiple teams, and then
finally implement the fix. We
have significantly improved our
vulnerability response process
with ServiceNow.” - Security Analyst,
Financial Services company
6 | The Total Economic Impact™ Of ServiceNow Security Operations
Key Results
The interviews revealed the following benefits of investing in
ServiceNow:
› Improved security incident response times. The composite
organization increased the efficiency with which it manages both tier 1
security incidents as well as the more complex tier 2 and higher
incidents after implementing ServiceNow.
› Improved vulnerability management process. It can automatically
pull in data from vulnerability scans into ServiceNow Security
Operations, group vulnerabilities by criticality, and automatically link a
vulnerability to an enterprise asset.
› Intuitive dashboards and reporting delivers real-time visibility into
the security posture. All levels within the organization can track the
status of its security and risk profile at any time.
› Increased communication and coordination between IT and
security teams. A single platform lets the teams communicate, track,
and coordinate security incident and vulnerability response efforts
more effectively.
› Increased automation. The composite organization can now
automate basic tasks, route incidents and vulnerabilities to appropriate
resources, and save audit trails—leading to improved security
operations productivity.
› Opex savings from a single enterprise security response solution.
The composite organization discontinued its legacy tools resulting in
additional savings.

7 | The Total Economic Impact™ Of ServiceNow Security Operations
Financial Analysis
QUANTIFIED BENEFITS AND COSTS FOR THE COMPOSITE ORGANIZATION
Increased efficiency of security incident
response, $4,701,896
Improved vulnerability management and
response times, $535,369
Opex savings from discontinuing legacy tools,
$354,996
three-year total benefits PV
$5.6 million
The table above shows the total of all benefits across the areas listed below, as well as present values (PVs) discounted at 10%. Over three years, the composite organization expects risk-adjusted total benefits of more than $5.6 million (PV).
Total Benefits
REF. BENEFIT YEAR 1 YEAR 2 YEAR 3 TOTAL PRESENT VALUE
Atr Increased efficiency of security incident response
$1,890,702 $1,890,702 $1,890,702 $5,672,106 $4,701,896
Btr Improved vulnerability management and response times
$215,280 $215,280 $215,280 $645,840 $535,369
Ctr Opex savings by discontinuing legacy tools
$0 $225,000 $225,000 $450,000 $354,996
Total benefits (risk-adjusted) $2,105,982 $2,330,982 $2,330,982 $6,767,946 $5,592,262

8 | The Total Economic Impact™ Of ServiceNow Security Operations
Increased Efficiency of Security Incident Response
The biggest benefit was from the increased efficiency in identifying,
prioritizing, and resolving security incidents. ServiceNow Security
Operations integrates with other security tools to consolidate all
security incidents in one place. This allows security analysts to quickly
triage incidents and prioritize the most critical issues. Once a security
incident is identified and classified, a number of next actions are
available: pre-defined automatic responses can be initiated to analyze,
contain, or resolve incidents, others can be routed to front-line security
analysts, and more complex incidents can be sent to specialized teams
to respond. All open threats are tracked using the ServiceNow solution,
enabling quicker coordination around responding to and remediating
security incidents.
The composite organization deals with 1,100 qualified security
incidents each month that require responses. On average, 93% of
these incidents are classified as tier 1 or less complex incidents that
can be handled and resolved by front-line security analysts. Prior to
ServiceNow, the composite organization estimated that front-line
analysts spent approximately two hours responding to each tier 1
incident. By implementing ServiceNow Security Operations, the
organization estimates that response times for these incidents
improved by 30%. Automating responses to recurring incidents allows
security analysts to focus on investigating and remediating the more
complex threats.
Resolving the remaining 7% of security incidents requires greater
coordination across IT and security teams. The composite organization
realized a 50% improvement in response times for these security
incidents. ServiceNow Security Operations lets it easily assign tasks,
hold teams accountable, and coordinate responses across security and
IT teams. Out-of-the-box features of the ServiceNow solution help with
prioritizing and routing security incidents and tasks to the right resources
using automated workflows.
There are several factors that can influence an increased efficiency in
managing security incidents, including:
› The number of security threats affecting an organization.
› The types of security threats affecting an organization.
› The skillsets of IT and security resources.
To account for these factors, Forrester adjusted this benefit downward by
10%, yielding a three-year risk-adjusted total PV of $4.7 million.
30% improvement in tier 1
security incident response
times.
50% improvement in tier 2
(and higher) security
incident response times.
$1.9 million in benefits each
year from improved security
incident response times.

9 | The Total Economic Impact™ Of ServiceNow Security Operations
Increased Efficiency Of Security Incident Response: Calculation Table
REF. METRIC CALC. YEAR 1 YEAR 2 YEAR 3
A1 Average number of qualified security incidents each month
Customer interviews 1,100 1,100 1,100
A2 Number of months 12 12 12
A3 Average number of qualified security incidents each year
Customer interviews 13,200 13,200 13,200
A4
Percentage of qualified security incidents that are tier 1 (can be managed by front-line security analysts)
Customer interviews 93.0% 93.0% 93.0%
A5
Percentage of qualified security incidents that are tier 2 and higher (need external teams’ involvement to remediate)
Customer interviews 7% 7% 7%
A6 Number of tier 1 security incidents each year
A3*A4 12,276 12,276 12,276
A7 Average man-hours to remediate tier 1 security incidents prior to ServiceNow
Customer interviews 2.0 2.0 2.0
A8 Increased efficiency in managing tier 1 security incidents after implementing ServiceNow
Customer interviews 30% 30% 30%
A9 Number of tier 2 or higher security incidents each year
A3*A5 924 924 924
A10 Average man-hours to remediate tier 2 or higher security incidents prior to ServiceNow
Customer interviews 75 75 75
A11 Increased efficiency in managing tier 2 or higher security incidents after implementing ServiceNow
Customer interviews 50% 50% 50%
A12 Average hourly fully burdened rate of a security FTE
Customer interviews $50 $50 $50
At Increased efficiency of security incident response processes
(A6*A7*A8*A12)+ (A9*A10*A11*A12)
$2,100,780 $2,100,780 $2,100,780
Risk adjustment ↓10%
$1,890,702 $1,890,702 $1,890,702

10 | The Total Economic Impact™ Of ServiceNow Security Operations
Improved Vulnerability Management and Response
Times
The composite organization uses vulnerability scanning tools to identify
vulnerabilities across its infrastructure. On average, each weekly scan
generates a list of 100,000 vulnerabilities that it may be susceptible to.
Prior to ServiceNow Security Operations, the organization spent 120
man-hours across its IT and security teams to classify and prioritize
vulnerabilities, and find assets that could be impacted. This effort
primarily involved manual processes and analysis. With ServiceNow
Security Operations, these vulnerabilities get immediately imported into
the solution. They are prioritized by criticality and linked to existing
infrastructure assets. The composite organization estimates a 60%
improvement to this vulnerability management process.
Once the vulnerabilities were identified, the composite organization
developed response plans that included initiating the necessary software
upgrades and applying patches to remediate these threats. Prior to
ServiceNow Security Operations, this process took 80 man-hours per
weekly vulnerability scan. The composite organization estimates a 25%
improvement in vulnerability response times with ServiceNow Security
Operations.
To account for the types and numbers of vulnerabilities, Forrester
adjusted this benefit downward by 10%, yielding a three-year
risk-adjusted total PV of $535,369.
60% improvement in
vulnerability management
and response times.

11 | The Total Economic Impact™ Of ServiceNow Security Operations
Opex Savings From Discontinuing Legacy Tools
With the investment in ServiceNow Security Operations, the composite
organization was able to discontinue its legacy tools. Initially, it ran both
tools in parallel. After the first year, when all the data and integrations
with ServiceNow were in place, the organization discontinued the use
of its legacy tools. It is estimated to save the organization $250,000
each year.
Opex savings can vary by: 1) the number and types of legacy tools that
are discontinued; 2) the contract terms; 3) and when an organization
decides to discontinue license agreements. To account for these risks,
Forrester adjusted this benefit downward by 10%, yielding a
risk-adjusted total PV of approximately $355,000.
$250,000 saved each year
from discontinuing legacy
tools.
Improved Vulnerability Management and Response Times: Calculation Table
REF. METRIC CALC. YEAR 1 YEAR 2 YEAR 3
B1 Average number of vulnerabilities identified per weekly scan
Customer interviews 100,000 100,000 100,000
B2 Number of weeks 52 52 52
B3
Average number of man-hours to classify, prioritize, and link vulnerabilities to assets, per 100,000 vulnerabilities scanned (prior to ServiceNow)
Customer interviews 120 120 120
B4
Improvement in classifying, prioritizing, and linking vulnerabilities to assets, per 100,000 vulnerabilities scanned (with ServiceNow)
Customer interviews 60% 60% 60%
B5 Average number of man-hours spent remediating vulnerabilities per weekly scan
Customer interviews 80 80 80
B6 Improved efficiency in remediating vulnerabilities per weekly scan
Customer interviews 25% 25% 25%
B7 Average hourly fully burdened rate of a security FTE
$50 $50 $50
Bt Improved vulnerability management and response times
{(B1*B2*B3*B4) + (B1*B2*B5*B6)} / 100,000
$239,200 $239,200 $239,200
Risk adjustment ↓10%
Btr Improved vulnerability management and response times (risk-adjusted)
$215,280 $215,280 $215,280

12 | The Total Economic Impact™ Of ServiceNow Security Operations
Flexibility
Flexibility, as defined by TEI, represents the ability to invest in additional
capacity or capabilities in the future that can result in additional business
benefits. It provides an organization with the “right” or the ability to
engage in future initiatives, but not the obligation to do so. There are
multiple scenarios in which an organization might choose to implement
ServiceNow Security Operations and later realize additional uses and
business opportunities. Flexibility should also be quantified when
evaluated as part of a specific project.
Out-of-the-box configuration capabilities and features allow organizations
to integrate ServiceNow Security Operations with other security solutions
and confgure the system to meet their specific needs. Organizations can
quickly add and scale users or modify forms and data tables. The
underlying platform lets organizations easily leverage other ServiceNow
cloud services—for IT Service Management, IT Operations
Management, and HR Service Delivery—as well as rapidly build other
business applications with reusable components.
Opex Savings By From Discontinuing Legacy Tools: Calculation Table
REF. METRIC CALC. YEAR 1 YEAR 2 YEAR 3
C1 Opex savings from discontinuing legacy tools Customer interview
0 $250,000 $250,000
Ct Opex savings from discontinuing legacy tools C1 $0 $250,000 $250,000
Risk adjustment ↓10%
Ctr Opex savings related from discontinuing legacy tools (risk-adjusted)
$0 $225,000 $225,000

13 | The Total Economic Impact™ Of ServiceNow Security Operations
About ServiceNow Security Operations
The following information is provided by ServiceNow. Forrester has not validated any claims and does not
endorse ServiceNow or its offerings.
Security teams are inundated with alerts and information from a growing number of siloed detection solutions. In parallel, attacks via both known and unknown vulnerabilities continuously target critical business services, IT infrastructure, and users. These incidents and vulnerabilities often lack business context, making it difficult to know which ones pose the greatest threat to the organization. Manual processes and cross-team handoffs hinder a security team’s ability to respond effectively. An even more fundamental question for security is, “Are we secure, and are things getting better or worse?” While there is no simple answer, most organizations struggle to establish baseline metrics for their security posture that they can track over time. Combined, these challenges result in missed attacks, which could lead to an eventual breach, as well as detection and response times measured in months.
ServiceNow Security Operations lets organizations connect security and IT teams to respond faster and more efficiently to security incidents and vulnerabilities and get a definitive view of their security posture. It includes the following key components:
• The Security Incident Response application simplifies the identification of critical incidents and provides workflow and automation tools to speed up remediation. Data from existing security point products or Security Information and Event Management Systems (SIEMs) can be imported via APIs or email alerts and are automatically enriched with threat intelligence data. Teams can create customized workflows based on their organization’s own security runbook to ensure company best practices are followed. Once an incident is resolved, a post-incident review is automatically generated.
• The Vulnerability Response application prioritizes vulnerable items and adds business context to help security teams determine if business-critical systems are at risk. By leveraging the ServiceNow configuration management database (CMDB), it can also easily identify dependencies across systems and quickly assess the business impact of changes or downtime. Response teams can leverage the workflow and automation capabilities to remediate vulnerabilities faster. When critical vulnerabilities are found, the solution can automatically initiate an emergency patch approval request. Once approved, orchestration tools can apply the patch and trigger an additional vulnerability scan to ensure the issue has been resolved. This results in a coordinated remediation strategy across teams to address the most critical items quickly.
• The Threat Intelligence application helps incident responders find Indicators of Compromise (IoCs) and hunt for low-lying attacks and threats. ServiceNow supports multiple threat feeds, as well as STIX and TAXII, to incorporate threat intelligence data from a variety of sources. Threat Intelligence allows customers to add their own custom feeds to improve reliability in identifying issues. In addition, IoCs can be sent to third-party threat intelligence tools for additional analysis, which is then stored in the security incident record for easy reference.
• Performance Analytics for Security Operations lets teams create real-time dashboards and reports. It includes built-in key performance indicators (KPIs) and lets teams create additional custom KPIs to improve visibility and confidence around an organization’s security posture and performance.
To learn more about ServiceNow Security Operations, please visit www.servicenow.com/sec-ops
14 | The Total Economic Impact™ Of ServiceNow Security Operations
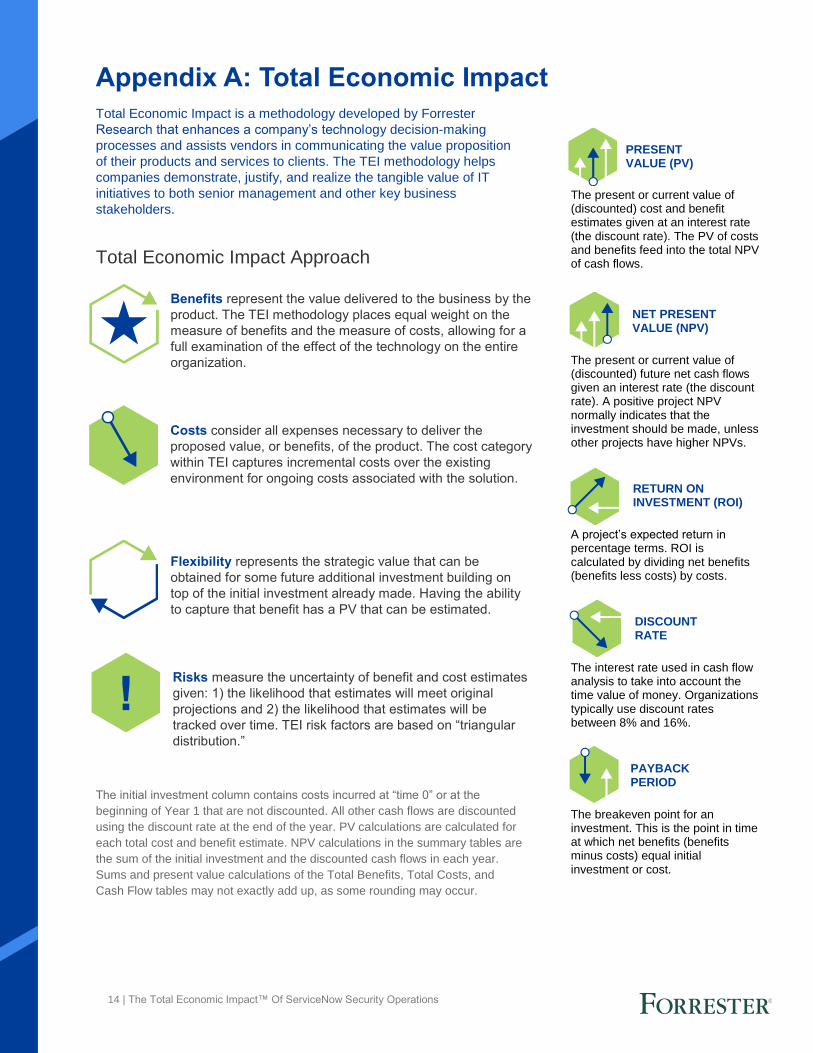
Appendix A: Total Economic Impact
Total Economic Impact is a methodology developed by Forrester
Research that enhances a company’s technology decision-making
processes and assists vendors in communicating the value proposition
of their products and services to clients. The TEI methodology helps
companies demonstrate, justify, and realize the tangible value of IT
initiatives to both senior management and other key business
stakeholders.
Total Economic Impact Approach
Benefits represent the value delivered to the business by the
product. The TEI methodology places equal weight on the
measure of benefits and the measure of costs, allowing for a
full examination of the effect of the technology on the entire
organization.
Costs consider all expenses necessary to deliver the
proposed value, or benefits, of the product. The cost category
within TEI captures incremental costs over the existing
environment for ongoing costs associated with the solution.
Flexibility represents the strategic value that can be
obtained for some future additional investment building on
top of the initial investment already made. Having the ability
to capture that benefit has a PV that can be estimated.
Risks measure the uncertainty of benefit and cost estimates
given: 1) the likelihood that estimates will meet original
projections and 2) the likelihood that estimates will be
tracked over time. TEI risk factors are based on “triangular
distribution.”
The initial investment column contains costs incurred at “time 0” or at the
beginning of Year 1 that are not discounted. All other cash flows are discounted
using the discount rate at the end of the year. PV calculations are calculated for
each total cost and benefit estimate. NPV calculations in the summary tables are
the sum of the initial investment and the discounted cash flows in each year.
Sums and present value calculations of the Total Benefits, Total Costs, and
Cash Flow tables may not exactly add up, as some rounding may occur.
PRESENT VALUE (PV)
The present or current value of (discounted) cost and benefit estimates given at an interest rate (the discount rate). The PV of costs and benefits feed into the total NPV of cash flows.
NET PRESENT VALUE (NPV)
The present or current value of (discounted) future net cash flows given an interest rate (the discount rate). A positive project NPV normally indicates that the investment should be made, unless other projects have higher NPVs.
RETURN ON INVESTMENT (ROI)
A project’s expected return in percentage terms. ROI is calculated by dividing net benefits (benefits less costs) by costs.
DISCOUNT RATE
The interest rate used in cash flow analysis to take into account the time value of money. Organizations typically use discount rates between 8% and 16%.
PAYBACK PERIOD
The breakeven point for an investment. This is the point in time at which net benefits (benefits minus costs) equal initial investment or cost.