the thermal regime of santa maria province, california ... thermal regime of santa maria province,...
TRANSCRIPT

The Thermal Regime ofSanta Maria Province, California
Phosphorus Geochemistry, Diagenesis, andMass Balances of the Miocene Monterey Formationat Shell Beach, California
Geophysical section offshore Santa Maria basin
Geologic section onshore Santa Maria basin
U.S. GEOLOGICAL SURVEY BULLETIN 1995-F,G

AVAILABILITY OF BOOKS AND MAPS OF THE U.S. GEOLOGICAL SURVEY
Instructions on ordering publications of the U.S. Geological Survey, along with prices of the last offerings, are given in the current- year issues of the monthly catalog "New Publications of the U.S. Geological Survey." Prices of available U.S. Geological Survey publications released prior to the current year are listed in the most recent annual "Price and Availability List." Publications that are listed in various U.S. Geological Survey catalogs (see back inside cover) but not listed in the most recent annual "Price and Availability List" are no longer available.
Reports released through the NTIS may be obtained by writing to the National Technical Information Service, U.S. Department of Commerce, Springfield, VA 22161; please include NTIS report number with inquiry.
Order U.S. Geological Survey publications by mail or over the counter from the offices given below.
BY MAIL OVER THE COUNTER
Books
Professional Papers, Bulletins, Water-Supply Papers, Tech niques of Water-Resources Investigations, Circulars, publications of general interest (such as leaflets, pamphlets, booklets), single copies of Earthquakes & Volcanoes, Preliminary Determination of Epicenters, and some miscellaneous reports, including some of the foregoing series that have gone out of print at the Superin tendent of Documents, are obtainable by mail from
U.S. Geological Survey, Map DistributionBox 25286, MS 306, Federal Center
Denver, CO 80225
Subscriptions to periodicals (Earthquakes & Volcanoes and Preliminary Determination of Epicenters) can be obtained ONLY from the
Superintendent of DocumentsGovernment Printing Office
Washington, DC 20402
(Check or money order must be payable to Superintendent of Documents.)
Maps
For maps, address mail orders to
U.S. Geological Survey, Map DistributionBox 25286, BIdg. 810, Federal Center
Denver, CO 80225
Residents of Alaska may order maps from
U.S. Geological Survey, Earth Science Information Center101 Twelfth Ave., Box 12
Fairbanks, AK 99701
Books and Maps
Books and maps of the U.S. Geological Survey are available over the counter at the following U.S. Geological Survey offices, all of which are authorized agents of the Superintendent of Docu ments.
ANCHORAGE, AIaska^230 University Dr., Rm. 101
LAKEWOOD, Colorado Federal Center, Bldg. 810
MENLO PARK, California Bldg. 3, Rm. 3128, 345 Mid- dlefield Rd.
RESTON, Virginia National Center, Rm. 1C402, 12201 Sunrise Valley Dr.
SALT LAKE CITY, Utah Federal Bldg., Rm. 8105, 125 South State St.
SPOKANE, Washington U.S. Post Office Bldg., Rm. 135, W 904 Riverside Ave.
WASHINGTON, D.C. Main Interior Bldg., Rm. 2650, 18th and C Sts., NW.
Maps Only
Maps may be purchased over the counter at the U.S. Geologi cal Survey offices:
FAIRBANKS, Alaska New Federal Building, 101 Twelfth Ave.
ROLLA, Missouri 1400 Independence Rd.
STENNIS SPACE CENTER, Mississippi Bldg. 3101

The Thermal Regime ofSanta Maria Province, California
By COLIN F. WILLIAMS, S. PETER GALANIS, JR., FREDERICK V. GRUBB, and THOMAS H. MOSES, JR,
Phosphorus Geochemistry, Diagenesis,and Mass Balances of the Miocene MontereyFormation at Shell Beach, California
By GABRIEL M. FILIPPELLI and MARGARET L. DELANEY
Chapters F and G are issued as a single volume and are not available separately
U.S. GEOLOGICAL SURVEY BULLETIN 1995
EVOLUTION OF SEDIMENTARY BASINS/ONSHORE OIL AND GAS INVESTIGATIONS- SANTA MARIA PROVINCE
Edited by Margaret A. Keller

U.S. DEPARTMENT OF THE INTERIOR
BRUCE BABBITT, Secretary
U.S. GEOLOGICAL SURVEY
Gordon P. Eaton, Director
Any use of trade, product, or firm namesin this publication is for descriptive purposes onlyand does not imply endorsement by the U.S. Government
Text and illustrations edited by James W. Hendley II
UNITED STATES GOVERNMENT PRINTING OFFICE, WASHINGTON : 1994
For sale byU.S. Geological Survey, Map Distribution Box 25286, MS 306, Federal Center, Denver, CO 80225
Library of Congress Cataloging in Publication Data
The thermal regime of Santa Maria Province, California / by Colin F. Williams ... [et al.]. Phosphorus geochemistry, diagenesis, and mass balances of the Miocene Monterey Formation at Shell Beach, California / by Gabriel M. Filippelli and Margaret L Delaney.
p. cm. (U.S. Geological Survey bulletin ; 1995-f-g) (Evolution of sedimentary basins/onshore oil gas investigations Santa Maria Province ; ch. F-G)
Includes bibliographical references.Supt. of Docs. no. : I 19.3:1995 F, G1. Terrestrial heat flow California Santa Maria Basin Measurement.
2. Geology, Stratigraphic Miocene. 3. Geochemistry California Shell Beach (Pismo Beach). 4. Phosphorus compounds. 5. Monterey Formation (Calif.) I. Williams, Colin F. II. Delaney, Margaret L. III. Filippelli, Gabriel M. Phosphorus geochemistry, diagenesis, and mass balances of the Miocene Monterey Formation at Shell Beach California. 1994. IV. Title: Phosphorus geochemistry, diagenesis, and mass balances of the Miocene Monterey Formation at Shell Beach, California. V. Series. VI. Series: Evolution of sedimentary basins/onshore oil and gas investigatino Santa Maria Province ; ch. F-G.QE75.B9 no. 1995-F-G 557.3 s dc20[551.1'4] 94-27960
CIP

Chapter F
The Thermal Regime ofSanta Maria Province, California
By COLIN F. WILLIAMS, S. PETER GALANIS, JR., FREDERICK V. GRUBB, and THOMAS H. MOSES, JR,
U.S. GEOLOGICAL SURVEY BULLETIN 1995
EVOLUTION OF SEDIMENTARY BASINS/ONSHORE OIL AND GAS INVESTIGATIONS- SANTA MARIA PROVINCE
Edited by Margaret A. Keller

CONTENTS
Abstract Fl Introduction Fl Geologic setting F2 Temperature data F4 Thermal conductivity data F7
Conductivity of the Gaviota Formation, Rincon Mudstone, and basement rocks F7Conductivity of the Monterey Formation F9Conductivity of the Sisquoc Formation FllConductivity of the Foxen Mudstone FllConductivity of the Careaga Sandstone and the Paso Roles Formation (part) FllAnisotropy Fll
Heat flow F13 Local disturbances to the thermal regime F16
Shallow ground-water disturbances F16Erosion F19
Heat flow in a regional context F19Upper crustal disturbances F10Extension and basin formation Fll
Conclusions Fll References F13
FIGURES
1. Location map of a portion of Santa Maria province, showing major faults, oil fields, and general locations of heat-flow sites Fl
2. Map of onshore Santa Maria basin, showing major synclines and anticlines, oil fields, wells logged for temperature, and wells sampled for thermal conductivity
F33. North-south cross section through onshore Santa Maria basin, showing structure
and stratigraphy of basin relative to major oil fields F34. Temperature logs from West Santa Maria Valley, Guadalupe, Cat Canyon, and Or-
cutt Hill Oil Fields F45. Temperature logs from Santa Maria Valley Oil Field F56. Commercial temperature logs from Cat Canyon Oil Field F57. Temperature logs from the Point Conception, Lompoc, and Zaca Oil Fields F68. Temperature logs from Point Arguello Oil Field F69. Temperatures, temperature gradients, and calculated interval heat flow for the
BD06well F610. A, Bulk thermal conductivities measured on basement-rock samples and plotted
versus depth. B, Histogram of these conductivities F911. A, Bulk thermal conductivities of Monterey Formation samples plotted versus
depth. B, Histogram of these bulk conductivities. C, Matrix thermal conductivities of Monterey samples plotted versus depth. D, Histogram of these matrix conductivities F9
12. A, Bulk thermal conductivities of Sisquoc Formation samples plotted versus depth. B, Histogram of these bulk conductivities. C, Matrix thermal conductivities of Sisquoc samples plotted versus depth. D, Histogram of these matrix conductivities Fll
IV Contents

13. A, Matrix thermal conductivities from Foxen Mudstone plotted versus depth divid ed by unit thickness for each sample well. B, Histogram of conductivities from upper part of Foxen Mudstone. C, Histogram of conductivities from lower part of Foxen Mudstone F12
14. A, Matrix thermal conductivities from Paso Robles Formation and Careaga Sand stone plotted versus depth. B, Histogram of these matrix conductivities F13
15. Ground-water-level contours (in meters above sea level) for Santa Maria Valley, along with the location of major oil fields and logged wells F17
16. Cross section B-B 1 (figure 15) showing the approximate path of ground-water flow in the Santa Maria Valley and its relationship to formations and in situ temperatures F17
17. Comparison of modeled temperatures derived from equation (9) with measured temperatures along flow path shown in figures 15 and 16 F18
18. Conductive heat flow in Santa Maria province, along with published heat-flow values for southern and central California F20
19. A, Normalized heat flow for Santa Maria province over time for one-dimensional extension using the model of McKenzie (1978) for an initial lithospheric thickness of 50 km and various values for stretching factor, 8. B, Normalized heat flow over time for an initial lithospheric thickness of 60 km F22
TABLES
1. Santa Maria province wells with temperature data F52. Thermal conductivity sample wells F83. Bulk and matrix conductivity by stratigraphic unit F84. Santa Maria Province heat flow F14
Contents


The Thermal Regime of Santa Maria Province, California
By Colin F. Williams, S. Peter Galanis, Jr., Frederick V. Grubb, and Thomas H. Moses, Jr.
Abstract
Equilibrium temperature logs have been recorded in 27 idle oil wells in the onshore Santa Maria, offshore Santa Maria, and western Ventura basins. Thermal conductivities have been measured on 365 core and cuttings samples from an additional 26 wells in the region. From these data, con ductive heat-flow values have been determined for the Guad- alupe, Santa Maria Valley, Cat Canyon, Orcutt Hill, Lompoc, Zaca, Point Conception, and Point Arguello Oil Fields. Exam ination of these thermal data reveals a complex combination of advective and conductive processes dominating heat trans fer within the province. Over much of the Santa Maria Valley, temperature gradients in the Pliocene to Pleistocene Careaga Sandstone, Paso Robles Formation, and Orcutt Sand are depressed to nearly isothermal values. Geologic constraints and simple analytical models suggest that shallow ground- water flow accounts for most (if not all) of the heat loss within these shallow sediments. Temperature profiles in the older, underlying Foxen Mudstone, Sisquoc Formation, and Monte- rey Formation are linear and yield conductive heat-flow val ues that are relatively constant with depth. Corrected heat- flow determinations for the deeper units vary from 73 to 106 milliwatts per square meter (mW/m2 ), with an average of 84 mW/m2 for the entire region. These values are typical of the Coast Range heat-flow high to the north and contrast sharply with low heat flow (45 to 50 mW/m2) in the central Ventura basin to the south. Identification of Santa Maria heat flow with the Coast Range high extends the southern boundary of the high and provides compelling evidence for the persistence of high heat flow at least 20 m.y. after cessation of subduction and the establishment of the transform margin. This suggests that the Coast Range high did not develop solely from asthe- nospheric upwelling in the wake of triple junction passage but may have arisen from a combination of sources within the crust and upper mantle.
INTRODUCTION
Heat-flow studies in California have provided valuable insights into the tectonics of the San Andreas Fault system (Lachenbruch and Sass, 1980), the nature and evolution of
Manuscript approved for publication, June 21,1994.
the Sierra Nevada (Saltus and Lachenbruch, 1991), the development of the Salton Trough (Lachenbruch and others, 1985), and many other topics related to active and ancient geologic processes. In spite of these many achievements, the state's sedimentary basins remain relatively unexplored and unexplained by thermal studies. Of the more than 500 published heat-flow measurements from California, fewer than 40 are from the petroleum-producing basins, even though these basins cover more than 25 percent of the state's surface area. This shortcoming is magnified by the fact that heat-flow measurements in sedimentary basins not only provide the same tectonic constraints provided by measurements in crystalline basement rocks but also yield unique information on the conditions for sediment matura tion and petroleum generation.
One reason for the paucity of measurements from basins is the poor quality of thermal data typically avail able from oil and gas wells, in particular with the well- documented problem of determining geothermal gradients from bottom-hole temperature (BHT) data (for example, Beck and Balling, 1988). These problems can be avoided through continuous temperature logging of equilibrated, idle wells; examples of heat-flow measurements in idle oil wells have been published sporadically over the years (for example, Benfield, 1947; Sass, Lachenbruch, Munroe and others, 1971). The recent paper by De Rito and others (1989) on heat flow in the central Ventura basin was the initial product of an effort by the U.S. Geological Survey (USGS) Geothermal Studies Project to apply these stand ard heat-flow techniques in a systematic study of heat flow in sedimentary basins. This paper reports heat-flow results from a second study area the Santa Maria province.
A thermal investigation of the Santa Maria province is of interest for a number of reasons. With its location at the transition between the southern Coast Ranges and the west ern Transverse Ranges, the Santa Maria province (fig. 1) is a link between two regions of contrasting tectonics and heat flow (Lachenbruch and Sass, 1980; De Rito and others, 1989). As such, the province serves as an excellent location for testing current ideas regarding the relationship between present-day heat flow and late Tertiary evolution of the San Andreas transform margin. The importance of regional fluid flow to the thermal state of many sedimentary basins
The Thermal Regime of Santa Maria Province, California F1

has been recognized in recent years (for example, Hitchon,1984), and California basins have been identified as possi ble sinks for fluid flowing away from the San Andreas Fault zone (Williams and Narasimhan, 1989). Thermal studies in California basins should reveal the magnitude and nature of any pervasive ground-water flow. Finally, the nature and timing of petroleum generation in the Monterey Formation, which is both an important reservoir and the primary source rock for the Santa Maria and many other California basins, has received extensive attention in the past decade. Matura tion history models (for example, Heasler and Surdam,1985) and exploration strategies may benefit significantly from a thorough understanding of regional geothermal gra dients, yet the only published thermal data from the Santa Maria region are the BHT data of French (1940).
The following sections detail the temperature and thermal properties data collected from the Santa Maria province, the resulting heat-flow values, the nature and magnitude of advective and transient disturbances to the thermal regime, and the resulting implications for the rela tionship between heat flow in the Santa Maria province and the tectonic history of Central California.
35° 00'
34° 30'
Pacific
Ocean
Point Arguello Point Conception
10km
120° 30'
Figure 1. Location map of a portion of Santa Maria province, showing major faults (dashed where approximate), oil fields (hachured areas), and general locations of heat-flow sites (solid circles). Approximate extents of the onshore Santa Maria basin (northern shaded region) and western Ventura basin (southern shaded region) are also shown. Point Arguello Oil Field lies in offshore Santa Maria basin. Fault abbrevia tions are SMVF, Santa Maria Valley Fault; WHF, West Huasna Fault; EHF, East Huasna Fault; NF, Nacimiento Fault; SF, Suey Fault; P-CF, Pezzoni-Casmalia Fault; LHF, Lions Head Fault; LPF, Little Pine Fault; BPF, Big Pine Fault; LF, Lompoc Fault (modified from Hall, 1981; McLean, 1991).
GEOLOGIC SETTING
The Santa Maria province, as defined by Crawford (1971), is composed of the Huasna-Pismo basin, Santa Maria basin (both onshore and offshore), and Cuyama basin. The Santa Maria province and vicinity has been the subject of a large number of geologic studies, and relevant information on many topics not treated here can be found in other papers of this volume or Heilbrunn-Tomson (1988). This study is concerned with thermal measurements in a portion of the Santa Maria province (the onshore and off shore Santa Maria basin) and the oil fields of the western Ventura basin (fig. 1). These basins are among the many Cenozoic basins that developed along the California conti nental margin during and after the cessation of subduction in the Miocene (Atwater, 1970; Lonsdale, 1991).
The onshore Santa Maria basin occupies a wedge- shaped region of approximately 1,800 km2 (figs. 1 and 2) between the Coast Ranges and the Transverse Ranges. Sedi ment thicknesses reach 5 km in places, although basinwide the average is no more than 2 to 3 km. The major structural features of the basin are three anticlinal trends (figs. 2 and 3) and the associated faults (figs. 1 and 3). Although the history of deformation on these faults is the subject of some contro versy, convergence and transform motion have clearly pre dominated since the middle Pliocene (Namson and Davis, 1990). The anticlinal, homoclinal, and stratigraphic traps created by this and earlier deformation have yielded more than 900 million barrels of oil, primarily from the Miocene Monterey Formation (MacKinnon, 1989).
The stratigraphy of the onshore Santa Maria basin as it applies to this study (fig. 3; Woodring and Bramlette, 1950; Dibblee, 1950; Isaacs, 198la; Namson and Davis, 1990) can be summarized as follows:Basement rocks A series of Mesozoic rocks underlying the
entire Santa Maria province, with components including the Great Valley sequence, Franciscan assemblage, and ophiolitic rocks (McLean, 1991).
Lospe Formation Early Miocene, nonmarine red to gray conglomerates, sandstones, and mudstones with inter- bedded tuffs. The Lospe lies unconformably atop the basement assemblage and is limited to the central por tion of the basin.
Point Sal Formation Early Miocene, deep-marine sand stones and silty shales confined to the onshore Santa Maria basin and representative of rapid subsidence early in the basin history.
Monterey Formation Early, middle, and late Miocene, deep-marine, laminated fine-grained siliceous and dolo- mitic rocks, which serve as both source and -primary reservoir for oil fields in the region.
Sisquoc Formation Late Miocene and early and middle Pliocene, fine-grained, marine siliceous rocks, primarily diatomaceous and porcelaneous mudstones with local siltstone and sandstone beds.
F2 Evolution of Sedimentary Basins/Onshore Oil and Gas Investigations Santa Maria Province

35° 00' '
34° 45' -
120° 30' 120° 15'
Figure 2. Map of onshore Santa Maria basin, showing major synclines and anticlines (from Namson and Davis, 1990), oil fields (hachured areas), wells logged for temperature (solid circles), and wells sampled for thermal conductivity (solid squares). Section A-A" shown in figure 3.
Lompoc Oil Field
Orcutt Oil Field
^^^^^^ 1 ^t^l^^^^Bi
Santa Maria Valley Oil Field
Orcutt - ̂
A'
Northm I Ml -^ r ~^. f
QrmfVi oouin ^^*rr^\r>^~^ -*g^ v*"'trVTv- orcutt-v.^ ___
'Vv----?-"*?^' |\ \ \'f"^'/'/~1[ 'Uhxt\ PasoRobles ,^'V1 \\ ̂ cSre-agaX" '» \ \ V x' / / ' /T^A^, , '>' '*
> \\ " ' /~Vf\l \ ^Careaga/ , I//< l| ^Foxen-----' ,^ " ,'/V v \ ,,. / Nl \l \ x. / ' I ' J I M ' N Cai-caga,^" st\\\x-, sisquoc -' ,*($ \ - / '-/.if^in^ s/\K:^S% \7 /^/fjii.....^/^ ̂I Point Sal ^< -^- x vT V\ / 7 /X " T I .7l r, /I |/V "-Monterey
i ' V\ \ / ' ' ilk III Sisquoc / t\f/<
Jir ' fy \ . ' / /' Iv 1 v1" 'f ---" X ''/// *jll'i M Franciscan Complex \A \ SlsqUOC , / / \ LH'I» "' ^/'Ilty
5km0
^\\ X^-X// / / /
\» \ Monterey . / /v\\..// /^ V Pnint Sol t i^ Point Sal / /
/
J-1 km\ Lospe Franciscan Complex
Figure 3. North-south cross section through onshore Santa Maria basin, showing structure and stratigraphy of basin relative to major oil fields (from California Division of Oil and Gas, 1974). Complete unit names are: Careaga Sandstone, Foxen Mudstone, Lospe Formation, Monterey Formation, Orcutt Sandstone, F'aso Robles Formation, F'oint Sal Formation, Sisquoc Formation. Faults are heavy dashed lines; arrows show direction of relative movement.
The Thermal Regime of Santa Maria Province, California F3

Foxen Mudstone Middle and late Pliocene, shallow- marine mudstones and siltstones with fine-grained sand stone common in the upper sections of the formation.
Careaga Sandstone Late Pliocene, shallow-marine sand stones traditionally divided into a lower fine-grained sandstone and an upper coarse-grained sandstone and conglomerate. Commonly poorly lithified.
Paso Robles Formation (part) and Orcutt Sand In the Santa Maria basin, late Pliocene to Pleistocene, nonmarine sands, gravels, and clays, typically poorly consolidated and highly porous, which overlie the Careaga Sandstone.
For the sedimentary section found in the offshore Santa Maria basin region (specifically the Point Arguello field), stratigraphic equivalents to the above units have been identi fied (Grain and others, 1985; Nicholson and others, 1992). The primary differences in the offshore section compared to the onshore section are (1) the presence of thick (1,000+m) sequences of Cretaceous and Paleogene sandstones and shales overlying the basement rocks, (2) the appearance of the early Miocene Tranquillon Volcanics of Dibblee (1950) in the stratigraphic position of the Lospe Formation, (3) a thicker Miocene and younger sedimentary sequence, with the top of the Monterey Formation found more than 2 km below the sea floor, (4) the common use of different nomen clature for strata overlying the Monterey Formation (for example, the lower part of the Sisquoc Formation equivalent as the Santa Margarita Formation and the upper part of the Sisquoc Formation and Foxen Mudstone equivalents as the Pico Formation) (Grain and others, 1985), and (5) the pres ence of undifferentiated shallow-marine sandstone, silt- stone, and shale in the stratigraphic position of the Careaga Sandstone, Paso Robles Formation and Orcutt Sand.
In the western Ventura Basin (Point Conception field), the Monterey Formation is underlain by a thick sequence of Cretaceous through early Miocene sedimentary rocks. Two of these formations are relevant to this study: Gaviota Formation (part; Dibblee, 1950) Oligocene, shal
low marine sequence of sandstones and siltstones. Rincon Mudstone Oligocene and early Miocene, poorly
bedded to massive claystones or mudstones.
TEMPERATURE DATA
The production of oil and gas from depth disturbs the thermal equilibrium of a well, so the successful study of heat flow requires that the well be idled over a period of time long enough for temperatures to return to near-equilib rium values. As a practical matter, this is generally an inter val at least twice as long as the original period of production (see Lachenbruch and Brewer (1959) for a detailed discus sion of the decay of thermal disturbances in boreholes). In the Santa Maria province, economic considerations dictated that many wells drilled in the early 1980's were either never produced or shut-in soon after completion. In addition, the
operational difficulties associated with petroleum produc tion (for example, collapsed casing, high H2S contents, high water cuts) have idled many wells since the beginning of large-scale production in the 1930's. Taken together, these two oil industry problems have provided a large number of wells suitable for thermal studies.
With the cooperation of production companies, the USGS gained access to and measured temperatures in 30 idle oil wells in the Guadalupe, Santa Maria Valley, Cat Canyon, Orcutt, Lompoc, Zaca, Point Conception, and Point Arguello oil fields (figs. 1 and 2). The USGS also obtained commercial temperature logs from 19 additional wells. Of these 49 logs, 27 (23 USGS and 4 commercial) were considered of sufficient quality to use for heat-flow determinations. The basic information on each well is sum marized in table 1, and the data are shown in figures 4 to 9.
Although each temperature profile displays unique characteristics, it is possible to make some general obser vations regarding temperature data from each region of the Santa Maria province. In the onshore Santa Maria basin, mean ground-surface temperatures range between 12 and 18°C, with a fairly consistent trend of lower temperatures near the coastline and higher temperatures in the interior valleys. Temperatures in the upper 200 to 400 m often show significant departures from linearity, and these devia tions are typically the result of ground-water flow in the near-surface sediments (see the section "Shallow Ground- Water Disturbances" below), depressed fluid levels, or temporal variations in surface temperature.
Temperature gradients are generally consistent with a rough division of the stratigraphic units into two groups: those with disturbances and (or) low gradients and those with consistently high gradients. The temperature profile in figure
40 60 80
400
800
1200
1600
SG44
20 40 60
TEMPERATURE. IN DEGREES CELSIUS
80
Figure 4. Temperature logs from West Santa Maria Valley (SMV), Guadalupe, Cat Canyon, and Orcutt Hill Oil Fields. Tempera tures are offset for presentation by the following amounts: SG44, -8°C; LYP6, 0°C; LYQ5, +8°C; TUN8, +20°C; LA68, +24°C; PL12, +32°C. See figures 1 and 2 for well locations.
F4 Evolution of Sedimentary Basins/Onshore Oil and Gas Investigations Santa Maria Province

Table 1. Santa Maria Province wells with temperature data
[See figures 1 and 2 for well locations. TRS, township, range, and section; Log T.D., temperature log total depth; Elev, elevation above sea level]
Field Operator
Guadalupe Unocal
Santa Maria Valley Unocal
Cat Canyon Unocal
Texaco
Orcutt Hill Unocal
Lompoc Unocal
Zaca Texaco
Pt. Conception Unocal
Pt. Arguello Texaco
Well
Le Roy P6
Le Roy Q5
Union Sugar 44
Vincent 15
Battles 8
Calif. Lands 1
Wylie 2
Bradley 1-6
Bradley I- 10
Bell 83
Bell 133
Bell 165
Blochman 29
Tunnell 8A
Los Alamos 68
Final 12
Purisima 34
Purisima 39
Luton 113
State 10-6
State 13-6
State 15-6
Pt. Arguello 1
Pt. Arguello 2
Pt. Arguello 3
Pt. Arguello 4
Pt. Arguello 5
Code
LYP6
LYQ5
SG44
VN15
BT08
CL01
WY02
BD06
BD10
BL83
B133
B165
BH29
TUNS
LA68
PL12
PU34
PU39
LUTN
PC10
PC13
PC15
PA1
PA2
PAS
PA4
PAS
Latitude(N)
34°59.9'
34°59.3'
34°55.9'
34°55.1'
34°55.2'
34°54.9'
34°54.7'
34°54.7'
34°54.7'
34°49.0'
34°49.1'
34°49.4'
34°50.0'
34°52.7'
34°48.2'
34°50.2'
34°42.7'
34°42.1'
34°44.4'
34°26.7'
34°26.7'
34°27.1'
34°28.2'
34°28.2'
34°28.2'
34°28.2'
34°28.2'
Longitude (W)
120°36.3'
120°36.2'
120°29.7'
120°24.3'
120°24.2'
120°23.7'
120°23.8'
120°24.9'
120°25.0'
120°19.4'
120°19.6'
120°19.4'
120°19.4'
120°19.0'
120°18.3'
120°24.9'
120°26.1'
120°26.5'
120°10.2'
120°27.5'
120°27.5'
120°28.0'
120°40.9'
120°40.9'
120°40.9'
120°40.9'
120°40.9'
TRS Log T.D. (m)
UN 35W Sec 32
UN 35W Sec 34
ION 34W Sec 19
ION 34W Sec 25
ION 34W Sec 25
ION 33W Sec 30
ION 33W Sec 30
ION 34W Sec 25
ION 34W Sec 25
9N 33W Sec 35
9N 33W Sec 35
9N 33W Sec 26
9N 33W Sec 26
9N 33W Sec 11
8N 33W Sec 1
9N 34W Sec 24
7N 34W Sec 2
7N 34W Sec 15
8N 31W Sec 29
4N 34W Sec 8
4N 34W Sec 8
4N 34W Sec 8
N/A
N/A
N/A
N/A
N/A
830
771
1477
745
674
1061
945
1241
956
869
914
747
786
762
662
288
693
817
503
824
912
976
1804
1866
1693
2460
2225
Elev (m)
44
21
56
87
91
97
116
82
81
341
340
293
232
138
259
228
152
119
327
9
9
40
-206
-206
-206
-206
-206
20
400
800
1200
1600
40 60 80
BD10
VN15
CL01
BD06
20 40 60
20 40 60
TEMPERATURE, IN DEGREES CELSIUS
80
400
800
1200
1600
80
BL83 B133
Figure 5. Temperature logs from Santa Maria Valley Oil Field. Temperatures are offset for presentation by the follow ing amounts: BD10, -8°C; BD06, 0°C; WYL2, +8°C; CL01, +16°C; BT08, +24°C; VN15, +32°C. See figures 1 and 2 for well locations.
20 40 60
TEMPERATURE, IN DEGREES CELSIUS
80
Figure 6. Commercial temperature logs from Cat Canyon Oil Field. Temperatures are offset by the following amounts: B165, -14°C; BK29, 0°C; BL83, +7°C; B133, +18°C. See fig ures 1 and 2 for well locations.
The Thermal Regime of Santa Maria Province, California F5

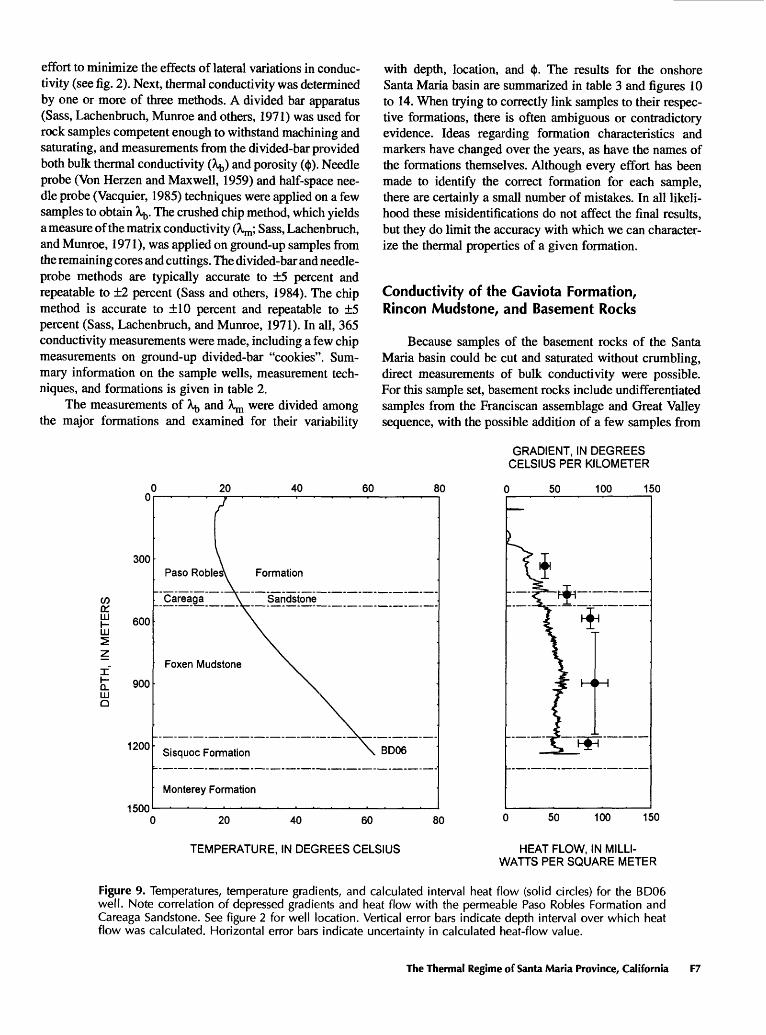
9 provides an illustration of this for the Santa Maria Valley field. In the absence of obvious disturbances, temperature gradients in the younger sediments of the Careaga Sandstone, Paso Robles Formation, and Orcutt Sand generally range between 20 and 40°C/km. Taken together, these units are approximately 400 to 600 m thick in the Guadalupe and Santa Maria Valley fields but are often absent or greatly attenuated in other areas (Worts, 1951; Dibblee, 1950; Woo- dring and Bramlette, 1950). Profiles in the older mudstones, siltstones, and shales of the Monterey Formation, Sisquoc Formation, and Foxen Mudstone are remarkably linear, with
20 40 60 80
400
800
1200
1600
LUTN
PC10PC13 PC15
20 40 60
TEMPERATURE, IN DEGREES CELSIUS
80
Figure 7. Temperature logs from the F'oint Conception, Lom- poc, and Zaca Oil Fields. Temperatures are offset by the fol lowing amounts: PC10, -18°C; PC13, -12°C; PC15, -4°°C; PU34, +12°C; PU39, +12°C; LUTN, +36°C. See figures 1 and 2 for well locations.
40 80 120 160
1000
2000
3000
PA4 PAS
40 80 120
TEMPERATURE, IN DEGREES CELSIUS
160
Figure 8. Temperature logs from Point Arguello Oil Field. Temperatures are offset by the following amounts: PA4, -8°C; PA1, 0°C; PA3, +12°C; PAS, +20°C; PA2, +32°C. See figure 1 for well locations.
gradients ranging between 45 and 60°C/km, although dis turbances at the levels of producing zones are common. (These disturbances reflect communication with nearby pro ducing wells and typically do not affect thermal equilibrium in the overlying sections of an idle well.) As with the shallow Pliocene and Pleistocene sediments, these formations vary in thickness and character throughout the basin. The Foxen Mudstone occupies more than half of the logged intervals in the data from the Guadalupe, Santa Maria Valley, and Zaca fields, whereas most of the temperature data for Orcutt, Lompoc, and Cat Canyon fields are from the Sisquoc For mation. In the Point Conception wells, the primary logged units are the Gaviota Formation and the Rincon Mudstone, and in the Point Arguello field the data cover the offshore sedimentary section from the Monterey and Sisquoc reservoir rocks up through the offshore stratigraphic equivalents of the Foxen, Careaga, and Paso Robles (Grain and others, 1985). Measured temperatures are not available for the Point Sal Formation, Lospe Formation, or basement rocks.
THERMAL CONDUCTIVITY DATA
In the absence of advective or radiative disturbances to the thermal field, the vertical component of conductive heat flow can be calculated from the equation
(1)
where 9779z is the vertical temperature gradient, X is the thermal conductivity, and q is the heat flow. Ideally, accurate temperature and thermal conductivity data are available from a combination of precision well logging and continuous coring in the same well. In reality, for the Santa Maria province and other sedimentary basins, core samples are available from only a fraction of the total number of wells, and the sampled wells are generally not those idled and later logged for temperature. This substantially increases the uncertainty of heat-flow determinations unless a systematic, quantifiable method can be used to combine the two data sets.
The development of an adequate method must address two critical components of porous rock conductivity min eralogy and porosity (Horai, 1971; Sass, Lachenbruch, and Munroe, 1971). Changes in both mineralogy and porosity have a significant impact on the bulk thermal conductivity, and studies that rely on combining measurements from dif ferent locations must account for possible variations in these components. In a sedimentary basin, facies changes and varying compaction trends are probably the most sig nificant sources of mineralogy and porosity changes.
For the present study, the following steps were taken for determining the values of thermal conductivity appropri ate for each logged well. First, wherever possible, samples were taken from wells within 2 km of logged wells in an
F6 Evolution of Sedimentary Basins/Onshore Oil and Gas Investigations Santa Maria Province
effort to minimize the effects of lateral variations in conduc tivity (see fig. 2). Next, thermal conductivity was determined by one or more of three methods. A divided bar apparatus (Sass, Lachenbruch, Munroe and others, 1971) was used for rock samples competent enough to withstand machining and saturating, and measurements from the divided-bar provided both bulk thermal conductivity (A^,) and porosity (<f>). Needle probe (Von Herzen and Maxwell, 1959) and half-space nee dle probe (Vacquier, 1985) techniques were applied on a few samples to obtain Xb. The crushed chip method, which yields a measure of the matrix conductivity (A^; Sass, Lachenbruch, and Munroe, 1971), was applied on ground-up samples from the remaining cores and cuttings. The divided-bar and needle- probe methods are typically accurate to ±5 percent and repeatable to ±2 percent (Sass and others, 1984). The chip method is accurate to ±10 percent and repeatable to ±5 percent (Sass, Lachenbruch, and Munroe, 1971). In all, 365 conductivity measurements were made, including a few chip measurements on ground-up divided-bar "cookies". Sum mary information on the sample wells, measurement tech niques, and formations is given in table 2.
The measurements of A^, and A^ were divided among the major formations and examined for their variability
with depth, location, and <|>. The results for the onshore Santa Maria basin are summarized in table 3 and figures 10 to 14. When trying to correctly link samples to their respec tive formations, there is often ambiguous or contradictory evidence. Ideas regarding formation characteristics and markers have changed over the years, as have the names of the formations themselves. Although every effort has been made to identify the correct formation for each sample, there are certainly a small number of mistakes. In all likeli hood these misidentifications do not affect the final results, but they do limit the accuracy with which we can character ize the thermal properties of a given formation.
Conductivity of the Gaviota Formation, Rincon Mudstone, and Basement Rocks
Because samples of the basement rocks of the Santa Maria basin could be cut and saturated without crumbling, direct measurements of bulk conductivity were possible. For this sample set, basement rocks include undifferentiated samples from the Franciscan assemblage and Great Valley sequence, with the possible addition of a few samples from
GRADIENT, IN DEGREES CELSIUS PER KILOMETER
20 40 60 80 50 100 150
V) 01 HIill
tHI Q
300
600
900
1200
1500
Paso Roble
Careaga
Formation
Sandstone
Foxen Mudstone
Sisquoc Formation BD06
Monterey Formation
20 40 60 80 50 100 150
TEMPERATURE, IN DEGREES CELSIUS HEAT FLOW, IN MILLI WATTS PER SQUARE METER
Figure 9. Temperatures, temperature gradients, and calculated interval heat flow (solid circles) for the BD06 well. Note correlation of depressed gradients and heat flow with the permeable Paso Robles Formation and Careaga Sandstone. See figure 2 for well location. Vertical error bars indicate depth interval over which heat flow was calculated. Horizontal error bars indicate uncertainty in calculated heat-flow value.
The Thermal Regime of Santa Maria Province, California F7

Table 2. Thermal conductivity sample wells
[See figures 1 and 2 for well locations. TRS, township, range, and section; N, number of samples; Mdst., mudstone; Ss., sandstone; Fm., formation]
Field Operator Well
Guadalupe Unocal
Santa Maria Valley Unocal
Shell
Unocal
Cat Canyon Mobil
Texaco
Orcutt Unocal
Lompoc
Zaca Texaco
Pt. Conception Offshore Texaco
Pt. Arguello Texaco
Le Roy 1-A
Le Roy 3
Le Roy 4
Union Sugar 2
Union Sugar A-4
Le Roy 1
Security 1
Bradley 2-3
Adam 1
Calif. Lands 1
Gallison 1
Laine 1
Rice 1
Vincent IX
Battles 2
HB Enos 1
Neotsu 11-13
Los Alamos 32
Williams 1
Newlove 51
Careaga 1
Chamberlin 1
Jade 19
Pt Arguello 6 Pt Arguello 7 315-1
Code
LY1A
LY03
LY04
SG02
SGA4
LY01
SEC1
BD03
AD01
CL01
GAL1
LNEl
RCE1
VN1X
BT02
EN01
NU13
LA32
WL01
NW51
CGA1
CHMl
JD19
PA6 PA7 T315
LatitudeN
34°58.5'
34°58.6'
34°58.7'
34°55.8'
34°54.5'
34°57.0'
34°55.8'
34°54.3'
34°56.0'
34°54.9'
34°54.7'
34°56.5'
34°56'
34°55.5'
34°56.0'
34°56.6'
34°51.8'
34°48.3'
34°49.0'
34°49.0'
34°44.0'
34°43.0'
34°25.0'
34°28.2' 34°28.2' 34°28'
Longitude W
120°33.6'
120°38.7'
120°38.7'
120°29.5'
120°31.0'
120°28.0'
120°29.2'
120°24.3'
120°24.3'
120°23.7'
120°25.5'
120°24.4'
120°23.6'
120°24.5'
120°24.2'
120°24.9'
120°18.6'
120°17.3'
120°16.2'
120°25.0'
120°24.0'
120°09'
120°23.0'
120°40.9' 120°40.9' 120°41'
TRS
ION 36W Sec 2
ION 36W Sec 2
ION 36W Sec 2
ION 34W Sec 19
ION 34W Sec 31
ION 34W Sec 16
ION 34W Sec 20
ION 34W Sec 36
ION 34W Sec 24
ION 33W Sec 30
ION 34W Sec 26
ION 34W Sec 13
ION 33W Sec 19
ION 34W Sec 25
ION 34W Sec 24
ION 34W Sec 13
9N 33W Sec 13
8N 32W Sec 6
9N 32W Sec 32
9N 34W Sec 25
8N 33W Sec 31
8N 31W Sec 33
4N 33W Sec 13
N/A N/A N/A
N
1
1
1
15
31
4
2
2
16
46
38
14
49
15
1
1
10
4
5
43
17
7
29
9 47
Units
Foxen Mdst.
Foxen Mdst.
Foxen Mdst.
Careaga Ss., Foxen Mdst., Sisquoc Fm.
Paso Robles Fm., Careaga Ss.
Monterey Fm.
Monterey Fm.
Monterey Fm.
Foxen Mdst., Sisquoc Fm., Monterey Fm.
Monterey Fm., Point Sal Fm., Basement rocks
Foxen Mdst., Sisquoc Fm., Monterey
Foxen Mdst., Sisquoc Fm., Monterey Fm., Basement rocks
Carega Ss., Foxen Mdst., Sisquoc Fm Monterey Fm., Basement rocks
Point Sal Fm., Basement rocks
Foxen Mdst.
Sisquoc Fm.
Foxen Mdst., Sisquoc Fm.
Foxen Mdst., Sisquoc Fm.
Sisquoc Fm.
Sisquoc Fm.
Sisquoc Fm., Monterey Fm.
Foxen Mdst., Sisquoc Fm.
Monterey Fm., Rincon Mdst., Gaviota Fm.
Monterey Fm. Sisquoc Fm., Monterey Fm. Monterey Fm.
Fm.
"
Table 3. Bulk and matrix thermal conductivity by stratigraphic unit
[Mdst., mudstone; Ss., sandstone; Fm., formation; N.A., not applicable]
Bulk 1 (A») Matrix (Am )
Unit Number Conductivity2 (W/m-K) Number Conductivity2 (W/m-K) of Samples of Samples
Basement rocks
Gaviota Fm.
Rincon Mdst.
Monterey Fm.
Sisquoc Fm.
Foxen Mdst. Lower part Upper part
Paso Robles Fm. and Careaga Ss.
37
N.A.
N.A.
30
10
9N.A.
N.A.
2.85±0.56
N.A.
N.A.
2.27±0.34
1.78±0.21
1.47±0.10N.A.
N.A.
3
8
26
100
24 7
34
N.A.
3.41±0.48
2.00±0.07
2.35±0.39
2.20±0.29
2.46±0.43 3.10±0.13
2.93±0.45
1 Bulk conductivities were measured in the vertical direction. Printed averages are harmonic means.
2 Uncertainties given are plus or minus one standard deviation.
F8 Evolution of Sedimentary Basins/Onshore Oil and Gas Investigations Santa Maria Province

the Point Sal and Monterey Formations. The measured con ductivities are highly variable (fig. 10), but the absence of any depth dependence for the results suggests that the vari ability in conductivity reflects variability in both the miner alogy and porosities of the samples. The harmonic mean basement bulk thermal conductivity of 2.85 Watts per meter per Kelvin (W/m-K) is the highest of all the formations studied, a result which reflects both low porosity and a high quartz content.
Matrix conductivities of the Gaviota Formation and Rincon Mudstone were measured on samples from Texaco Jade 19, a well located in the Conception Offshore field adjacent to the Point Conception field (table 3). Given the small sample size, the uncertainties are large, and it is not possible to identify systematic variations with depth. The average results reflect the expected contrast between a high-conductivity sandstone (Gaviota) and a low-conduc tivity mudstone (Rincon).
CO 900
illID
I 1200 t
12345
BULK THERMAL CONDUCTIVITY, IN WATTS PER METER PER KELVIN
I!I IIIIB
I m12345
BULK THERMAL CONDUCTIVITY, IN WATTS PER METER PER KELVIN
Figure 10. A, Bulk thermal conductivities measured on base ment-rock samples and plotted versus depth. B, Histogram of these conductivities.
Conductivity of the Monterey Formation
For the Monterey Formation, a mix of divided-bar and chip measurements were made. For both matrix and bulk conductivities, there is no apparent correlation of conductiv ity with depth (fig. 11), and the values are generally low, with a fair amount of scatter. The range of values is consistent with the diversity of lithologies represented in the Monterey (Isaacs, 1984) and also reflects variations in conductivity owing to silica phase changes.
Isaacs (1984) has suggested that the phase transitions of biogenic silica from opal-A to opal-CT at approximately 50°C and opal-CT to quartz at approximately 80°C signifi cantly alter the whole-rock thermal conductivity. Because diatomaceous rocks are common in both the Monterey and Sisquoc Formations (Woodring and Bramlette, 1950) and the present-day temperatures of these formations cover the range of silica-phase-transition temperatures (figs. 4-9), the possible role of silica phase transitions in conductivity vari ations should be quantified.
Both Monterey and Sisquoc diatomaceous rocks from the Santa Maria basin have been examined by Isaacs, Taggart, and others (1989), and the following observations have been made. The primary effect of silica diagenesis is the loss of porosity, with representative porosities for these formations in each of the three phases being 60 percent for opal-A, 40 percent for opal-CT, and 20 percent for quartz (Beyer, written commun., and Isaacs, 198 Ib). In addition, mineral conduc tivities for each phase are ^=7.7 W/m-K for quartz (Horai, 1971), ^=3.7 to 4.5 W/m-K for opal-CT (Horai, 1971; Diment and Pratt, 1988), and ^=1.4 to 1.7 W/m-K for opal- A (Horai, 1971; Diment and Pratt, 1988; De Rito and others, 1989). The changes in mineral conductivity are large and can dominate the bulk conductivity. De Rito and others (1989) measured a matrix conductivity of 1.7 W/m-K on a nearly pure diatomite from the Modelo Formation in the central Ventura basin, and the associated porosity of 55 percent reduced the bulk-rock conductivity to 0.9 W/m-K.
In the Santa Maria basin, with some notable exceptions in the diatomite deposits of the Purisima Hills and Santa Ynez Mountains (Dibblee, 1950; Woodring and Bramlette, 1950), the composition of a typical Monterey or Sisquoc sample may be approximately 30 percent by weight silica, 65 percent detritus (clays, feldspars, and detrital quartz), and 5 percent carbonate (calcite and dolomite) (Isaacs, Tag gart, and others, 1989, and Isaacs, Jackson, and others, 1989). (Note that measured percentages vary over a wide range and that these values are intended for illustrative pur poses only.) With the simplifying assumption that volume percentages are approximately the same as weight percent ages, the matrix conductivity of this theoretical sample can be written as
The Thermal Regime of Santa Maria Province, California F9

where (jjj, fa, ..., (|>n are the volume fractions of the constit uents with conductivities A1? A^, ..., A^ (Sass, Lachen- bruch, and Munroe, 1971).
With conductivities for the detritus and carbonate taken as 2.0 and 4.5 W/m-K, respectively, the resulting matrix conductivities in each of the three silica phases are A^ (opal-A)=2.0 W/m-K, J^ (opal-CT)=2.7 W/m-K, and AH, (quartz)=3.1 W/m-K. With the aforementioned porosi ties of 60 percent, 40 percent and 20 percent, and a sim plification of equation (2) to
(3)
where 1-<|) is the solid fraction and A^, is the conductivity of the saturating fluid (assumed to be water with A^O.61 W/m-K at 25°C), the resulting bulk conductivities are Ab (opal-A)= 1.0 W/m-K, Ab (opal-CT)=1.5 W/m-K, and Ab (quartz)=2.3 W/m-K.
For a constant heat flow of 80 mW/m2, the correspond ing thermal gradients would be 80, 53, and 35°C/km. How ever, if the porosity is constant at 40 percent, the bulk conductivities are 1.2,1.5, and 1.6 W/m-K, which correspond to gradients of 67, 53 and 50°C/km. Therefore, given the relatively low percentage of silica in many Monterey and Sisquoc Formation rocks, the effects of changing matrix conductivities with changing silica phase are minor com pared to the effects of the concurrent decrease in porosity. The Monterey Formation conductivities in figure 11 are from samples entirely in either the opal-CT or quartz phase, and consequently, the use of a single average matrix conductivity with a locally determined porosity is justified.
Conductivity of the Sisquoc Formation
As with the Monterey Formation, thermal conductivity measurements on the Sisquoc Formation samples involved
Q 1 2 3 4 e
g 1000inin^zItLIJQ 2000
3000
/A
**
* A t * * *
* * » *
%
1 2 3 4 e
BULK THERMAL CONDUCTIVITY, IN WATTS PER METER PER KELVIN
8
NUMBER OF SAMPLES
3 10 *. O
y/////////////////A
y/AYAY///////////////A
VAYAYAYAY//////////////A
y//////////////////////A
Y///////////Ay//Ay//AY////////A
B
'////////A
\
12345
MATRIX THERMAL CONDUCTIVITY, IN WATTS PER METER PER KELVIN
V///////A
Y////////////A
|
1S
Y/////////////////A
D
V////////////A \7////////////A
'/////////////////A
|12345
BULK THERMAL CONDUCTIVITY, IN WATTS PER METER PER KELVIN
12345
MATRIX THERMAL CONDUCTIVITY, IN WATTS PER METER PER KELVIN
Figure 11. A, Bulk thermal conductivities of Monterey Formation samples plotted versus depth. B, Histogram of these bulk conductivities. C, Matrix thermal conductivities of Monterey samples plotted versus depth. D, Histogram of these matrix conductivities.
F10 Evolution of Sedimentary Basins/Onshore Oil and Gas Investigations Santa Maria Province

both the divided-bar and chip techniques. Samples from the Sisquoc and younger units are generally fragile and more difficult to work with than Monterey and basement samples. Consequently, most of the thermal conductivity data from these formations comes from chip measurements. The Sis quoc bulk conductivities are lower than Monterey Formation results, a trend which reflects increasing porosity from a mean of 8.5 percent for the Monterey core samples to 21.1 percent for the Sisquoc samples. The Sisquoc matrix con ductivities range from a low of 1.59 W/m-K to a high of 3.18 W/m-K (fig. 12Q, but given the apparently normal distribu tion about the mean of 2.2, these extremes probably reflect mineralogic variability within the formation.
Conductivity of the Foxen Mudstone
The strong depth-dependence of the Foxen Mud- stone matrix conductivities is unique among the Santa
Maria province units (fig. 13). This result is consistent with both electric-log measurements and geologic studies. Resistivity logs from the upper 100 to 200 m of the Foxen Mudstone typically show high resistivities consis tent with the sand-rich facies of the overlying Careaga Sandstone and Paso Robles Formation, and logs from the lower part of the Foxen reveal low resistivities similar to those of the underlying mudstones and diatomites of the Sisquoc Formation (Curran and others, 1959). Both Dib- blee (1950) and Woodring and Bramlette (1950) note the increasing abundance of sandstone and siltstone in the upper part of the Foxen as it grades into the Careaga Sandstone.
Consequently, for consistency with thermal proper ties and lithologic variations, we have divided the Foxen Mudstone into upper and lower parts (table 3), with the upper part of the Foxen representing the top 30 percent of the unit and the lower part of the Foxen representing the remaining 70 percent. It should be noted that these
1.05001
1.0 1.5 2.0 2.5 3.0
BULK THERMAL CONDUCTIVITY, IN WATTS PER METER PER KELVIN
01.0 1 5 2.0 2.5 3.0
BULK THERMAL CONDUCTIVITY, IN WATTS PER METER PER KELVIN
300
1234
MATRIX THERMAL CONDUCTIVITY, IN WATTS PER METER PER KELVIN
25
i 1.5 2.0 2.5 3.0 3.5 4.0
MATRIX THERMAL CONDUCTIVITY, IN WATTS PER METER PER KELVIN
Figure 12. A, Bulk thermal conductivities of Sisquoc Formation samples plotted versus depth. B, Histogram of these bulk conductivities. C, Matrix thermal conductivities of Sisquoc samples plotted versus depth. D, Histogram of these matrix conductivities.
The Thermal Regime of Santa Maria Province, California F11

0.2
0.6
1234
MATRIX THERMAL CONDUCTIVITY, IN WATTS PER METER PER KELVIN
I II B
i2.0 2.5 3.0 3.5 4.0
MATRIX THERMAL CONDUCTIVITY, IN WATTS PER METER PER KELVIN
c
1Y////////A
IV/////////////. V/////////////.
I'/////////////A
|1234
MATRIX THERMAL CONDUCTIVITY, IN WATTS PER METER PER KELVIN
Figure 13. A, Matrix thermal conductivities from Foxen Mud- stone plotted versus depth (z) divided by the unit thickness (H) for each sample well. Note strong depth-dependence and marked difference between conductivities for z/H<03 and those for 2/H>0.3. B, Histogram of conductivities from the upper part of Foxen Mudstone (z/H<Q3). C, Histogram of conductivities from the lower part of Foxen Mudstone (zl H>0.3).
designations are only intended for use in these thermal studies and should not be construed as an attempt to revise the standard stratigraphic nomenclature. As table 3 and figure 13 show, the contrast in the mean matrix ther mal conductivity between the upper and lower parts of the Foxen is approximately 0.64 W/m-K.
Conductivity of the Careaga Sandstone and the Paso Roles Formation (Part)
Petroleum companies active in the Santa Maria prov ince generally drill through these poorly consolidated Pliocene and Pleistocene units without taking note of for mation contacts, and the few well logs from the region that cover both units do not always reveal a consistent marker between the Paso Robles and Careaga (for exam ple, Curran and others, 1959). Water resources investiga tions provide some information (Worts, 1951; Upson and Thomasson, 1951; Miller and Evenson, 1966), but for many sample wells, it is not possible to conclusively tie the available nonmarine sandstone samples to either unit. Consequently, thermal data for these two units are lumped together and a single mean value obtained. The data do not reveal any depth dependence to the matrix conductivi ties (fig 14A), and the high mean and range of values (fig. 145; table 3) are consistent with the dominant quartz-rich sandstone facies.
Anisotropy
Because geothermal studies focus on the vertical component of near-surface heat flow, directional varia tions in thermal conductivity measurements must be rec ognized and corrected for. For the bulk conductivity values summarized in table 3, all of the measurements are on vertically oriented samples, thereby avoiding prob lems with anisotropy. The matrix conductivities from chip measurements, however, are essentially an average of both the vertical and horizontal components of con ductivity. If the sampled formation is substantially aniso- tropic, these values will not represent an accurate vertical conductivity.
In a sedimentary formation, anisotropy can occur on scales ranging from the smallest grain to an entire basin. From the thermal perspective, it is possible to reduce the problem to two scales of anisotropy: (1) anisotropy at scales larger than the available sample size and (2) anisot ropy at scales smaller than the sample size. An example of the larger scale would be alternating sandstone and shale beds tens of centimeters to a few meters thick. Each bed may have an isotropic thermal conductivity, but the con ductivity contrasts across the beds lead to formation-scale anisotropy. If the beds are horizontal, the appropriate aver-
F12 Evolution of Sedimentary Basins/Onshore Oil and Gas Investigations Santa Maria Province

age vertical thermal conductivity is obtained from a series model
avg (4)
where the K[ are the conductivities of each bed of thick ness /i and L is the total formation thickness. If a repre sentative number of samples are obtained from this formation, a harmonic mean of the measured conductivi ties will yield an appropriate average for the vertical for mation conductivity.
Examples of the smaller scale are finely laminated rocks or layered rocks with preferential mineral orienta tions. In both of these cases, divided-bar conductivity measurements on centimeter-sized samples would yield different results for the horizontal and vertical orientations, and chip measurements on crushed samples would yield an average of the two. Given the finely laminated bedding of much of the Monterey Formation and the poorly lami nated bedding of the Sisquoc Formation, chip measure ments on these units could include substantial anisotropy. In order to examine this possibility, divided-bar and chip measurements were made on identical samples from the Monterey and Sisquoc Formations. The divided-bar mea surements yielded the vertical conductivities, and the hori zontal conductivities were calculated assuming a harmonic mean relationship of the form
2/3 .1/3(5)
where Ah and Xy are the horizontal and vertical compo nents of thermal conductivity. The resulting ratios of hori zontal to vertical conductivity are Ah/Xv = 1.26 ± 0.23 for the Monterey Formation and A^/Ay = 1.06 ± 0.22 for the Sisquoc Formation.
These results indicate that the Monterey Formation is anisotropic and that the Sisquoc Formation is essentially isotropic, although the uncertainties are large relative to the average values. In the heat-flow results discussed below, heat flow determined in the Monterey Formation is based on oriented bulk conductivity measurements in order to avoid the uncertainties associated with corrections for anisotropy. For the Sisquoc Formation, heat flow is deter mined primarily from matrix conductivity measurements assuming isotropy, as it is for the other formations.
HEAT FLOW
Heat-flow values were determined for 27 Santa Maria basin wells by identifying intervals with uniform geother- mal gradients within a single formation, applying an appropriate topography correction, determining the appro
priate average thermal conductivity for a given unit, cal culating an interval heat flow using equation (1), and combining the interval values for a single well average. The resulting calculations and their estimated uncertainties are summarized in table 4. For those bulk conductivities determined from applying equation (3) to matrix conduc tivities and average formation porosities, the associated matrix conductivity and porosity values are included in the table. Bulk conductivities measured on core samples are presented in table 4 with "N.A." entries in the matrix conductivity and porosity columns. The uncertainties in calculated bulk conductivities are probable errors deter mined from the application of standard error analysis techniques to equation (3).
Heat-flow determinations in the Gaviota Formation, Rincon Mudstone, Foxen Mudstone, Careaga Sandstone, and Paso Robles Formation required the calculation of bulk conductivities from matrix conductivities and estimated
500
12345
MATRIX THERMAL CONDUCTIVITY, IN WATTS PER METER PER KELVIN
! iIiiiiii8
12345
MATRIX THERMAL CONDUCTIVITY, IN WATTS PER METER PER KELVIN
Figure 14. A, Matrix thermal conductivities from Paso Robles Formation and Careaga Sandstone plotted versus depth. B, Histogram of these matrix conductivities.
The Thermal Regime of Santa Maria Province, California F13

Table 4. Santa Maria Province heat flow
[See figures 1 and 2 for well locations. Pet, percent; <|>, porosity; ^5, bulk conductivity; Q, heat flow; N.A., not applicable. Unit abbreviations are: Car., Careaga Sandstone; L. Foxen, Foxen Mudstone (lower part); U. Foxen, Foxen Mudstone (upper part); Mont., Monterey Formation; P.R., Paso Robles Formation; Sisq., Sisquoc Formation]
Well
LYP6
LYQ5
SG44
VN15
BT08
CL01
WYL2
BD06
BD10
Interval (m)
275-365550-760
60-335365-760
305-550670-1130
1220-14001220-1400
120-180210-335430-475520-700
150-305395-515520-640
365-425460-730760-850760-850
260-350500-595640-885
275-395425-520530-640645-1155
1160-12201160-1220
245-400425-520550-700730-915
Gradient (°C/km)
42.2±0.0958.4±0.02
42.4±0.1260.4±0.08
32.44±0.0357.8U0.0446.15±0.0646.15±0.06
13.17±0.0526.45±0.0538.30±0.0549.66±0.03
24.1U0.0443.74±0.0547.82±0.05
31.35±0.0746.50±0.0257.24±0.1457.24±0.14
20.55±0.0340.06±0.0249.30±0.03
21.03±0.0332.92±0.0743.09±0.0254.72±0.0350.08±0.0850.08±0.08
21.70±0.0433.35±0.0745.61±0.0356.47± 0.06
Units
Careaga Ss.L. Foxen
P.R./Car.L. Foxen
Car./U. FoxenL. FoxenSisquoc Fm.Sisquoc Fm.
Paso Robles Fm.P.R./Car.U. FoxenL. Foxen
P.R./Car.U. FoxenL. Foxen
U. FoxenL. FoxenSisquoc Fm.Sisquoc Fm.
Paso Robles Fm.U. FoxenL. Foxen
Paso Robles Fm.Careaga Ss.U. FoxenL. FoxenSisquoc Fm.Sisquoc Fm.
Paso Robles Fm.P.R./Car.U. FoxenL. Foxen
Am (W/m-K)
2.93±0.452.46±0.43
2.93±0.452.46±0.43
3.10±0.132.46±0.432.20±0.29
N.A.
2.93±0.452.93±0.453.10±0.132.46±0.43
2.93±0.453.10±0.132.46±0.43
3.10±0.132.46±0.432.20±0.29
N.A.
2.93±0.453.10±0.132.46±0.43
2.93±0.452.93±0.453.10±0.132.46±0.432.20±0.29
N.A.
2.93±0.452.93±0.453.10±0.132.46±0.43
4 (Pet)
30±1030±10
30±1030±10
27±527±520±5N.A.
27±527±526±527±5
27±526±527±5
26±527±523±5
N.A.
27±526±527±5
27±527±526±527±523±5N.A.
27±527±526±527±5
At
1.83±0.351.62±0.30
1.83±0.351.62±0.30
2.03±0.201.69±0.251.70±0.211.78±0.21
1.92±0.261.92±0.262.03±0.201.69±0.25
1.92±0.262.03±0.201.69±0.25
2.03±0.201.69±0.251.64±0.201.78±0.21
1.92±0.262.03±0.201.69±0.25
1.92±0.261.92±0.262.03±0.201.69±0.251.64±0.201.78±0.21
1.92±0.261.92±0.262.03±0.201.69±0.25
Q(mW/m2 )
77.2±14.894.6±17.585.9±16.2
well avg.
77.6±14.897.8±18.287.7±16.6
well avg.
65.9± 6.6 197.7±14.578.5±9.6
82.1± 9.789.0±12.3
well avg.
25.3± 3.4 150.8± 6.9 177.8± 7.683.9±10.380.9±10.3
well avg.
46.3± 6.3 188.8± 8.780.8±12.084.8±10.5
well avg.
63.6± 6.4 178.6±11.693.9±11.4
101.9±12.088.3±11.7
well avg.
39.5± 5.3 181.3± 8.183.3±12.382.3±10.4well avg.
40.4± 5.4 163.2± 8.6 187.5± 8.692.5±13.782.1±10.089.U10.688.5±11.1
well avg.
41.7± 5.6 164.0± 8.7 192.5± 9.395.4±13.994.0±10.4
well avg.
porosities using equation (3). In the Santa Maria Valley field, because of the availability of bulk conductivities from nearby wells, heat flow values in the Sisquoc Formation were determined from both calculated and measured bulk conductivities. Outside the Santa Maria Valley field, heat- flow values in the Sisquoc were calculated solely from average formation matrix conductivities and locally esti
mated porosities. All interval heat-flow values in the Monterey Formation were determined from local bulk con ductivity measurements.
The estimated porosities in table 4 were obtained from a number of sources. Beyer (1987) and Beyer and others (1985) published precision, downhole-gravimeter porosity logs for the Santa Maria Valley and Orcutt fields
F14 Evolution of Sedimentary Basins/Onshore Oil and Gas Investigations Santa Maria Province

Table 4. Santa Maria Province heat flow Continued
Well
BL83
B133
B165BK29
TUNSLA68
PL12
PU34
PU39
LUTNPC10
PC13
PC15
PA1PA2PA3PA4PAS
Interval (m)
335-520550-700
305-490520-790
335-580460-610615-780
365-565230-380400-670
45-140150-275
135-180215-305335-520580-685
365-580585-790
380-425340-425455-580
350-440455-580
380-440455-610
1585-18001525-18301675-17701830-21951830-2130
Gradient (°C/km) Units
49.69±0.0745.66±0.12
56.60±0.1251.56±0.07
62.17±0.0759.98±0.0853.63±0.05
47.15±0.0757.43±0.0252.53±0.16
83.36±0.1855.87±0.17
39.22±0.2182.04±0.0668.70±0.0761.97±0.07
67.19±0.0460.70±0.04
30.05±0.0670.37±0.1137.70±0.05
61.09±0.1134.55±0.05
62.63±0.0634.43±0.03
40.13±0.0847.59±0.0541.69±2.4241.82±0.1147.13±0.12
L. FoxenSisquoc Fm.
L. FoxenSisquoc Fm.
L. FoxenL. FoxenSisquoc Fm.
L. FoxenL. FoxenSisquoc Fm.
L. FoxenSisquoc Fm.
P.R./Car.Sisquoc Fm.Sisquoc Fm.Sisquoc Fm.
Sisquoc Fm.Sisquoc Fm.
Car./U. FoxenRincon Mdst.Gaviota Fm.
Rincon Mdst.Gaviota Fm.
Rincon Mdst.Gaviota Fm.
Sisq./Mont.Sisq./Mont.Sisq./Mont.Sisq./Mont.Sisq./Mont.
A m (W/m-K) <t> (Pet) A 4
2.46±0.432.20±0.29
2.46±0.432.20±0.29
2.46±0.432.46±0.432.20±0.29
2.46±0.432.46±0.432.20±0.29
2.46±0.432.12±0.12
2.93±0.452.20±0.292.20±0.292.20±0.29
2.20±0.292.20±0.29
3.10±0.132.00±0.073.41±0.48
2.00±0.073.4U0.48
2.00±0.073.41±0.48
N.A.N.A.N.A.N.A.N.A.
45±1035±10
45±1035±10
45±1045±1035±10
25±1045±1035±10
60±1039±5
27±1053±1042±1036±10
42±1036±10
25±1535±1020±5
35±1020±5
35±1020±5
N.A.N.A.N.A.N.A.N.A.
1.31±0.221.40±0.22
1.3U0.221.40±0.22
1.3U0.221.3U0.221.40±0.22
1.74±0.331.31±0.221.40±0.22
1.07±0.171.30±0.13
1.92±0.371.12±0.161.28±0.191.39±0.21
1.28±0.191.39±0.21
2.07±0.511.3U0.162.4U0.34
1.31±0.162.4U0.34
1.3U0.162.4U0.34
2.23±0.382.23±0.382.23±0.382.23±0.382.23±0.38
Q(mW/m2 )
65.2±10.864.1± 9.964.7±10.4
well avg.74.3±12.372.4±11.173.4±11.7
well avg.81.6±13.578.8±13.075.3±11.677.1±12.3
well avg.81.8±15.975.4±12.673.8±11.174.6±11.9
well avg.89.2±14.272.6± 7.380.9±11.33
well avg.75.2±14.691.5±13.588.2±12.985.9±13.585.2±13.6
well avg.86.3±12.584. 1± 13.085.2±12.8
well avg.
62.1±15.4292.2±11.390.9±12.8
91.6±12.13well avg.
80.0± 9.883.3±11.781.7±10.83
well avg.82.0± 9.483.0±10.081.8±9.73well avg.
89.5±15.2106.1±18.193.0±16.793.3±15.9
105.1±17.9
1 These interval values are depressed owing to groundwater flow and are not used in the well averages.
2 The value from this well may be lowered by groundwater flow. See text.
3 Erosion corrections (see text) reduce these values to PL12, 76.3 milliwatts per square meter (mW/m2 ) PC10, 83.3 mW/m2 ; PC13, 74.3 mW/m2 ; PC15, 74.4 mW/m2 .
and parts of the Cat Canyon field. These logs provided most of the values used in table 4. Core data from the Newlove 51 well in the Orcutt field (Beyer and Isaacs, 1990) also proved useful, as were unpublished porosity measurements from the Point Conception State 10-6 well and porosities measured on bulk thermal conductivity samples. For wells in the Lompoc and Zaca fields, poros ity values were estimated from wells in the nearby fields that could be tied to the study wells on the basis of struc tural, sedimentary, and well log data. The unknown effects of lateral variability on these ties are represented in the
larger uncertainties assigned to the interval porosities. These uncertainties are consistent with the recorded range of porosities in the Santa Maria province.
The results in table 4 reveal a pattern of uniformly high heat flow (73 to 106 mW/m2) over the entire Santa Maria province. Exceptions to this are found in the shal low intervals of the Santa Maria Valley field and in the Luton 113 well of the Zaca field. The evidence described below suggests that these low values are due to ground- water flow within the shallow sediments of the onshore Santa Maria basin.
The Thermal Regime of Santa Maria Province, California F1 5

LOCAL DISTURBANCES TO THE THERMAL REGIME
Shallow Ground-Water Disturbances
The depressed thermal gradients found in the Santa Maria Valley field could be the result of a variety of proc esses, such as large changes in ground surface tempera ture, rapid sedimentation, or the downward flow of ground water. A number of geologic and thermal constraints sug gest that only shallow ground-water flow can account for the observed disturbance.
First, the disturbance is confined to the younger, per meable Pliocene and Pleistocene sediments. It does not appear in wells with thin or absent Paso Robles Formation and Careaga Sandstone sections (for example, LA68, fig. 2). Second, the disturbance is greatest in the eastern end of the Santa Maria Valley and diminishes toward the coast, even though the Paso Robles and Careaga section is of fairly uniform thickness throughout the Santa Maria Valley and Guadalupe Oil Fields. These two observations, taken together, suggest that the presence of young sediments is a necessary, but not sufficient, condition for existence of a shallow thermal disturbance.
Third, if the disturbance reflects a transient conductive response to a change in surface temperature, the large decrease in the geothermal gradient and apparent conductive heat flow over the upper 600 m (for example, BD06, fig. 9) requires a surface temperature increase on the order of 10 to 15°C within the past 100,000 years. A change in surface temperature of this magnitude over a small area would be unprecedented in the record of natural, onshore climate change and its effect on subsurface temperatures (for exam ple, Lachenbruch and others, 1988). Sea level fluctuations relative to the present ground surface have been common throughout the history of the Santa Maria basin, and the change from a surface covered with 5 to 8°C sea water to a subaerial surface at 15 to 20°C could produce the observed disturbance. A number of facts are in direct contradiction to this possibility. Pleistocene and Holocene terrace deposits and alluvium in the Santa Maria Valley are nonmarine in origin, suggesting that subaerial exposure has dominated in the recent geologic past (Worts, 1951). In addition, the ther mal disturbance diminishes toward the coast; this trend is the opposite of the trend expected for sea level changes. Sea level high stands would have the greatest effect near the shoreline, yet the wells at Guadalupe are essentially equili brated with a surface temperature of 12°C. Also, present-day bottom water temperatures measured at a water depth of 200 m at the offshore Point Arguello field are approximately 10°C (fig. 8), and the temperature in a shallow sea extending over the Santa Maria Valley would presumably be warmer. These warmer temperatures are inconsistent with the 5 to 8°C equilibrium surface temperature required for the Santa Maria Valley thermal disturbance.
Fourth, the magnitude and lateral extent of the distur bance are inconsistent with the probable effects of rapid sedimentation. De Rito and others (1989) found similar shallow temperature disturbances in the top 750 m of wells in the Fillmore district of the central Ventura basin and determined that sedimentation rates on the order of 250 meters per thousand years would be needed to generate the observed anomaly. Similarly high rates of sedimentation are also required for the wells in the Santa Maria Valley field, yet the known Pliocene and Pleistocene stratigraphy directly contradicts this possibility (figs. 2 and 9), just as De Rito and others (1989) found for the Fillmore wells.
Fifth, Worts (1951), Upson and Thomasson (1951), and Miller and Evenson (1966) document extensive ground-water flow systems in the Santa Maria and Santa Ynez River valleys. Ground-water flow in these systems follows a recharge path from the upland regions down through permeable Pliocene to Holocene sediments to underflow into the ocean. Water level contours determined by Worts (1951) are shown in Figure 15 and delineate the pattern of ground-water flow in the Santa Maria Valley. The changing pattern of well bore temperatures along the path of ground-water flow (fig. 16) illustrates the steady decay of the disturbance toward the coast line. Conse quently, the thermal disturbances in the Santa Maria Val ley may reflect downward flow of cold ground water into the Paso Robles Formation and Careaga Sandstone fol lowed by predominantly lateral flow and gradual warming of the ground water as it moves westward.
This hypothesis can be tested by considering (1) whether the ground-water system described by Worts (1951) and other authors is capable of significant lateral heat transport and (2) whether the observed temperature changes across the Santa Maria Valley are consistent with the predominantly lateral flow of ground water heated from below.
For the Santa Maria Valley drainage basin, Worts (1951) determined that the average hydraulic conductivities of the Paso Robles and Careaga units were approximately 0.003 cm/s (equivalent to a permeability of 3xlO~12 m2 for water at 25°C with a density of 1.0 g/cm3 and a viscosity of 1 centipoise); these hydraulic conductivities are about an order of magnitude lower than the hydraulic conductivities of the overlying Orcutt Sand, terrace deposits, and alluvium. Worts (1951) found the underlying Foxen and older rocks to be much less permeable than the shallow sediments, and hydraulic conductivities published by MacKinnon (1989) and others for these units are less than 10"6 cm/s. Although the hydraulic gradient within the Santa Maria Valley varies significantly east-to-west (fig. 15), the average is approxi mately 3 m/km. These values can be applied in the one- dimensional version of Darcy's Law for fluid flow in porous media as
dH (6)
F16 Evolution of Sedimentary Basins/Onshore Oil and Gas Investigations Santa Maria Province

where v is the fluid velocity, K is the hydraulic conductiv- it enters, the total amount of heat removed by laterality, and dH/dx is the hydraulic gradient. With the values given above for K and dH/dx, the average lateral fluid velocity in the Paso Robles and Careaga units is approxi mately 9x10~8 m/s or 3 m/yr.
If, as the temperature data indicate, ground water exits the Santa Maria Valley at a higher temperature than
ground-water flow can be estimated from
Q = Pf .Cf -Ar-vAD , (7)
where pf is the fluid density, Cf is the heat capacity, AT is the average temperature difference between exiting and
35° 00'
34° 55'
San Rafael
Mountains
Pacific Ocean
120° 30'
Figure 15. Ground-water-level contours (in meters above sea level) for Santa Maria Val ley (modified from Worts, 1951), along with the location of major oil fields (shaded areas) and logged wells (dots). Contour interval is 7.5 meters. Section B-B 1 shown in figure 16.
B B'
SG44LYQ5 TEMPERATURE. IN DEGREES CELSIUS
TEMPERATURE. IN DEGREES CELSIUS0 20 40 60 BO
0 20 40 80 80
TEMPERATURE, IN DEGREES CELSIUS
0 20 40 60 80.
LA68 TEMPERATURE. IN DEGREES CELSIUS
20 40 60 80
Figure 16. Cross section B-B 1 (figure 15) showing the approximate path of ground-water flow (arrows) in the Santa Maria Valley and its relationship to formations and in situ temperatures. Solid lines are measured temperatures, and dashed lines are estimates of formation temperatures for a constant conductive heat flow (no fluid flow).
The Thermal Regime of Santa Maria Province, California F17

entering fluid, v is the fluid velocity, and AD is the dis charge area. With pf =1.0 g/cm3, Cf =4,187 J/kg-K, and A7=5°C (determined from variations in temperature pro files across the Santa Maria Valley, see figures 4 through 9), the removed heat is
G=2.8xl07 W.The surface area of the ground-water basin (AB) is approx imately 4xl08 m2, so the equivalent vertical component of heat flow required to balance this lateral flow would be
4=e/AB=70 mW/m2.
Although there are many uncertainties in this calcula tion (particularly the hydraulic conductivity), the significant result is that the observed flow rates in the Santa Maria Valley ground-water system and the observed temperature variations across that system can account for the removal of almost all the vertical component of conductive heat flow.
It should be noted that this analysis assumes that all the temperature increase from east to west is due to con ductive heating from below. Thus, as a second conse quence of the fluid flow hypothesis, the observed change in temperature across the Santa Maria Valley should be attributable to the steady warming of ground water as it flows across the top of the impermeable Foxen Mudstone. This warming can be modeled with a one-dimensional analytical solution of the heat conduction equation if the following assumptions are made: (1) All downward flow is limited to the eastern edge of the Santa Maria Valley. Ground-water flow in the rest of the valley follows a hori zontal path along the top of the Foxen. (2) All flow is oriented along the section represented by figure 16 (in other words, flow normal to the plane of the section is neglected). (3) Lateral conductive heat transfer within the Paso Robles Formation and Careaga Sandstone is negligi ble. (4) A constant surface temperature TG is maintained on the upper boundary, and a constant vertical heat flow q is maintained across the lower boundary.
These assumptions reduce the two-dimensional energy equation for heat and mass transport in porous media (Turcotte and Schubert, 1982) to
dx pfCf(8)
where jc is the horizontal dimension, z is the vertical dimension, v is the horizontal fluid velocity, X is the bulk thermal conductivity, Pf is the fluid density, and Cf is the fluid heat capacity. By setting time t as x/v and defining an effective thermal diffusivity a as the ratio X/pfCf, the evolving temperature in the fluid channel is given by
T(z t) = T +- VL (z, U - I- o + i 2 1*
(Carslaw and Jaeger, 1959, p. 113), where T0 is both the surface temperature and the initial temperature in the channel, and L is the channel thickness. Figure 17 displays a comparison of data from the Santa Maria Valley field with the results of equation (9) for v=3 m/yr, (2=80 mW/ m2, L=400 m, o^Q.lSxKT6 m2/s, and k=1.8 W/m-K. If the location of BD06 is tied to x=2 km, then SG44 is at jt=10 km and LYP6 is at Jt=20 km. The calculated increase in temperature with distance shows a surprising agreement considering the idealization represented by equation (8).
The observations, constraints, and models discussed above all point to active ground-water flow as the source of thermal disturbances in the Santa Maria Valley. Conse quently, this flow has a significant impact on temperature in the shallow sediments; it may also produce a transient conductive temperature disturbance in Monterey Forma tion, Sisquoc Formation, and Foxen Mudstone. If the Paso Robles Formation and Careaga Sandstone were initially in conductive equilibrium, the cooling effect of ground-water flow would act as a temperature change at the top of the Foxen. For the observed gradients in the underlying for mations to be near equilibrium (<10 percent difference), the ground-water flow must be at least 800,000 years old (see De Rito and others, 1989, for a similar discussion).
However, it may not be correct to separate the flow system from the original sedimentation processes. Deposi tion of the Paso Robles Formation began as the basin floor emerged above sea level in response to the compressional tectonics active since the late Pliocene (2 to 4 Ma; Nam- son and Davis, 1990). As these sediments were deposited under a topographic gradient, they were certainly associ ated with an active surface water system. In addition,
20 25 30
TEMPERATURE, IN DEGREES CELSIUS
, -a(2n+l)Vf] . exp| i ^ |sm4L 2L (9)
Figure 17. Comparison of modeled temperatures derived from equation (9) with measured temperatures along flow path shown in figures 15 and 16. Variable X represents the horizontal distance from point at which downward ground- water flow ceases and lateral flow begins. Temperature at X=0 is a constant 17°C.
F18 Evolution of Sedimentary Basins/Onshore Oil and Gas Investigations Santa Maria Province

because the Paso Robles and younger units have never been any less permeable than they are now, some ground- water flow in response to topographic gradients has been ongoing since deposition. Sea level changes and the com peting rates of erosion and uplift have varied over time in the Santa Maria Valley region (for example, Woodring and Bramlette, 1950; Worts, 1951; Namson and Davis, 1990), and these variations, along with sediment compaction, undoubtedly led to changes in the magnitude and direction of ground-water flow. It is impossible to say whether these changes would lead to an approximately constant, steadily increasing or steadily diminishing thermal effect, but given the fairly consistent tectonic and depositional setting over the past 2 m.y., the thermal conditions at depth are proba bly close to equilibration with present-day temperatures in the Paso Robles and Careaga units. In other words, the continuous flow of ground water may have maintained a relatively constant temperature at the base of the Paso Robles Formation since its deposition.
Erosion
The surface uplift driven by the compressional tecton ics active since the Pliocene has led to extensive erosion in some parts of the Santa Maria province. The long-term erosion of material from a site will tend to increase the measured temperature gradients as the subsurface tempera tures move toward reequilibration with the temperature of downward moving ground surface. Although gaps in the geologic record leave large uncertainties in the exact his tory of erosion and its thermal effects in Santa Maria province, the approximate magnitude of the associated dis turbance can be investigated with some success. At Point Conception and Orcutt Hill (fig. 1), documented uplift and erosion rates introduce significant disturbances to the observed thermal gradients, and corrections for these dis turbances are included in the final heat-flow estimates.
The corrections are made with a one-dimensional ero sion/sedimentation model that calculates the disturbed heat flow as
z+Ut
(to)
(nat)4at
, z-Ut z-Ut -(z-Ut) _erfc .+ .exp >
(4at) (nat)(10)
where U is the erosion/sedimentation rate (positive down ward for sedimentation), a is the thermal diffusivity, and qQ is the undisturbed heat flow (De Rito and others, 1989;
Powell and others, 1988). At the Point Conception site, eroded Monterey Formation rocks form the land surface, and geologic and structural evidence points to the erosion of 600 to 1,200 m of material within the past 2 to 4 m.y. (Dibblee, 1950; Namson and Davis, 1990). With this range of erosion rates, equation (10) gives ratios of observed heat flow to undisturbed heat flow of 1.05 to 1.15. For the final estimated heat flow at Point Conception, a correction factor of 1.10 (equivalent to an erosion rate of 250 m/m.y. for 4 m.y.) was applied to the measured heat flow (table 4). For the Orcutt Hill site, evidence from silica-phase- change boundaries (R. Pollastro, written commun., 1991), porosity data (Beyer and Isaacs, 1990) and stratigraphy (Curran and others, 1959) point to approximately 600 m of erosion in the past 2 to 4 m.y. The erosion rates at Orcutt Hill lead to disturbances which increase observed gradi ents by a factor of 1.04 to 1.09, and the final heat-flow estimate includes a correction of 1.06 (PL 12, table 4).
HEAT FLOW IN A REGIONAL CONTEXT
The high average heat flow in the Santa Maria prov ince is consistent with measurements within the Coast Range heat-flow high and in marked contrast with the lower values southeast of the Transverse Ranges (fig. 18). The apparent thermal tie between the Santa Maria prov ince and the Coast Ranges may be misleading, however, and the possible nature and sources of the high Santa Maria heat flow must be characterized before any genetic relationship is inferred.
The Coast Range high is generally attributed to the thermal effects of asthenospheric upwelling into the "slab gap" created by triple junction passage as subduction of the Farallon-Monterey-Arguello plate system ceased and the transform margin developed (Lachenbruch and Sass, 1980; Zandt and Furlong, 1982). A possible additional fac tor in the Coast Range high is the thermal effect of shear heating along both transform faults and detachment sur faces within and beneath the San Andreas Fault system (Lachenbruch and Sass, 1992). Whatever the exact nature and magnitude of the sources for the high heat flow, the available evidence suggests that they are located primarily in the lower crust and (or) upper mantle (Williams and Lachenbruch, 1991). The contrasting-heat flow pattern in the Ventura basin reflects the unique tectonic regime of the central Transverse Ranges. As De Rito and others (1989) pointed out, the combined effects of rapid sedimentation and crustal thickening have overprinted any remaining thermal anomaly from earlier extension and basin forma tion. Although the relative roles of these two processes in lowering the near-surface heat flow are not well under stood, the overall result is consistent with the deepening seismicity and thick crust found within the Transverse Ranges (Bryant and Jones, 1992).
The Thermal Regime of Santa Maria Province, California F19
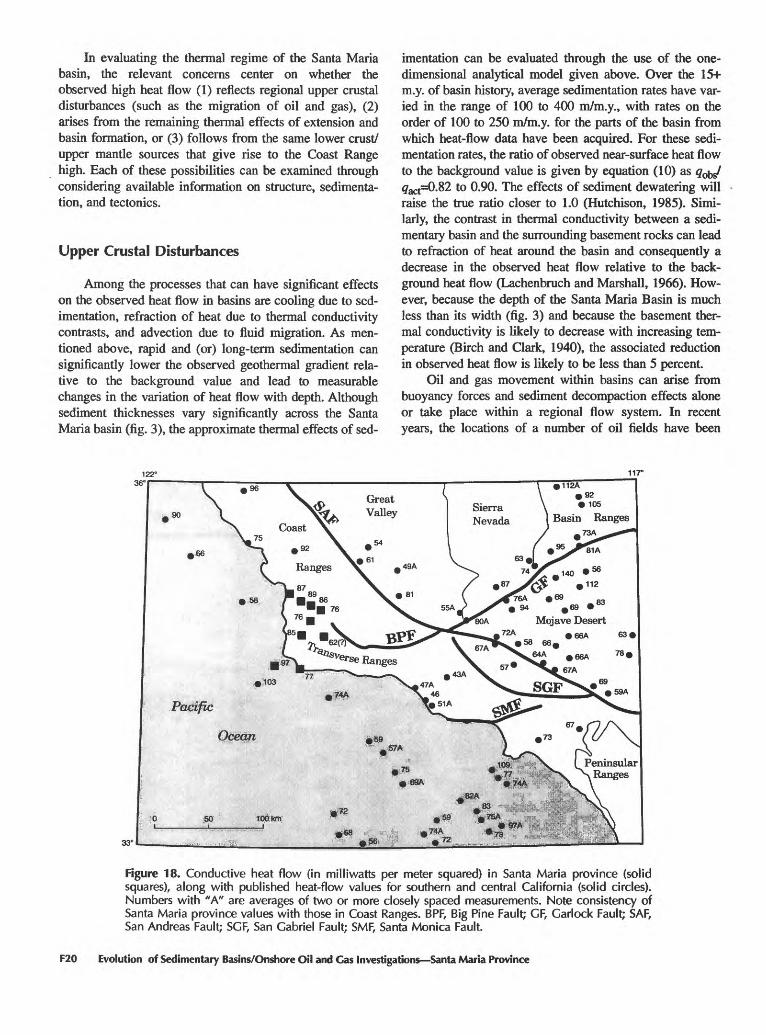
In evaluating the thermal regime of the Santa Maria basin, the relevant concerns center on whether the observed high heat flow (1) reflects regional upper crustal disturbances (such as the migration of oil and gas), (2) arises from the remaining thermal effects of extension and basin formation, or (3) follows from the same lower crust/ upper mantle sources that give rise to the Coast Range high. Each of these possibilities can be examined through considering available information on structure, sedimenta tion, and tectonics.
Upper Crustal Disturbances
Among the processes that can have significant effects on the observed heat flow in basins are cooling due to sed imentation, refraction of heat due to thermal conductivity contrasts, and advection due to fluid migration. As men tioned above, rapid and (or) long-term sedimentation can significantly lower the observed geothermal gradient rela tive to the background value and lead to measurable changes in the variation of heat flow with depth. Although sediment thicknesses vary significantly across the Santa Maria basin (fig. 3), the approximate thermal effects of sed
imentation can be evaluated through the use of the one- dimensional analytical model given above. Over the 15+ m.y. of basin history, average sedimentation rates have var ied in the range of 100 to 400 m/m.y., with rates on the order of 100 to 250 m/m.y. for the parts of the basin from which heat-flow data have been acquired. For these sedi mentation rates, the ratio of observed near-surface heat flow to the background value is given by equation (10) as q$d #act=0.82 to 0.90. The effects of sediment dewatering will raise the true ratio closer to 1.0 (Hutchison, 1985). Simi larly, the contrast in thermal conductivity between a sedi mentary basin and the surrounding basement rocks can lead to refraction of heat around the basin and consequently a decrease in the observed heat flow relative to the back ground heat flow (Lachenbruch and Marshall, 1966). How ever, because the depth of the Santa Maria Basin is much less than its width (fig. 3) and because the basement ther mal conductivity is likely to decrease with increasing tem perature (Birch and Clark, 1940), the associated reduction in observed heat flow is likely to be less than 5 percent.
Oil and gas movement within basins can arise from buoyancy forces and sediment decompaction effects alone or take place within a regional flow system. In recent years, the locations of a number of oil fields have been
117°
Figure 18. Conductive heat flow (in milliwatts per meter squared) in Santa Maria province (solid squares), along with published heat-flow values for southern and central California (solid circles). Numbers with "A" are averages of two or more closely spaced measurements. Note consistency of Santa Maria province values with those in Coast Ranges. BPF, Big Pine Fault; CF, Carlock Fault; SAF, San Andreas Fault; SCF, San Gabriel Fault; SMF, Santa Monica Fault.
F20 Evolution of Sedimentary Basins/Onshore Oil and Gas Investigations Santa Maria Province

tied to positive surface heat-flow anomalies, and these anomalies have been attributed to the upward flow of fluid in the subsurface (for example, Hitchon, 1984). Because the heat-flow measurements in the Santa Maria province were made exclusively in producing oil fields, it is possi ble that the thermal effects of petroleum migration within the reservoir rocks could be masking a lower value of background heat flow.
Lillis and King (1991), on the basis of structural, chemical, and physical properties data, have divided the reservoirs of the onshore Santa Maria basin into two age groups those older than 2 to 4 Ma (Guadalupe, Santa Maria Valley, and parts of Cat Canyon) and those younger than 2 to 4 Ma (Orcutt Hill and Lompoc). Although the relative structural ages of these traps correspond with the relative age of the entrapped oil (Lillis and King, 1991), the heat-flow data do not vary consistently between the two age groups (table 4 and fig. 18). An examination of the constraints on fluid flow within the Monterey Forma tion provides a ready explanation for this. Fractured reser voirs in the Monterey Formation are highly permeable (Regan and Hughes, 1949), but they are isolated from the regional ground-water system by the low permeability Sis- quoc Formation and Foxen Mudstone. This leaves the Monterey as both the primary source and reservoir rock and limits most of the potential petroleum migration to less than 2 km vertically and 10 km laterally (fig. 3). Rapid sedimentation within the synclines will tend to lower the local geothermal gradient (see above), and petroleum moving updip will not introduce a large thermal anomaly unless the flow rates are large. For a 20 percent increase in the observed heat flow, the vertical component of fluid flow within the Monterey must be about 1 cm/yr (Bredehoeft and Papadopulos, 1965), a result which, given the low angle path the fluid must travel within the forma tion (fig. 3), requires a lateral flow rate of 5 to 10 cm/yr. This flow rate is large enough to sweep out the entire pore space of the Monterey (assuming 20 percent porosity) within 100,000 to 200,000 years, a time span inconsistent with the postulated age of reservoirs in the onshore Santa Maria basin.
In addition, as England and others (1991) pointed out, petroleum migration by buoyancy effects alone will be limited by the rate of petroleum generation, which is gen erally orders of magnitude smaller than the flow rates pos sible given an unlimited fluid supply, typical buoyant driving forces, and significant permeability. Compaction of the sediment column will also drive fluid up toward the surface as porosity decreases, but as mentioned above, the warming effects of sediment dewatering will be equaled or exceeded by the cooling effects of sedimentation. Given possible spatial and temporal focusing of both dewatering and petroleum migration, however, the only definite con clusion is that the available evidence is not consistent with a tie between deep fluid flow and measured heat flow.
Extension and Basin Formation
The formation of a sedimentary basin often involves the extensional thinning of some portion of the litho- sphere. This thinning not only accounts for much of the subsequent basin subsidence but also leads to an increase in surface heat flow as hot material from depth is brought closer to the surface. In this case, the relevant question is whether the transient thermal effects of extension are aug menting the initial background heat flow and leading to a superficial thermal consistency between the Santa Maria province and the Coast Ranges.
For a small basin like the onshore Santa Maria, two- dimensional numerical modeling is required to account for the precise quantitative effects of heterogeneous crustal structure, spatially variable extension, sedimentation, finite extension rates, and lateral heat losses (for example, Saw yer and others, 1987). These complications, however, tend to lower the predicted value of heat flow over time, so a maximum estimate of the thermal effects of extension can be derived from the use of the simpler one-dimensional analytical model of McKenzie (1978). In the McKenzie (1978) model, the relevant parameters are the age of extension, the initial lithospheric thickness (a) and the stretching factor (8). Extension and subsidence of the Santa Maria basin began approximately 18 Ma (McCrory and others, 1991; Stanley and others, 1991), and the avail able data (in particular the small size and limited thickness of the basin) suggest that the amount of stretching was small (less than 50 percent; Pitman and Andrews, 1985). This leaves the initial lithospheric thickness as the primary uncertainty.
Thermal models have identified triple junction migra tion and exposure of the North American plate to astheno- spheric upwelling as the main causes of the Coast Ranges heat-flow high (Lachenbruch and Sass, 1980; Zandt and Furlong, 1982). These models predict lithospheric thick nesses on the order of 20 to 30 km in the wake of Mendo- cino triple junction passage, but they may not apply to the southern Coast Ranges and the Santa Maria province. Lonsdale (1991) and Fernandez and Hey (1992) have identified the stalled remains of a subducting microplate (Monterey) off the central California continental shelf, and recent seismic surveys have delineated what may be sub ducted oceanic crust under much of the Santa Maria prov ince (for example, Trehu, 1991). If this portion of the crust is oceanic and not the product of magmatic underplating, the total lithospheric thickness at the time of basin forma tion would have been on the order of 50 to 60 km (Howie, in press).
The stretching factors appropriate to both these litho spheric thicknesses and the available data lie in the range of 6=1.1 to 1.5. The application of these values in McKen- zie's (1978) model of extension and subsequent cooling is shown in figure 19 for heat flow normalized to its value
The Thermal Regime of Santa Maria Province, California F21

before the onset of extension. Given the 18-m.y. age of the onshore Santa Maria basin, the maximum present-day nor malized heat flow is approximately 1.15. With an observed average heat flow of 84 mW/m2, this leaves an initial background value of 73 mW/m2. Given the complexities discussed above, the actual initial heat flow is likely to be much higher, a conclusion which suggests that the high heat flow of the Santa Maria province reflects crust and mantle processes unrelated to the thermal effects of basin formation.
Extrusive magmatism around the margins of the onshore Santa Maria basin at the time of basin formation (preserved at the Tranquillon and Obispo volcanics; Hall, 1981) is unlikely to affect present-day heat flow. The vol canics are confined almost exclusively to the margins of the basin (McLean, 1991), and the thermal anomaly asso ciated with elevated temperatures in the upper 10 km of
IQ 1.25
5 10 15 20 25
TIME, IN MILLIONS OF YEARS BEFORE PRESENT
LIZED HEAT FLOW
^83
<?
cc oZ 1.00
0.75
8
B--B-- E3-S-{
o-o~o-o-^
3~&«-o°-Q-.E
^ Q-e-e-Q^^-1
G -o Beta = 1.1 B -D Beta = 1.25 v v Beta = 1.5
^:-S^
) 5 10 15 20 25 3
TIME, IN MILLIONS OF YEARS BEFORE PRESENT
Figure 19. A, Normalized heat flow for Santa Maria Prov ince over time for one-dimensional extension using the model of McKenzie (1978) for an initial lithospheric thick ness of 50 km and various values for stretching factor, ft. B, Normalized heat flow over time for an initial lithospheric thickness of 60 km.
the crust would have dissipated within a few million years (for example, Lachenbruch and Sass, 1980). If extensive magmatic underplating at depths of 20 km or greater was the source of the marginal extrusives, then magmatic sources could account for a portion of the observed high heat flow. However, the limited amount of extension asso ciated with formation of the Santa Maria basin is inconsis tent with extensive magmatic underplating (Howie, in press), a fact which suggests that a large portion of the high heat flow of the Santa Maria province reflects crust and mantle processes unrelated to the thermal effects of basin formation.
Consequently, the similarity of Santa Maria province heat-flow values to Coast Ranges heat-flow values probably does reflect a common thermal source. Given the complex ity of the Miocene transition from a convergent margin to a transform margin, the poorly understood geometry of the stalled microplates, the subsequent variations through extensional, strike-slip and compressional tectonics, and the uncertain role of the plate boundary mechanical deforma tion in generating heat, the comprehensive modeling of the Santa Maria province and southern Coast Ranges heat flow is the appropriate subject of another paper. The basic result of importance here is that the thermal regime of the Santa Maria province is properly considered in a regional rather than local context. The thermal processes peculiar to the basins within the Santa Maria province are either easily corrected for or are minor compared to the thermal effects of regional tectonics. These effects must be understood and accounted for in any comprehensive understanding of the origin and migration of hydrocarbons within the Santa Maria province.
CONCLUSIONS
The results of heat-flow studies in the Santa Maria province not only demonstrate the viability of utilizing idle oil wells for investigating the thermal regime of sedimentary basins but also provide quantitative con straints on the thermal effects of sedimentary and tec tonic processes.
Temperature measurements in the permeable Careaga Sandstone, Paso Robles Formation, and Orcutt Sand reveal the presence of an active ground-water flow system within the Santa Maria Valley (and possibly other nearby valleys). The ground-water flow depresses thermal gradients in the eastern part of the valley to nearly isothermal values, through the circulation of cold meteoric water to depths of 400+ meters. This meteoric water then flows out across the basin and, with its passage, carries a great part of the back ground conductive heat flow into the ocean. Linear temper ature profiles with high geothermal gradients are found below the ground-water system within the consolidated Monterey Formation, Sisquoc Formation, and Foxen Mud-
F22 Evolution of Sedimentary Basins/Onshore Oil and Gas Investigations Santa Maria Province

stone, and thermal conductivity measurements on cores and cuttings confirm that these high gradients are the result of high conductive heat flow. The thermal effects of topogra phy, erosion, sedimentation, and the shallow ground-water system have been examined, and although there are mea surable disturbances to the thermal field, the high heat flow (73 to 106 mW/m2) is apparently the product of regional thermal sources located at depth within the crust and man tle. This observation brings the Santa Maria province and western Ventura basin into the Coast Ranges heat-flow high and extends the southern limits of the Coast Ranges high down to the western Transverse Ranges and the Santa Bar bara Channel.
The source of the Coast Ranges high has generally been identified and modeled as asthenospheric upwelling behind the Mendocino Triple Junction during its north ward migration (for example, Lachenbruch and Sass, 1980; Zandt and Furlong, 1982). These models predict a decrease in surface heat flow in the southern Coast Ranges owing to the passage of approximately 20 m.y. since the cessation of subduction, yet the Santa Maria measure ments produce values as great as those commonly found in the northern Coast Ranges. In addition, plate tectonic reconstructions (Lonsdale, 1991; Fernandez and Hey, 1991) and crustal structure studies (Trehu, 1991) in the Santa Maria province suggest that the subducting Farallon plate stalled beneath the Santa Maria province, leaving a substantial thickness of oceanic lithosphere between the asthenosphere and the shallow crust. These observations, together with the inconsistency of the observed heat flow with the triple junction models, suggest that the nature and causes of the Coast Ranges high are complex and varied. Even though the uniformity of the high heat flow suggests a common source, it may be that a number of processes associated with evolution of the transform margin (for example, asthenospheric upwelling, magmatic underplat- ing, extension, and mechanical heating of the crust during deformation) have contributed to the fairly homogenous heat-flow pattern observed today.
REFERENCES
Atwater, Tanya, 1970, Implications of plate tectonics for the Cenozoic tectonic evolution of western North America: Geo logical Society of America Bulletin, v. 81, p. 3513-3536.
Beck, A.E., and Balling, Niels., 1988, Determination of virgin rock temperatures, in Haenel, R., Rybach, L., and Stegena, L., eds., Handbook of heat-flow density determinations: Klu- wer, p. 59-86.
Benfield, A.E., 1947, A heat flow value for a well in California: American Journal of Science., v. 245, no. 1, p. 1-18.
Beyer, L.A., 1987, Porosity of unconsolidated sand, diatomite, and fractured shale reservoirs, South Belridge and West Cat Can yon oil fields, California, in Meyer, R.F., ed., Exploration for heavy crude oil and natural bitumen: American Association of Petroleum Geologists Studies in Geology, v. 25, p. 395-413.
Beyer, L.A., and Isaacs, C.M., 1990, Mass properties of conven tional core samples from the Sisquoc, Monterey, and Point Sal formations, Unocal Newlove 51 well, Orcutt oil field, Santa Maria Basin, California: U.S. Geological Survey Open-File Report 90-14.
Beyer, L.A., Robbins, S.L., and Clutsom, F.G., 1985, Basic data and preliminary density and porosity profiles for twelve borehole gravity surveys made in the Los Angeles, San Joa- quin, Santa Maria, and Ventura Basins, California: U.S. Geo logical Survey Open-File Report 85-42.
Birch, Francis, and Clark, Harry, 1940, The thermal conductivity of rocks and its dependence upon temperature and composi tion: American Journal of Science, v. 238, p. 529-558 and p. 613-635.
Bredehoeft, J.D., and Papadopulos, I.S., 1965, Rates of vertical groundwater movement estimated from the Earth's thermal profile: Water Resources Research, v. 1, no. 2, p. 325-328.
Bryant, A.S., and Jones, L.M., 1992, Anomalously deep crustal earthquakes in the Ventura Basin, southern California: Jour nal of Geophysical Research, v. 97, no. Bl, p. 437-447.
California Division of Oil and Gas, 1974, California oil and gas Fields, south, central coastal, and offshore California: Cali fornia Division of Oil and Gas Report No. Trl2, v. 2.
Carslaw, H.S., and Jaeger, J.C., 1959, Conduction of heat in sol ids: Oxford, Clarendon, 510 p.
Grain, WE., Mero, WE., and Patterson, Don, 1985, Geology of the Point Arguello discovery: American Association of Petroleum Geologists Bulletin, v. 69, no. 4, p. 537-545.
Crawford, F.D., 1971, Petroleum potential of Santa Maria prov ince, California, in Future petroleum provinces of the United States their geology and potential: American Association of Petroleum Geologists Memoir 15, p. 316-328.
Curran, J.F., chairman, and others, 1959, Correlation section across Santa Maria basin from Cretaceous outcrop in Santa Ynez Mountains northerly to Franciscan outcrop north of Santa Maria River, California: American Association of Petroleum Geologists Section 12.
De Rito, R.F., Lachenbruch, A.H., Moses, T.H., Jr., and Munroe, R.J., 1989, Heat flow and thermotectonic problems of the central Ventura basin, Southern California: Journal of Geo physical Research, v. 94, no. Bl, p. 681-699.
Dibblee, T.W, Jr., 1950, Geology of southwestern Santa Barbara County, California Point Arguello, Lompoc, Point Concep tion, Los Olivos, and Gaviota quadrangles: California Divi sion of Mines and Geology Bulletin, v. 150, 95 p.
Diment, W.H., and Pratt, H.R., 1988, Thermal conductivity of some rock-forming minerals a tabulation: U.S. Geological Survey Open-File Report 88-690.
England, W.A., Mann, A.L., and Mann, D.M., 1991, Migration from source to trap, in Merrill, R.K., ed., Source and migra tion processes and evaluation techniques: Tulsa, American Association of Petroleum Geologists, p. 23-46.
Fernandez, L.E., and Hey, R.N., 1991, Late Tertiary tectonic evo lution of the seafloor spreading system off the coast of Cali fornia between the Mendocino and Murray fracture zones: Journal of Geophysical Research, v. 96, no. Bll, p. 17955- 17979.
French, R.W., 1940, Geothermal gradients in California oil wells, in Drilling and production practice 1939: New York, American Petroleum Institute, p. 653-658.
The Thermal Regime of Santa Maria Province, California F23

Hall, C. A., Jr., 1981, San Luis Obispo transform fault and middle Miocene rotation of the Western Transverse Ranges, Califor nia: Journal of Geophysical Research, v. 86, no. B2, p. 1015- 1031.
Heasler, H.P., and Surdam, R.C., 1985, Thermal evolution of coastal California with application to hydrocarbon matura tion: American Association of Petroleum Geologists Bulletin, v. 69, no. 9, p. 1386-1400.
Heilbrunn-Tomson, Janice, 1988, A bibliography of the Santa Maria Province and vicinity, south central coastal California: U.S. Geological Survey Open-File Report 88-509.
Hitchon, Brian, 1984, Geothermal gradients, hydrodynamics and hydrocarbon occurrences, Alberta, Canada: American Asso ciation of Petroleum Geologists Bulletin, v. 68, p. 713-743.
Horai, Ki-iti, 1971, Thermal conductivity of rock-forming minerals: Journal of Geophysical Research, v. 76, no. 5, p. 1278-1308.
Howie, John, in press, Time transgressive evolution of the San Andreas Fault system in central California: Constraints from crustal structure: Geological Society of America Bulletin.
Hutchison, lan, 1985, The effects of sedimentation and compac tion on oceanic heat flow: Geophysical Journal of the Royal Astronomical Society, v. 82, p. 439-459.
Isaacs, C.M., ed., 1981a, Guide to the Monterey Formation in the California coastal area, Ventura to San Luis Obispo: Pacific Section, American Association of Petroleum Geologists, v. 52, 83 p.
Isaacs, C.M., 198Ib, Porosity reduction during diagenesis of the Monterey Formation, Santa Barbara coastal area, California, in The Monterey Formation and related siliceous rocks of California: Society of Economic Paleontologists and Miner alogists, p. 257-271.
Isaacs, C.M., 1984, Geology and physical properties of the Mon terey Formation, California: Society of Petroleum Engineer ing Proceedings, Paper 12733, p. 83-92.
Isaacs, C.M., Jackson, L.L., Stewart, K.C., and Scott, Norman, 1989, Analytical reproducibility and abundances of major oxides, total carbon, organic carbon, and sedimentary com ponents of Miocene and early Pliocene cuttings from the Point Conception deep stratigraphic test well, OCS-CAL 78- 164 No. 1, offshore Santa Maria basin, southern California: U.S. Geological Survey Open-File Report 87-75.
Isaacs, C.M., Taggart, J.E., Jr., Jackson, L.L., and Scott, Norman, 1989, Analytical reproducibility and abundances of major elements and sedimentary components in cores from the Sis- quoc, Monterey, and Point Sal formations, Union Newlove 51 well, Orcutt oil field, onshore Santa Maria Basin, Califor nia: U.S. Geological Survey Open-File Report 89-459.
Lachenbruch, A.H., and Brewer, M.C., 1959, Dissipation of the temperature effect of drilling a well in Arctic Alaska: U.S. Geological Survey Bulletin 1083C, p. 73-109.
Lachenbruch, A.H., Cladouhos, T.T., and Saltus, R.W., 1988, Per mafrost temperature and the changing climate, in Senneset, K., ed., Permafrost, v. 3, International Conference on Perma frost, 5th: Trondheim, Norway, Tapir Publishers, p. 9-17.
Lachenbruch, A.H., and Marshall, B.V., 1966, Heat flow through the Arctic Ocean floor: the Canada Basin-Alpha Rise bound ary: Journal Geophysical Research, v. 71, p. 1223-1248.
Lachenbruch, A.H., and Sass, J.H., 1980, Heat flow and energet ics of the San Andreas Fault zone: Journal of Geophysical Research, v. 85, p. 6185-6223.
Lachenbruch, A.H., and Sass, J.H., 1992, Heat flow from Cajon Pass, fault strength, and tectonic implications: Journal of Geophysical Research, v. 97, p. 4995-5015.
Lachenbruch, A.H., Sass, J.H., and Galanis, S.P., Jr., 1985, Heat flow in southernmost California and the origin of the Salton Trough: Journal of Geophysical Research, v. 90, no. B7, p. 6709-6736.
Lillis, P.G., and King, J.D., 1991, Controls on the variation of crude oil quality, Santa Maria basin, California: American Associa tion of Petroleum Geologists Bulletin, v. 75, no. 2, p. 372.
Lonsdale, Peter, 1991, Structural patterns of the Pacific floor off shore of peninsular California, in The Gulf and Peninsular province of the Californias: American Association of Petro leum Geologists Memoir, v. 47, p. 87-125.
MacKinnon, T. C., 1989, Origins of the Miocene Monterey For mation in California, in MacKinnon, T. C., ed., Oil in the California Monterey Formation, 28th International Geologi cal Congress field trip guidebook T311: Washington, D.C., American Geophysical Union, p. 1-10.
McCrory, P.A., Arends, R.G., Ingle, J.C., Jr., Isaacs, C.M., Stan ley, R.G., and Thorton, M.L.C., 1991, Geohistory analysis of the Santa Maria Basin, California, and its relationship to tec tonic evolution of the continental margin: American Associa tion of Petroleum Geologists Bulletin, v. 75, no. 2, p. 374.
McKenzie, Dan, 1978, Some remarks on the development of sed imentary basins: Earth and Planetary Science Letters, v. 40, p. 25-32.
McLean, Hugh, 1991, Distribution and juxtaposition of Mesozoic lithotectonic elements in the basement of the Santa Maria Basin, California: U.S. Geological Survey Bulletin 1995-B.
Miller, G.A., and Evenson, R.E., 1966, Utilization of ground water in the Santa Maria Valley area, California: U.S. Geo logical Survey Water Supply Paper 1819-A, p. 24.
Namson, Jay, and Davis, T.L., 1990, Late Cenozoic fold and thrust belt of the southern Coast Ranges and Santa Maria basin, California: American Association of Petroleum Geolo gists Bulletin, v. 74, no. 4, p. 467-492.
Nicholson, Craig, and Sorlien, C. C., Luyendyk, B.P., 1992, Deep crustal structure and tectonics in the offshore southern Santa Maria basin, California: Geology, v. 20, no. 3, p. 239- 242.
Pitman, W.C., and Andrews, J.A., 1985, Subsidence and thermal history of small pull-apart basins, in Strike-slip deformation, basin formation, and sedimentation: Society of Economic Paleontologists and Mineralogist, Special Publication No. 37, p. 45-49.
Powell, W.G., Chapman, D.S., Balling, Niels, and Beck, A.E., 1988, Continental heat-flow density, in Haenel, R., Rybach, L., and Stegena, L., eds., Handbook of heat-flow density determinations: Kluwer, p. 167-222.
Regan, L.J., and Hughes, A.W., 1949, Fractured reservoirs of Santa Maria District, California: American Association of Petroleum Geologists Bulletin, v. 33, no. 1, p. 32-51.
Saltus, R.W, and Lachenbruch, A.H., 1991, Thermal evolution of the Sierra Nevada: tectonic implications of new heat flow data: Tectonics, v. 10, no. 2, p. 325-344.
Sass, J.H., Kennelly, J.P., Jr., Smith, E.P., and Wendt, WE., 1984, Laboratory line-source methods for the measurement of ther mal conductivity of rocks near room temperature: U.S. Geo logical Survey Open-File Report 86-468, p. 84-91.
F24 Evolution of Sedimentary Basins/Onshore Oil and Gas Investigations Santa Maria Province

Sass, J.H., Lachenbruch, A.H., and Munroe, R.J., 1971, Thermal conductivity of rocks from measurements on fragments and its application to heat flow determinations: Journal of Geo physical Research, v. 76, p. 3391-3401.
Sass, J.H., Lachenbruch, A.H., Munroe, R.J., Greene, G.W., and Moses, T.H., Jr., 1971, Heat flow in the western United States: Journal of Geophysical Research, v. 76, p. 6376- 6413.
Sawyer, D.S., Hsui, A.T., and Toksoz, M.N., 1987, Extension, subsidence and thermal evolution of the Los Angeles Basin a two-dimensional model: Tectonophysics, v. 133, p. 15-32.
Stanley, R.G., and others, 1991, Age, correlation, and origin of the type Lospe Formation (lower Miocene), Santa Maria basin, central California: American Association of Petroleum Geologists Bulletin, v. 75, no. 2, p. 382.
Trehu, Anne, 1991, Tracing the subducted oceanic crust beneath the central California continental margin: results from ocean bottom seismometers deployed during the 1986 Pacific Gas and Electric EDGE experiment: Journal of Geophysical Research, v. 96, p. 6493-6506.
Turcotte, D.L., and Schubert, Gerald, 1982, Geodynam- ics applications of continuum physics to geological prob lems: New York, Wiley, 450 p.
Upson, J.E., and Thomasson, H.G., Jr., 1951, Geology and water resources of the Santa Ynez River Basin, Santa Barbara
County, California: U.S. Geological Survey Water Supply Paper 1107.
Vacquier, Victor, 1985, The measurement of thermal conductivity of solids with a transient linear heat source on the plane sur face of a poorly conducting body: Earth and Planetary Sci ence Letters, v. 74, p. 275-279.
Von Herzen, R.P., and Maxwell, A.E., 1959, The measurement of thermal conductivity of deep-sea sediments by needle probe methods: Journal of Geophysical Research, v. 64, p. 1557- 1563.
Williams, C.F., and Lachenbruch, A.H., 1991, The San Andreas Fault geotherm revisited: Eos, v. 72, no. 44, p. 443.
Williams, C.F., and Narasimhan, T.N., 1989, Hydrogeologic con straints on heat flow along the San Andreas Fault a testing of hypotheses: Earth and Planetary Science Letters, v. 92, p. 131-143.
Woodring, W.P., and Bramlette, M.N., 1950, Geology and pale ontology of the Santa Maria District, California: U.S. Geo logical Survey Professional Paper 222.
Worts, G.F., Jr., 1951, Geology and groundwater resources of the Santa Maria Valley area, California: U.S. Geological Survey Water Supply Paper 1000, 169 p.
Zandt, George, and Furlong, K.P., 1982, Evolution and thickness of the lithosphere beneath coastal California: Geology, v. 10, p. 376-381.
The Thermal Regime of Santa Maria Province, California F25


Chapter G
Phosphorus Geochemistry, Diagenesis,and Mass Balances of the Miocene MontereyFormation at Shell Beach, California
By GABRIEL M. FILIPPELLI and MARGARET L. DELANEY
U.S. GEOLOGICAL SURVEY BULLETIN 1995
EVOLUTION OF SEDIMENTARY BASINS/ONSHORE OIL AND GAS INVESTIGATIONS- SANTA MARIA PROVINCE
Edited by Margaret A. Keller

CONTENTS
Abstract Cl Introduction Gl
Acknowledgments G3 Methods G3 Results and discussion G5 Conclusion G10 References G10
FIGURES
1. Reconstruction of onshore and offshore Neogene paleobasins along south-central California coast, showing field area at Shell Beach in Pismo basin and location of Exxon Hondo Well B G2
2. Schematic columnar section for portion of Monterey Formation exposed at Shell Beach, California, including portion of Shell Beach section studied here G3
3. Phosphorus concentration results from metaborate/tetraborate fusion with determi nation by X-ray fluorescence fusion versus values determined by five-step sequen tial extraction for 10 samples from Exxon Hondo Well B G4
4. Phosphorus concentration versus sequential-extraction steps for three samples from Shell Beach dolomite, porcellanite, and phosphatic shale G5
5. Stratigraphic height in meters from base of section shown in figure 2 versus phos phorus concentrations G7
6. Phosphorus concentrations extracted using standard extraction procedure and same procedure with an extra buffered acetic-acid wash during extraction step that releas es reactive P G9
7. Reactive phosphorus versus unreactive phosphorus in phosphatic shales and dolo- mitic and siliceous lithdlogies from Shell Beach G9
TABLES
1. Sample descriptions and phosphorus concentrations from Shell Beach, California (Miocene Monterey Formation) G6
2. Mean phosphorus (P) concentrations and error estimates for lithologies, P compo nents, and fades at Shell Beach G8
Phosphorus Geochemistry, Diagenesis, andMass Balances of the Miocene Monterey Formationat Shell Beach, California
By Gabriel M. Filippelli 1 and Margaret L. Delaney2
Abstract
Continental margins can be important areas of oceanic phosphorus (P) accumulation, especially given diagenetic reactions that transform organic P in sediments to authigenic P by phosphogenesis in continental margin deposits with high organic productivity like the Miocene Monterey Formation of California. To determine P concentrations and P stratigraphy, we tested a five-step sequential-extraction technique, which differentiates five sedimentary P-bearing components, for application to a well-dated Miocene phosphatic sequence at Shell Beach, California. The lower facies at the Shell Beach section (upper part of the phosphatic facies) is interbedded calcareous and laminated phosphatic shale, and the upper facies (lower part of the siliceous facies) is interbedded sili ceous and laminated phosphatic shale with rare calcareous strata. We sampled from the entire exposure of the phosphatic facies (75 m) and the lower third (62 m) of the siliceous facies, as exposed in the Shell Beach section. Sequential-extraction results revealed that greater than 95 percent of P in these strata occurs as reactive P (Pr; as authigenic and biogenic sedimen tary components) and unreactive P (Pur; as detritally associ ated sedimentary components). Less than 5 percent of P occurs as a combination of loosely bound, iron-bound, and organic P. Organic matter predominates as the main carrier of P to modern continental margin sediments; therefore, our extraction results indicate that extensive reorganization of P between sedimentary components has occurred at Shell Beach, presumably as a result of phosphogenesis.
On the basis of optimization experiments with these sed imentary rock samples, we used a two-step modification of Ruttenberg's (1990, 1992) procedure to determine Pr and Pur Shales at Shell Beach generally have higher P concentrations than other lithologies (for example, dolomitic and siliceous strata). Pr concentrations range from 0.01 to 0.27 weight per-
1Earth Sciences Board and Institute of Marine Sciences, University of California, Santa Cruz, CA 95064.
Institute of Marine Sciences, University of California, Santa Cruz, CA 95064.
Manuscript approved for publication, June 21,1994.
cent (wt pet) P in dolomitic and siliceous strata and from 0.34 to 2.10 wt pet P in phosphatic shales. Pur concentrations range from 0.00 to 0.08 wt pet P in dolomitic and siliceous strata and from 0.02 to 2.50 wt pet P in phosphatic shales. Total P (PT) concentrations (Pr+Pur) range from 0.02 to 0.42 wt pet P in dolomitic and siliceous strata and from 0.36 to 3.90 wt pet P in phosphatic shales. Mean Pr concentrations in shales of the siliceous facies (1.41±0.35 wt pet P) are slightly higher than those of the phosphatic facies (0.98±0.21 wt pet P), mean Pur concentrations in shales of the siliceous facies (1.21±0.52 wt pet P) are higher than those of the phosphatic facies (0.48±0.40 wt pet P), and mean Pj concentrations in shales of the siliceous facies (2.62±0.73 wt pet P) are higher than those of the phos phatic facies (1.46±0.41 wt pet P).
We calculated the weighted mean P concentrations, tak ing into account the mean P concentration in each lithologic type and the thickness of the section occupied by that lithol- ogy. The phosphatic facies has a higher mean PT concentra tion (1.09±0.31 wt pet P) than the siliceous facies (0.66+0.22 wt pet P). Although shales of the siliceous facies have a higher mean P concentration than those of the phosphatic facies, the dominance of shales in the phosphatic facies results in it hav ing higher mean P concentrations than the siliceous facies.
Determining the dominant P-bearing components that reflect a variety of depositional and postdepositional processes has important implications for understanding P diagenesis and burial in a continental margin setting with high organic pro ductivity. The high PT concentrations observed for phosphatic shale strata from Shell Beach, which are minimum estimates, indicate that most of the P is probably retained and argue for redistribution of P from organically bound P to other forms after burial. High authigenic/biogenic P concentrations indi cates that phosphogenesis plays an important role in the con version of organic P to CFA (the authigenic mineral carbonate fluorapatite), and the correlation between Pr and Pur in phos phatic shales from Shell Beach indicates that there may be additional post-phosphogenesis transformations of P, which need to be investigated.
INTRODUCTION
Quantifying the reservoirs and fluxes in the marine phosphorus (P) cycle is important because P, in the form of
Phosphorus Geochemistry, Diagenesis, and Mass Balances of the Miocene Monterey Formation at Shell Beach, California G1

dissolved phosphate, is an essential limiting nutrient for primary organic productivity. The marine phosphorus (P) cycle has been the subject of a number of studies (for example, Froelich and others, 1982; Froelich, 1984, 1988; Mach and others, 1987; Baturin, 1988; Ruttenberg, 1990). The main input of phosphate into the ocean is from rivers, and the sole output is burial in continental-margin and deep-sea sediments in various forms (Froelich, 1984, 1988; Ruttenberg, 1990; Ruttenberg and Berner, 1993). Phospho rus enters the ocean system in two forms dissolved (or reactive) and detrital (or unreactive). Dissolved phosphate is mostly taken up by microorganisms during surface pro ductivity and is transported to sediments in the form of organic matter, with a small fraction of what is produced being buried. Unreactive phosphorus is associated with detrital grains. Recent work on the kinetics of P mobility shows that detrital-P phases are refractory in the marine environment and do not exchange with the oceanic dis- solved-P reservoir (Froelich, 1988; Ruttenberg, 1990; Rut tenberg and Berner, 1993). Although continental margin sediments may receive the majority of the total riverine-P flux (including reactive and unreactive forms) (Baturin, 1988), the rate of removal of reactive/dissolved P from the oceanic P reservoir is roughly equal in continental margin and deep sea sediments (Froelich and others, 1982). Reac- tive-P fluxes to continental margin sediments are especially high beneath areas of high productivity (for example, Peru margin, Namibian shelf; Baturin, 1972; Burnett and others, 1982; Froelich and others, 1988). High organic-matter rain rates and accompanying organic matter regeneration in sed iments beneath these areas can lead to elevated pore-water phosphate concentrations, which in turn can drive phospho- genesis (authigenic precipitation of solid P-bearing mineral phases, mainly carbonate fluorapatite (CFA)) in near-sur face sediments (Burnett, 1977; Sheldon, 1981; Kolodny, 1983). Phosphogenesis effectively "locks" P into the sedi ments, leading to its removal from the oceanic system. Continental margin sediments are presently important areas of marine P accumulation, as they were in ancient oceans as well (Filippelli and Delaney, 1992), and these accumula tions provide an opportunity to examine variations in P diagenesis and burial in detail.
Changes in oceanic circulation, surface biological pro ductivity distribution, and biogenic sedimentation during the Miocene are reflected in changing continental margin sediment compositions. The accumulation of organic car bon-rich, and presumably P-rich, sediments in low-oxygen basins is thought to have resulted in the positive shift in the oceanic carbon-isotope record during the middle Miocene (Vincent and Berger, 1985; Compton, Snyder, and Hodell, 1990). Phosphatic sedimentary rocks of Miocene age are widely distributed. Notable examples are the phosphatic sands of the Hawthorn and Pungo River Formations in the southeastern United States (Riggs, 1984; Riggs and Shel don, 1990; Snyder and others, 1990; Compton, Snyder, and
Hodell, 1990; Compton, Hodell, Garrido, and Mallinson, 1993) and the Monterey Formation of California (Pisciotto and Garrison, 1981; Garrison, Kastner, and Kolodny, 1987; Garrison, Kastner, and Reimers, 1990). The Monterey For mation was mainly deposited in marginal fault-bounded basins which developed since the Oligocene as transten- sional basins along the San Andreas Fault system (Blake and others, 1978; Howell and others, 1980; Graham, 1987). The general depositional facies of the Monterey Formation, characterized by the succession of calcareous, phosphatic, and siliceous rocks (fig. 1), are wide-spread and have been recognized and described by many workers (Canfield, 1939; Woodring and others, 1943; Woodring and Bramlette, 1950; Isaacs, 1980, 1984; Pisciotto, 1978, 1981; Pisciotto and Garrison, 1981). However, characteristic lithologies do not occur in all locations, facies transitions do not occur simultaneously in California continental-borderland basins, and the terminology used and subdivisions assigned differ between different studies and for different localities. We chose the informal nomenclature of Pisciotto (1978, 1981), as it best describes the lithotypes encountered in our study (lower calcareous facies, middle phosphatic facies, and upper siliceous facies; only the upper part of the phosphatic facies and siliceous facies are present in our study area at Shell Beach). The Monterey Formation is an excellent record of changing continental margin deposition, record ing calcareous deposition during the early middle Miocene
Figure 1. Reconstruction of onshore and offshore Neogene paleobasins (stippled area) along south-central California coast, showing field area for this study at Shell Beach in Pismo basin and location of Exxon Hondo Well B (after Gar rison, Katner, and Kolodny, 1987).
G2 Evolution of Sedimentary Basins Santa Maria Province

(calcareous fades), a transitional period of calcareous and abundant phosphatic deposition during the middle Miocene (phosphatic facies), and mainly siliceous deposition during the late middle Miocene (siliceous facies). The calcareous and phosphatic facies have been interpreted as correspond ing to warm oceanic conditions with relatively sluggish oceanic circulation and the siliceous facies to the develop ment of polar glaciation, cold-water upwelling, higher nutrient levels, and higher organic matter productivity (Ingle, 1981; Pisciotto and Garrison, 1981; Barron and Keller, 1983; Garrison, Kastner, and Reimers, 1990).
The phosphatic sedimentary rocks in the Shell Beach section of the Monterey Formation, exposed in seacliffs about 15 km south of San Luis Obispo on the central Cali fornia coast (fig. 1), were deposited in the Pismo basin during the middle Miocene (Omarzai, 1992). The Shell Beach section includes part of the phosphatic and siliceous facies of the Monterey Formation (fig. 2) and consists of calcareous-rich phosphatic mudrocks, marlstones, and shales (dark, laminated, and organic rich with thin (0.5-10 mm), white, discontinuous laminae and micronodules of CFA) interbedded mainly with dolomites in the phosphatic facies and mainly with siliceous mudstones, porcellanites, and cherts in the siliceous facies. The 290 m of section at Shell Beach begins in the phosphatic facies at 15.2 Ma, is interrupted by a period of nondeposition from 14.3 to 13.25
Pismo Fm.
c0
CO
E
o u.
0>
Q>
Co5
wo
oCO
0)
0o o
~
£ W
Q.
Obispo Fm.
Height (m)
-300-
-250-
-200-
-150-
-100-
-50 -
VS
ss
s
Sampling range of this study
X
x
Figure 2. Schematic columnar sec tion for portion of Monterey For mation exposed at Shell Beach, California (after Omarzai, 1992), including portion of Shell Beach section studied here.
Ma marked by phosphatic hardgrounds, and continues with the siliceous facies from 13.25 Ma to the top of the section at approximately 11.0 to 11.4 Ma (Omarzai (1992), on the basis of magnetic age model of Harland and others (1982)). This study focused on the interval from 15.2 Ma (0 meters stratigraphic height in the field section) to the 14.3-Ma base of the phosphatic hardgrounds (75 meters stratigraphic height), and the interval from the top of the phosphatic hardgrounds at 13.25 Ma to 12.85 Ma (137 meters strati- graphic height). Average lithologic abundances by thick ness for the section studied here are 73 percent phosphatic shale and 27 percent dolomitic strata in the phosphatic facies and 20 percent phosphatic shale and 80 percent sili ceous strata in the siliceous facies (Omarzai, 1992). Mean sedimentation rates are 88 m/m.y. for the interval of the phosphatic facies and 154 m/m.y. for the interval of the siliceous facies studied here (Omarzai, 1992).
Acknowledgments
We thank the Department of Defense (National Defense Science and Engineering Graduate Fellowship to Gabriel Filippelli), the National Science Foundation (grant OCE89- 11530 to Margaret Delaney), and the University of Califor nia, Santa Cruz, Earth Sciences Board (Research grant to Gabriel Filippelli) for support of this research. We thank Robert Garrison, Caroline Isaacs, Margaret Keller, Casey Moore, Ken Bruland, Flip Froelich, Kathleen Ruttenberg, Sally Catlin, Sheraz Omarzai, and Laura Linn for valuable discussions. We also thank Rob Franks and the University of California, Santa Cruz, Institute of Marine Sciences Marine Analytical Laboratory for technical assistance and advice, and Suzanne Ware and Emily Oatney for careful and diligent assistance with sample preparation and analysis. Caroline Isaacs graciously donated samples from Exxon Hondo Well B for correlation of P results, and we acknowledge Exxon for the samples and permission to report the results of the P determinations. Margaret Keller provided helpful comments and excellent editorial handling. Reviews by Caroline Isaacs and David Piper greatly improved the content and clarity of this paper.
METHODS
Samples were collected at low tide using a rock ham mer, and sample positions were correlated to the strati- graphic column of Omarzai (1992). Sample sizes ranged from about 2 to 100 cm3 . Sampling focused on the phos phatic shale in both facies, which was assumed to contain a majority of the P in this section; a few samples were taken from dolomitic, siliceous, and tuffaceous strata as well. Samples were rinsed with deionized water to remove sur face salts, dried at 60°C, and ground, first in a mechanical
Phosphorus Geochemistry, Diagenesis, and Mass Balances of the Miocene Monterey Formation at Shell Beach, California G3

agate mortar and pestle grinder and then by hand in a ceramic mortar and pestle. The samples were ground to 120 mesh (125 (im) and passed through a clean metal sieve. The samples were sieved frequently during grinding into a metal collection dish to ensure that particle size remained consistent and that the sample was not ground too finely for the chemical extraction procedure. After grinding, samples were stored in 22 mL glass scintillation vials.
The chemical sequential-extraction technique used in this study was based on that developed by Ruttenberg (1990, 1992) for the determination of P concentrations in different P-bearing phases in modern sediments. This sequential- extraction technique uses the solubility differences of five sedimentary P-bearing phases by treating the sample powder with various complexing, reducing, and acidic solutions to separate different P fractions (loosely bound or adsorbed, iron oxides and oxyhydroxides, authigenic and biogenic minerals, and organic matter, all of which are reactive, and detrital phases, which are unreactive). This technique, which distinguishes five forms of sedimentary P with different geochemical significance, is an improvement over methods that distinguish only inorganic and organic forms of P (for example, Aspila, X-ray fluorescence (XRF) fusion), where inorganic forms include some reactive P and some unreac tive P. There have been criticisms of sequential-leaching extraction techniques (see Nirel and Morel (1991) for dis cussion), because the determined components are operation ally defined and the results require careful interpretation, owing to the limitations and assumptions of the particular technique. Ruttenberg (1990, 1992) carefully optimized her procedure by using model mineral phases along with evalua tion of optimal reagent concentrations and leaching times. Her procedure yielded total P values (the sum of the P components) comparable to total P values determined by other methods (for example, Aspila, XRF fusion; Rutten berg, 1990,1992).
The Monterey Formation rocks at Shell Beach have undergone widespread diagenesis due both to the near-sea- floor authigenic precipitation of CFA and to compaction and porosity reduction of all strata. Therefore, P distribu tions in these rocks may differ substantially from those in modern sediments, for which the five-step sequential- extraction technique was developed. To test the efficiency of the five-step sequential extraction technique for deter mining P concentrations in diagenetically altered litholo- gies (Ruttenberg, 1990, 1992), we compared the sum of the five P components for 10 samples from Exxon Hondo Well B (fig. 1) (with lithologies similar to those encountered at Shell Beach) to P determinations on the same samples using the standard total P analyses (metaborate/tetraborate fusion with determination by XRF) presented in Isaacs and others (1992). The sequential extraction P results agreed closely with the XRF fusion P results (fig. 3). Sequential extraction total P results are consistently slightly lower than total P results determined by XRF fusion, a condition
which may be the result of an uncorrected blank in the XRF determinations (possibly indicated by the nonzero intercept of the regression line) or of a greater efficiency of the fusion technique in extracting P from more refractory min eral phases. Nevertheless, the two different techniques yield comparable P results, supporting the accuracy of total P measurements determined by the sequential-extraction technique.
To evaluate the significance of the different P-bearing components in samples from Shell Beach, we analyzed three Shell Beach samples representing a range of litholo gies (phosphatic shale, porcellanite, and dolomite) and total weight percent (wt pet) P. Phosphorus concentrations asso ciated with adsorbed P, iron-bound P, and organic P were low compared to authigenic/biogenic P and detrital P (fig. 4). Greater than 95 percent of the P in each sample was present as authigenic/biogenic and detrital P components, as compared to about 70 to 80 percent in typical deep sea sediments (Ruttenberg and Berner, 1993). This difference is due both to extensive phosphogenesis (enriching the sedi ment in authigenic/biogenic P forms) and a relatively close proximity of the Shell Beach sediments during deposition to detrital sources. Owing to the diagenetic changes in these
oex
0.8
0.6
0.4
0.2
0.00.0 0.2 0.4 0.6 0.8
Wt pet P (sequential extraction)
Figure 3. Phosphorus concentration (weight percent (wt pet)) results from metaborate/tetraborate fusion with determination by X-ray fluorescence (XRF) fusion (data from Isaacs and oth ers, 1992) versus values determined by five-step sequential extraction (total of all steps) for 10 samples from Exxon Hondo Well B. These results show that these two techniques yield comparable total phosphorus concentration values, with a linear regression slope of 1.07±0.10, an intercept of 0.03±0.04 (both at 95-percent confidence level on calcu lated slope and intercept), and an r2 of 0.982 (correlation significant at greater than 99-percent confidence level).
G4 Evolution of Sedimentary Basins Santa Maria Province

rocks, P concentrations of the less abundant P-bearing phases probably do not reflect original depositional condi tions and may only be useful for understanding long-term P diagenesis. We, therefore, streamlined Ruttenberg's (1990, 1992) technique to a two-step sequential extraction, which isolated reactive P components (Pp equivalent to the sum of adsorbed, iron-bound, and authigenic/ biogenic P) and unreactive P components (Pup detrital P). Organic-P forms (a relatively insignificant portion of total P in all samples) are not released in this modified extraction scheme.
In the first step of our modified extraction technique, which isolates reactive P (Pr), 0.5 g of ground sample was placed in a 50-mL polyethylene centrifuge tube. There were four sequential sample treatments: (1) solid treated with 50 mL of 1.5 molar Na-acetate solution buffered to pH 4 with acetic acid and shaken on an orbital shaker for 6 hours, (2) solid treated with 50 mL of 1 molar MgCl2 and shaken for two hours, (3) solid treated again as in treatment (2), and (4) solid treated with 50 mL of glass-distilled water and shaken for 2 hours. After each treatment, samples were cen- trifuged for 10 minutes, and a known volume (10 mL) of the homogeneous supernatant was transferred with a pipette
1.4
0.8
0.6
0.4
0.2
0.0
n
I II III IV V I II III IV V I II III IV VDolomite Porcellanite Phosphatic shale
(£ Wt pct=0.096) (£ Wt pct=0.553) (£ Wt pct=2.25)
Figure 4. Phosphorus concentration (weight percent (wt pet)) versus sequential-extraction steps for three samples from Shell Beach dolomite, porcellanite, and phosphatic shale. Note scale break in y-axis. Extraction steps on x-axis are I, adsorbed P; II, iron-bound P; III, authigenic/biogenic P; IV, detritally associated P, and V, organic P. Plot shows that almost all P (greater than 95 percent) determined for these samples occurs as authigenic/biogenic P and detritally asso ciated P.
to an acid-cleaned polyethylene bottle, combining the supernatants from all four treatments for sample P determi nations. The remainders of the supernatants were discarded. This step releases adsorbed P, iron-bound P, and authigenic/ biogenic P from the sample. All of these P forms are reac tive in the oceanic system, and we call the sum of them Pr in this study. In the second step of the extraction, 50 mL of 1 N HC1 was added to the residual sample and the sample was shaken for 16 hours. The sample was centrifuged and supernatant collected as above for P determinations. This step releases detrital P forms, which are unreactive in the oceanic system and which we call PUP from the sample.
Phosphorus concentration determinations in extraction solutes were performed with the standard molybdate blue acetic-acid method (Strickland and Parsons, 1972) using a Shimadzu UV-2101 PC UV-VIS scanning spectrophotome- ter at 885 nm, with the Sipper 260 autosipper attachment and the Shimadzu computer interface program for absorp tion determinations and concentration calculations. Because of their high P concentrations, samples were commonly diluted by a factor of 100 to 1,000 with glass-distilled water before analysis, and P standards were prepared in glass- distilled water, as the high dilution factors resulted in no significant sample-matrix effect.
Relative errors on solid sample splits were from 1 to 20 percent (typically about 6 percent). Relative errors on solution replicates ranged from 0 to 5 percent (typically about 2 percent). Dilution of sample solutions (100 to 1000 times with glass-distilled water) before analysis was adjusted to yield high signal to noise ratios, resulting in a low detection limit (typically about 0.0005 wt pet P).
RESULTS AND DISCUSSION
Phosphorus concentrations and standard deviations for the 35 samples analyzed in this study are presented in table 1 and figure 5. Phosphorus concentrations for the reactive component (Pr) ranged from 0.005 to 2.41 wt pet P (equivalent to 0.01 to 5.5 wt pet P2O5) for all samples (table 1; fig. 5). Shale samples generally had relatively high reactive P concentrations, ranging from 0.339 to 2.12 wt pet P. Dolomitic, siliceous, and tuffaceous samples had rel atively low P concentrations, ranging from 0.050 to 0.271 wt pet P. The phosphatic hardground, formed during a 1- m.y. hiatus, had the highest Pr observed (2.41 wt pet P); on the basis of the presence of reworked and extensively bored phosphatic clasts and nodules, this hardground probably represents a winnowed, phosphatized sedimentary layer. Standard deviations (la) for replicate P determinations on solid samples ranged from ±0.00 to ±0.21 wt pet P, with an average error of about ±0.04 wt pet P (equivalent to ±5 percent relative error).
Phosphorus concentrations for the unreactive compo nent (Pur) ranged from 0.001 to 2.48 wt pet P (equivalent
Phosphorus Geochemistry, Diagenesis, and Mass Balances of the Miocene Monterey Formation at Shell Beach, California G5
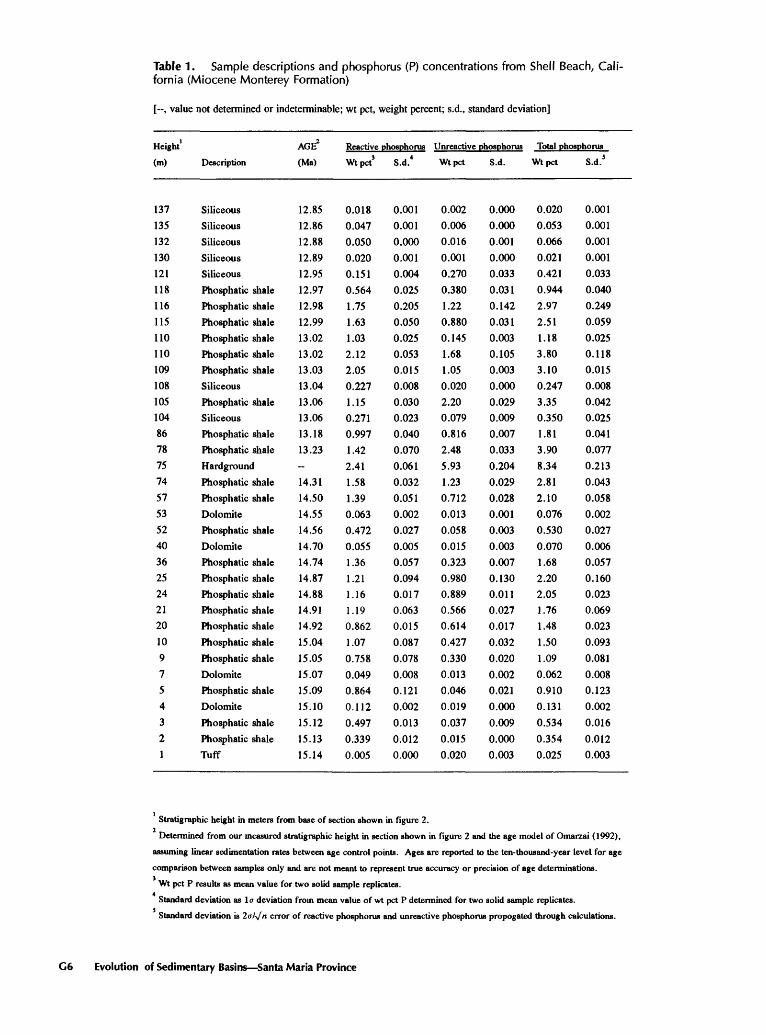
Table 1. Sample descriptions and phosphorus (P) concentrations from Shell Beach, Cali fornia (Miocene Monterey Formation)
[--, value not determined or indeterminable; wt pet, weight percent; s.d., standard deviation]
Height1
(m)
137
135
132
130
121
118
116
11511011010910810510486787574575352403625242120109754321
Description
Siliceous
Siliceous
Siliceous
Siliceous
Siliceous
Phosphatic shale
Phosphatic shale
Phosphatic shale
Phosphatic shale
Phosphatic shale
Phosphatic shale
Siliceous
Phosphatic shale
Siliceous
Phosphatic shale
Phosphatic shale
Hardground
Phosphatic shale
Phosphatic shale
Dolomite
Phosphatic shale
Dolomite
Phosphatic shale
Phosphatic shale
Phosphatic shale
Phosphatic shale
Phosphatic shale
Phosphatic shale
Phosphatic shale
Dolomite
Phosphatic shale
Dolomite
Phosphatic shale
Phosphatic shale
Tuff
AGE*
(Ma)
12.85
12.86
12.88
12.89
12.95
12.9712.9812.9913.0213.0213.0313.0413.0613.0613.1813.23-
14.3114.5014.5514.5614.7014.7414.8714.8814.9114.9215.0415.0515.0715.0915.1015.1215.1315.14
Reactive phosphorus
Wtpct3
0.018
0.047
0.050
0.0200.1510.5641.751.631.032.122.050.2271.150.2710.9971.422.411.581.390.0630.4720.0551.361.211.161.190.8621.070.7580.0490.8640.1120.4970.3390.005
S.d. 4
0.0010.0010.0000.0010.0040.0250.2050.0500.0250.0530.0150.0080.0300.0230.0400.0700.0610.0320.0510.0020.0270.0050.0570.0940.0170.0630.0150.0870.0780.0080.1210.0020.0130.0120.000
Unreactive phosphorus
Wtpct
0.002
0.0060.0160.0010.2700.3801.220.8800.1451.681.050.0202.200.0790.8162.485.931.230.7120.0130.0580.0150.3230.9800.8890.5660.6140.4270.3300.0130.0460.0190.0370.0150.020
S.d.
0.0000.0000.0010.0000.0330.0310.1420.0310.0030.1050.0030.0000.0290.0090.0070.0330.2040.0290.0280.0010.0030.0030.0070.1300.0110.0270.0170.0320.0200.0020.0210.0000.0090.0000.003
Total phosphorus
Wt pet S.d. 3
0.020
0.053
0.0660.0210.4210.9442.972.511.183.803.100.2473.350.3501.813.908.342.812.100.0760.5300.0701.682.202.051.761.481.501.090.0620.9100.1310.5340.3540.025
0.0010.0010.0010.0010.0330.0400.2490.0590.0250.1180.0150.0080.0420.0250.0410.0770.2130.0430.0580.0020.0270.0060.0570.1600.0230.0690.0230.0930.0810.0080.1230.0020.0160.0120.003
Stratigraphic height in meters from base of section shown in figure 2.
Detennined from our measured stratigraphic height in section shown in figure 2 and the age model of Omarzai (1992),
assuming linear sedimentation rates between age control points. Ages are reported to the ten-thousand-year level for age
comparison between samples only and are not meant to represent true accuracy or precision of age determinations.
Wt pet P results as mean value for two solid sample replicates.
Standard deviation as la deviation from mean value of wt pet P determined for two solid sample replicates.
Standard deviation is 2aA/n error of reactive phosphorus and unreactive phosphorus propogated through calculations.
G6 Evolution of Sedimentary Basins Santa Maria Province

to 0.002 to 5.68 wt pet P2O5), with the phosphatic hard- ground sample having 5.93 wt pet P (13.6 wt pet ?2O5 ; table 1; fig. 5). Standard deviations (la) for replicate P determinations on solid samples ranged from ±0.000 to ±0.20 wt pet P (±8 percent relative error). As with Pp higher Pur concentrations were generally found for phos phatic shales (from 0.015 to 2.48 wt pet P) and lower Pur concentrations tended to be from dolomitic, siliceous, and tuffaceous samples (from 0.002 to 0.27 wt pet P) although there was some overlap in values.
Phosphorus concentrations for the sum of both com ponents (PT) ranged from 0.025 to 3.90 wt pet P, with the phosphatic hardground sample having 8.34 wt pet P (table 1; fig. 5). Standard deviations (la) ranged from ±0.001 to ±0.249 wt pet P (±5 percent relative error).
The mean Pr concentration for shales in the siliceous facies was 1.41±0.34 wt pet, and that for shales of the phosphatic facies was 0.98±0.21 wt pet (table 2). The mean Pr concentration for siliceous strata of the siliceous facies was 0.11 ±0.08 wt pet P, and for the mainly dolo mitic strata of the phosphatic facies was 0.06±0.03 wt pet (table 2). For the entire Shell Beach section, the mean Pr concentration in shale strata was 1.16±0.20 wt pet P and in other strata was 0.09±0.05 wt pet P. This observation indicates that shale strata generally contain much more Pr than dolomitic or siliceous strata.
Mean Pm concentrations in shales of the siliceous facies (1.21±0.52 wt pet) are generally higher than in
shales of the phosphatic facies (0.48±0.22 wt pet; table 2), though there is some overlap. Mean Pur concentrations in the siliceous strata of the siliceous facies was 0.06±0.07 wt pet P and in the mainly dolomitic strata of the phos phatic facies was 0.016+0.003 wt pet (table 2). For the entire Shell Beach section, the mean Pur concentration in shale strata was 0.78±0.28 wt pet P and in other strata was 0.04±0.07 wt pet P. This observation indicates that shale strata generally contain much more Pw than dolomitic or siliceous strata (assuming linear and equivalent sedimenta tion rates for these lithotypes; see Filippelli and others (1994) for discussion).
Compared to the terrigenous-flux calculations of Isaacs and others (1992) for other Monterey Formation deposits, PU,. concentrations in some samples from this study were higher than expected, if these concentrations record only detrital influx. To examine whether the extrac tion technique completely dissolved Pr components (an incomplete dissolution of this component would lead to apparently high Pur values), we compared our results to P concentration results for a small set of samples that we treated with two (instead of one) buffered acetic-acid washes (fig. 6). This also helped to evaluate concerns of reagent P saturation due to the high P concentrations in many of the samples. Experiments to determine experimen tal separation between Pr and Pur show that the original Pr results, with one buffered acetic-acid wash, yielded essen tially the same results as the efficiency experiments with
1JU
125
100
g£ 75Ml'5
ffi
50
25
0 (
A1?
«
1 _
° '
n m
f m
a
1 1
B1 P
D
-
'
"
S
n m
% '"
! D i i
i i
i i i i i
C1
^
D
°D "
'
-
^ m
D
- ..-
: i " i i i i i
) 1 2 30 1 2 3 0 1 2 3 4 5 e
Wt pet Pr Wt pet Pur Wt pet PT
Figure 5. Stratigraphic height in meters from base of section shown in figure 2 versus phosphorus concentrations (weight percent (wt pet)). A, wt pet reactive P (Pr); B, wt pet unreactive P (Pur); C, wt pet total P (PT), which is the sum of Pr and Pur Solid squares are phosphatic shale samples and open squares are other strata, which have mainly dolomitic and siliceous lithologies.
The Thermal Regime of Santa Maria Province, California G7

Table 2. Mean phosphorus (P) concentrations and error estimates for lithologies, P com ponents, and facies at Shell Beach
[NA, not applicable; wt pet, weight percent]
No. 1Lithologic
fraction
Reactive phosphorus
Mean S.d.'
wtpct
Unreactive phosphorus Total phosphorus
Mean S.d.
wtpct
Mean
wtpct
S.d.
Siliceous facies
Shale
Siliceous
Weighted mean
9
7
NA
0.20
0.80
NA
1.41
0.11
0.37
0.34
0.08
0.12
1.21
0.06
0.29
0.52
0.07
0.14
2.62
0.17
0.66
0.73
0.13
0.22
Phosphatic facies
Shale
Dolomitic
Weighted mean
13
5
NA
0.73
0.27
NA
0.98
0.06
0.73
0.21
0.03
0.16
0.48
0.02
0.35
0.22
0.00
0.16
1.46
0.07
1.09
0.41
0.03
0.31
Shell Beach total
Shale
Other lithologies
Weighted mean
22
12
NA
0.47
0.53
NA
1.16
0.09
0.59
0.20
0.05
0.11
0.78
0.04
0.38
0.28
0.04
0.14
1.94
0.13
0.97
0.44
0.08
0.23
Number of samples.
Fraction of section (by stratigraphic height) occupied by that lithology. We assume an absolute error of 0.05 on
lithology thickness.
Standard deviation (2aA/n) on means for each lithology; 2erA/n standard deviation propogated through the calculations
for weighted mean values.
Weighted mean P concentration based on the mean P concentrations of each lithology and the fraction of the section
occupied by that lithology.
With the exception of one tuffaceous sample.
two buffered acetic-acid washes (fig. 6). Therefore, the technique we use does result in complete removal of CFA, which is acetic acid (buffered) soluble. The apparently high Pur concentrations may be explained by the chemistry and mineralogy of the CFA minerals themselves and may be the result of a transformation through time of "reactive" P to "unreactive" P, a process which yields apparent unreactive P concentrations that are higher in shale strata, which orig inally contained much higher reactive P concentrations than dolomitic or siliceous strata, than in dolomitic or siliceous strata. On the basis of Fourier Transform Infrared Spectros- copy (FTIR) analyses of sedimentary apatites including samples from the Monterey Formation, recent work indi cates that CFA can nonsystematically convert with time to a "purer" fluorapatite form owing to decarboxylation and loss of the carbonate ion, which partially substitutes for the phosphate ion in the CFA mineral lattice (Shemesh, 1990).
Because fluorapatite is not readily soluble in buffered acetic acid, this decarboxylation process could result in lower Pr concentrations (and higher Pur concentrations) compared to the postphosphogenesis composition of the sediments. Our results, indicating relatively high Pm concentrations for some samples from Shell Beach, lend further evidence in support of this transformation of CFA. These results also have bearing on the interpretation of our Pr and Pur concen trations. If decarboxylation with time is the cause of appar ently higher P^ concentrations, then our Pr concentrations are minimum values for the post-phosphogenesis reactive-P concentration. There is a positive correlation between Pr and Pur in phosphatic shales but not in other lithologies (fig. 7). This correlation may represent the diagenetic trans formation of Pr to apparent Pur or may be tracking a rela tionship between sedimentation rate (indicated by Pur concentrations) and reactive P burial.
G8 Evolution of Sedimentary Basins Santa Maria Province

The mean PT concentration in shales of the siliceous facies (2.62+0.73 wt pet) is higher than those of the phos- phatic facies (1.46+0.41 wt pet; table 2). The mean PT concentration in the siliceous strata of the siliceous facies was 0.17±0.13 wt pet P and in the mainly dolomitic strata of the phosphatic facies was 0.07+0.03 wt pet (table 2). For the entire Shell Beach section, the mean PT concentra tion in shale strata was 1.94±0.44 wt pet P and in other strata was 0.13±0.08 wt pet P. These data indicate that shale generally contains much more PT than dolomitic or siliceous strata at Shell Beach.
To compare the mean concentration of P contained in each of the facies, we calculated a weighted mean of P concentrations in each lithology (shale, dolomite, siliceous) versus the fraction of the thickness of each facies repre-
10
PL. »-»o0.
0
I
234 Sample number
Figure 6. Phosphorus concentrations (weight percent (wt pet)) extracted using standard (two-step) extraction procedure (first bar of each sample number) and same procedure with an extra buffered acetic-acid wash during extraction step that releases reactive P (second bar of each sample number). Sample num bers represent following samples from Shell Beach (identified by sample height): 1, 2 m; 2, 121 m; 3, 105 m; 4, 110 m; 5, phosphatic hardground at 76 m. Open portion of each bar represents wt pet reactive P (Pr), closed portion represents wt pet unreactive P (Pur), and entire bar is the sum of these two components (total P (PT)). Typical 1o standard deviation on replicate analyses for PT determinations is depicted on error bar at 5 wt pet, and typical 1o standard deviations on replicate analyses for Pr and Pur is depicted on error bar at 2 wt pet. There are no systematic differences between wt pet Pp PUP and total P for the two procedures used to analyze each of these five samples. Differences in total-P values for standard and extra buffered acetic-acid extractions for sample number 5 (phosphatic hardground) probably represent sample heteroge neity for this sample rather than real differences in ability of techniques used to extract P.
sented by that lithology. For the siliceous facies, the mean Pr concentration (0.37+0.12 wt pet) was lower than that of the phosphatic facies (0.73±0.16 wt pet), the mean Pm con centration (0.29±0.14 wt pet) was about the same as that of the phosphatic facies (0.35±0.16 wt pet), and the mean PT concentration (0.66+0.22 wt pet) was lower than that of the phosphatic facies (1.09±0.31 wt pet) (table 2). Thus, although shale of the siliceous facies has higher mean P concentrations than shale of the phosphatic facies, the dom inance of shale strata in the phosphatic facies results in it being equal to or more important than the siliceous facies in terms of sedimentary-P concentrations. For the portion of the Shell Beach section studied here, the weighted mean Pr concentration is 0.59±0.11 wt pet P, the weighted mean P^ concentration is 0.38±0.14 wt pet P, and the weighted mean PT concentration is 0.97±0.23 wt pet P (table 2).
Determining the dominant P-bearing components that reflect a variety of depositional and postdepositional proc esses has important implications for P diagenesis and burial in a high organic-matter productivity continental margin setting. The P flux to modern continental margin sediments is dominated by organically bound P (Froelich, Bender, Luedtke, Heath, and DeVries, 1982; Ruttenberg, 1990; Ruttenberg and Berner, 1993). Because organic P is a minor portion of total P in our samples (about 1 percent;
0
Wt pet Pr
Figure 7. Reactive phosphorus (Pr) versus unreactive phospho rus (Pur) in phosphatic shales (filled squares) and dolomitic and siliceous lithologies (open squares) from Shell Beach in weight percent (wt pet). There is a correlation between Pr and PUI. for phosphatic shales, with a linear correlation coefficient r of 0.394 (significant at the 99-percent confidence level with n=22). There is no correlation between Pr and Pur for dolomitic and siliceous lithologies.
Phosphorus Geochemistry, Diagenesis, and Mass Balances of the Miocene Monterey Formation at Shell Beach, California G9

fig. 4), P originally deposited as organic P must either be redistributed or lost out of the sediments. The high total P concentrations observed for phosphatic shale of Shell Beach, which are minimum estimates, indicate that most of the P is probably retained and argue for redistribution of P from organically bound to other forms after burial. High authigenic/biogenic P concentrations indicate that phosphogenesis plays an important role in the conversion of organic P to CFA, and the correlation between Pr and Pur in phosphatic shales indicates that there may be addi tional post-phosphogenesis transformations of P, which need to be investigated.
CONCLUSION
A modified two-step chemical-extraction technique is effective for determining P concentrations in sedimentary rocks from the Miocene Monterey Formation. The two-step technique also enables the separation of reactive P from unreactive P for the purpose of determining P dynamics within the reactive marine-P cycle. Greater than 95 percent of P in the strata studied occurs as reactive P (as authigenic and biogenic sedimentary components) and unreactive P (as detritally-associated sedimentary components). Less than 5 percent of P in the strata studied is loosely bound, iron- bound, and organic P. Organic matter predominates as the main carrier of P to modern continental margin sediments; therefore, our results indicate that extensive reorganization of P between sedimentary components has occurred, prob ably as a result of phosphogenesis.
Shales are much more important than other lithologies (for example, dolomitic, siliceous) in terms of P concentra tions at Shell Beach. In shales of the siliceous facies studied here, mean Pr concentrations (1.41+0.34 wt pet P) are slightly higher than those of the phosphatic facies (0.98+0.21 wt pet P), mean Pur concentrations (1.21±0.52 wt pet P) are higher than those of the phosphatic facies (0.48±0.22 wt pet P), and mean PT concentrations (2.62±0.73 wt pet P) are higher than those of the phosphatic facies (1.46+0.41 wt pet P) (table 2).
The weighted mean P concentrations, taking into account the mean P concentration in each lithology type and the thickness of the section that that lithology occu pies, indicate that the phosphatic facies has a higher mean PT concentration (1.09+D.31 wt pet P) than the siliceous facies (0.66+0.22 wt pet P) (table 2). Thus, though shale of the siliceous facies has a higher mean P concentration than shale of the phosphatic facies, the dominance of shale in the phosphatic facies results in it having higher P con centrations than the siliceous facies.
The high total P concentrations observed for phos phatic shale strata of Shell Beach, which are minimum estimates, indicate that most of the P is probably retained and argue for redistribution of P from organically bound to
other forms after burial. High authigenic/biogenic P con centrations indicate that phosphogenesis plays an impor tant role in the conversion of organic P to CFA.
REFERENCES
Barren, J.A., and Keller, Gerta, 1983, Paleotemperature oscilla tions in the middle and late Miocene of the northeastern Pacific: Micropaleontology, v. 29, p. 150-181.
Baturin, G.N., 1972, Phosphorus in interstitial waters of sediments on the South West Africa Shelf: Oceanology, v. 12, p. 849-855.
1988, Disseminated phosphorus in oceanic sediments A review: Marine Geology, v. 84, p. 95-104.
Blake, M.C., Jr., Campbell, R.H., Dibblee, T.W., Jr., Howell, D.G., Nilsen, T.H., Normark, W.R., Vedder, J.C., and Silver, E.A., 1978, Neogene basin formation in relation to plate-tectonic evolution of San Andreas fault system, California: American Association of Petroleum Geologists Bulletin, v. 62, p. 344- 372.
Burnett, W.C., 1977, Geochemistry and origin of phosphorite deposits from off Peru and Chile: Geological Society of America Bulletin, v. 88, p. 813-823.
Burnett, W.C., Beers, M.J., and Roe, K.K., 1982, Growth rates of phosphorite nodules from the continental margin off Peru: Science, v. 215, p. 1616-1618.
Canfield, C.R., 1939, Subsurface stratigraphy of the Santa Maria oil field and adjacent parts of the Santa Maria Valley, Califor nia: American Society of Petroleum Geologists Bulletin, v. 23, p. 45-81.
Compton, J.S., Hodell, D.A., Garrido, J.R., and Mallinson, D.J., 1993, Origin and age of phosphorite from the south-central Florida Platform: Relation of phosphogenesis to sea-level fluctuation and 8 13C excursions: Geochimica et Cosmochim- ica Acta, v. 57, p. 131-146.
Compton, J.S., Snyder, S.W., and Hodell, D.A., 1990, Phosphogen esis and weathering of shelf sediments from the southeastern United States Implications for Miocene 8 13C excursions and global cooling: Geology, v. 18, p. 1227-1230.
Filippelli, G.M., and Delaney, M.L., 1992, Similar phosphorus fluxes in ancient phosphorite deposits and a modern phos- phogenic environment: Geology, v. 20, p. 709-712.
Filippelli, G.M., Delaney, M.L., Garrison, R.E., Omarzai, S.K., and Behl, R.J., 1994, Phosphorus accumulation rates in a Miocene low oxygen basin The Monterey Formation (Pismo basin), California: Marine Geology, v. 116, p. 419-430
Froelich, P.N., 1984, Interactions of the marine phosphorus and carbon cycles, in Moore, B.C., and Dastoor, M.N., eds., The interactions of global biogeochemical cycles: California Institute of Technology, Pasadena, California, NASA-JPL Publication 84-21, p. 141-176.
1988, Kinetic control of dissolved phosphate in natural rivers and estuaries A primer on the phosphate buffer mechanism: Limnology Oceanography, v. 33(4, part 2), p. 649-668.
Froelich, P.N., Arthur, M.A., Burnett, W.C., Deakin, M.L., Hensley, V.M., Jahnke, R.A., Kaul, L.A., Kim, R.-H., Roe, K.C., Soutar, Andrew, and Vathakanon, C.B., 1988, Early diagenesis of organic matter in Peru continental margin sediments: Phospho rite precipitation: Marine Geology, v. 80, p. 309-343.
G10 Evolution of Sedimentary Basins Santa Maria Province

Froelich, P.N., Bender, M.L., Luedtke, N.A., Heath, G.R., and DeVries, T.M., 1982, The marine phosphorus cycle: Ameri can Journal of Science, v. 282, p. 474-511.
Garrison, R.E., Kastner, Miriam, and Kolodny, Yesu, 1987, Phos phorites and phosphatic rocks in the Monterey Formation and related Miocene units, coastal California, in Ingersoll, R.V., and Ernst, W.G., eds., Cenozoic basin development in coastal California, Rubey volume VI: Prentice-Hall, Engle- wood Cliffs, N.J., p. 348-381.
Garrison, R.E., Kastner, Miriam, and Reimers, C.E., 1990, Mio cene phosphogenesis in California, in Burnett, W.C., and Riggs, S.R., eds., Phosphate deposits of the World, volume 3 Neogene to modern phosphorites: Cambridge, England, Cambridge University Press, p. 285-299.
Graham, S.A., 1987, Tectonic controls on petroleum occurrence in central California, in Ingersoll, R.V., and Ernst, W.G., eds., Cenozoic basin development in coastal California, Rubey vol ume VI: Prentice-Hall, Englewood Cliffs, N.J., p. 47-63.
Harland, W.B., Cox, A.V., Llewellyn, P.O., Pickton, C.A.G., Smith, A.G., and Walther, R.A., 1982, A geologic time scale: New York, Cambridge University Press, 131 p.
Howell, D.G., Crouch, J.K., Greene, H.G., McCulloch, D.S., and Vedder, J.G., 1980, Basin development along the late Meso- zoic and Cenozoic California margin A plate tectonic margin of subduction, oblique subduction, and transform tectonics, in Ballance, P.P., and Reading, H.G., eds., Sedimentation in oblique-slip mobile zones: Los Angeles, International Associ ation of Sedimentologists, Special Publication No. 4, p. 43-62.
Ingle, J.C., Jr., 1981, Origin of Neogene diatomites around the north Pacific rim, in Garrison, R.E., and Douglas, R.G., The Monterey Formation and related siliceous rocks of Califor nia: Society of Economic Paleontologists and Mineralogists Publication, Pacific Section, p. 159-180.
Isaacs, C.M., 1980, Diagenesis in the Monterey Formation exam ined laterally along the coast near Santa Barbara, California: Stanford University, Ph.D. dissertation, 329 p.
1984, Hemipelagic deposits in a Miocene basin, Califor nia: Toward a model of lithologic variation and sequence, in Stow, D.A.V., and Piper, D.J.M., eds., Fine-grained sedi ments Deep water processes and environments: Geological Society of London Special Publication, v. 15, p. 481-496.
Isaacs, C.M., Tomson, J.H., Stewart, K.C., and Jackson, L.L., 1992, Abundance of major elements and sedimentary components in cuttings from the Repetto, Sisquoc, and Monterey Formations, DCS P-0188 H-l and H-2 wells, Hondo oil field, offshore Santa Barbara-Ventura basin, southern California: United States Geological Survey Open-File Report 92-383, 46 p.
Kolodny, Yesu, 1983, Phosphorites, in Emiliani, E., ed., The sea: Wiley, New York, v. 7, p. 981-1023.
Mach, D.L., Ramirez, A.N., and Holland, H.D., 1987, Organic phosphorus and carbon in marine sediments: American Jour nal of Science, v. 278, p. 429-441.
Nirel, P.M.V., and Morel, F.M.M., 1991, Pitfalls of sequential extractions: Water Research, v. 24, p. 1055-1056.
Omarzai, S.K., 1992, Monterey Formation of California at Shell Beach (Pismo basin) Its lithofacies, paleomagnetism, age, and origin, in Schwalbach, J.R., and Bohacs, K.M., eds., Sequence stratigraphy of fine-grained rocks Example of the Monterey Formation: Pacific Section, Society of Sedimen tary Geology Special Publication, v. 70, p. 47-65.
Pisciotto, K.A., 1978, Basinal sedimentary facies and diagenetic aspects of the Monterey Shale, California: University of Cal ifornia, Santa Cruz, Ph.D. dissertation, 450 p.
1981, Notes in Monterey rocks near Santa Maria, Califor nia, in Isaacs, C.M., ed., Guide to the Monterey Formation in the California coastal area Ventura to San Luis Obispo: Pacific Section, American Society of Petroleum Geologists, v. 52, p. 73-82.
Pisciotto, K.A., and Garrison, R.E., 1981, Lithofacies and depo- sitional environments of the Monterey Formation, California, in Garrison, R.E., and Douglas, R.G., The Monterey Forma tion and related siliceous rocks of California: Society of Economic Paleontologists and Mineralogists Publication, Pacific Section, p. 97-122.
Riggs, S.R., 1984, Paleoceanographic model of Neogene phos phorite deposition, U.S. Atlantic continental margin: Science, v. 233, p. 123-131.
Riggs, S.R., and Sheldon, R.P., 1990, Paleoceanographic and paleoclimatic controls of the temporal and geographic distri bution of Upper Cenozoic continental margin phosphorites, in Burnett, W.C., and Riggs, S.R., eds., Phosphate deposits of the World, volume 3 Neogene to modern phosphorites: Cambridge, England, Cambridge University Press, p. 207- 222.
Ruttenberg, K.C., 1990, Diagenesis and burial of phosphorus in marine sediments Implications for the marine phosphorus budget: Yale University, Ph.D. dissertation, 375 p.
1992, Development of a sequential extraction method for different forms of phosphorus in marine sediments: Limnol ogy and Oceanography, v. 37, p. 1460-1482.
Ruttenberg, K.C., and Berner, R.A., 1993, Authigenic apatite for mation and burial in sediments from nonupwelling, continental margin environments: Geochimica Cosmochimica Acta, v. 57, p. 991-1007.
Sheldon, R.P., 1981, Ancient marine phosphorites: Annual Review of Earth Planetary Sciences, v. 9, p. 251-284.
Shemesh, Aldo, 1990, Crystallinity and diagenesis of sedimentary apatites: Geochimica Cosmochimica Acta, v. 54, p. 2433-2438.
Snyder, S.W., Hine, A.C., and Riggs, S.R., 1990, The seismic stratigraphic record of shifting Gulf Stream paths in response to Miocene glacio-eustacy: Implications for phosphogenesis along the North Carolina continental margin, in Burnett, W.C., and Riggs, S.R., eds., Phosphate deposits of the World, volume 3 Neogene to modern phosphorites: Cambridge, England, Cambridge University Press, p. 396-423.
Strickland, J.D.H., and Parsons, T.R., 1972, A practical handbook of seawater analysis: Ottawa, Canada, Fisheries Research Board of Canada.
Vincent, Edith, and Berger, W.H., 1985, Carbon dioxide and polar cooling in the Miocene The Monterey hypothesis, in Sun- quist, E.T., and Broecker, W.S., eds., The carbon cycle and atmospheric CO2 Natural variations Archean to present: American Geophysical Union Monograph 32, p. 455-468.
Woodring, W.P., and Bramlette, M.N., 1950, Geology and paleon tology of the Santa Maria district, California: United States Geological Survey Special Publication, no. 222, 185 p.
Woodring, W.P., Bramlette, M.N., and Lohman, K.E., 1943, Stra tigraphy and paleontology of the Santa Maria district, Cali fornia: American Society of Petroleum Geologists Bulletin, v. 27, p. 1335-1360.
Phosphorus Geochemistry, Diagenesis, and Mass Balances of the Miocene Monterey Formation at Shell Beach, California G11
U.S. GOVERNMENT PRINTING OFFICE: 1994-583-048A0006


SELECTED SERIES OF U.S. GEOLOGICAL SURVEY PUBLICATIONS
Periodicals
Earthquakes & Volcanoes (issued bimonthly). Preliminary Determination of Epicenters (issued monthly).
Technical Books and Reports
Professional Papers are mainly comprehensive scientific re ports of wide and lasting interest and importance to professional scientists and engineers. Included are reports on the results of resource studies and of topographic, hydrologic, and geologic inves tigations. They also include collections of related papers addressing different aspects of a single scientific topic.
Bulletins contain significant data and interpretations that are of lasting scientific interest but are generally more limited in scope or geographic coverage than Professional Papers. They include the results of resource studies and of geologic and topographic investiga tions, as well as collections of short papers related to a specific topic.
Water-Supply Papers are comprehensive reports that present significant interpretive results of hydrologic investigations of wide interest to professional geologists, hydrologists, and engineers. The series covers investigations in all phases of hydrology, including hydrogeology, availability of water, quality of water, and use of water.
Circulars present administrative information or important scien tific information of wide popular interest in a format designed for distribution at no cost to the public. Information is usually of short- term interest.
Water-Resource Investigations Reports are papers of an inter pretive nature made available to the public outside the formal USGS publications series. Copies are reproduced on request unlike formal USGS publications, and they are also available for public inspection at depositories indicated in USGS catalogs.
Open-File Reports include unpublished manuscript reports, maps, and other material that are made available for public consultation at depositories. They are a nonpermanent form of publication that may be cited in other publications as sources of information.
Maps
Geologic Quadrangle Maps are multicolor geologic maps on topographic bases in 7 1/2- or 15-minute quadrangle formats (scales mainly 1:24,000 or 1:62,500) showing bedrock, surficial, or engi neering geology. Maps generally include brief texts; some maps include structure and columnar sections only.
Geophysical Investigations Maps are on topographic or plani- metric bases at various scales; they show results of surveys using geophysical techniques, such as gravity, magnetic, seismic, or radioactivity, which reflect subsurface structures that are of eco nomic or geologic significance. Many maps include correlations with the geology.
Miscellaneous Investigations Series Maps are on planimetric or topographic bases of regular and irregular areas at various scales; they present a wide variety of format and subject matter. The series also includes 7 1/2-minute quadrangle photogeologic maps on plani metric bases that show geology as interpreted from aerial photo graphs. Series also includes maps of Mars and the Moon.
Coal Investigations Maps are geologic maps on topographic or planimetric bases at various scales showing bedrock or surficial geology, stratigraphy, and structural relations in certain coal-re source areas.
Oil and Gas Investigations Charts show stratigraphic informa tion for certain oil and gas fields and other areas having petroleum potential.
Miscellaneous Field Studies Maps are multicolor or black-and- white maps on topographic or planimetric bases on quadrangle or irregular areas at various scales. Pre-1971 maps show bedrock geology in relation to specific mining or mineral-deposit problems; post-1971 maps are primarily black-and-white maps on various subjects, such as environmental studies or wilderness mineral inves tigations.
Hydrologic Investigations Atlases are multicolor or black-and- white maps on topographic or planimetric bases presenting a wide range of geohydrologic data of both regular and irregular areas; principal scale is 1:24,000, and regional studies are at 1:250,000 scale or smaller.
Catalogs
Permanent catalogs, as well as some others, giving compre hensive listings of U.S. Geological Survey publications are avail able under the conditions indicated below from the U.S. Geological Survey, Books and Open-File Reports Sales, Federal Center, Box 25286, Denver, CO 80225. (See latest Price and Availability List.)
"Publications of the Geological Survey, 1879-1961" may be purchased by mail and over the counter in paperback book form and as a set of microfiche.
"Publications of the Geological Survey, 1962-1970" may be purchased by mail and over the counter in paperback book form and as a set of microfiche.
"Publications of the Geological Survey, 1971-1981" may be purchased by mail and over the counter in paperback book form (two volumes, publications listing and index) and as a set of microfiche.
Supplements for 1982, 1983, 1984, 1985, 1986, and for subse quent years since the last permanent catalog may be purchased by mail and over the counter in paperback book form.
State catalogs, "List of U.S. Geological Survey Geologic and Water-Supply Reports and Maps For (State)," may be purchased by mail and over the counter in paperback booklet form only.
"Price and Availability List of U.S. Geological Survey Publi cations," issued annually, is available free of charge in paperback booklet form only.
Selected copies of a monthly catalog "New Publications of the U.S. Geological Survey" are available free of charge by mail or may be obtained over the counter in paperback booklet form only. Those wishing a free subscription to the monthly catalog "New Publications of the U.S. Geological Survey" should write to the U.S. Geological Survey, 582 National Center, Reston, VA 22092.
Note. Prices of Government publications listed in older catalogs, announcements, and publications may be incorrect. Therefore, the prices charged may differ from the prices in catalogs, announce ments, and publications.
