the taxation of executive compensation · the taxation of executive compensation ... david heilman...
TRANSCRIPT
This PDF is a selection from an out-of-print volume from the NationalBureau of Economic Research
Volume Title: Tax Policy and the Economy, Volume 14
Volume Author/Editor: James M. Poterba, editor
Volume Publisher: MIT Press
Volume ISBN: 0-262-66164-0
Volume URL: http://www.nber.org/books/pote00-2
Publication Date: January 2000
Chapter Title: The Taxation of Executive Compensation
Chapter Author: Brian J. Hall, Jeffrey B. Liebman
Chapter URL: http://www.nber.org/chapters/c10845
Chapter pages in book: (p. 1 - 44)
The Taxation of ExecutiveCompensation
Brian J. HallHarvard Business School and NBER
Jeffrey B. LiebmanJohn F. Kennedy School of Government, Harvard University,and NBER
EXECUTIVE SUMMARY
Over the past 20 years, there has been a dramatic increase in the share ofexecutive compensation paid through stock options. We examine theextent to which tax policy has influenced the composition of executivecompensation, and discuss the implications of rising stock-based pay fortax policy. We begin by describing the tax rules for executive pay indetail and analyzing how changes in various tax rates affect the taxadvantages of stock options relative to salary and bonus. Our empiricalanalysis leads to three conclusions. First, there is little evidence that taxchanges have played a major role in the dramatic explosion in executivestock-option pay since 1980. Although the tax advantage of options hasapproximately doubled since the early 1980s, options currently haveonly a slight tax advantage relative to cashapproximately $4 per $100
We thank James Poterba (the editor) for helpful suggestions, and compensation consul-tants Robert Greenberg and Scott Olsen (of Towers Perrin) and Fred Cook (of Frederic W.Cook and Company) for helpful insights and background information. We thank PaulGompers and Andrew Metrick for providing us with the data on the share ownership oflarge institutional investors, David Heilman whose Harvard undergraduate thesis firstprovoked us to think about these issues, and Austan Goolsbee, Gerald Auten, and KevinMurphy for comments on an earlier draft. Gabriel Leon, Humayun Khalid, and KatyaRosenblatt provided excellent research assistance.
2 Hall & Liebman
of pretax compensation to the executive. A more convincing story for thedramatic explosion in stock options involves changes in corporate gover-nance and the market for corporate control. For example, there is astrong correlation between the fraction of shares held by large institu-tional investors and the fraction of executive pay in the form of stockoptions, a result that holds both longitudinally and cross-sectionally.Second, we find evidence that the million-dollar rule (which limited thecorporate deductibility of non-performance-related executive compensa-tion to $1 million) led firms to adjust the composition of their pay awayfrom salary and toward performance-related pay, although our esti-mates suggest that this substitution was minor. We find no evidencethat the regulation decreased the level of total compensation. Third, weexamine whether there is evidence for significant shifting of the timingof option exercises in response to changes in tax rates. After replicatingGoolsbee's (1999) result regarding tax shifting with our data for the 1993tax reform, we show that no such shifting occurred in either of the twotax reforms of the 1980s. Moreover, we find evidence that much of theunusually large level of option exercises in 1992 was the result of therising stock market rather than the change in marginal tax rates.
1. INTRODUCTIONOver the past 15 years, there has been a major change in the way thatAmerican executives, particularly CEOs, are paid. For many executives,annual stock-option grants are now greater than cash compensation(salary and bonus). Annual changes in CEO wealth from revaluations ofstock and stock-option holdings completely swamp cash compensation,and provide substantial pay-to-performance sensitivity. All of this is adramatic change from the early 1980s, when the median stock-optiongrant to top executives was zero.
In this paper, we examine the extent to which tax policy has influ-enced the composition of executive compensation, and discuss the impli-cations of rising stock-based pay for tax policy. Because top executivesmanage assets worth billions of dollars, their compensation arrange-ments and the incentives they face are of substantial importance to theperformance of the U.S. economy. Because top executives have veryhigh incomes, their responsiveness to taxation has important revenueand efficiency implications.
We conduct a broad analysis of the taxation of executives. We begin bystudying how tax rates affect the degree to which options are favoredrelative to cash and how the tax advantage of options has changed overtime in response to changes in corporate, personal, and capital gains tax
Taxation of Executive Compensation 3
rates. Although the tax advantage of options has approximately doubledsince the early 1980s, options currently have only a slight tax advantagerelative to cashapproximately $4 per $100 of pretax compensation.
We then analyze what we believe to be the three central policy ques-tions regarding the taxation of executive pay. First, we examine theextent to which the stock-option explosion has been influenced by themany changes in tax rates over the past 20 years. The evidence suggeststhat changes in taxation have likely had a very modest influence on theoption explosion. Instead, changes in corporate governance, especiallyin the role of large institutional investors, appear to have provided themain impetus for the increase in stock-based pay.
Second, we examine the effectiveness of tax policies aimed at curbingwhat is deemed by some to be excessive levels of executive compensa-tion. Section 162(m) of the Internal Revenue Code (the million-dollarrule), which was enacted in 1993, put a $1-million limit on the deducti-bifity (against corporate profits) of non-performance-related executivepay. Although we find evidence that this rule led to a shift in the compo-sition of payaway from salary and toward more performance-relatedbonuses and stock optionsour evidence suggests that the magnitudeof this substitution was small. We find no evidence that the mfflion-dollar rule decreased total executive compensation.
Third, we analyze the degree to which the tax code is efficient inraising tax revenue from top executives. The stock-option explosion hasled to a new and important way for executives to lower their taxes inresponse to changes in tax rates: by timing their stock-option gains. Forexample, in 1993, it was widely reported in the press that well-knownCEOs such as Disney's Michael Eisner pushed their option gains into1992 in order to avoid paying the higher personal income-tax rates imple-mented in 1993. In an important paper, Goolsbee (1999) argues that thetax shifting between 1992 and 1993 was enormous and was the directresult of the increase in marginal tax rates during this period. Afterreplicating Goolsbee's evidence regarding tax shifting with our data forthe 1993 tax reform, we show that no such shifting occurred in responseto either of the two tax reforms of the 1980s. Moreover, our evidenceindicates that the stock market run-up in 1991 and 1992 was more impor-tant than the change in marginal tax rates in causing the large optiongains observed in 1992.
This paper proceeds as follows. In the next section, we discuss trendsin the level and performance sensitivity of executive compensation. Insection 3, we describe the tax and accounting rules concerning executivecompensation. In section 4, we analyze how taxes affect the degree towhich options are favored relative to cash. In section 5, we examine how
4 Hall & Liebman
the tax advantage of options has changed over time. In section 6, weprovide evidence on the effect of taxation on the composition of execu-tive compensation. Section 7 contains empirical analysis of the million-dollar rule. Section 8 contains evidence on tax shifting and option gains.Section 9 concludes.
2. TRENDS IN TOP EXECUTIVE PAYIn this section, we document how top executive pay has changed overtime, and discuss how this change has caused the sensitivity of CEOwealth to firm market value to increase substantially. There has been alarge increase in the level of CEO pay since 1980, and this growth hasbeen driven by the dramatic increase in stock-option grants during thistime (Hall and Liebman, 1998). Although salary and bonuses nearlydoubled over the period in inflation-adjusted terms, the mean value ofstock-option grants increased by 683 percent. The percentage increase inthe median stock-option award cannot be calculated, because the me-dian stock-option grant was zero in 1980. The median CEO did notreceive an annual stock-option grant until 1985. Today, nearly all topexecutives of large companies receive stock options, and the averagestock-option grant is now larger for most top executives than salary andbonus combined.
The (inflation-adjusted) growth rate of CEO pay since 1980measurednarrowly (cash pay grew at an annual rate of 5 percent per year) or broadly(cash plus option grants grew at almost 9 percent per year) or very broadly(total compensation, including stock and stock-option appreciation, grewat 11.5 percent per year)has been large relative to virtually all othergroups. Indeed, the growth rate of CEO pay since 1980 has been higheven relative to the pay increases of other high-income earners. For ex-ample, the cutoff point for being in the top 0.5 percent of adjusted grossincome (ACT) increased by about 3.7 percent per year, about half the ratefor direct CEO compensation (excluding stock and option appreciation).The only workers who appear to have had faster compensation growththan CEOs are other "superstars." The annual pay of professional base-ball players increased by approximately 9.8 percent per year, and that ofprofessional basketball players by 13.9 percent per year.
The increase in stock options has led to a large increase in the equityholdings of top executives, and this in turn has led to a dramatic increasein the responsiveness of executive wealth to firm performance. Nearlyall of the pay-to-performance sensitivity of executive compensationcomes from equity holdings; for a given increase in shareholder value,changes in the value of an executive's stock and stock options are more
Taxation of Executive Compensation 5
than 50 times larger than changes in salary and bonus (Hall and Lieb-man, 1998).
As a concrete example, the estimates in Hall and Liebman (1998) implythat a 10-percent increase in firm value (of the median company in oursample) leads the company to increase the CEO's salary and bonus byabout $25,000. However, this same 10-percent increase in shareholdervalue translates into $1.25-million increase in the value of the CEO'sstock and stock-option holdings.1
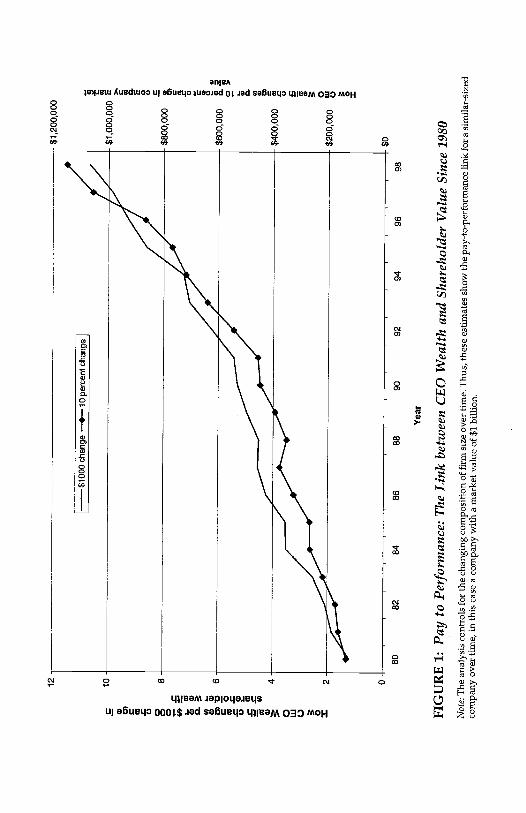
The dramatic rise in the ]irik between CEO wealth and firm perfor-mance can be seen in Figure 1, which shows how two measures of thislink have increased since 1980.2 The first measure, the JensenMurphy(1990) sharing rate (shown on the left scale), is the change in CEO wealthfor a $1,000 change in firm value. The second measure is the change inCEO wealth for a 10-percent change in firm value (see Baker and Hall,1998). Since both measures are strongly affected by firm size (the formerhas a negative correlation and the latter has a positive correlation), thepay-to-performance changes over time are estimated with regression(quantile) analysis that controls for changes in the distribution of firmsizes in the sample over time. The figure, therefore, shows the increasein the pay-to-performance measures over time for a constant-size firm,in this case a $1-billion firm (in constant 1998 dollars). The striking fact isthat both measures of the pay-to-performance link have increased bynearly a factor of 10 since 1980. These pay-to-performance increases areeven larger than those we reported in our earlier paper that analyzed theperiod 1980 to 1994, because of the large increase in stock-option grantscombined with the strong stock market performance in 1994 to 1998.
3. TAX AND ACCOUNTING RULESStock options give an executive the right but not the obligation to buy ashare of the company's stock at a prespecified pricethe exercise or strikeprice. Typically, options cannot be exercised immediately. That is, theyvest (become owned by the executive, who can then exercise if he or she
1 Stock-option grants are also very sensitive to changes in firm performance, mostly be-cause many grants are multiyear plans that hold the yearly number of options constant,and the same number of at-the-money options are worth more when the stock price ishigher and vice versa, if stock-option grant sensitivity is also included, then about 91percent of pay-to-performance sensitivity comes from stock and stock-option revaluations,7 percent comes from stock-option grant changes, and less than 2 percent comes fromchanges in salary and bonus (Hall, 1999).2 Both measures include only the link created by CEO holdings of stock and stock options,and ignore the smaller amount of pay-to-performance sensitivity that operates throughchanges in salary, bonus, and stock-option grants.
(a 0 (a C) 0 w 0 0
0 'C 0) (a 'C (0
12 4
---$
1000
cha
nge
+--
10 p
erce
nt c
hang
e
0$0
8082
8486
8890
9294
9698
Yea
r
FIG
UR
E 1
: Pay
to P
erfo
rman
ce: T
he L
ink
betw
een
CE
O W
ealth
and
Sha
reho
lder
Val
ueSi
nce
1980
Not
e: T
he a
naly
sis
cont
rols
for
the
chan
ging
com
posi
tion
of f
irm
siz
e ov
er ti
me.
Thu
s, th
ese
estim
ates
sho
w th
e pa
y-to
-per
form
ance
link
for
a si
mila
r-si
zed
com
pany
ove
r tim
e, in
this
cas
e a
com
pany
with
a m
arke
t val
ue o
f $1
bill
ion.
$1,2
00,0
00
$1,0
00,0
00 E >
'C a a. E 0 (5 C a a) = a 0 C a
$600
,000
& o >
a 0 a a 0) C a 0 a a 0 w 0 0 I
$800
,000
$400
,000
$200
,000
Taxation of Executive Compensation 7
wishes) slowly over time. Common vesting periods are in the three- tofive-year range, and options usually vest linearly (e.g., a four-year op-tion vests at 25 percent at the end of each year). An executive typicallyloses any unvested options upon departure. Although options may beexercised as soon as they vest, they do not have to be exercised untilthey expire or mature. Almost 85 percent of stock-option plans have aterm of exactly ten years, with virtually all of the remainder being in thefive- to ten-year range. About 95 percent of options are granted at themoney, or at fair market value, which means that the exercise price at grantdate is set equal to the stock price at grant date. The remaining 5 percentare either discount options (so-called in-the-money options, where theexercise price is below the stock price at grant date) or premium options(so-called out-of-the-money options, where the exercise price is abovethe stock price at grant date). The holders of options typically do nothave dividend rights or voting rights, even on vested options.3
3.1 Tax Rules and Stock-Option CompensationUnlike salary and bonus, stock-option grants are typically an untaxedevent at the time of grant. For the most widely used optionsnonquali-fled stock options (NQSOs)executives are taxed at the personal incometax rate on option profits (the difference between that stock price and theexercise price times the number of options) when the options are exer-cised. The company receives a parallel deduction against corporate in-come at that point. If the executive continues to hold the shares afterexercise, any subsequent appreciation is taxed at the capital gains rate inthe usual way. In 1993, an additional feature was added to the tax code[Internal Revenue Code section 162(M)] that disallowed a corporate de-duction for any executive pay above $1 million that is not performance-based. While this rule affects executive salaries, most bonuses qualify asperformance-based, and standard stock options automatically qualify.Therefore, this provision gives companies with highly paid executives anincentive to give more pay in the form of bonuses and stock options, asubject we return to in section 7. A summary description of the tax (andaccounting) treatment of cash and option compensation is in Table 1.
A far less common type of option, which is estimated to account forabout 5 percent of option grants, is the incentive stock option (ISO). WhileISOs are similar to NQSOs in their design, they are crucially different intwo respects. First, they have an annual cap of $100,000 per executive.
See Murphy (1999) for details about stock options, and Miller and Scholes (1982) on taxincentives.
TA
BL
E 1
Tax
and
Acc
ount
ing
Tre
atm
ent o
f E
xecu
tive
Com
pens
atio
n: C
ash
Paym
ents
ver
sus
Stan
dard
Exe
cutiv
e O
ptio
ns.
Sala
ry a
nd b
onus
Cas
h pa
ymen
ts m
ade
to C
EO
.
Non
-qua
lifie
d st
ock
optio
ns (
NQ
SOs)
Opt
ions
gra
nt th
e ex
-ec
utiv
e th
e ri
ght,
but
not t
he o
blig
atio
n, to
buy
shar
es o
f st
ock
atan
exe
rcis
e pr
ice
(typ
i-ca
lly th
e cu
rren
t sto
ckpr
ice
at th
e da
te o
fgr
ant)
. The
opt
ions
Tax
ed a
s or
dina
ryin
com
e.
The
gra
ntin
g of
an
op-
tion
is ty
pica
lly a
n un
-ta
xed
even
t. U
pon
exer
-ci
se, o
ptio
n pr
ofits
are
taxe
d at
the
ordi
nary
rate
. If
the
exec
utiv
eco
ntin
ues
to h
old
onto
the
shar
es, t
he e
xecu
-
Fully
ded
uctib
le. S
ince
1993
, any
pay
ove
r $1
mill
ion
is n
ot d
educ
t-ib
le u
nles
s it
is p
er-
form
ance
-bas
ed.
A p
aral
lel t
ax d
educ
-tio
n at
the
corp
orat
ele
vel i
s ge
nera
lly a
l-lo
wed
upo
n ex
erci
se(f
or th
e am
ount
of
op-
tion
prof
its).
Opt
ions
auto
mat
ical
ly q
ualif
y as
perf
orm
ance
-bas
ed p
ay
Exp
ense
d ag
ains
t ear
n-in
gs in
the
usua
l way
.
The
re is
no
expe
nse
rec-
ogni
tion
(at g
rant
, exe
r-ci
se, o
r sa
le)
for
op-
tions
if, a
s is
usu
ally
the
case
, the
opt
ions
are
not d
isco
unte
d (i
nth
e m
oney
at g
rant
date
) an
d th
e ex
erci
se
Tax
atio
n at
Tax
atio
n at
Acc
ount
ing
Com
pens
atio
nD
escr
iptio
npe
rson
al le
vel
corp
orat
e le
vel
trea
tmen
t
typi
cally
ves
t ove
r a
3-5-
year
per
iod.
The
typi
-ca
l mat
urity
is 1
0 ye
ars,
but t
he m
anag
er m
ayex
erci
se e
arly
. Som
eop
tions
are
dis
coun
t op-
tions
(th
e ex
erci
se p
rice
is lo
wer
than
the
stoc
kpr
ice
at th
e gr
ant d
ate)
.Pr
emiu
m o
ptio
ns a
reth
e re
vers
e (t
he e
xer-
cise
pri
ce is
gre
ater
than
the
stoc
k pr
ice
atgr
ant d
ate)
.
five
is ta
xed
in th
eus
ual w
ay (
at th
e ca
pi-
tal g
ains
rat
e) o
n an
yfu
rthe
r ap
prec
iatio
n of
the
shar
e pr
ice.
and
ther
efor
e ar
e no
tsu
bjec
t to
the
$1-
mill
ion
cap.
pric
e an
d nu
mbe
r of
op-
tions
is k
now
n at
gra
ntda
te. F
or d
isco
unt o
p-tio
ns, t
he d
iffe
renc
e be
-tw
een
the
stoc
k pr
ice
and
the
mar
ket p
rice
isex
pens
ed o
ver
the
vest
-in
g pe
riod
. For
opt
ions
with
var
iabl
e te
rms
(e.g
., a
vari
able
exe
r-ci
se p
rice
, ves
ting
that
is f
led
to p
erfo
rman
ce),
the
optio
ns a
re m
arke
dto
mar
ket a
nd e
x-pe
nsed
dur
ing
the
time
betw
een
gran
t and
exer
cise
.
Not
e: W
e th
ank
com
pens
atio
n co
nsul
tant
s Sc
ott G
reen
berg
and
Sco
tt O
lsen
(bo
th o
f T
ower
s Pe
rrin
) an
d Fr
eder
ic C
ook
(of
Fred
eric
W. C
ook
and
Ass
ocia
tes)
for
he1p
fu c
onve
rsat
ions
in u
nder
stan
ding
the
tax
and
acco
untin
g ru
les.
10 Hall & Liebman
Second, the tax treatment of ISOs is different. ISOs are completely un-taxed at grant or exercise. It is only at sale that the executive is taxed, andeven then the executive is taxed at the lower capital gains tax rate. Thedisadvantage is that the corporation never gets to take a parallel taxdeduction against corporate profits. Thus, ISOs become more attractiveas the personal tax rate increases and as the corporate tax rate and thecapital gains tax rates fall.
Two other related types of compensation, restricted stock and stockappreciation rights, are worth brief discussion. Both, however, are farless common than standard stock options. Restricted stock is payment inthe form of restricted shares, the restriction being that the shares vestover time, as with options. Unlike options, the shares typically havevoting and dividend rights. With regard to taxation, the executive istaxed at the personal rate on the value of the restricted stock as thevesting restrictions lapse. However, the executive may choose to betaxed at the grant date, in which case all subsequent appreciation istaxed at the capital gains rate. The dividends paid to the executive aretaxed at the ordinary rate in the usual way. The company generallyreceives a parallel deduction equal to the amount of the executive'sincome when the executive is taxed. Unlike stock options, restrictedstock is not generally considered to be performance-based and is there-fore subject to the million-dollar rule (unless the vesting of the restrictedstock is performance-based, which is sometimes the case).
Stock appreciation rights (SARs) are rights that replicate the payoffs ofstock options with a cash transfer. Thus SARs are simpler than options, inthat there is no requirement to buy and resell the stock in order to "cashout." SARs generally have the same tax treatment as NQSOs, both to theindividual and to the corporation. SARs are relatively rare, however, be-cause they have disadvantageous accounting treatment (described in thenext section) relative to stock options, and their main relative advantagevis-à-vis options has been essentially replicated through broker-assistedcashless option exerciseswhereby a broker makes a "nanosecond" loanto the executive (to purchase and resell the stock) when the executivewants to "cash in" on option profits. The tax and accounting treatment ofISOs, restricted stock, and SARs is summarized in Table 2.
3.2 The Accounting Treatment of OptionsUnlike cash compensation, which is expensed against earnings, there isgenerally no expense recognition (at grant, exercise, or sale) for options,whether they be NQSOs or ISOs. As a result, compensation consultantsoften point out that stock options are the only form of compensation thatare free in an accounting sense, but stifi deductible for tax purposes.
Taxation of Executive Compensation 11
Stock options do, however, lead to expense recognition if they are dis-counted (in the money at grant date) or if the exercise price and numberof options are not known at grant date. For discount options, the differ-ence between the stock price and the market price is expensed over thevesting period. For options with variable terms (e.g., a variable exerciseprice, vesting that is tied to performance), the options are marked tomarket and expensed during the time between grant and exercise. Practi-tioners claim that the accounting treatment of options plays an impor-tant role in the design of option programs. Thus, plans that have "badaccounting" but are thought by many to have attractive incentive fea-tures are often not even seriously considered by companies. Examples ofsuch potentially attractive plans include indexed options (where a CEOprofits only if his firm's share price grows relative to some market orindustry benchmark) and option grants that are explicitly performance-related, both of which would lead to expenses against earnings.
Unlike options, restricted stock and SARs do not generally receivefavorable accounting treatment. Restricted stock is generally expensedover the period in which the restrictions lapse (usually the vesting pe-riod). The magnitude of the expense is the difference between the cur-rent stock price and the executive's cost (if any). SARs are marked tomarket each period, and the difference between the stock price and theexercise price is expensed over the outstanding period of SARs.
4. THE TAXATION OF EXECUTIVE PAY: CASHVERSUS OPTIONSStock-based compensation performs two roles in executive compensa-tion arrangements. First, it helps align the incentives of the executivewith the interests of the firm's shareholders. Second, it often enables thefirm to compensate the CEO in a way that is more advantageous from atax standpoint than paying the executive in salary and bonus.
4.1 Agency Theory and Executive Compensation in the Presenceof TaxationIn standard agency-theory models (Jensen and Meckling, 1976), agencycosts are the result of the separation of ownership and control. Managersdo not have the same incentives as the owners. The optimal incentivecontract for managers balances the benefits of high-powered incentives(linking the fortunes of owners and managers through stock and stockoptions for example) with the costs of loading too much risk on risk-averse managers.
TA
BL
E 2
Tax
and
Acc
ount
ing
Tre
atm
ent o
f E
xecu
tive
Com
pens
atio
n: I
ncen
tive
Stoc
k O
ptio
ns (
IS O
s), R
estr
icte
d St
ock,
and
Stoc
k A
ppre
ciat
ion
Rig
hts
(SA
Rs)
Ince
ntiv
e st
ock
optio
ns
Res
tric
ted
stoc
k
ISO
s ar
e id
entic
al to
NQ
SOs
in th
eir
desi
gn.
How
ever
, the
y ha
ve a
nan
nual
cap
of
$100
,000
on th
e am
ount
that
vest
s. T
he ta
x tr
eat-
men
t of
ISO
s al
sodi
ffer
s.
Sim
ilar
to s
tock
op-
tions
, but
sha
res
(whi
ch v
est s
low
ly)
rath
er th
an o
ptio
ns a
regr
ante
d to
the
exec
u-tiv
e. U
nlik
e op
tions
,th
e sh
ares
typi
cally
have
vot
ing
and
divi
-de
nd r
ight
s.
If th
e us
ual c
ondi
tions
are
met
, the
re is
no
tax
at g
rant
or
exer
cise
. At
sale
, all
optio
n pr
ofits
and
subs
eque
nt c
apita
lap
prec
iatio
n ar
e ta
xed
at th
e ca
pita
l gai
nsra
te.
The
indi
vidu
al is
taxe
dat
the
ordi
nary
rat
e as
the
rest
rict
ions
laps
e.H
owev
er, t
he m
anag
erm
ay c
hose
to b
e ta
xed
at g
rant
dat
e, in
whi
chca
se a
ll su
bseq
uent
ap-
prec
iatio
n is
taxe
d at
the
capi
tal g
ains
rat
e.D
ivid
ends
are
taxe
d at
the
ordi
nary
rat
e.
If th
e us
ual c
ondi
tions
are
met
, the
re is
gen
er-
ally
no
corp
orat
e ta
x de
-du
ctio
n at
gra
nt, e
xer-
cise
, or
sale
.
The
com
pany
gen
eral
lyre
ceiv
es a
par
alle
l de-
duct
ion
equa
l to
the
amou
nt o
f th
e ex
ecu-
tive'
s in
com
e w
hen
the
exec
utiv
e is
taxe
d. R
e-st
rict
ed s
tock
is g
ener
-al
ly s
ubje
ct to
the
mill
ion-
dolla
r ca
p.
As
with
NQ
SOs,
ther
eis
gen
eral
ly n
o ex
pens
ere
cogn
ition
for
ISO
s(e
ver)
.
Res
tric
ted
stoc
k is
gen
-er
ally
exp
ense
d ov
erth
e ve
stin
g pe
riod
. The
amou
nt e
xpen
sed
isth
e di
ffer
ence
bet
wee
nth
e cu
rren
t sto
ck p
rice
and
the
exec
utiv
e's
cost
(if
any
).
Tax
atio
n at
Tax
atio
n at
Acc
ount
ing
Com
pens
atio
nD
escr
iptio
npe
rson
al le
vel
corp
orat
e le
vel
trea
tmen
t
Not
e: W
e th
ank
com
pens
atio
n co
nsul
tant
s Sc
ott G
reen
berg
and
Sco
tt O
lsen
(bo
th o
f T
ower
s Pe
rrin
) an
d Fr
eder
ic C
ook
(of
Fred
eric
W. C
ook
and
Ass
ocia
tes)
for
help
ful c
onve
rsat
ions
in u
nder
stan
ding
the
tax
and
acco
untin
g ru
les.
Stoc
k ap
prec
iatio
nR
ight
s th
at r
eplic
ate
Gen
eral
ly h
ave
the
Gen
eral
ly h
ave
the
Unl
ike
optio
ns, S
AR
sri
ghts
the
prof
its o
f st
ock
op-
sam
e ta
x tr
eatm
ent a
ssa
me
tax
trea
tmen
t as
are
mar
ked
to m
arke
ttio
ns. R
arel
y us
ed,
NQ
SOs.
NQ
SOs
each
per
iod,
and
the
sinc
e st
ock
optio
nsdi
ffer
ence
bet
wee
n th
eha
ve m
ore
favo
rabl
e ac
-st
ock
pric
e an
d th
e ex
-co
untin
g tr
eatm
ent
erci
se p
rice
is e
xpen
sed
(and
opt
ions
pro
vide
over
the
outs
tand
ing
the
sam
e be
nefi
t of
peri
od o
f SA
Rs.
cash
less
exe
rcis
eth
roug
h br
oker
loan
s.)
14 Hall & Liebman
The effect of taxation on the optimal contract (more precisely, theshare of compensation that is performance-related) is ambiguous (evenin the absence of deductibility and deferral) because there are offsettingeffects. First, by reducing the share of corporate profits received byshareholders, taxes diminish the importance to the shareholders of moti-vating the CEO. Taken alone, this effect would imply that taxes wouldbe expected to reduce the use of performance-based compensation. Sec-ond, because the government shares in the income received by the CEO,the variance of the CEO's income is reduced, raising his utility, andlowering the cost to the firm of providing any given set of incentives.Third, because taxes wifi lead executives to provide less effort for anygiven level of incentive-based pay, the level of compensation that mustbe provided to compensate the CEO for effort is reduced, for a givenamount of incentive. These last two factors make it cheaper for the firmto offer contracts to the CEO with large incentive components when taxrates are higher, and should therefore increase the use of incentive-based pay. Since the net effect of taxation on the level of incentive-basedpay is ambiguous, agency theory provides no strong predictions abouthow taxation should affect the optimal composition of option versuscash compensation.
/4.2 The Tax Advantages of DeferralWhile agency theory yields ambiguous predictions about the effect oftaxes on the use of options, there are direct tax advantages of options inthat options provide executives with a way to defer compensation andthereby lower their taxes. However, because options also lead to a defer-ral of corporate tax deductibility, the tax advantages from a combined(executive and corporate) perspective are not so straightforward. In thissection, we analyze and measure the tax advantages of stock optionsrelative to salary and bonus compensation. We also analyze the taxadvantages of NQSOs relative to ISOs. In particular, we show how thetax advantages of options change as personal, corporate, and capitalgains taxes change. We then show how the tax advantages of optionshave changed over time in response to changing tax rates.
The crucial tax difference between standard options (NQSO5) andcash payment is that option payouts are deferred, and the two forms ofcompensation earn different rates of return over the deferral period. Anyanalysis of the relative tax advantages of two compensation instrumentsmust consider the tax consequences both to the employer and to theemployeewhat Scholes and Wolfson (1992) call the global contractingperspective. Thus, in order to make valid comparisons between the two,we compare the tax burden to the executive, while holding constant the
Taxation of Executive Compensation 15
posttax cost to the company. By keeping posttax employer costs (in NPVterms) constant, any package that is preferred by the employee is tax-advantaged in the global-contracting sense.
Under this methodology, a comparison of the tax advantages of op-tions and cash involves comparing a pretax cash payment of P with anoption payment that has the equivalent posttax NPV to the company.For NQSOs, it is straightforward to show that a pretax payment of P toan executive has exactly the same cost to the company as putting aside Pfor the purposes of paying stock-option payouts later. That is, if a com-pany pays an executive P today, it wifi have the same amount of moneyin N years as if it had put aside P today, let it accumulate at the rate ofreturn earned by the firm, and then paid it out (as compensation in theform of option gains4) with any appreciation in year N.
Assume that the pretax profit rate is r, and the corporate tax rate is T.Then, if the company pays P today, it receives a deduction today of PT,which yields
[1 + r(1 - T)]' (1)
in N years, since the benefits of the tax deduction are invested in thecompany and receive the after-tax corporate rate of return. Conversely,if the company puts P aside today, then it grows at the after-tax corpo-rate rate of return in N years to give a tax deduction of
P [1 + r (1 - T,)]N T (2)C,
which is the exact same value. Note that the equivalence of these two taxdeductions is analogous to the tax-benefit equivalence of front-loadedand back-loaded IRAs.
An executive's payoff in N years from option profits is equal to Pcompounded at the after-tax corporate rate times 1 - T, where T is thepersonal tax rate. Thus, the combined payoffs in N years of the corporatededuction and the executive's posttax payoff is
P [1 + r (1 - Ta)]" T + P [1 + r (1 - T)]" (1 - Tn), (3)
where the first term is the payoff from the corporate deduction and thesecond term is the executive's payoff.
This analysis is not unique to options. Any form of deferred compensation that enablesexecutives to invest inside the firm at a higher posttax return or without paying capitalgains taxes would have similar effects.
16 Hall & Liebman
The payoff to salary and bonus in N years is more complicated, sincean assumption must be made about how the executive invests the origi-nal cash compensation. For example, if the executive invests in an instru-ment with taxable interest (e.g., bonds), then the N-year payoff from aninvestment of P accumulates at the post-corporate-tax, post-personal-taxrate of return and is
P (1 - T) [1 + r (1 - T)(1 - T)f'. (4)
However, if an executive invests in (non-dividend-paying) equities, theinvestment accumulates at the higher post-corporate-tax rate of return,with the offsetting disadvantage that the capital gains are taxed at thecapital gains rate in year N. So the executive receives
P [1 + r (1 - T)1N (1 - T) - Tcg{P (1 - T) [1 + r (1 - T)V" -P (1 - T)}, (5)
where Tcg is the capital gains tax rate.5Thus, putting the equations together, if an executive is paid cash P.
and invests y in bonds and 1 - y in equities, the N-year payoff (includ-ing the payoff to the corporation from the tax deduction) is
P [1 + r (1 - T)]N y + y{(P [1 + (1 - T)(1 - T)]N (1 - T)}+(1 - y) (P [1 + r (1 - T)V" (1 - T) - Tcg {P (1 - T)
[1 +r(1 - T)]N_p(1 - T)}). (6)
The tax advantage of options versus salary and bonus, therefore, is thedifference between the combined (corporate and executive) payoffs inequation (3) and the combined payoffs in equation (6).
4.3 The Tax Advantage of OptionsWe now turn to analysis of how changes in various tax rates affectthe tax advantages of options relative to cash compensation. We focuson the case in which the cash earned by executives is invested entirelyin equities, since equities are tax-favored relative to bonds. The impor-tant conclusions of this analysis are not substantively different if we
In practice, executives hold a combination of equities and bondlike instruments withtaxable interest. Because equities are tax-favored, in the next section we simplify the analy-sis by assuming that executives hold only equities. Alternatively, we could have assumedthat executives hold only less risky bonds, since bonds more closely match the risk proffleof a stream of tax savings. None of our empirical results are substantively affected by thissimplification.
Taxation of Executive Compensation 17
instead assume that a portion of an executive's holdings are invested inbonds.
4.3.1 The Tax Advantage of Options: Changing the Corporate TaxRate Stock options are tax-advantaged relative to cash simply becauseoption payouts are deferred, allowing the executive to invest at the pre-personal-tax rate of return (with no capital gains tax at the end) ratherthan investing at the after-tax rate of return or paying the capital gainstax. Since the advantage of being able to defer taxes is large when thecorporate tax rate is low, the tax advantage of options is larger when thecorporate rate is low.
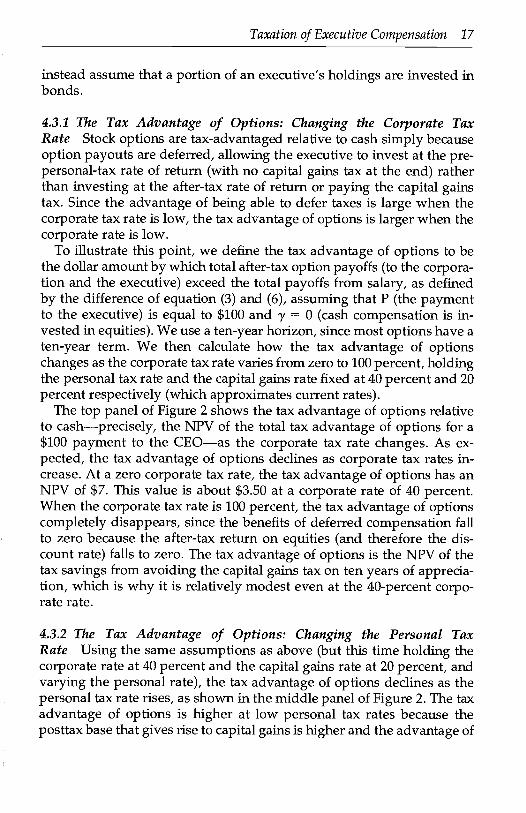
To illustrate this point, we define the tax advantage of options to bethe dollar amount by which total after-tax option payoffs (to the corpora-tion and the executive) exceed the total payoffs from salary, as definedby the difference of equation (3) and (6), assuming that P (the paymentto the executive) is equal to $100 and y = 0 (cash compensation is in-vested in equities). We use a ten-year horizon, since most options have aten-year term. We then calculate how the tax advantage of optionschanges as the corporate tax rate varies from zero to 100 percent, holdingthe personal tax rate and the capital gains rate fixed at 40 percent and 20percent respectively (which approximates current rates).
The top panel of Figure 2 shows the tax advantage of options relativeto cashprecisely, the NPV of the total tax advantage of options for a$100 payment to the CEOas the corporate tax rate changes. As ex-pected, the tax advantage of options declines as corporate tax rates in-crease. At a zero corporate tax rate, the tax advantage of options has anNPV of $7. This value is about $3.50 at a corporate rate of 40 percent.When the corporate tax rate is 100 percent, the tax advantage of optionscompletely disappears, since the benefits of deferred compensation fallto zero because the after-tax return on equities (and therefore the dis-count rate) falls to zero. The tax advantage of options is the NPV of thetax savings from avoiding the capital gains tax on ten years of apprecia-tion, which is why it is relatively modest even at the 40-percent corpo-rate rate.
4.3.2 The Tax Advantage of Options: Changing the Personal TaxRate Using the same assumptions as above (but this time holding thecorporate rate at 40 percent and the capital gains rate at 20 percent, andvarying the personal rate), the tax advantage of options declines as thepersonal tax rate rises, as shown in the middle panel of Figure 2. The taxadvantage of options is higher at low personal tax rates because theposttax base that gives rise to capital gains is higher and the advantage of
Note: Holds constant the personal rate at 40 percent and the capital gains rate at 20 percent.7.001
6.00
I° 5.00
4.00
3.00
>
2.00
1.00
0.000 10 20 30 40 50 60 70 80 80 100
Top Co9po..t. Tax flat.
Note: Holds constant the corporate rate at 40 percent and the capital gains rate at 20 percent.
7,00
6.00
5.00
1400
3,00
2.00
1.00
0,00100
10 20 30 40 50 60 70 80 90 100
Top CapitOl OxiflO To. Rote
FIGURE 2 Tax Advantage of Options: NPV of Tax Advantage of Pay-ing $100 in Options (NQSOs) Rather Than in Cash
0 10 20 30 40 50 60 70 80 90
Top P.600601 Tax Rat.
Note: Holds constant the personal rate at 40 percent and the corporate rate at 40 percent.
30-
25
20
115
10
Taxation of Executive Compensation 19
avoiding the capital gains taxes is greater. The tax advantage of optionstherefore declines linearly as the personal tax rate rises. At a 100-percentpersonal tax rate, the executive receives nothing in either case, and byconstruction, the company's tax deduction benefit is the same in NPVterms, so the tax advantage of options falls to zero also.6
4.3.3 The Tax Advantage of Options: Changing the Capital Gains TaxRate The tax advantage of options for various capital gains rates isdepicted in the bottom panel of Figure 2 under the same assumptions(this time holding both the personal rate and the corporate rate at 40percent, while varying the capital gains rate). The tax advantage of avoid-ing the capital gains tax increases as the capital gains tax rate rises.
5. HOW HAS THE TAX ADVANTAGE OF OPTIONSCHANGED OVER TIME?
The analysis so far has illustrated how the tax advantage of optionsvaries with the changes in tax rates. In this section, we show how the taxadvantage of options has changed over time as tax rates have changed.
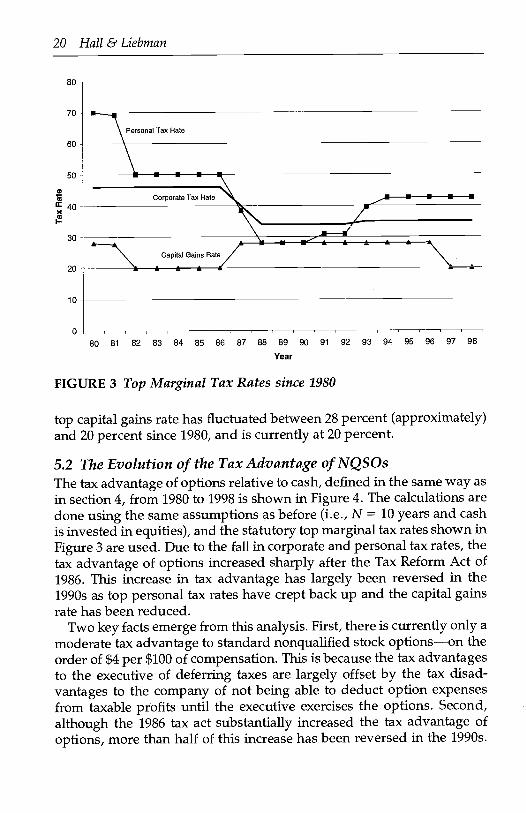
5.1 Top Marginal Tax Rates over TimeThe evolution on the top marginal tax ratespersonal, corporate, andcapital gainsfrom 1980 to 1998 is shown in Figure 3. In all cases, thetop rate (the rate for taxpayers with the highest incomes) is shown,which is not always the highest rate, since various anomalies (such asclawbacks of exemptions) sometimes lead to marginal tax rates that arehigher than those for the highest income tax payers.
The top personal tax rate was 70 percent in 1980, falling to 50 percentin 1982 and 28 percent in 1988 following the 1986 tax act.7 The topmarginal tax rate has since risen to 39.6 percent, but is effectively 42.5percent, since there is a 2.9-percent Medicare surcharge (paid half by theemployer and half by the employee) that has no upper limit. The topcorporate tax rate has had only one significant change since 1980, fallingfrom 46 percent before the 1986 tax act to 34 percent following the act in1988. The top corporate tax rate was increased to 35 percent in 1993. The
6 This is one place where ignoring bond investments has substantive implications. Inparticular, in the all-bond case the tax advantage of options is nonmonotonicit rises andthen fallsas personal tax rates rise.
Daring the early 1980s, the maximum tax on earned income limited the marginal tax rateon the earnings of high earners, so many executives did not face a decline in personal taxrates between 1981 and 1982. The empirical results in this paper are robust to assumingthat executives faced a marginal tax rate of 50 percent in 1980 and 1981.
20 Hall & Liebman
50 . U
Corporate Tax Rate _U U
Capital Gains Rate
80 81 82 83 84 85 86 87 88 89 90 91 92 93 94 95 96 97 98
Year
FIGURE 3 Top Marginal Tax Rates since 1980
top capital gains rate has fluctuated between 28 percent (approximately)and 20 percent since 1980, and is currently at 20 percent.
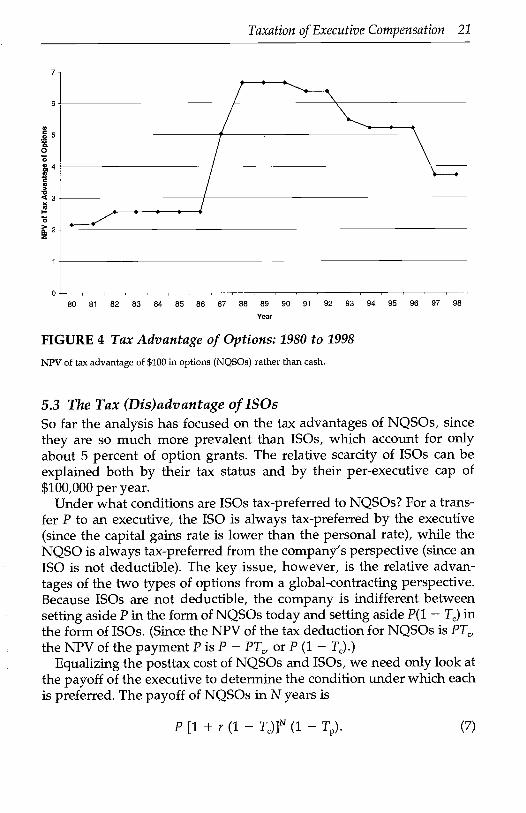
5.2 The Evolution of the Tax Advantage of NQSOsThe tax advantage of options relative to cash, defined in the same way asin section 4, from 1980 to 1998 is shown in Figure 4. The calculations aredone using the same assumptions as before (i.e., N = 10 years and cashis invested in equities), and the statutory top marginal tax rates shown inFigure 3 are used. Due to the fall in corporate and personal tax rates, thetax advantage of options increased sharply after the Tax Reform Act of1986. This increase in tax advantage has largely been reversed in the1990s as top personal tax rates have crept back up and the capital gainsrate has been reduced.
Two key facts emerge from this analysis. First, there is currently only amoderate tax advantage to standard nonqualified stock optionson theorder of $4 per $100 of compensation. This is because the tax advantagesto the executive of deferring taxes are largely offset by the tax disad-vantages to the company of not being able to deduct option expensesfrom taxable profits until the executive exercises the options. Second,although the 1986 tax act substantially increased the tax advantage ofoptions, more than half of this increase has been reversed in the 1990s.
80 -
70
Personal Tax Rate
60
a,
40
30
20
10
0
, a
80 81 82 82 84 85 86 87 88 89 90 91 92 93 94 95 96 97 98
Year
FIGURE 4 Tax Advantage of Options: 1980 to 1998
NPV of tax advantage of $100 in options (NQSOs) rather than cash.
5.3 The Tax (Dis)advantage of ISOsSo far the analysis has focused on the tax advantages of NQSO5, sincethey are so much more prevalent than ISOs, which account for onlyabout 5 percent of option grants. The relative scarcity of ISOs can beexplained both by their tax status and by their per-executive cap of$100,000 per year.
Under what conditions are ISOs tax-preferred to NQSOs? For a trans-fer P to an executive, the ISO is always tax-preferred by the executive(since the capital gains rate is lower than the personal rate), while theNQSO is always tax-preferred from the company's perspective (since anISO is not deductible). The key issue, however, is the relative advan-tages of the two types of options from a global-contracting perspective.Because ISOs are not deductible, the company is indifferent betweensetting aside P in the form ofNQSOs today and setting aside P(1 - T) inthe form of ISOs. (Since the NPV of the tax deduction for NQSO5 is PT,theNPV of the payment P is P - PT, or P (1 -
Equalizing the posttax cost of NQSOs and ISOs, we need only look atthe payoff of the executive to determine the condition under which eachis preferred. The payoff of NQSOs inN years is
Taxation of Executive Compensation 21
P [1 + r (1 - T)]' (1 - Tn). (7)
7
6
00
<3
03.a.z
0
22 Hall & Liebman
The same payoff for ISOs is
P (1 - T,) [1 + r (1 - TC)IN (1 - Tcg). (8)
ISOs, therefore, are tax-advantaged if
T - Tcg> T - T Tcg (9)
Intuitively, ISOs are tax-advantaged only if their advantage (the differ-ence between the personal rate and the capital gains rate) is largeenough to offset their cost (the disadvantage of not deducting at thecorporate rate). Note, however, that the condition is not a simple com-parison between the corporate rate and the personal rate minus thecapital gains rate (T - Tcg> T).
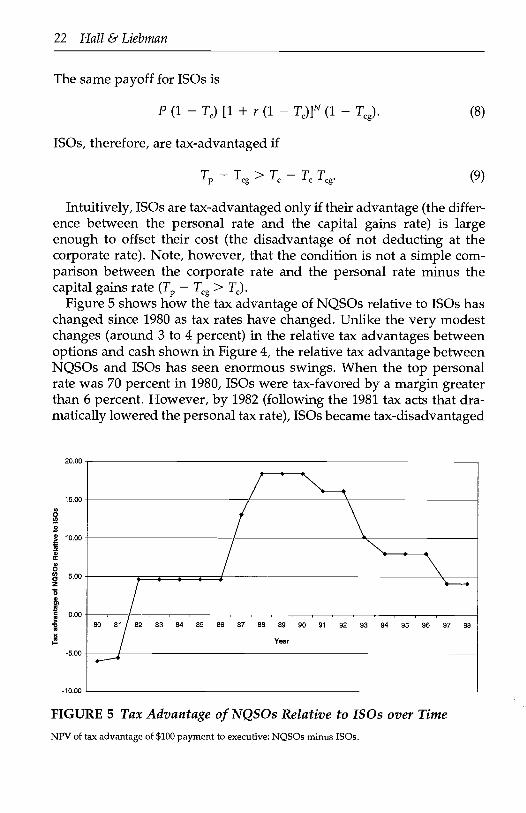
Figure 5 shows how the tax advantage of NQSOs relative to ISOs haschanged since 1980 as tax rates have changed. Unlike the very modestchanges (around 3 to 4 percent) in the relative tax advantages betweenoptions and cash shown in Figure 4, the relative tax advantage betweenNQSOs and ISOs has seen enormous swings. When the top personalrate was 70 percent in 1980, ISOs were tax-favored by a margin greaterthan 6 percent. However, by 1982 (following the 1981 tax acts that dra-matically lowered the personal tax rate), ISOs became tax-disadvantaged
0Ce
0
=
0Cd)a2000)
aVCC
I-
20.00
15.00
10.00
5.00
0.00
-5.00
-10.00
FIGURE 5 Tax Advantage of NQSOs Relative to ISOs over Time
NPV of tax advantage of $100 payment to executive: NQSOs minus ISOs.
. N/ \...8J2 83 64 85 86 87 88 69 50 91
Year
92 93 94 95 56 97 98
Taxation of Executive Compensation 23
by about 5 percent. By 1988 (following the 1986 tax act), ISOs became tax-disadvantaged by about 18 percent, a dramatic swing. The raising ofpersonal rates coupled with a decrease in the capital gains rate has sincereduced the tax disadvantage of ISOs to about $4 per $100 of pretaxcompensation. Although hard data on ISOs are hard to come by, practi-tioners (mostly compensation consultants) claim that ISOs were morepopular prior to 1982 when they were tax-advantaged. Although ISOsare less disadvantageous from a tax standpoint relative to NQSOs thanthey were in the late 1980s, they are stifi disadvantageous, so it is notsurprising that they have not made a significant resurgence in recentyears.
6. EXPLAINING THE INCREASE IN OPTION-BASEDCOMPENSATION
In this section, we analyze whether changes in tax rates affect the compo-sition of executive compensation, and consider the relative importanceof tax factors and corporate governance factors in explaining the in-creasing share of compensation paid in the form of stock options. Thenumerous changes in tax rates that have occurred since 1980 provide anopportunity to assess whether executive compensation arrangementsrespond to tax incentives in the way that the tax-avoidance model sug-gests. We test this model using a panel data set of CEOs in largepublicly-traded U.S. corporations. Our identification of the tax effectsrelies on time-series variation in personal, corporate, and capital gainstax rates along with cross-sectional variation in corporate tax rates.
6.1 DataWe use a 15-year panel data set of CEOs in the largest publicly-tradedU.S. corporations, which is described in Hall and Liebman (1998). Thedata set covers the years from 1980 through 1994, and combines CEOcompensation information from corporate proxies and 10-K fflings withstock price and stock return information from CRSP and accounting datafrom Compustat. In addition, some compensation data from the 1970swere collected in order to construct measures of the value of stock op-tions held by the CEOs in the first period of the sample.8
The feature that distinguishes our data from most other CEO datasets is that with our panel of yearly proxy data on option grants, optiongains, and total options held, we are able to calculate the total value of
8 We are grateful to David Yermack for providing us with some of the data for 1984 to 1991.See Yermack (1995) for a discussion of these data.
24 Hall & Liebman
all stock options held by the CEO at a point of time. More importantly,since we have the details about the stock options held (number, exer-cise price, time to maturity, etc.), we can precisely calculate the changein the value of a CEO's stock option holdings for a given change in firmvalue.
6.2 Identification IssuesThe numerous tax changes over our sample period and the specific waysin which changes in personal, corporate, and capital gains rates arepredicted to affect the composition of CEO compensation give us un-usually rich sources of identification. However, because many of thechanges in tax rates would be expected to affect all of the CEOs in oursample in a similar way, we wifi need to pay particular attention toseparating out the tax effects from underlying time trends and otherfactors that changed over time. Controlling for underlying trends is par-ticularly important in this study because we are focusing on an out-comethe use of stock optionsthat has increased rapidly over thepast two decades, and that many practitioners believe was importantlyaffected by nontax considerations. Thus the tax effects we are trying toexplain are deviations from a rising trend.
We take two steps to try to separate out the tax effects from theunderlying trend. First, we include key nontax factors that could poten-tially explain the increasing reliance on performance-based compensa-tion. It has been suggested that the dramatic increase in incentive-basedpay is the result of the remarkably poor shareholder returns during the1970s, which spurred the LBO and takeover movements of the 1980s.According to this story (Kaplan, 1997), shareholders became much morepowerful via the rise of institutional investors, even as the LBO andtakeover movements waned. Because the influence of institutional inves-tors is thought to be one of the most important mechanisms of strongcorporate governance, we use the share of each company's stock ownedby institutional investors (defined as institutions with more than $100million under management) as an explanatory variable.9 The percentageof shares owned by large institutional investors increased from about 20percent to almost 50 percent in 1994, an upward trend that closelymatches the sharp rise in the share of compensation in the form ofoptions. Indeed, in our sample, the annual average (over all of the firmsin our sample) share of stock owned by institutional investors has acorrelation of 0.9 with the annual average share of compensation paid inoptions.
This variable is described in Gompers and Metrick (1998).
Taxation of Executive Compensation 25
In addition, we include two other variables that proxy for strongercorporate governance. The first is the size of the board. Evidence suggeststhat boards with smaller numbers of directors reduce the influence of theCEO and better represent shareholder interests (Yermack, 1995). Boardsize fell by approximately 15 percent between 1980 and 1994. The secondvariable is the fraction of the firm's board members who are inside direc-tors or gray directors (noninsiders who have business dealings with thecompany). Firms with fewer outsiders are less likely to act in the share-holders' interests, and we would predict that they would be less likely tohave performance-based compensation for their CEOs. The average per-centage of inside and gray directors has decreased from about 45 percentin 1980 to about 35 percent in 1994.
Second, we allow for cross-sectional variation in corporate tax rates.Corporate marginal tax rates vary because firms may be eligible for tax-loss carrybacks and carryforwards, investment tax credits, and the alter-native minimum tax (see Auerbach, 1986; Auerbach and Altshuler,1990; Auerbach and Poterba, 1987). Because these cross-sectional differ-ences imply that different firms should respond differently to a givenchange in tax rates, they potentially provide us with a way to isolatethe tax effects. Firm-specific corporate marginal tax rates are notori-ously difficult to calculate from publicly-available data. We use a tricho-tomous variable that equals zero if the firm has tax-loss carryforwardsand negative earnings in a given year, equals 0.5 times the statutorycorporate rate if the firm has only one of those conditions, and equalsthe statutory rate if the firm has neither loss carryforwards nor negativeearnings.10
The cross-sectional variation in the corporate tax rate may not be ex-ogenous. Firms that perform poorly could face low marginal tax ratesand also be particularly likely or unlikely to provide performance-basedpay. Because most of our specifications use fixed effects, the correlationwe must be concerned about is between changes in firm performanceand changes in compensation. We deal with this by controlling forlagged firm stock market performance in our regressions. This shouldeliminate spurious correlation between tax rates and compensation thatis jointly caused by firm performance.
Graham (1996) presents evidence that the trichotomous variable performs nearly as wellas his recommended simulated marginal tax rate. Plesko (1999) compares marginal taxrates calculated from Compustat data with actual marginal tax rates from firm tax returns.He finds that simple binary variables are more reliable measures of the marginal tax ratethan is either the Graham or the trichotomous variable. We obtain substantively similarresults when we switch from the trichotomous variable to the binary variables recommendby Plesko.
26 Hall & Liebman
6.3 ResultsThe dependent variable in our regressions is the fraction of a CEO's totalannual compensation (measured as the BlackScholes value of stock-option grants plus salary and bonus) that comes from stock-optiongrants. We choose this reduced-form specification because our interest isin the composition of CEO compensation. However, the factors thataffect the composition of compensation might also affect the levels, andit wifi be important to keep this in mind in interpreting our results.
Optimal-contracting theory generally makes predictions about the in-centives provided by the total amount of firm stock and stock optionsowned by the CEO. We choose to model the flow of option grants ratherthan the ultimate performance sensitivity of the CEO's compensationand stock and stock-option holdings because we have in mind anadjustment-cost model in which it takes time for a CEO's holdings ofstock and stock options to reach the optimal level.11 In our regressions,we include two measures of the current performance sensitivity of theCEO's wealth to firm performance as explanatory variables to reflect thedistance of the CEO's contract from the optimal contract.
Table 3 presents results in which the tax effects are identified solely byvariation in tax rates over time. The fraction of annual compensation paidin stock options is regressed on tax variables, corporate governance vari-ables, contract-theory variables, and variables reflecting stock market re-turns. Both of the regressions in this table include firm fixed effects. Incolunm (1), the fraction in annual compensation paid in stock options isregressed on the log difference in payoff (the combined payoff to both thefirm and the CEO) from receiving compensation in stock options ratherthan salary and bonus, where the payoff calculations are based on statu-tory marginal tax rates. This variable is defined as the log difference be-tween equation (3) and equation (6) in section 4. The coefficient on the taxvariable is large and statistically significant at the 95-percent level. Thepoint estimate implies that a one-percent increase in the payoff differencebetween stock options and salary and bonus results in a 2.4-percentage-point increase in the share of compensation paid in stock options.
The corporate governance variables all have the predicted sign. Firmswith a higher fraction of their shares owned by institutional investors,use more performance-based pay (stock options). Firms with large corpo-rate boards, or a large share of inside directors, are less likely to use stockoptions.
The two contract-theory variables are the dollar change in CEO wealth
' See Core and Guay (1999) for evidence that firms adjust in this way.
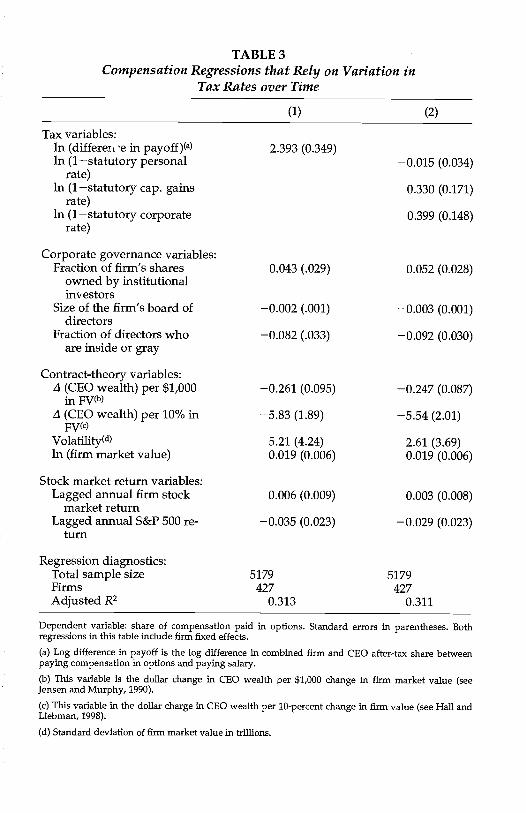
TABLE 3Compensation Regressions that Rely on Variation in
Tax Rates over Time
Dependent variable: share of compensation paid in options. Standard errors in parentheses. Bothregressions in this table include firm fixed effects.
Log difference in payoff is the log difference in combined firm and CEO after-tax share betweenpaying compensation in options and paying salary.
This variable is the dollar change in CEO wealth per $1,000 change in firm market value (seeJensen and Murphy, 1990).
This variable in the dollar charge in CEO wealth per 10-percent change in firm value (See Hall andLiebman, 1998).
Standard deviation of firm market value in trillions.
(1) (2)
Tax variables:in (differen 'e in payoff)(a) 2.393 (0.349)in (1statutory personal
rate)0.015 (0.034)
In (1statutory cap. gainsrate)
in (1 statutory corporaterate)
0.330 (0.171)
0.399 (0.148)
Corporate governance variables:Fraction of firm's shares
owned by institutionalinvestors
0.043 (.029) 0.052 (0.028)
Size of the firm's board ofdirectors
0.002 (.001) 0.003 (0.001)
Fraction of directors whoare inside or gray
0.082 (.033) 0.092 (0.030)
Contract-theory variables:zl (CEO wealth) per $1,000
in FV)0.261 (0.095) 0.247 (0.087)
(CEO wealth) per 10% iii(c)
5.83 (1.89) 5.54 (2.01)
Volatility(d) 5.21 (4.24) 2.61 (3.69)In (firm market value) 0.019 (0.006) 0.019 (0.006)
Stock market return variables:Lagged annual firm stock
market return0.006 (0.009) 0.003 (0.008)
Lagged annual S&P 500 re-turn
0.035 (0.023) 0.029 (0.023)
Regression diagnostics:Total sample size 5179 5179Firms 427 427Adjusted R2 0.313 0.311
28 Hall & Liebman
per $1,000 change in firm value (Jensen and Murphy, 1990) and thedollar change in CEO wealth per 10-percent change in firm value (Halland Liebman, 1998). As discussed in Baker and Hall (1998), these twowealth sensitivity measures reflect two different concepts of how closelyaligned the managers' incentives are with the interests of the sharehold-ers. In the regression they are meant to measure how far the CEO'sexisting contract and ownership of stock and stock options is from theoptimal level. The negative coefficients on the two variables suggeststhat firms that are below their optimal pay-to-performance sensitivityare more likely to give more stock options in the current period.
The second colunm replaces the tax variable motivated by deferraladvantages with the three statutory rates. The corporate after-tax sharehas a positive coefficient, as we would expect, because the tax advantageof stock options increases as the corporate rate falls. The coefficient onthe personal tax rate is small and statistically insignificant. The sign ofthe coefficient on the capital gains rate is the opposite of that predictedby tax-avoidance theory.
Note that these results rely on time-series variation alone. This is not avery convincing test. Since the log difference in payoffs mostly rises overthe time period covered in our sample, as does the share of compensa-tion paid in options, it is possible that the tax variable is simply reflectingother factors that were changing over this time period that we have notincluded in our regression. Therefore, it is important to look at specifica-tions that rely on cross-sectional variation in the tax variables.
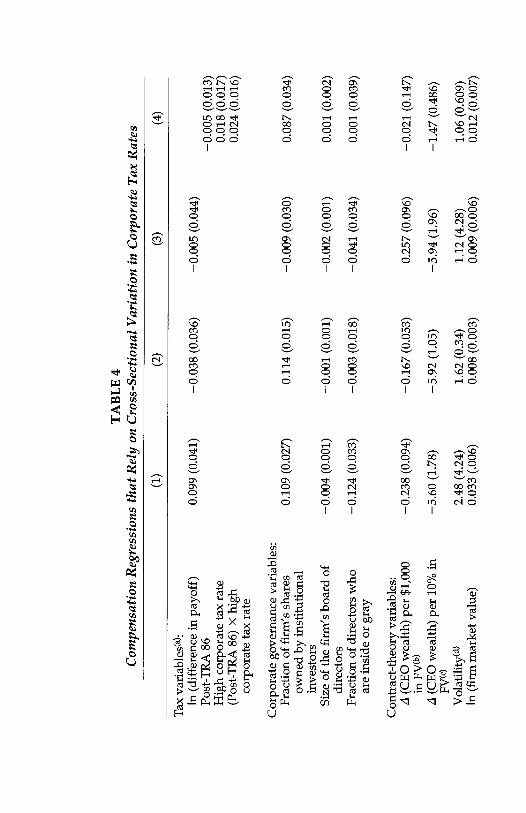
Table 4 contains specifications that rely on cross-sectional variation incorporate tax rates. The first column repeats the specification from col-umn (1) of Table 3, but uses the trichotomous measures of firm corporatetax rates in place of the statutory rate in calculating each firm's logdifference in payoff from paying compensation in options rather than insalary and bonus. As in the previous table, we find the positive coeffi-cient on the log difference in payoff, just as the theory suggest. How-ever, the coefficient estimate is now much smaller, suggesting that aone-percent increase in the log difference in payoff produces a 0.1-percentage-point increase in the share of compensation paid in options.
Introducing cross-sectional variation in the dependent variable doesnot eliminate the potentially spurious correlation over time between thetax variable and the share of compensation paid in options. The secondcolumn of Table 4 isolates the pooled cross-sectional variation in corpo-rate tax rates by adding time dummies and dropping the firm fixedeffects. In this specification, the coefficient on the tax variable is indistin-guishable from zero. The coefficient on the institutional variable contin-ues to be large and statistically significant. The third column includes
Taxation of Executive Compensation 29
both firm fixed effects and time dummies, which tests for a relationshipbetween within-firm changes in the dependent variable and within-firmchanges in each explanatory variable. In this specification, the coefficienton the tax variable is again indistinguishable from zero. The coefficientson the corporate governance variables are also statistically insignificant.
The third column contains a specification that treats the Tax ReformAct of 1986 (TRA 86) as a natural experiment. For firms and CEOs facingthe statutory corporate tax rate, TRA 86 increased the relative payoff topaying compensation in options by 1.7 percent. For a firm facing a zeromarginal tax rate, it reduced the relative payoff by 4.5 percent. The reduc-tion occurred because TRA 86 reduced the personal tax rate, makingsalary and bonus more attractive, while the decreased corporate rate hadno effect on zero-tax-rate firms. Thus, we would expect firms facing zeroor low marginal tax rates to reduce their use of options after TRA 86,while firms facing the statutory rate would be expected to increase them.Few firms face zero marginal tax rates year after year. Therefore, we tryto distinguish between firms that often face low tax rates and firms thatnearly always face the statutory rate. We define low-tax firms as oneswhose average marginal tax rate over 1984 to 1986 was below 0.24.12Then we ran a difference-in-differences regression to see if high-taxfirms increased their use of options more than low-tax firms. The interac-tion between post-TRA 86 and high corporate tax rates is the key vari-able. The estimated coefficient on this variable is positive, but small andnot statistically different from zero at the 95-percent level.
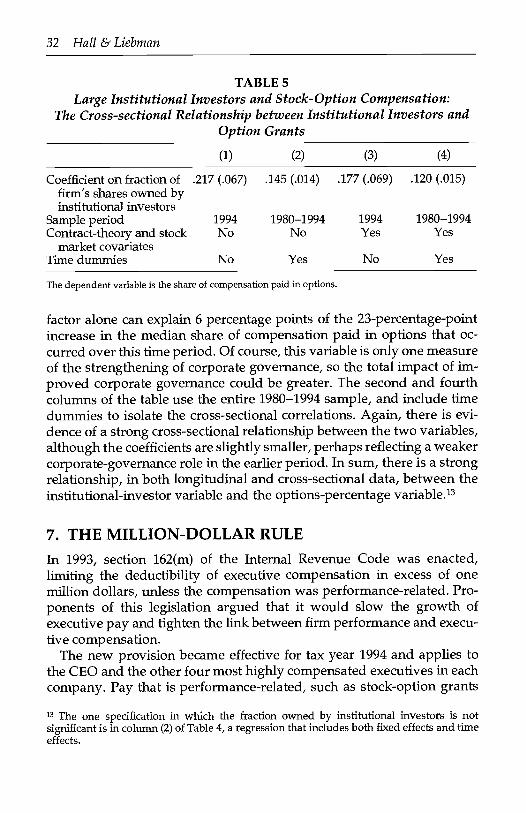
It is important to note that in this specification as well, the main corpo-rate governance variable, the share of the firm's shares owned by institu-tional investors, performs as theory would predict. The variable appearsto be quite robust. Table 5 presents regressions of the share of compensa-tion paid in stock options on the fraction of the firm's shares owned byinstitutional investors. Since we have already established that these vari-ables have a strong longitudinal relationship, the regressions here aredesigned to focus on the cross-sectional relationship between these twovariables. The first and third columns present regressions using data onlyfrom 1994, and find a coefficient of roughly 0.2 (column 1 contains noother covariates, while column 3 includes all of the other nontax covari-ates from the regressions in Tables 3 and 4). Since the median share of afirm's stock owned by institutional investors in our sample rises from 19percent in 1980 to 49 percent in 1994, this coefficient would imply that this
12 This cutoff was chosen after inspecting the distribution of tax rates, and essentiallyseparates firms that are always at or near the statutory rate from ones that are sometimesbelow it.
TA
BL
E 4
Com
pens
atio
n R
egre
ssio
ns th
at R
ely
on C
ross
-Sec
tiona
l Var
iatio
n in
Cor
pora
te T
ax R
ates
(1)
(2)
(3)
(4)
Tax
var
iabl
es(a
):ln
(di
ffer
ence
in p
ayof
f)0.
099
(0.0
41)
-0.0
38 (
0.03
6)-0
.005
(0.
044)
Post
-TR
A 8
6-0
.005
(0.
013)
Hig
h co
rpor
ate
tax
rate
0.01
8 (0
.017
)(P
ost-
TR
A 8
6)X
high
corp
orat
e ta
x ra
te0.
024
(0.0
16)
Cor
pora
te g
over
nanc
e va
riab
les:
Frac
tion
of f
irm
's s
hare
sow
ned
by in
stitu
tiona
lin
vest
ors
0.10
9 (0
.027
)0.
114
(0.0
15)
-0.0
09 (
0.03
0)0.
087
(0.0
34)
Size
of
the
firm
's b
oard
of
dire
ctor
s-0
.004
(0.
001)
-0.0
01 (
0.00
1)-0
.002
(0.
001)
0.00
1 (0
.002
)
Frac
tion
of d
irec
tors
who
are
insi
de o
r gr
ay-0
.124
(0.
033)
-0.0
03 (
0.01
8)-0
.041
(0.
034)
0.00
1 (0
.039
)
Con
trac
t-th
eory
var
iabl
es:
4 (C
EO
wea
lth)
per
$1,0
00in
FV
(b)
-0.2
38 (
0.09
4)-0
.167
(0.
053)
-0.2
57 (
0.09
6)-0
.021
(0.
147)
4 (C
EO
wea
lth)
per
10%
in(c
)-5
.60
(1.7
8)-5
.92
(1.0
5)-5
.94
(1.9
6)-1
.47
(0.4
86)
Vol
atff
ity("
)2.
48 (
4.24
)1.
62 (
0.34
)1.
12 (
4.28
)1.
06 (
0.60
9)In
(fi
rm m
arke
t val
ue)
0.03
3 (.
006)
0.00
8 (0
.003
)0.
009
(0.0
06)
0.01
2 (0
.007
)
Dep
ende
nt v
aria
ble
is f
ract
ion
of a
nnua
l com
pens
atio
n fr
om s
tock
opt
ions
. Sta
ndar
d er
rors
in p
aren
thes
es.
All
thre
e sp
ecif
icat
ions
use
tric
hoto
mou
s co
rpor
ate
tax
rate
s. T
he s
ampl
e in
col
umn
(3)
uses
onl
y th
e ye
ars
1984
to 1
988,
sin
ce w
e ar
e us
ing
1986
as a
natu
ral e
xper
imen
t.
Thi
s va
riab
le is
the
dolla
r ch
ange
in C
EO
wea
lth p
er $
1,00
0 ch
ange
in f
irm
mar
ket v
alue
(se
e Je
nsen
and
Mur
phy,
199
0).
Thi
s va
riab
le in
the
dolla
r ch
arge
in C
EO
wea
lth p
er 1
0-pe
rcen
t cha
nge
in f
irm
val
ue (
see
Hal
l and
Lie
bman
, 199
8).
Stan
dard
dev
iatio
n of
fir
m m
arke
t val
ue in
trill
ions
.
Stoc
k m
arke
t ret
urn
vari
able
s:L
agge
d an
nual
fir
m s
tock
mar
ket r
etur
n0.
002
(0.0
09)
0.01
1 (0
.010
)0.
006
(0.0
09)
0.01
2 (0
.013
)
Lag
ged
annu
al S
&P
500
retu
rn0.
056
(0.0
23)
0.05
3 (0
.051
)0.
039
(0.0
49)
0.15
4 (0
.040
)
Reg
ress
ion
diag
nost
ics:
Tot
al s
ampl
e si
ze51
7951
7951
7925
34Fi
rms
427
427
396
Adj
uste
d R
20.
310.
090.
320.
05
Firm
fix
ed e
ffec
tsY
esN
oY
esN
oT
ime
dum
mie
sN
oY
esY
esN
o
32 Hall & Liebman
TABLE 5Large Institutional Investors and Stock-Option Compensation:
The Cross-sectional Relationship between Institutional Investors andOption Grants
The dependent variable is the share of compensation paid in options.
factor alone can explain 6 percentage points of the 23-percentage-pointincrease in the median share of compensation paid in options that oc-curred over this time period. Of course, this variable is only one measureof the strengthening of corporate governance, so the total impact of im-proved corporate governance could be greater. The second and fourthcolumns of the table use the entire 1980-1994 sample, and include timedummies to isolate the cross-sectional correlations. Again, there is evi-dence of a strong cross-sectional relationship between the two variables,although the coefficients are slightly smaller, perhaps reflecting a weakercorporate-governance role in the earlier period. In sum, there is a strongrelationship, in both longitudinal and cross-sectional data, between theinstitutional-investor variable and the options-percentage variable.'3
7. THE MILLION-DOLLAR RULEIn 1993, section 162(m) of the Internal Revenue Code was enacted,limiting the deductibility of executive compensation in excess of onemillion dollars, unless the compensation was performance-related. Pro-ponents of this legislation argued that it would slow the growth ofexecutive pay and tighten the link between firm performance and execu-tive compensation.
The new provision became effective for tax year 1994 and applies tothe CEO and the other four most highly compensated executives in eachcompany. Pay that is performance-related, such as stock-option grants
The one specification in which the fraction owned by institutional investors is notsignificant is in column (2) of Table 4, a regression that includes both fixed effects and timeeffects.
(1) (2) (3) (4)
Coefficient on fraction offirm's shares owned byinstitutional investors
.217 (.067) .145 (.014) .177 (.069) .120 (.015)
Sample period 1994 1980-1994 1994 1980-1994Contract-theory and stock
market covariatesNo No Yes Yes
Time dummies No Yes No Yes
Taxation of Executive Compensation 33
and bonuses paid for meeting clear performance goals, is not affected bythis regulation, provided that it has been approved by shareholders.Thus, the main impact of the provision is to limit the deductibility ofsalary in excess of a million dollars. Woodlock and Antenucci (1997)studied the proxy statements of 376 firms and documented that mostfirms responded to the new law by qualifying top executive pay asperformance-related. Perry and Zenner (1999) identified 25 firms thatreduced salaries from above $1 million to below $1 million and foundthat 23 of the firms cited section 162(m) as their reason for doing so.
In this section of the paper we investigate whether this provision hasaffected the level or structure of executive pay, using the Execucompdata base, which contains information on the highest-paid executives ineach of the firms in the S&P 500, S&P Midcap 400, and S&P SmallCap600. Between 1993 and 1998 the median salary of the Execucomp execu-tives rose from $230,000 to $306,000. The median value of total compen-sation (salary, bonus, and option grants) rose from $470,000 to $882,000.Limiting the sample of CEOs indicates that the total compensation of themedian CEO rose from $1.1 million to $1.8 million over the period, whilethe median salary rose from $441,000 to $550,000. Thus executive com-pensation clearly continued to rise at a rapid rate after the implementa-tion of the million-dollar rule, though perhaps at a slower rate than itotherwise would have.
If the regulation affects behavior, it should have the largest impact onfirms whose executives are receiving salaries that are above the limit orjust below it. Thus, we might expect to see firms whose executives arereceiving relatively high salaries to rely more heavily on performance-based pay and less heavily on salary in the years following the regulation.Perry and Zenner (1999) and Livingston (1999) both find that this is thecase. This trend can be clearly identified in the Execucomp data set. Forexample, over 1993 to 1998 the median annualized growth rate of salaryfor executives whose 1993 salary was below $500,000 in the previous yearwas 8.5 percent. For executives with salary between $500,000 and$700,000 it was 6.4 percent, for executives between $700,000 and $850,000it was 5.0 percent, for executives between $750,000 and $1 million it was3.1 percent, and for executives above $1 million it was 0.0 percent.14
The observation that executives at lower levels of salary had highergrowth rates is not very strong evidence of an impact of section 162(m),however, because it is possible that low-salary executives would havehad higher growth rates even in the absence of the provision. To explore
14 Of the 3137 executives for whom we have complete data between 1993 and 1998, 2708had 1993 salaries below $500,000, while only 35 had 1993 salaries above $1 million.
34 Hall & Liebman
whether this is the case, we use Execucomp data from both before andafter the law change. Ideally, we would want to have data from manyyears before the change to examine whether there is an underlying pat-tern of faster salary growth for low-salary executives. Unfortunately, theExecucomp data begin in 1992 and therefore provide us with only the1992-1993 growth rate in compensation to use as a baseline.15
We run regressions pooling data from 1992-1993 through 1997-1998of the annual percentage change in different forms of compensation on avariable, MILLION, that is designed to measure the likelthood that anexecutive's compensation wifi be affected by section 162(m). We defineMILLION as the minimum of 1 and the executive's salary divided by $1million in the previous year. Thus, any executive with salary at or above$1 million would receive a value of 1, while an executive with a salary of$500,000 would be coded as a 0.5.16 We include this variable by itself andalso interacted with a dummy variable (AFTER) that equals 1 for years1994 and after. Thus the MILLION variable is designed to pick up anyunderlying relationship between the level of salary and the growth rateof salary, while the interacted one wifi identify any differential growthrate of salary by income in the period after section 162(m) took effect. Wealso include a full set of year dummies, the natural logarithm of thefirm's market value, and the firm's annual rate of return over the twoprevious years as control variables. To reduce the sensitivity of our re-sults to outliers, we run quantile regressions and robust regressions.
Table 6 contains our results. The first four columns are for all topexecutives, while the last four columns focus on CEOs. Columns (1) and(2) present estimates from robust regression for the percentage change insalary and the percentage change in total compensation (salary, bonus,stock grants, and stock-option grants). In the salary growth regressionsfor all executives, the coefficient on MILLION is negative and significant,indicating that there is an underlying relationship between the level ofexecutive compensation and its subsequent growth rate. The coefficienton MILLION X AFTER 1S negative as well, suggesting that the negativerelationship between the level of salary and its subsequent growth rateintensified slightly after 1994. The relatively small magnitude suggeststhat an executive with a $1 million dollar salary would see his salarygrow at an annual rate that would be about 0.6 percent slower than anexecutive earning $500,000.
15 The Hall-Liebman data set contains only a combined salary and bonus variable, makingit impossible to use it to analyze this issue.
16 We also ran the regressions (not reported) allowing for a nonlinear relationship betweenMILLION and compensation growth, and obtained substantively similar results.
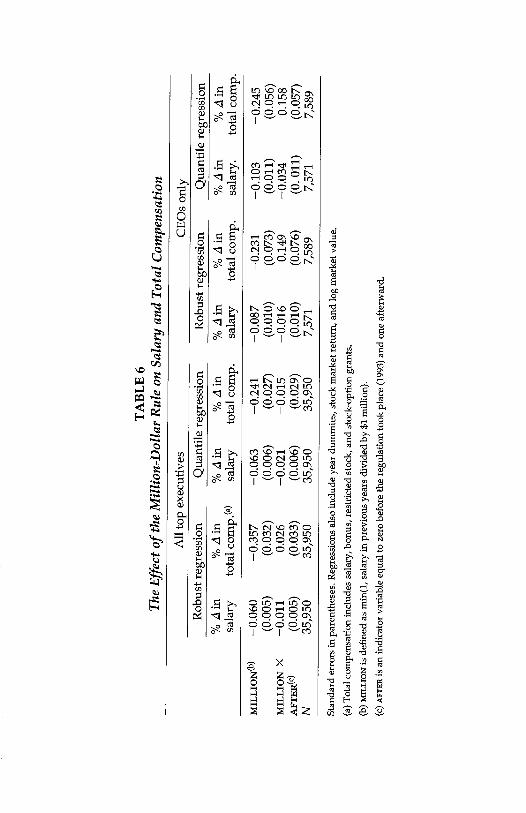
TA
BL
E 6
The
Eff
ect o
f th
e M
illio
n-D
olla
r R
ule
on S
alar
y an
d T
otal
Com
pens
atio
n
All
top
exec
utiv
esC
EO
s on
lyR
obus
t reg
ress
ion
Qua
ntile
reg
ress
ion
Rob
ust r
egre
ssio
nQ
uant
ile r
egre
ssio
n
Stan
dard
err
ors
in p
aren
thes
es. R
egre
ssio
ns a
lso
incl
ude
year
dum
mie
s, s
tock
mar
ket r
etur
n, a
nd lo
g m
arke
t val
ue.
Tot
al c
ompe
nsat
ion
incl
udes
sal
ary,
bon
us, r
estr
icte
d st
ock,
and
sto
ck-o
ptio
n gr
ants
.
MIL
LIO
N is
def
ined
as
min
(1, s
alar
y in
pre
viou
s ye
ars
divi
ded
by $
1 m
illio
n).
AFT
ER
is a
n in
dica
tor
vari
able
equ
al to
zer
o be
fore
the
regu
latio
n to
ok p
lace
(19
93)
and
one
afte
rwar
d.
%zl
insa
lary
%4i
nto
tal c
omp.
(a)
%1i
nsa
lary
%L
tinto
tal c
omp.
%4i
nsa
lary
%4i
nto
tal c
omp.
%zi
nsa
lary
.%
tinto
tal c
omp.
MIL
LIO
N("
)0.
060
0.35
70.
063
0.24
10.
087
0.23
10.
103
0.24
5(0
.005
)(0
.032
)(0
.006
)(0
.027
)(0
.010
)(0
.073
)(0
.011
)(0
.056
)M
ILL
ION
X0.
011
0.02
60.
021
0.01
50.
016
0.14
90.
034
0.15
8A
FTE
R(C
)(0
.005
)(0
.033
)(0
.006
)(0
.029
)(0
.010
)(0
.076
)(0
. 011
)(0
.057
)N
35,9
5035
,950
35,9
5035
,950
7,57
17,
589
7,57
17,
589
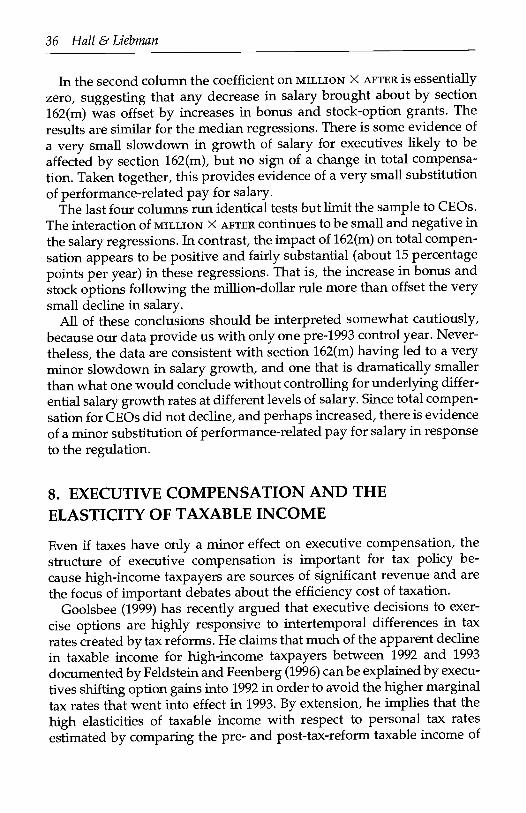
36 Hall & Liebman
In the second column the coefficient on MILLION X AFTER is essentiallyzero, suggesting that any decrease in salary brought about by section162(m) was offset by increases in bonus and stock-option grants. Theresults are similar for the median regressions. There is some evidence ofa very small slowdown in growth of salary for executives likely to beaffected by section 162(m), but no sign of a change in total compensa-tion. Taken together, this provides evidence of a very small substitutionof performance-related pay for salary.
The last four columns run identical tests but limit the sample to CEOs.The interaction of MILLION X AFTER continues to be small and negative inthe salary regressions. In contrast, the impact of 162(m) on total compen-sation appears to be positive and fairly substantial (about 15 percentagepoints per year) in these regressions. That is, the increase in bonus andstock options following the million-dollar rule more than offset the verysmall decline in salary.
All of these conclusions should be interpreted somewhat cautiously,because our data provide us with only one pre-1993 control year. Never-theless, the data are consistent with section 162(m) having led to a veryminor slowdown in salary growth, and one that is dramatically smallerthan what one would conclude without controlling for underlying differ-ential salary growth rates at different levels of salary. Since total compen-sation for CEOs did not decline, and perhaps increased, there is evidenceof a minor substitution of performance-related pay for salary in responseto the regulation.
8. EXECUTIVE COMPENSATION AND THEELASTICITY OF TAXABLE INCOME
Even if taxes have only a minor effect on executive compensation, thestructure of executive compensation is important for tax policy be-cause high-income taxpayers are sources of significant revenue and arethe focus of important debates about the efficiency cost of taxation.
Goolsbee (1999) has recently argued that executive decisions to exer-cise options are highly responsive to intertemporal differences in taxrates created by tax reforms. He claims that much of the apparent declinein taxable income for high-income taxpayers between 1992 and 1993documented by Feldstein and Feenberg (1996) can be explained by execu-tives shifting option gains into 1992 in order to avoid the higher marginaltax rates that went into effect in 1993. By extension, he implies that thehigh elasticities of taxable income with respect to personal tax ratesestimated by comparing the pre- and post-tax-reform taxable income of
Taxation of Executive Compensation 37
high-income individuals reflect intertemporal shifting of income and notpermanent effects of taxation. If this is true, then the deadweight loss oftaxation is lower, as is the cost of progressivity.
While Goolsbee presents comprehensive evidence that option gainswere unusually high in 1992, his identification of the impact of tax rates onthe timing of option gains depends on correctly specifying a counter-factual level of options that would have been exercised in the absence ofthe tax change. He simply assumes a linear time trend. The purpose ofGoolsbee's time trend is presumably to account for the increasing use ofoptions over time. However, since options typically require a vestingperiod of at least a couple of years, a much more direct measure of ex-pected option gains can be constructed, based on the total value of vestedoptions held by the CEO. Since options typically have vesting periods thatexceed two years, this total can be treated as exogenous, since it wifi not beaffected by the tax changes.
More generally, the value of options held by the CEO is likely to havea major effect on his exercise decisions. If his options are out of themoney, he wifi not have gains to realize. If there has been a recent run-up in the market, an optimizing CEO may exercise an unusually largeamount of options in order to diversify his overall portfolio, and if in-the-money options are about to expire, they wifi be exercised in thecurrent year.
Our evidence suggests that much of the apparent tax shifting caninstead be attributed to stock market performance and the timing of pastoption grants. Using our 15-year panel, we replicate Goolsbee's (1999)result for the 1993 period, but show that the impact of taxes is notpresent in other time periods. Moreover, even the result for the 1993period disappears when appropriate controls for past option grants andstock price appreciation are included.
The top three rows of Table 7 present data on the taxable incomes ofCEOs in the HallLiebman sample. For these results our panel has beennarrowed to include only CEOs whose firm's fiscal years correspondwith tax years. In addition, we create a balanced panel for each of thethree tax-reform periods by excluding any firm for which there are notcomplete data for the period surrounding the reform.
The fourth row of the table shows that the 1993 tax act raised the topmarginal personal income tax rate from 31.0 to 39.6 percent effective fortax year 1993, with a further increase occurring in 1994 due to the uncap-ping of the Medicare payroll tax. The top row of the table shows thattaxable income was higher in 1992 than for any other year in our sample(all data are in 1994 dollars). Option gains were particularly high in1992more than double their 1991 level and 68 percent higher than their
TA
BL
E 7
Tax
Ref
orm
, Sto
ck M
arke
t Per
form
ance
, and
the
Tim
ing
of O
ptio
n G
ains
Sam
ple
is H
all-
Lie
bmar
i fir
ms
with
Dec
embe
r fi
scal
yea
rs th
at h
ad c
ompl
ete
data
for
one
of
the
thre
e ta
x-re
form
per
iods
stu
died
.
Ave
rage
stoc
k m
arke
tM
ean
CE
O M
ean
CE
Ore
turn
for
Mea
n va
lue
taxa
ble
sala
ry a
ndM
ean
CE
OT
op f
eder
alfi
rms
inof
opt
ions
(Val
ue o
f op
tion
Sam
ple
inco
me
bonu
sop
tion
gain
spe
rson
alsa
mpl
e fo
rhe
ld a
t beg
.ga
ins)
/(va
lue
Ref
orm
size
Yea
r($
mil.
)($
mil.
)($
mil.
)M
TR
prey
. yea
r (%
)of
yea
rof
opt
ions
hel
d)
ER
TA
81
279
1980
0.87
40.
648
0.16
370
25.8
0.46
0.3
5419
810.
831
0.67
20.
098
6924
.50.
706
.139
1982
0.87
20.
679
0.09
950
11.9
0.68
6.1
4419
830.
990
0.72
40.
252
5035
.51.
166
.216
TR
A 8
629
519
851.
197
0.83
70.
240
507.
61.
160
.207
1986
1.44
80.
917
0.34
550
42.8
1.77
6.1
9419
871.
655
0.95
90.
593
38.5
19.1
2.22
9.2
6619
881.
632
1.05
80.
390
280.
72.
377
.164
1989
1.65
61.
052
0.41
428
17.9
2.34
5.1
76
1993
272
1990
2.09
51.
028
0.61
828
23.2
2.88
0.2
15T
ax A
ct19
911.
875
1.02
00.
547
31-0
.12.
688
.203
1992
2.67
81.
070
1.25
031
46.6
4.55
2.2
7519
932.
324
1.20
90.
743
39.6
20.6
4.29
9.1
7319
941.
964
1.26
20.
378
42.5
15.4
5.11
3.0
74
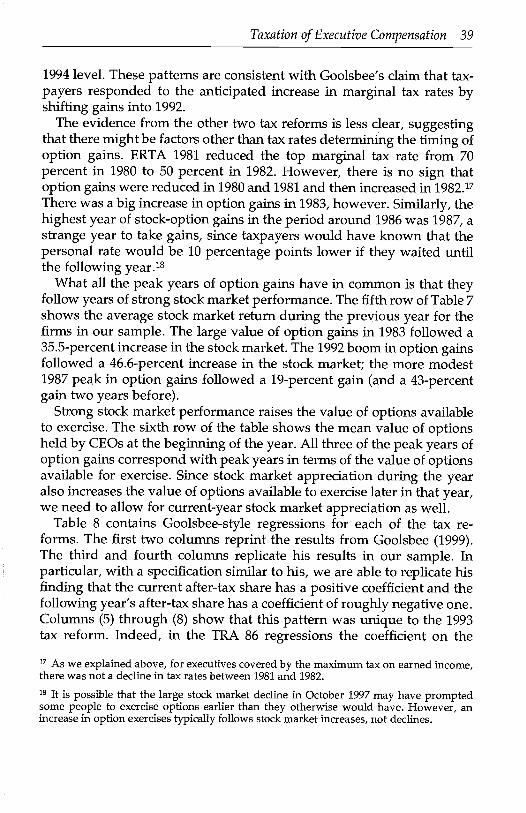
Taxation of Executive Compensation 39
1994 level. These patterns are consistent with Goolsbee's claim that tax-payers responded to the anticipated increase in marginal tax rates byshifting gains into 1992.
The evidence from the other two tax reforms is less clear, suggestingthat there might be factors other than tax rates determining the timing ofoption gains. ERTA 1981 reduced the top marginal tax rate from 70percent in 1980 to 50 percent in 1982. However, there is no sign thatoption gains were reduced in 1980 and 1981 and then increased in 1982.17There was a big increase in option gains in 1983, however. Similarly, thehighest year of stock-option gains in the period around 1986 was 1987, astrange year to take gains, since taxpayers would have known that thepersonal rate would be 10 percentage points lower if they waited untilthe following year.18
What all the peak years of option gains have in common is that theyfollow years of strong stock market performance. The fifth row of Table 7shows the average stock market return during the previous year for thefirms in our sample. The large value of option gains in 1983 followed a35.5-percent increase in the stock market. The 1992 boom in option gainsfollowed a 46.6-percent increase in the stock market; the more modest1987 peak in option gains followed a 19-percent gain (and a 43-percentgain two years before).
Strong stock market performance raises the value of options availableto exercise. The sixth row of the table shows the mean value of optionsheld by CEOs at the beginning of the year. AU three of the peak years ofoption gains correspond with peak years in terms of the value of optionsavailable for exercise. Since stock market appreciation during the yearalso increases the value of options available to exercise later in that year,we need to allow for current-year stock market appreciation as well.
Table 8 contains Goolsbee-style regressions for each of the tax re-forms. The first two columns reprint the results from Goolsbee (1999).The third and fourth columns replicate his results in our sample. Inparticular, with a specification similar to his, we are able to replicate hisfinding that the current after-tax share has a positive coefficient and thefollowing year's after-tax share has a coefficient of roughly negative one.Columns (5) through (8) show that this pattern was unique to the 1993tax reform. Indeed, in the TRA 86 regressions the coefficient on the
As we explained above, for executives covered by the maximum tax on earned income,there was not a decline in tax rates between 1981 and 1982.18 It is possible that the large stock market decline in October 1997 may have promptedsome people to exercise options earlier than they otherwise would have. However, anincrease in option exercises typically follows stock market increases, not declines.
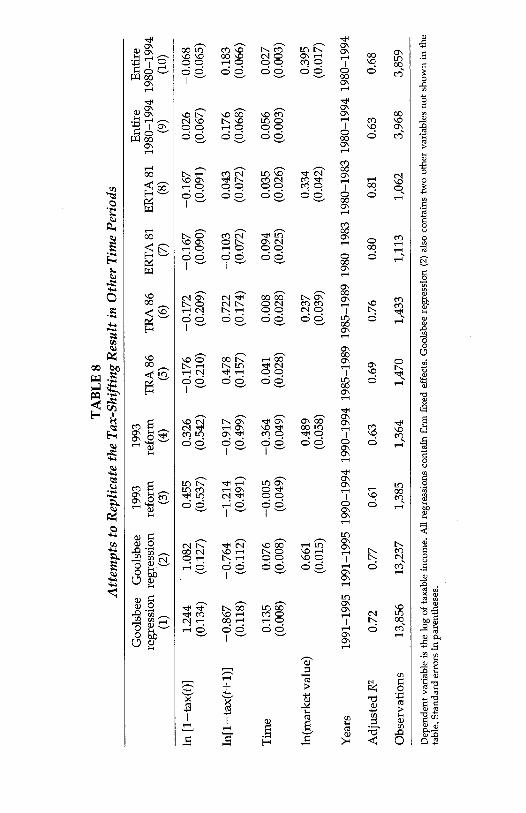
TA
BL
E 8
Atte
mpt
s to
Rep
licat
e th
e T
ax-S
hift
ing
Res
ult i
n O
ther
Tim
e Pe
riod
s
Dep
ende
nt v
aria
ble
is th
e lo
g of
taxa
ble
inco
me.
All
regr
essi
ons
cont
ain
firm
fix
ed e
ffec
ts. G
ools
bee
regr
essi
on (
2) a
lso
cont
ains
two
othe
r va
riab
les
not s
how
n in
the
tabl
e. S
tand
ard
erro
rs in
par
enth
eses
.
Goo
lsbe
eG
ools
bee
regr
essi
on r
egre
ssio
n(1
)(2
)
1993
refo
rm(3
)
1993
refo
rm(4
)T
RA
86
(5)
TR
A 8
6(6
)E
RT
A 8
1(7
)E
RT
A 8
1(8
)
Ent
ire
1980
-199
4(9
)
Ent
ire
1980
-199
4(1
0)
in [
1-ta
x(t)
]1.
244
1.08
20.
455
0.32
6-0
.176
-0.1
72-0
.167
-0.1
670.
026
-0.0
68(0
.134
)(0
.127
)(0
.537
)(0
.542
)(0
.210
)(0
.209
)(0
.090
)(0
.091
)(0
.067
)(0
.065
)
In[1
-tax
(t+
1)]
-0.8
67-0
.764
-1.2
14-0
.917
0.47
80.
722
-0.1
030.
043
0.17
60.
183
(0.1
18)
(0.1
12)
(0.4
91)
(0.4
99)
(0.1
57)
(0.1
74)
(0.0
72)
(0.0
72)
(0.0
68)
(0.0
66)
Tim
e0.
135
0.07
6-0
.005
-0.3
640.
041
0.00
80.
094
0.03
50.
056
0.02
7(0
.008
)(0
.008
)(0
.049
)(0
.049
)(0
.028
)(0
.028
)(0
.025
)(0
.026
)(0
.003
)(0
.003
)
ln(m
arke
t val
ue)
0.66
10.
489
0.23
70.
334
0.39
5(0
.015
)(0
.058
)(0
.039
)(0
.042
)(0
.017
)
Yea
rs19
91-1
995
1991
-199
5 19
90-1
994
1990
-199
4 19
85-1
989
1985
-198
9 19
80-1
983
1980
-198
3 19
80-1
994
1980
-199
4
Adj
uste
d R
20.
720.
770.
610.
630.
690.
760.
800.
810.
630.
68
Obs
erva
tions
13,8
5613
,237
1,38
51,
364
1,47
01,
433
1,11
31,
062
3,96
83,
859
Taxation of Executive Compensation 41
TABLE 9Alternative Explanations for the Timing of Option Exercises
The dependent variable is the log of taxable income. All regressions contain firm fixed effects. Stan-dard errors in parentheses.
following year's tax rate is positive and significant. Columns (9) and (10)pooi all three reforms and fail to replicate the pattern that would reflectintertemporal shifting.19
It is possible that the ease with which one can shift the timing ofoption gains is asymmetric. It may be harder to shift option gains for-ward in time, since some options expire and therefore must be exercisednow. In addition, options were a much smaller portion of compensationin the early 1980s, so perhaps the ERTA 81 results are not surprising.Nonetheless, these results cast doubt on the proposition that this is thechannel through which spurious estimates of the elasticity of taxableincome have occurred for previous tax reforms, and they suggest thatwe should look harder for alternative explanations for the timing ofoption gains.
Table 9 attempts to predict options gains using the lagged and currentincrease in a firm's market value and the value of the options held by theCEO at the start of the year. The two stock market variables stronglypredict option gains, while the value of options held has the correct sign
19 The results also fail to suggest large permanent effects of marginal tax rates on taxableincome.
1993reform
(1)TRA 86
(2)ERTA 81
(3)
Entire1980-1994
(4)
ln[1-tax(t)J 0.108 0.111 -0.051 0.201(0.324) (0.136) (0.048) (0.057)
in[1-tax(t+1)] -0.134 0.573 0.125 0.150(0.336) (0.156) (0.053) (0.066)
ln(market value) 0.418 0.177 0.338 0.418(0.061) (0.039) (0.046) (0.163)
Firm's stock market return (t) 0.298 0.268 0.214 0.258(0.044) (0.045) (0.031) (0.023)
Firm's stock market return 0.162 0.206 0.031 0.128(t-1) (0.041) (0.008) (0.029) (0.021)
In(value of options held by 0.004 0.008 0.001 0.009CEO at start of year) (0.003) (0.003) (0.002) (0.001)
Years 1990-1994 1985-1989 1980-1983 1980-1994Adjusted R2 0.64 0.71 0.82 0.68Observations 1349 1427 1036 3812
42 Hall & Liebman
in all of the specifications and is significant in the pooled sample eventhough it is highly correlated with the two stock market return variables.In contrast, the tax-timing explanation fails, even in the 1993 period.
It is important to realize that our results do not invalidate Goolsbee'scritique of claims that aggregate revenue data from 1992 and 1993 provethat elasticities of taxable income are large. We have simply given analternative explanation for why taxable incomes were unusually high in1992. However, our results do cast doubt on the conclusion that largetiming shifts are ubiquitous and capable of explaining away the morecareful estimates of taxable income elasticities that have been performedusing micro data (e.g., Feldstein, 1995; Auten and Carroll, 1995).
One further point is in order. It is sometimes argued that the combina-tion of increased use of options and the booming stock market explainswhy federal tax revenues have been so much higher than expected dur-ing the 1990s. However, while large option gains increase revenue fromthe personal income tax, they produce offsetting deductions for cor-porations. The net impact on revenue is only the difference in the twomarginal tax rates times the option gain. While the gap between thepersonal rate and the effective corporate rate is nontrivial, the impact oflarge option exercises on total revenue is substantially smaller than theamount by which the exercises inflate personal tax revenue and reducecorporate tax revenue.
9. CONCLUSION
We have described the tax rules for executive pay in detail and analyzedhow changes in various tax rates affect the tax advantages of stock optionsrelative to salary and bonus. We find that there is a moderate tax advan-tage to optionscurrently about $4 per $100 in pretax executive payand that changes in the tax advantage of options over time have had atmost a modest impact on the composition of pay. Corporate governancefactors, particularly the role of large investors, appear to be more impor-tant in explaining the dramatic increase in option pay.
In addition, our evidence suggests that more direct attempts to use taxpolicy to influence executive compensation have had little effect. Wefind that the million-dollar rule led companies to substitute perfor-mance-based pay for salary But our evidence suggests that this substitu-tion was quite modest, and there is no evidence that the, total level of paywas reduced. Overall, although the stock-option explosion has dramati-cally increased the link between pay and performance, this change isdue almost entirely to nontax factors.
REFERENCES
Auerbach, Alan J. (1996). "The Dynamic Effects of Tax Law Asymmetries." Re-view of Economic Studies 53:451-405.
and James Poterba (1987). "Tax Loss Carryforwards and Corporate TaxIncentives." In The Effects of Taxation on Capital Accumulation, M. Feldstein,(ed). Chicago: University of Chicago Press.
Altshuler, Rosanne and Alan Auerbach (1990). "The Significance of Tax LawAsymmetries: An Empirical Investigation," Quarterly Journal of Economics, 105,61-86.
Auten, Gerald and Robert Carroll (1995). "The Effect of Income Taxes on House-hold Behavior." Office of Tax Analysis. U.S. Department of the Treasury.
Baker, George P., and Brian J. Hall (1998). "CEO Incentives and Firm Size."NBER Working Paper no. 6868. December.
Core, John, and Wayne Guay (1999). "The Use of Equity Grants to ManageOptimal Equity Incentive Levels." Draft.
Feldstein, M. (1995). "The Effect of Marginal Tax Rates on Taxable Income: APanel Study of the 1986 Tax Reform Act." Journal of Political Economy 103 (no.3):551-72.
and D. Feenberg (1996). "The Effect of Increased Tax Rates on TaxableIncome and Economic Efficiency: A Preliminary Analysis of the 1993 Tax RateIncreases." In Tax Policy and the Economy, vol. 10, James M. Poterba (ed.).Cambridge, MA: MIT Press.
Gompers, Paul A., and Andrew Metrick (1998). "Institutional Investors andEquity Prices." NBER Working Paper no. 6723.
Goolsbee, Austan (1999). "What Happens When You Tax the Rich? Evidencefrom Executive Compensation." NBER Working Paper no. 6333.
Graham, John R. (1996). "Proxies for the Corporate Marginal Tax Rate." Journal ofFinancial Economics 42:187-221.
Hall, Brian J. (1999). "The Design of Multi-year Stock Option Plans." Journal ofApplied Corporate Finance 12(2):97-106.
and Jeffrey B. Liebman (1998). "Are CEOs Really Paid Like Bureau-crats?" Quarterly Journal of Economics CXII(no. 3):653-691.
Jensen, Michael C., and William M. Meckling (1976). "Theory of the Firm: Mana-gerial Behavior, Agency Costs and Ownership Structure." Journal of FinancialEconomics 111:305-360.;
,and Kevin J. Murphy (1990). "Performance Pay and Top-ManagementIncentives." Journal of Political Economy XCVIII:225-264.
Kaplan, Steven N. (1997). "The Evolution of U.S. Corporate Governance: WeAre All Henry Kravis Now." Draft.
Livingstone, Jane R. (1999). "Executive Compensation Contracting and Re-sponses to Increased Tax Costs." Louisiana State University. June.
Miller, Merton H., and Myron S. Scholes (1982). "Executive Compensation,Taxes, and Incentives." In Financial Economics: Essays in Honor of Paul Cootner,Wffliam F. Sharpe and Cathryn M. Cootner (eds.). Princeton, NJ: Prentice-Hall.
Murphy, Kevin J. (1999). "Executive Compensation," forthcoming in OrleyAshenfelter and David Card (eds.), Handbook of Labor Economics, Vol. 3, NorthHolland.
Perry, Todd, and Marc Zenner (1999). "Pay for Performance? Government Regu-
Taxation of Executive Compensation 43

44 Hall & Liebman
lations and the Structure of Compensation Contracts." University of NorthCarolina at Chapel Hill Working Paper.
Plesko, George A. (1999). "An Evaluation of Alternative Measures of CorporateTax Rates." MIT Working Paper.
Scholes, Myron, and Mark Wolfsen (1992). Taxes and Business Strategy, Chapter10, pp. 179-195. Princeton, NJ: Prentice-Hall.
Woodlock, Peter, and Joseph W. Antenucci (1997). "Update: Corporate Re-sponses to Executive Compensation Deductibility Limits." Tax Notes, October13:221-226.
Yermack, David (1995). "Do Corporations Award CEO Stock Options Effec-tively?" Journal of Financial Economics, 34, 237-269.