the swiss medical technology industry 2014: the dawn the swiss medical technology industry 2014: ......
TRANSCRIPT
Partner Publisher
The Swiss Medical Technology Industry 2014:The Dawn of a New Era
2© SMTI 2014
SMTI 2014 – The Dawn of a New Era
This is the fourth full edition of the Swiss Medical TechnologyIndustry (SMTI) Report first initiated in 2006. This issue isbased on growing industry participation - over 340 firmscontributed their insight and facts to this report.
Over the years we observed a fundamental shift in businessbehavior within the industry from soaring double digit growth tosingle digit growth in today’s consolidating world. Thestagnation, however, has ceased and firms are using themomentum to recuperate and initiate the next leap forward intheir growth ambitions beyond bundled offerings. Thus, weforesee a new medtech era rising which embraces holisticintegration. Holistic integration refers to the ability of acompany to capture a whole area of healthcare, such as adisease, and owning all aspects of care from supplies toservices to hospital suits.
As such, the SMTI 2014 report results led to astonishingobservations and four focused conclusions.
Switzerland maintains (relative to its size and per capita) itsglobally leading position with the highest density ofmedtech-related activities. This is even more noteworthytoday, as Swiss companies were under severe pressure of arising Swiss Franc, making exports less competitive twoyears ago. (see SMTI 2012)
Medtech companies face two main challenges globally. Therising global pressure on healthcare costs and the risingdemands on regulatory and administrative requirements. Inparticular, the latter makes it harder for the Swiss SME
based medtech industry to succeed in a globalized andconsolidating business environment.
In order to remain competitive medtech companies shouldrevisit their business models (see SMTI 2012) and inparticular their market access strategies. Currently, newmodels are emerging. This development is driven by largercompanies who apply forward integration in order to enlargetheir share of wallet. Now such companies are in a positionto block selected procedures, disease areas and/ or marketchannels entirely. This dominance will increasingly beapplied to “lock-out” smaller competitors in their directbusiness relationship with customers.
However, Swiss medtech companies are well positioned tocompete successfully in this new environment. Variousstrengths play to their advantage – be it the base of highlynetworked innovation, the premium technologies, the“Swiss” quality, the superb academic backbone or the broadskill base. Given these assets, the SMTI outlook is bright.The expected growth rate is almost 10% for 2014 and 2015respectively.
We wish to sincerely thank all participating medtechcompanies, our sponsors, and the advisory board members forinvesting their time in constructive discussions. A special thankgoes to Mr. Jonas Frey from the Medical Cluster, whosupported the authors and the publisher in this report.
Dr. Patrick Dümmler, Beatus Hofrichter, Peter BiedermannAuthors and publisher of the SMTI 2014, August 2014
3
1
2
4
3© SMTI 2014
Contents
Management summary 5
A. Profile of the SMTI 8
B. Results of the survey 35
Challenges 36
Strategic actions 41
International markets 47
Innovation 54
C. Outlook: Trends and new opportunities 59
Appendix
I Further survey results 67
II Study methodology 71
II Partners 77
III SMTI knowledge base 76
Management summary
5© SMTI 2014
Management summary (1/2)
MANAGEMENT SUMMARY
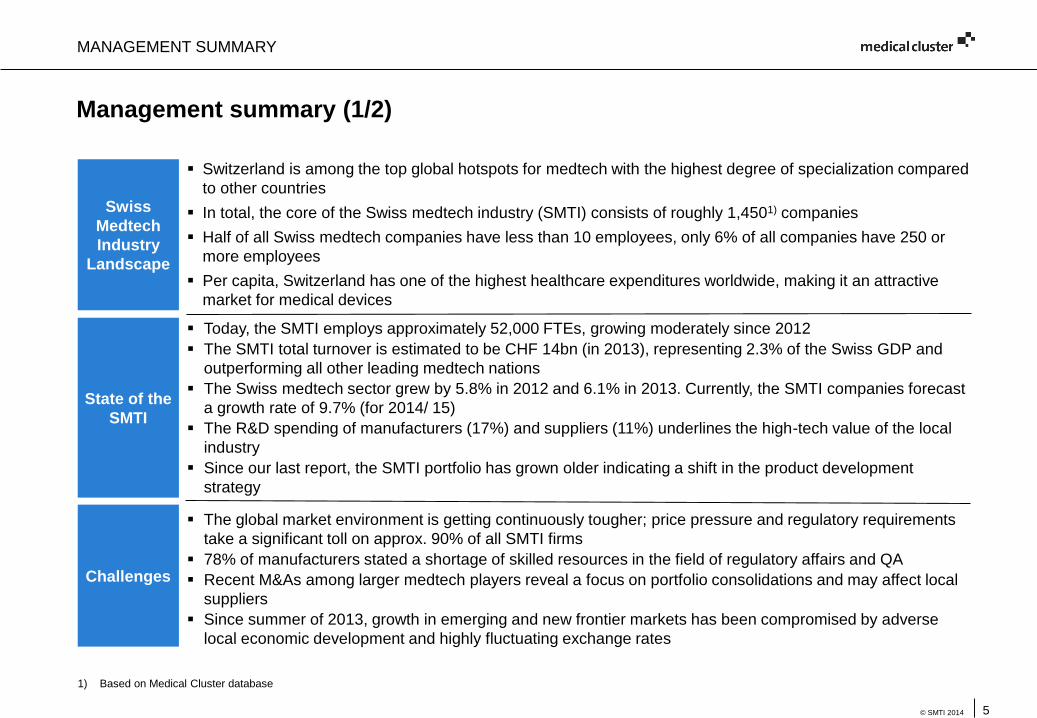
Today, the SMTI employs approximately 52,000 FTEs, growing moderately since 2012
The SMTI total turnover is estimated to be CHF 14bn (in 2013), representing 2.3% of the Swiss GDP and
outperforming all other leading medtech nations
The Swiss medtech sector grew by 5.8% in 2012 and 6.1% in 2013. Currently, the SMTI companies forecast
a growth rate of 9.7% (for 2014/ 15)
The R&D spending of manufacturers (17%) and suppliers (11%) underlines the high-tech value of the local
industry
Since our last report, the SMTI portfolio has grown older indicating a shift in the product development
strategy
Switzerland is among the top global hotspots for medtech with the highest degree of specialization compared
to other countries
In total, the core of the Swiss medtech industry (SMTI) consists of roughly 1,4501) companies
Half of all Swiss medtech companies have less than 10 employees, only 6% of all companies have 250 or
more employees
Per capita, Switzerland has one of the highest healthcare expenditures worldwide, making it an attractive
market for medical devices
The global market environment is getting continuously tougher; price pressure and regulatory requirements
take a significant toll on approx. 90% of all SMTI firms
78% of manufacturers stated a shortage of skilled resources in the field of regulatory affairs and QA
Recent M&As among larger medtech players reveal a focus on portfolio consolidations and may affect local
suppliers
Since summer of 2013, growth in emerging and new frontier markets has been compromised by adverse
local economic development and highly fluctuating exchange rates
Swiss
Medtech
Industry
Landscape
Challenges
State of the
SMTI
1) Based on Medical Cluster database
6© SMTI 2014
Management summary (2/2)
MANAGEMENT SUMMARY
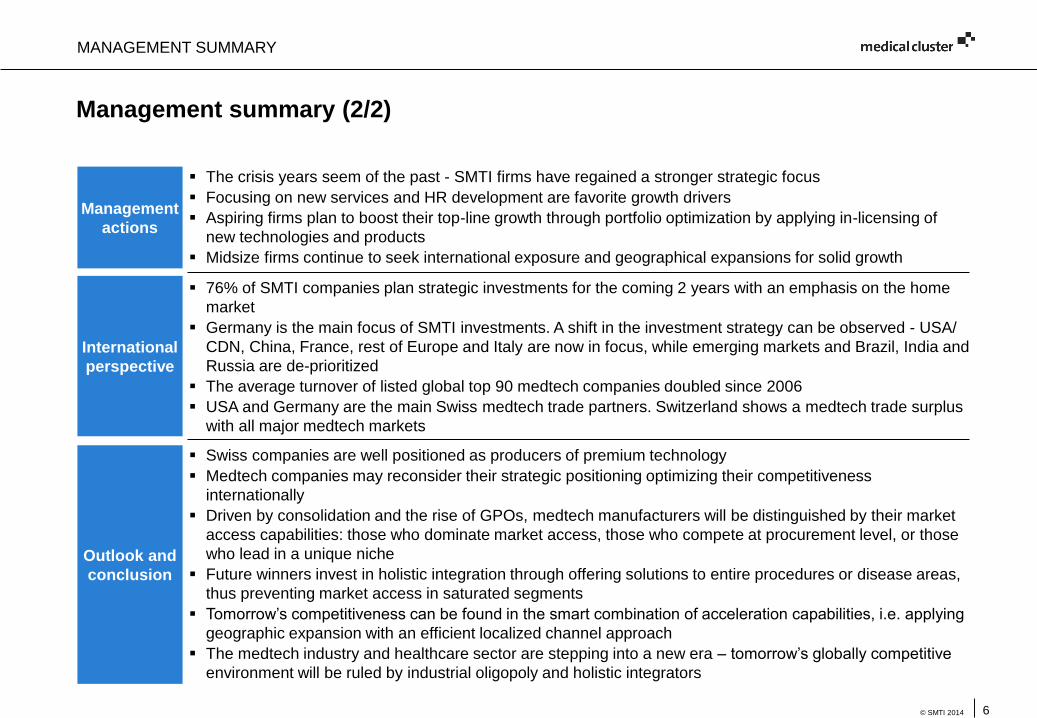
76% of SMTI companies plan strategic investments for the coming 2 years with an emphasis on the home
market
Germany is the main focus of SMTI investments. A shift in the investment strategy can be observed - USA/
CDN, China, France, rest of Europe and Italy are now in focus, while emerging markets and Brazil, India and
Russia are de-prioritized
The average turnover of listed global top 90 medtech companies doubled since 2006
USA and Germany are the main Swiss medtech trade partners. Switzerland shows a medtech trade surplus
with all major medtech markets
Swiss companies are well positioned as producers of premium technology
Medtech companies may reconsider their strategic positioning optimizing their competitiveness
internationally
Driven by consolidation and the rise of GPOs, medtech manufacturers will be distinguished by their market
access capabilities: those who dominate market access, those who compete at procurement level, or those
who lead in a unique niche
Future winners invest in holistic integration through offering solutions to entire procedures or disease areas,
thus preventing market access in saturated segments
Tomorrow’s competitiveness can be found in the smart combination of acceleration capabilities, i.e. applying
geographic expansion with an efficient localized channel approach
The medtech industry and healthcare sector are stepping into a new era – tomorrow’s globally competitive
environment will be ruled by industrial oligopoly and holistic integrators
Management
actions
Outlook and
conclusion
International
perspective
The crisis years seem of the past - SMTI firms have regained a stronger strategic focus
Focusing on new services and HR development are favorite growth drivers
Aspiring firms plan to boost their top-line growth through portfolio optimization by applying in-licensing of
new technologies and products
Midsize firms continue to seek international exposure and geographical expansions for solid growth
7© SMTI 2014
Key facts about the Swiss medical technology industry (SMTI)1)
MANAGEMENT SUMMARY
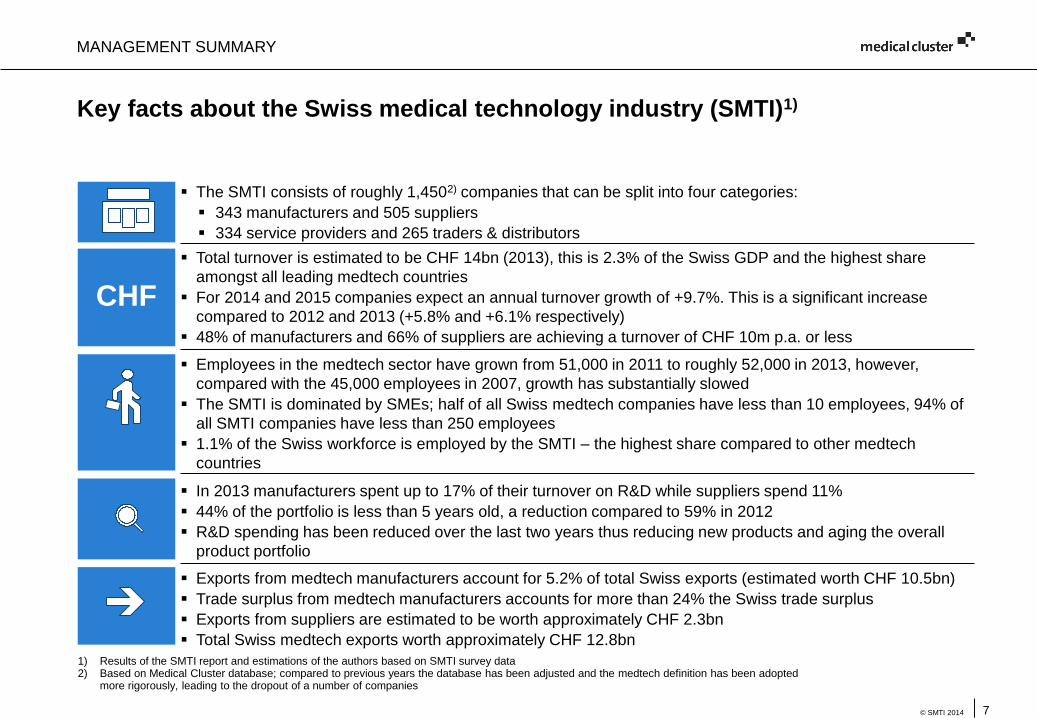
Employees in the medtech sector have grown from 51,000 in 2011 to roughly 52,000 in 2013, however,
compared with the 45,000 employees in 2007, growth has substantially slowed
The SMTI is dominated by SMEs; half of all Swiss medtech companies have less than 10 employees, 94% of
all SMTI companies have less than 250 employees
1.1% of the Swiss workforce is employed by the SMTI – the highest share compared to other medtech
countries
The SMTI consists of roughly 1,4502) companies that can be split into four categories:
343 manufacturers and 505 suppliers
334 service providers and 265 traders & distributors
Total turnover is estimated to be CHF 14bn (2013), this is 2.3% of the Swiss GDP and the highest share
amongst all leading medtech countries
For 2014 and 2015 companies expect an annual turnover growth of +9.7%. This is a significant increase
compared to 2012 and 2013 (+5.8% and +6.1% respectively)
48% of manufacturers and 66% of suppliers are achieving a turnover of CHF 10m p.a. or less
1) Results of the SMTI report and estimations of the authors based on SMTI survey data 2) Based on Medical Cluster database; compared to previous years the database has been adjusted and the medtech definition has been adopted
more rigorously, leading to the dropout of a number of companies
In 2013 manufacturers spent up to 17% of their turnover on R&D while suppliers spend 11%
44% of the portfolio is less than 5 years old, a reduction compared to 59% in 2012
R&D spending has been reduced over the last two years thus reducing new products and aging the overall
product portfolio
Exports from medtech manufacturers account for 5.2% of total Swiss exports (estimated worth CHF 10.5bn)
Trade surplus from medtech manufacturers accounts for more than 24% the Swiss trade surplus
Exports from suppliers are estimated to be worth approximately CHF 2.3bn
Total Swiss medtech exports worth approximately CHF 12.8bn
CHF
A. Profile of the SMTI
9© SMTI 2014
Key points
A PROFILE OF THE SMTI
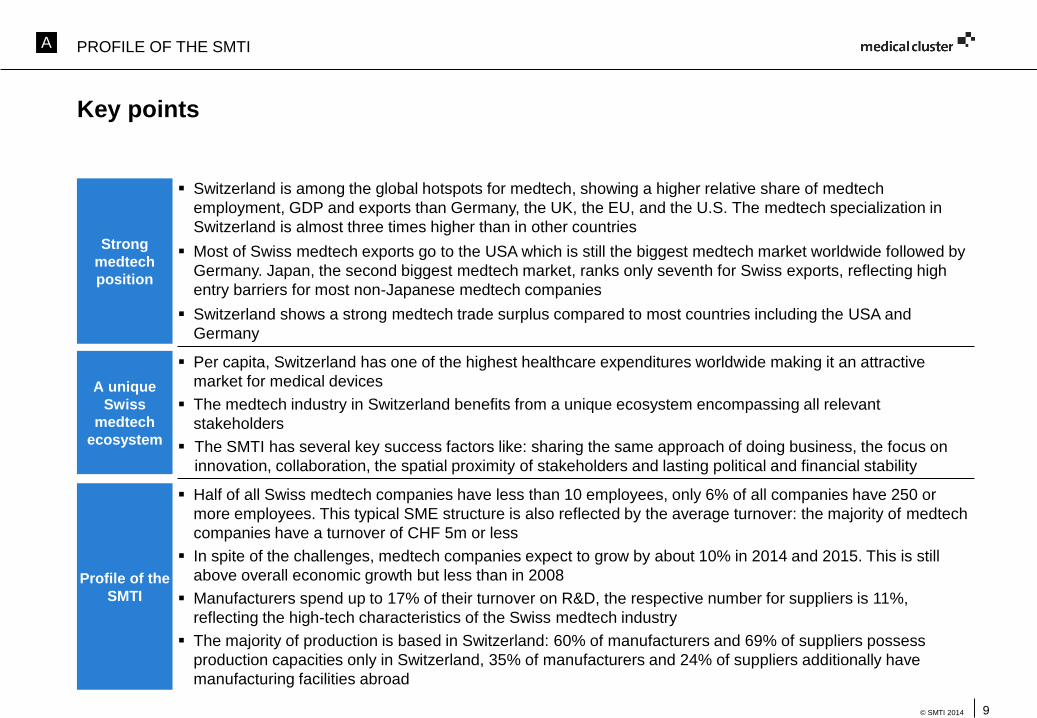
Half of all Swiss medtech companies have less than 10 employees, only 6% of all companies have 250 or
more employees. This typical SME structure is also reflected by the average turnover: the majority of medtech
companies have a turnover of CHF 5m or less
In spite of the challenges, medtech companies expect to grow by about 10% in 2014 and 2015. This is still
above overall economic growth but less than in 2008
Manufacturers spend up to 17% of their turnover on R&D, the respective number for suppliers is 11%,
reflecting the high-tech characteristics of the Swiss medtech industry
The majority of production is based in Switzerland: 60% of manufacturers and 69% of suppliers possess
production capacities only in Switzerland, 35% of manufacturers and 24% of suppliers additionally have
manufacturing facilities abroad
Profile of the
SMTI
Per capita, Switzerland has one of the highest healthcare expenditures worldwide making it an attractive
market for medical devices
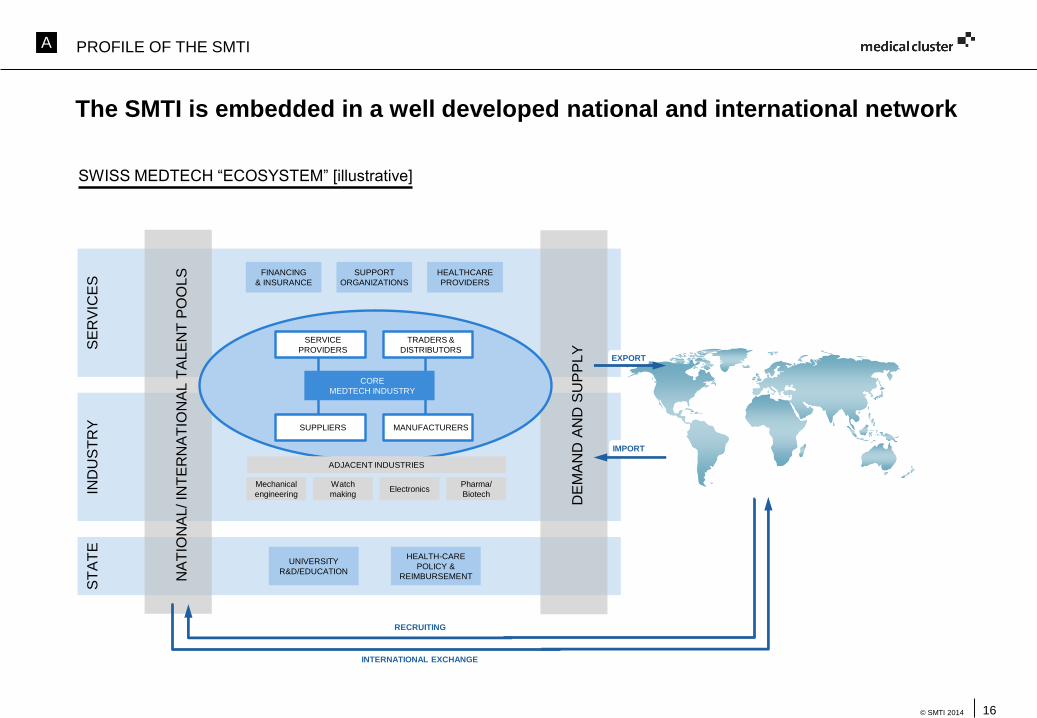
The medtech industry in Switzerland benefits from a unique ecosystem encompassing all relevant
stakeholders
The SMTI has several key success factors like: sharing the same approach of doing business, the focus on
innovation, collaboration, the spatial proximity of stakeholders and lasting political and financial stability
A unique
Swiss
medtech
ecosystem
Switzerland is among the global hotspots for medtech, showing a higher relative share of medtech
employment, GDP and exports than Germany, the UK, the EU, and the U.S. The medtech specialization in
Switzerland is almost three times higher than in other countries
Most of Swiss medtech exports go to the USA which is still the biggest medtech market worldwide followed by
Germany. Japan, the second biggest medtech market, ranks only seventh for Swiss exports, reflecting high
entry barriers for most non-Japanese medtech companies
Switzerland shows a strong medtech trade surplus compared to most countries including the USA and
Germany
Strong
medtech
position
10© SMTI 2014
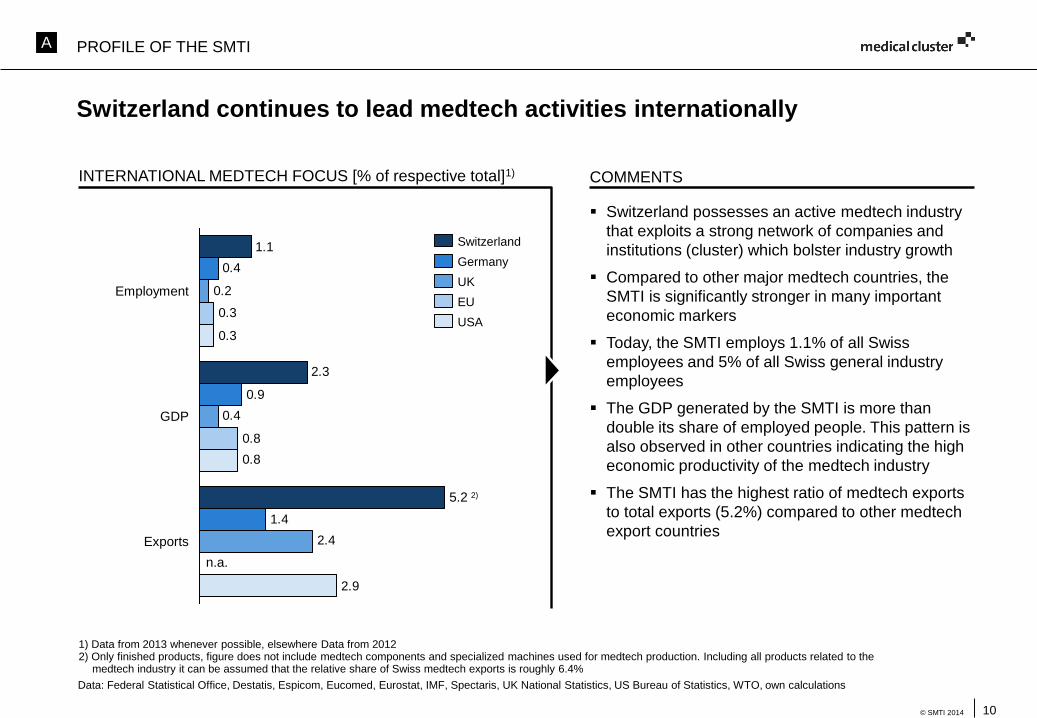
Switzerland continues to lead medtech activities internationally
1.1
2.3
1.4
0.9
0.4
2.4
0.4
0.2
0.8
0.3
2.9
0.8
0.3
Exports
5.2 2)
GDP
Employment
USA
UK
Germany
EU
Switzerland
Switzerland possesses an active medtech industry
that exploits a strong network of companies and
institutions (cluster) which bolster industry growth
Compared to other major medtech countries, the
SMTI is significantly stronger in many important
economic markers
Today, the SMTI employs 1.1% of all Swiss
employees and 5% of all Swiss general industry
employees
The GDP generated by the SMTI is more than
double its share of employed people. This pattern is
also observed in other countries indicating the high
economic productivity of the medtech industry
The SMTI has the highest ratio of medtech exports
to total exports (5.2%) compared to other medtech
export countries
1) Data from 2013 whenever possible, elsewhere Data from 20122) Only finished products, figure does not include medtech components and specialized machines used for medtech production. Including all products related to the
medtech industry it can be assumed that the relative share of Swiss medtech exports is roughly 6.4%
n.a.
INTERNATIONAL MEDTECH FOCUS [% of respective total]1) COMMENTS
Data: Federal Statistical Office, Destatis, Espicom, Eucomed, Eurostat, IMF, Spectaris, UK National Statistics, US Bureau of Statistics, WTO, own calculations
A PROFILE OF THE SMTI
11© SMTI 2014
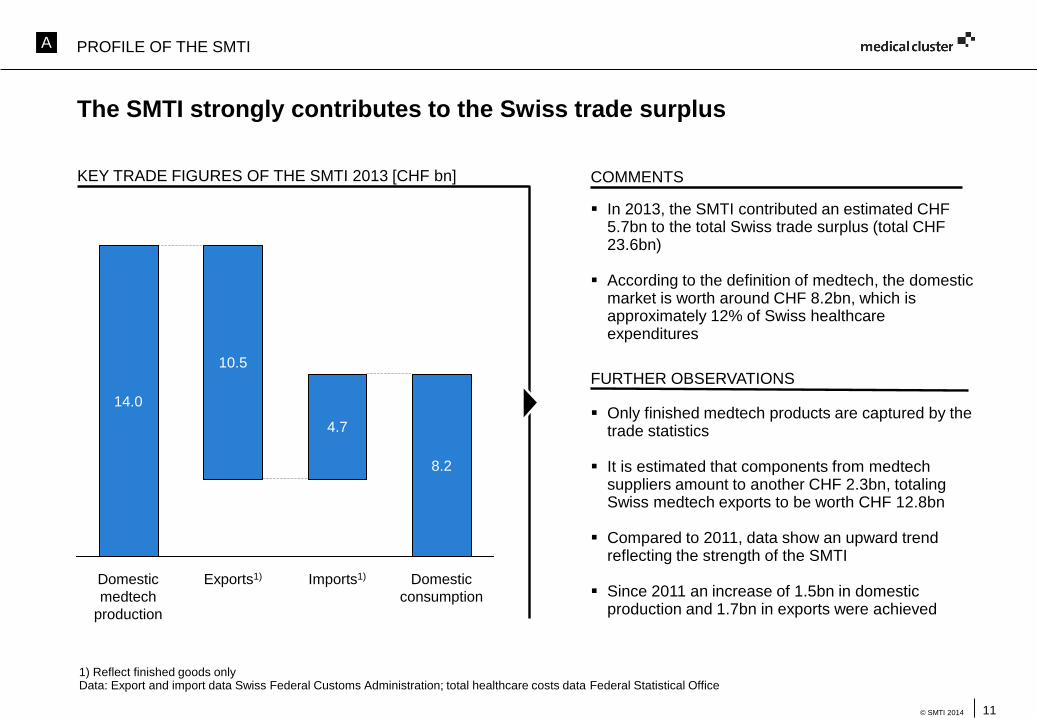
The SMTI strongly contributes to the Swiss trade surplus
KEY TRADE FIGURES OF THE SMTI 2013 [CHF bn] COMMENTS
1) Reflect finished goods onlyData: Export and import data Swiss Federal Customs Administration; total healthcare costs data Federal Statistical Office
In 2013, the SMTI contributed an estimated CHF 5.7bn to the total Swiss trade surplus (total CHF 23.6bn)
According to the definition of medtech, the domestic market is worth around CHF 8.2bn, which is approximately 12% of Swiss healthcare expenditures
FURTHER OBSERVATIONS
14.0
Domestic
consumption
Imports1)
4.7
10.5
Domestic
medtech
production
Exports1)
8.2
Only finished medtech products are captured by the trade statistics
It is estimated that components from medtechsuppliers amount to another CHF 2.3bn, totaling Swiss medtech exports to be worth CHF 12.8bn
Compared to 2011, data show an upward trend reflecting the strength of the SMTI
Since 2011 an increase of 1.5bn in domestic production and 1.7bn in exports were achieved
A PROFILE OF THE SMTI
12© SMTI 2014
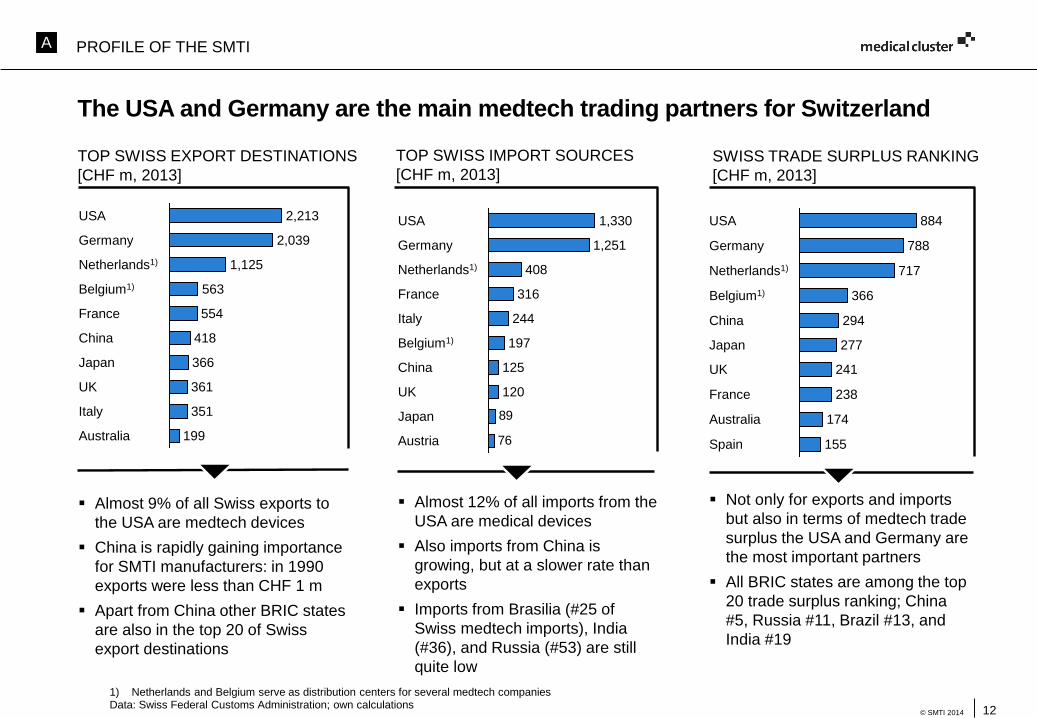
The USA and Germany are the main medtech trading partners for Switzerland
Data: Swiss Federal Customs Administration; own calculations
TOP SWISS EXPORT DESTINATIONS
[CHF m, 2013]
TOP SWISS IMPORT SOURCES
[CHF m, 2013]
76
89
1,330
Germany
120
197
125
244
Netherlands1)
1,251
Italy
Japan
China
Belgium1)
France 316
Austria
408
UK
USA
Almost 9% of all Swiss exports to
the USA are medtech devices
China is rapidly gaining importance
for SMTI manufacturers: in 1990
exports were less than CHF 1 m
Apart from China other BRIC states
are also in the top 20 of Swiss
export destinations
1) Netherlands and Belgium serve as distribution centers for several medtech companies
Almost 12% of all imports from the
USA are medical devices
Also imports from China is
growing, but at a slower rate than
exports
Imports from Brasilia (#25 of
Swiss medtech imports), India
(#36), and Russia (#53) are still
quite low
SWISS TRADE SURPLUS RANKING
[CHF m, 2013]
Australia
238
241
Japan
Spain
277
China 294
174
Belgium1) 366
UK
Netherlands1)
France
155
Germany
884
788
717
USA
Not only for exports and imports
but also in terms of medtech trade
surplus the USA and Germany are
the most important partners
All BRIC states are among the top
20 trade surplus ranking; China
#5, Russia #11, Brazil #13, and
India #19
Italy
Australia 199
Netherlands1)
Belgium1)
USA
563
351
2,213
418
France
1,125
UK
China
361
Japan
554
Germany 2,039
366
A PROFILE OF THE SMTI
13© SMTI 2014
534
194135
826637
243183
883739
280
-103-49-48
1,330
2,213
1,106
1,885
1,146
Trade
surplus
Import
Export 1990 1995 2000 2005 2010 2013
USA
Germany
918741
527
936
652482443
788
442501
26625984
1,251
2,039
1,437
1,726
1,284
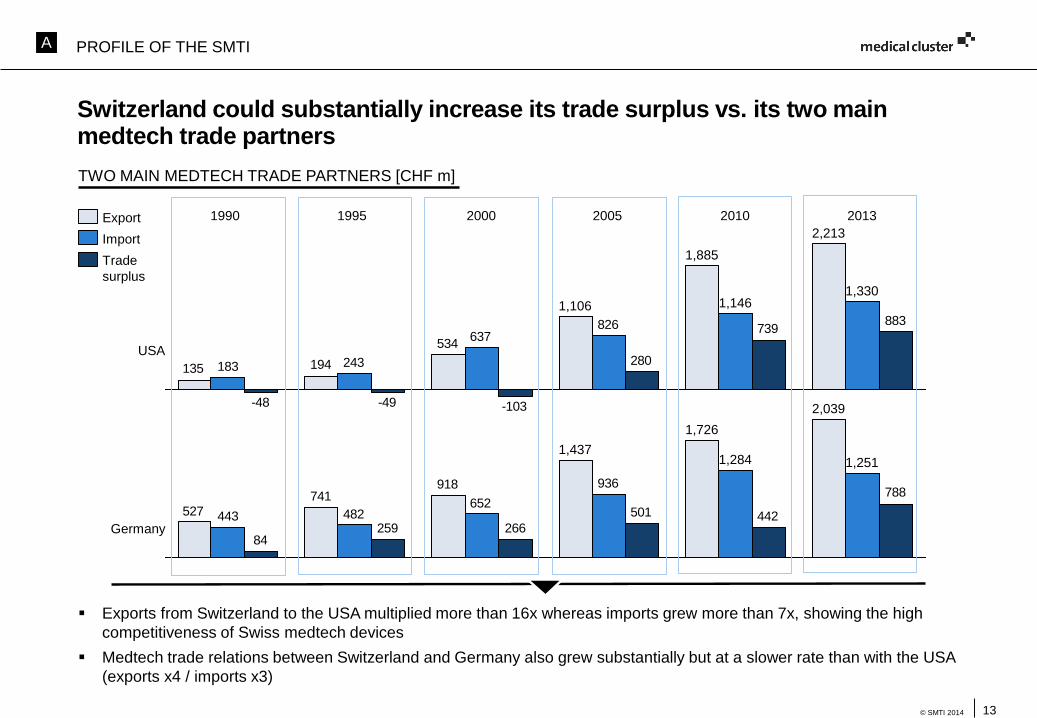
Exports from Switzerland to the USA multiplied more than 16x whereas imports grew more than 7x, showing the high
competitiveness of Swiss medtech devices
Medtech trade relations between Switzerland and Germany also grew substantially but at a slower rate than with the USA
(exports x4 / imports x3)
Switzerland could substantially increase its trade surplus vs. its two main medtech trade partners
TWO MAIN MEDTECH TRADE PARTNERS [CHF m]
A PROFILE OF THE SMTI
14© SMTI 2014
1990 1995 2000 2005 2010 2013
Brazil
Russia
India
China
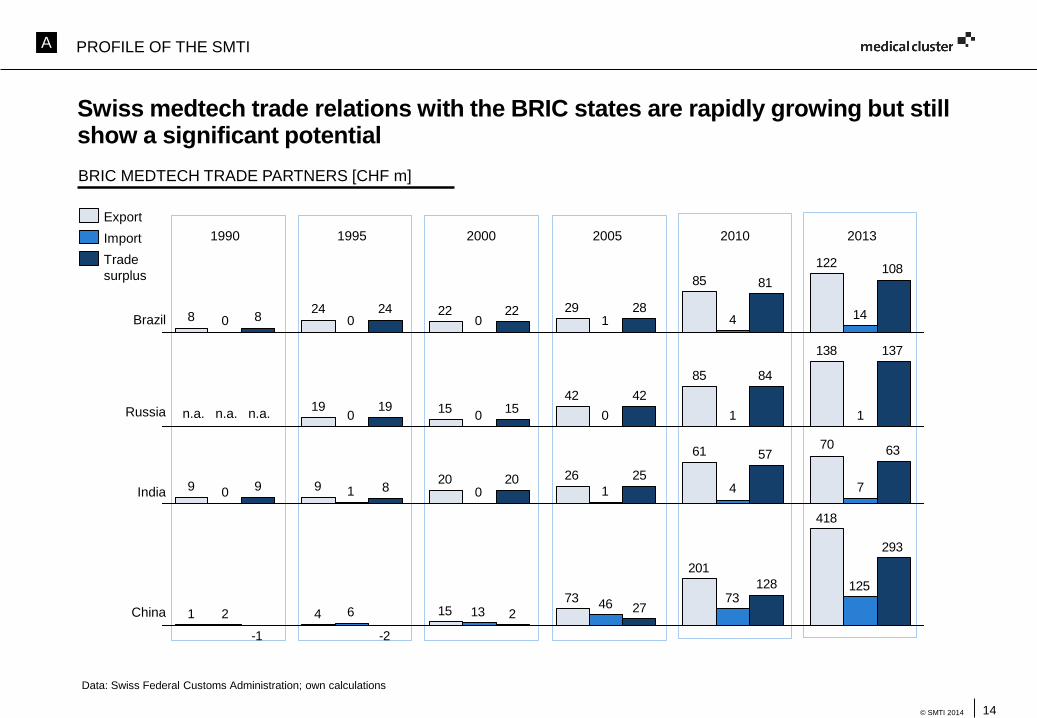
Swiss medtech trade relations with the BRIC states are rapidly growing but still show a significant potential
138
85
421519
11000
137
84
421519
7061
262099 741010
6357
252089
418
201
731541
1257346
1362
293
128
272
-2-1
122
85
2922248 1441000
10881
2822248
Trade
surplus
Import
Export
BRIC MEDTECH TRADE PARTNERS [CHF m]
n.a. n.a. n.a.
Data: Swiss Federal Customs Administration; own calculations
A PROFILE OF THE SMTI
15© SMTI 2014
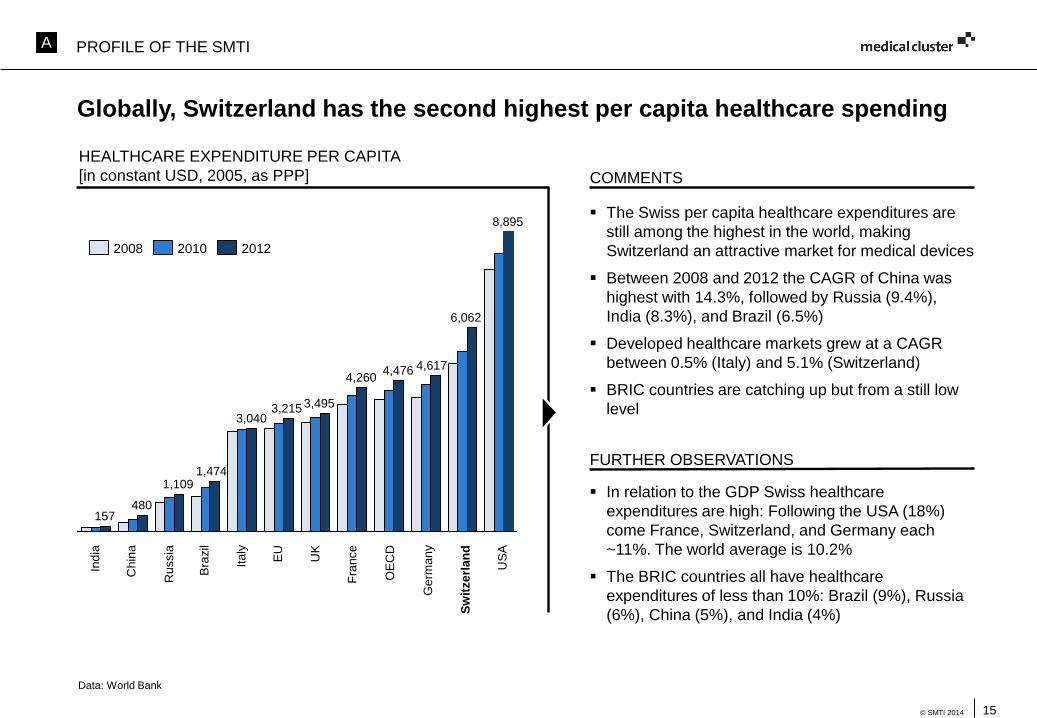
Globally, Switzerland has the second highest per capita healthcare spending
HEALTHCARE EXPENDITURE PER CAPITA
[in constant USD, 2005, as PPP] COMMENTS
The Swiss per capita healthcare expenditures are
still among the highest in the world, making
Switzerland an attractive market for medical devices
Between 2008 and 2012 the CAGR of China was
highest with 14.3%, followed by Russia (9.4%),
India (8.3%), and Brazil (6.5%)
Developed healthcare markets grew at a CAGR
between 0.5% (Italy) and 5.1% (Switzerland)
BRIC countries are catching up but from a still low
level
Data: World Bank
In relation to the GDP Swiss healthcare
expenditures are high: Following the USA (18%)
come France, Switzerland, and Germany each
~11%. The world average is 10.2%
The BRIC countries all have healthcare
expenditures of less than 10%: Brazil (9%), Russia
(6%), China (5%), and India (4%)
FURTHER OBSERVATIONS
8,895
4,2604,476 4,617
6,062
480
1,4741,109
3,215 3,495
3,040
157
20122008 2010
US
A
Sw
itze
rla
nd
Ge
rma
ny
OE
CD
Fra
nce
UK
EU
Ita
ly
Bra
zil
Ru
ssia
Ch
ina
Ind
ia
A PROFILE OF THE SMTI
16© SMTI 2014
ST
AT
E
Mechanical
engineering
UNIVERSITY
R&D/EDUCATION
HEALTHCARE
PROVIDERS
ElectronicsWatch making
ADJACENT INDUSTRIES
FINANCING
& INSURANCE
SUPPORT
ORGANIZATIONS
IND
US
TR
YS
ER
VIC
ES
NA
TIO
NA
L/ IN
TE
RN
AT
ION
AL
TA
LE
NT
PO
OL
S
DE
MA
ND
AN
D S
UP
PL
Y
HEALTH-CARE
POLICY &
REIMBURSEMENT
CORE
MEDTECH INDUSTRY
TRADERS &
DISTRIBUTORS
SERVICE
PROVIDERS
MANUFACTURERSSUPPLIERS
The SMTI is embedded in a well developed national and international network
SWISS MEDTECH “ECOSYSTEM” [illustrative]
Mechanical
engineeringElectronics
Watch
making
ADJACENT INDUSTRIES
Pharma/
Biotech
IMPORT
EXPORT
INTERNATIONAL EXCHANGE
HEALTHCARE
PROVIDERS
FINANCING
& INSURANCE
SUPPORT
ORGANIZATIONS
RECRUITING
A PROFILE OF THE SMTI
17© SMTI 2014
DOMESTICKEY SUCCESS
FACTORS
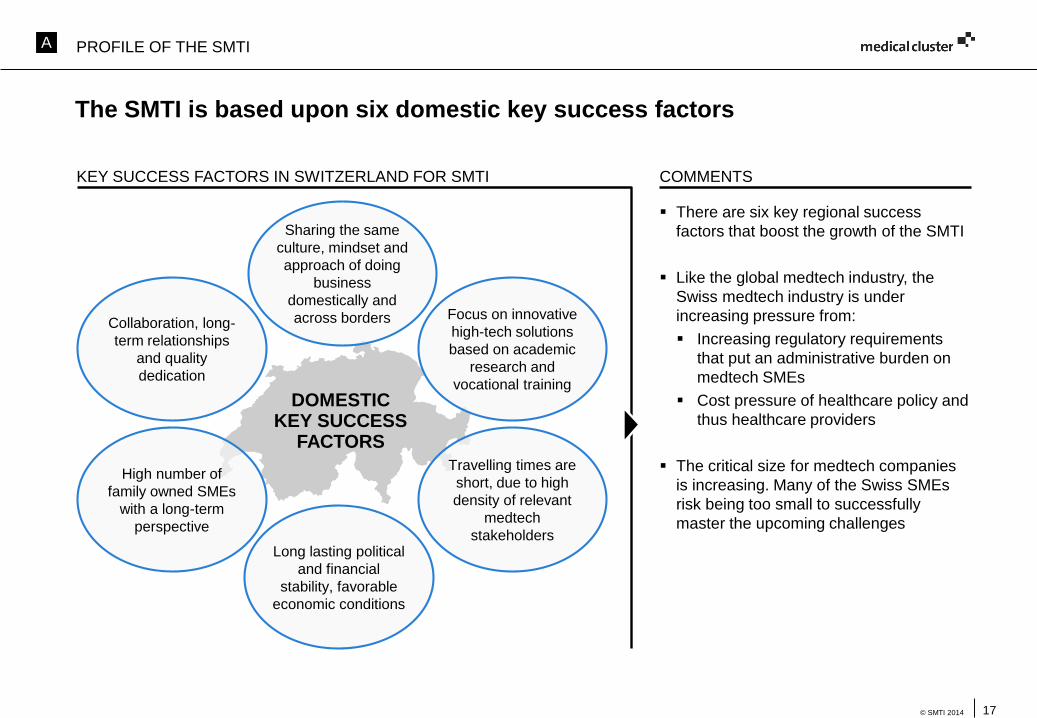
The SMTI is based upon six domestic key success factors
KEY SUCCESS FACTORS IN SWITZERLAND FOR SMTI COMMENTS
There are six key regional success
factors that boost the growth of the SMTI
Like the global medtech industry, the
Swiss medtech industry is under
increasing pressure from:
Increasing regulatory requirements
that put an administrative burden on
medtech SMEs
Cost pressure of healthcare policy and
thus healthcare providers
The critical size for medtech companies
is increasing. Many of the Swiss SMEs
risk being too small to successfully
master the upcoming challenges
Sharing the same
culture, mindset and
approach of doing
business
domestically and
across bordersCollaboration, long-
term relationships
and quality
dedication
Travelling times are
short, due to high
density of relevant
medtech
stakeholders
High number of
family owned SMEs
with a long-term
perspective
Focus on innovative
high-tech solutions
based on academic
research and
vocational training
Long lasting political
and financial
stability, favorable
economic conditions
A PROFILE OF THE SMTI
18© SMTI 2014
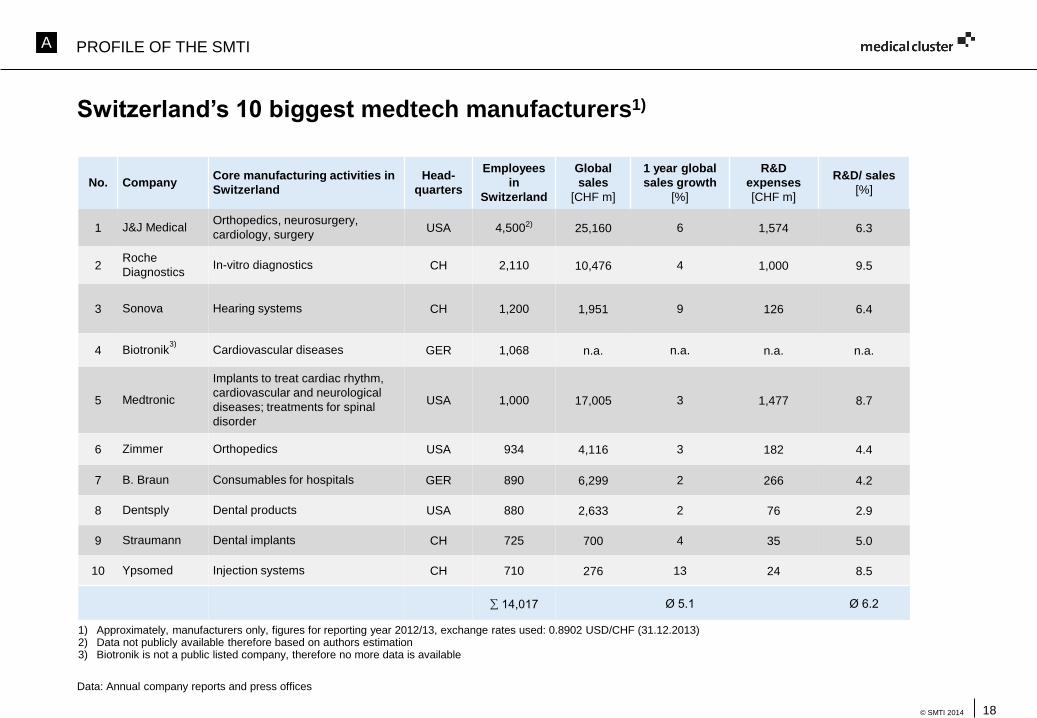
Switzerland’s 10 biggest medtech manufacturers1)
Data: Annual company reports and press offices
1) Approximately, manufacturers only, figures for reporting year 2012/13, exchange rates used: 0.8902 USD/CHF (31.12.2013)2) Data not publicly available therefore based on authors estimation3) Biotronik is not a public listed company, therefore no more data is available
No. CompanyCore manufacturing activities in
Switzerland
Head-
quarters
Employees
in
Switzerland
Global
sales
[CHF m]
1 year global
sales growth
[%]
R&D
expenses
[CHF m]
R&D/ sales
[%]
1 J&J MedicalOrthopedics, neurosurgery,
cardiology, surgeryUSA 4,5002) 25,160 6 1,574 6.3
2Roche
DiagnosticsIn-vitro diagnostics CH 2,110 10,476 4 1,000 9.5
3 Sonova Hearing systems CH 1,200 1,951 9 126 6.4
4 Biotronik3)
Cardiovascular diseases GER 1,068 n.a. n.a. n.a. n.a.
5 Medtronic
Implants to treat cardiac rhythm,
cardiovascular and neurological
diseases; treatments for spinal
disorder
USA 1,000 17,005 3 1,477 8.7
6 Zimmer Orthopedics USA 934 4,116 3 182 4.4
7 B. Braun Consumables for hospitals GER 890 6,299 2 266 4.2
8 Dentsply Dental products USA 880 2,633 2 76 2.9
9 Straumann Dental implants CH 725 700 4 35 5.0
10 Ypsomed Injection systems CH 710 276 13 24 8.5
∑ 14,017 Ø 5.1 Ø 6.2
A PROFILE OF THE SMTI
19© SMTI 2014
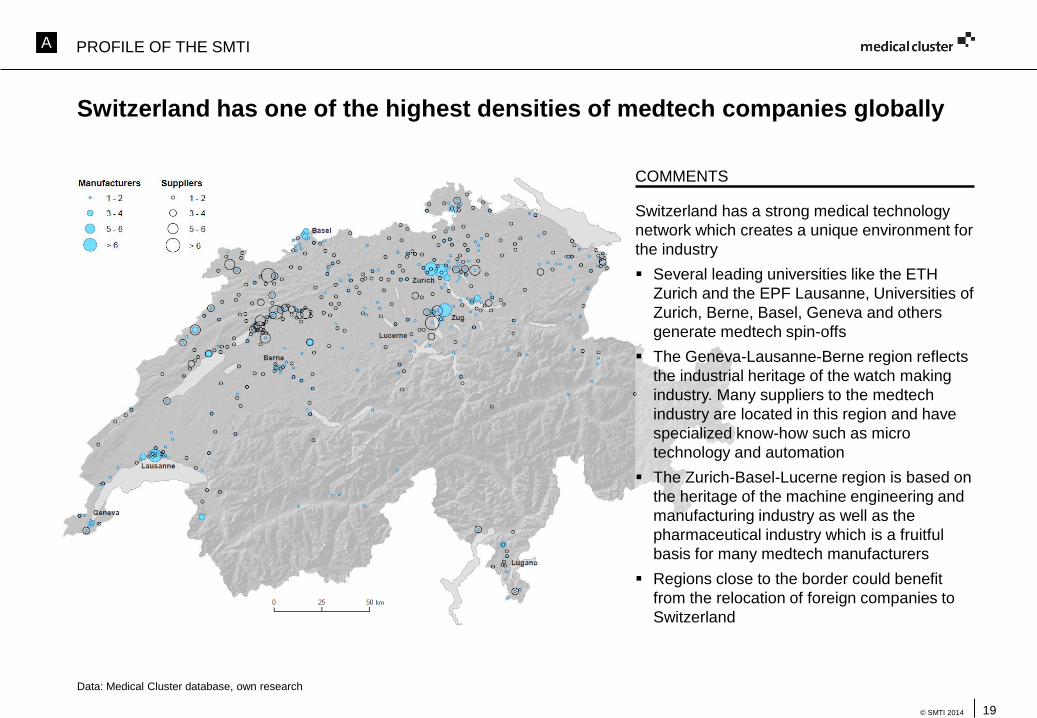
Switzerland has one of the highest densities of medtech companies globally
Switzerland has a strong medical technology
network which creates a unique environment for
the industry
Several leading universities like the ETH
Zurich and the EPF Lausanne, Universities of
Zurich, Berne, Basel, Geneva and others
generate medtech spin-offs
The Geneva-Lausanne-Berne region reflects
the industrial heritage of the watch making
industry. Many suppliers to the medtech
industry are located in this region and have
specialized know-how such as micro
technology and automation
The Zurich-Basel-Lucerne region is based on
the heritage of the machine engineering and
manufacturing industry as well as the
pharmaceutical industry which is a fruitful
basis for many medtech manufacturers
Regions close to the border could benefit
from the relocation of foreign companies to
Switzerland
COMMENTS
Data: Medical Cluster database, own research
A PROFILE OF THE SMTI
20© SMTI 2014
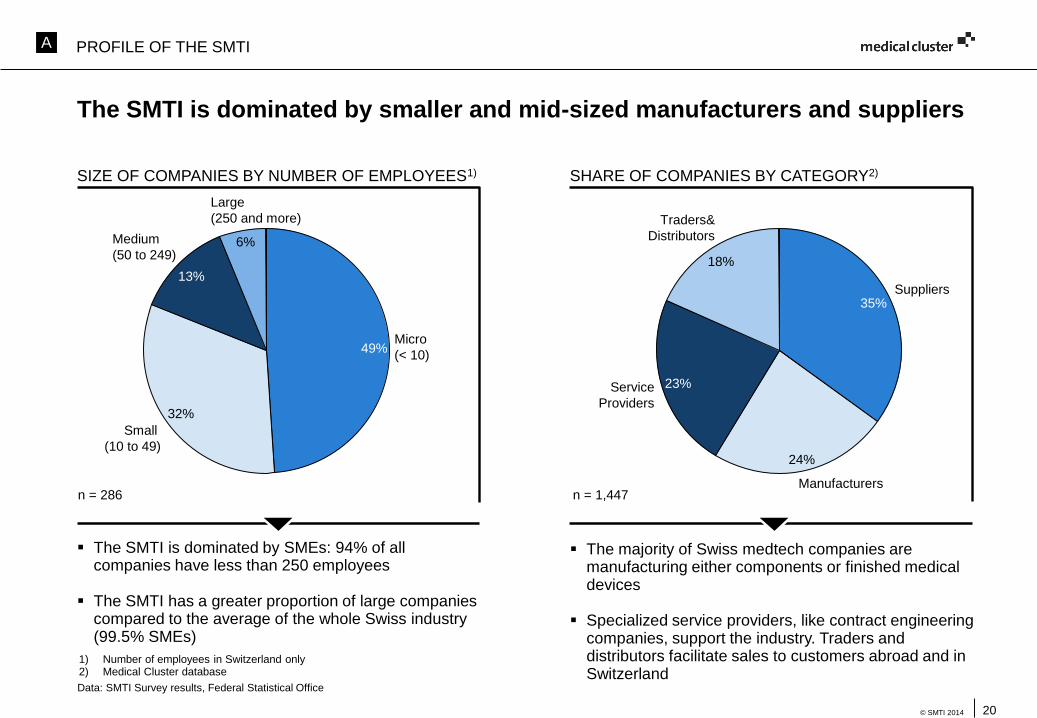
The SMTI is dominated by smaller and mid-sized manufacturers and suppliers
SIZE OF COMPANIES BY NUMBER OF EMPLOYEES1)
The SMTI is dominated by SMEs: 94% of all companies have less than 250 employees
The SMTI has a greater proportion of large companies compared to the average of the whole Swiss industry (99.5% SMEs)
The majority of Swiss medtech companies are manufacturing either components or finished medical devices
Specialized service providers, like contract engineering companies, support the industry. Traders and distributors facilitate sales to customers abroad and in Switzerland
SHARE OF COMPANIES BY CATEGORY2)
14%
52%
n = 286
18%
35%Suppliers
Traders&
Distributors
24%
23%
Manufacturers
Service
Providers
6%
32%
13%
49%
Medium
(50 to 249)
Large
(250 and more)
Small
(10 to 49)
Micro
(< 10)
n = 1,447
1) Number of employees in Switzerland only2) Medical Cluster database
Data: SMTI Survey results, Federal Statistical Office
A PROFILE OF THE SMTI
21© SMTI 2014
10,000
5,000
50,000
20,000
15,000
40,000
35,000
0
25,000
45,000
30,000
55,000
Number of
employees
0
5
10
15
20
25
30
2
7
12
2009
21
54
15
18
4
11
2007 2011
Average growth of
employees in %
2013
30
1) Data: Federal Statistical Office
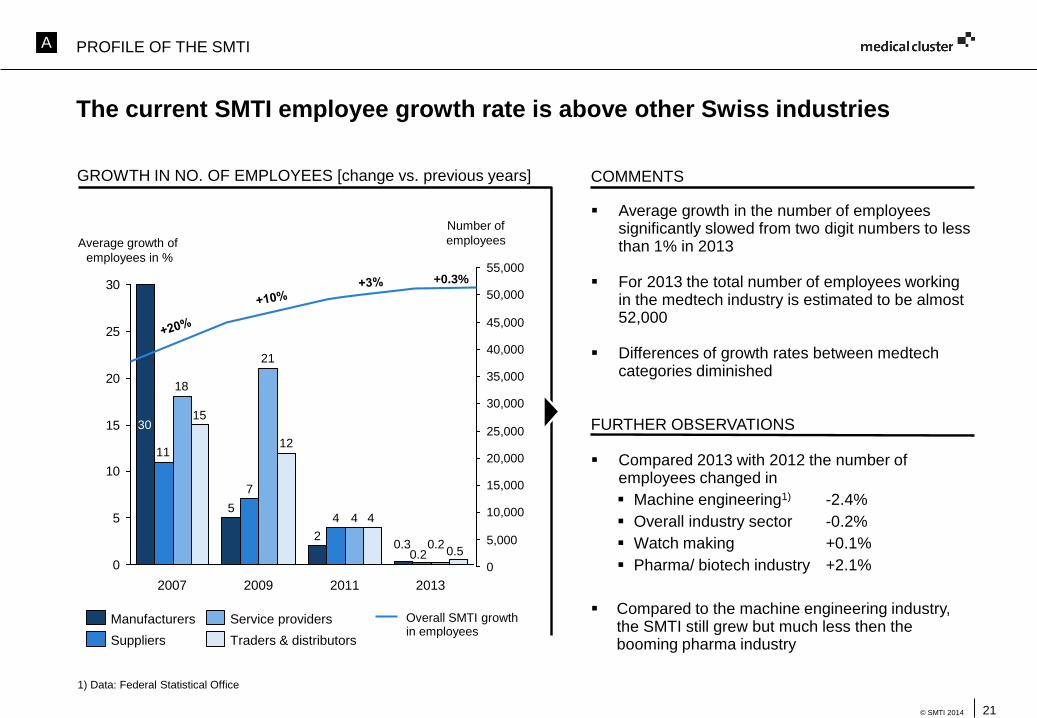
The current SMTI employee growth rate is above other Swiss industries
GROWTH IN NO. OF EMPLOYEES [change vs. previous years]
Traders & distributors
Service providers
Suppliers
Manufacturers
COMMENTS
Overall SMTI growthin employees
Average growth in the number of employees significantly slowed from two digit numbers to less than 1% in 2013
For 2013 the total number of employees working in the medtech industry is estimated to be almost 52,000
Differences of growth rates between medtechcategories diminished
Compared 2013 with 2012 the number of employees changed in
Machine engineering1) -2.4%
Overall industry sector -0.2%
Watch making +0.1%
Pharma/ biotech industry +2.1%
Compared to the machine engineering industry, the SMTI still grew but much less then the booming pharma industry
FURTHER OBSERVATIONS
+0.3%
0.30.2
0.20.5
4
A PROFILE OF THE SMTI
22© SMTI 2014
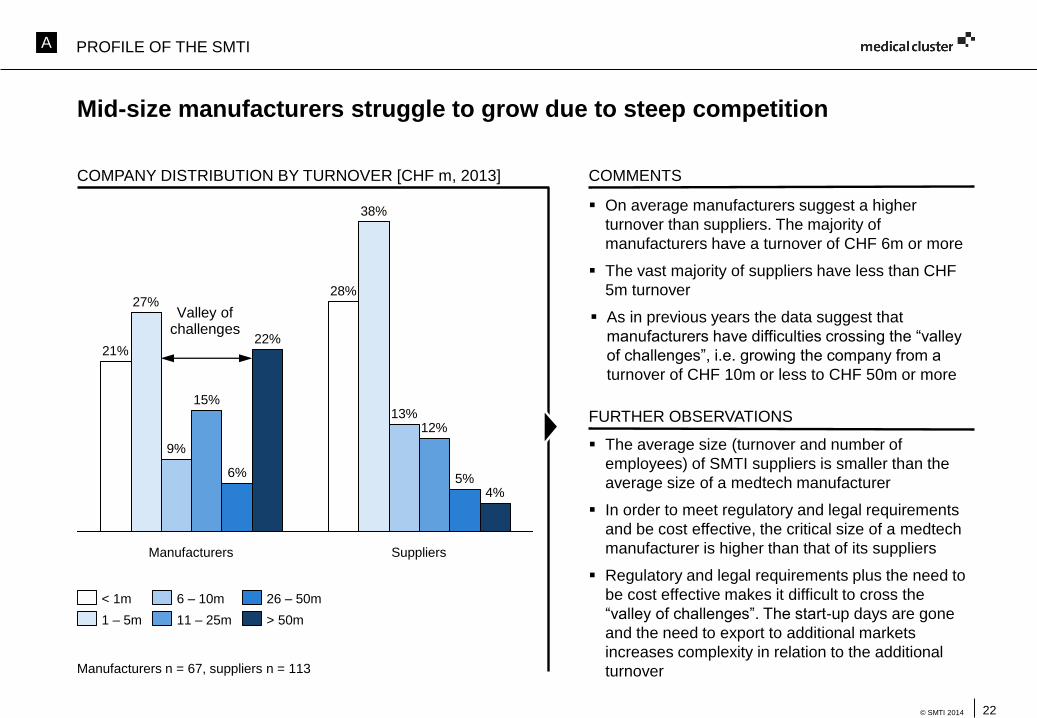
On average manufacturers suggest a higher
turnover than suppliers. The majority of
manufacturers have a turnover of CHF 6m or more
The vast majority of suppliers have less than CHF
5m turnover
As in previous years the data suggest that
manufacturers have difficulties crossing the “valley
of challenges”, i.e. growing the company from a
turnover of CHF 10m or less to CHF 50m or more
Mid-size manufacturers struggle to grow due to steep competition
COMPANY DISTRIBUTION BY TURNOVER [CHF m, 2013] COMMENTS
FURTHER OBSERVATIONS
22%
Suppliers
4%
38%
28%
12%
5%
13%
Manufacturers
21%
6%
27%
15%
9%
26 – 50m
1 – 5m
< 1m 6 – 10m
> 50m11 – 25m
The average size (turnover and number of
employees) of SMTI suppliers is smaller than the
average size of a medtech manufacturer
In order to meet regulatory and legal requirements
and be cost effective, the critical size of a medtech
manufacturer is higher than that of its suppliers
Regulatory and legal requirements plus the need to
be cost effective makes it difficult to cross the
“valley of challenges”. The start-up days are gone
and the need to export to additional markets
increases complexity in relation to the additional
turnoverManufacturers n = 67, suppliers n = 113
Valley of challenges
A PROFILE OF THE SMTI
23© SMTI 2014
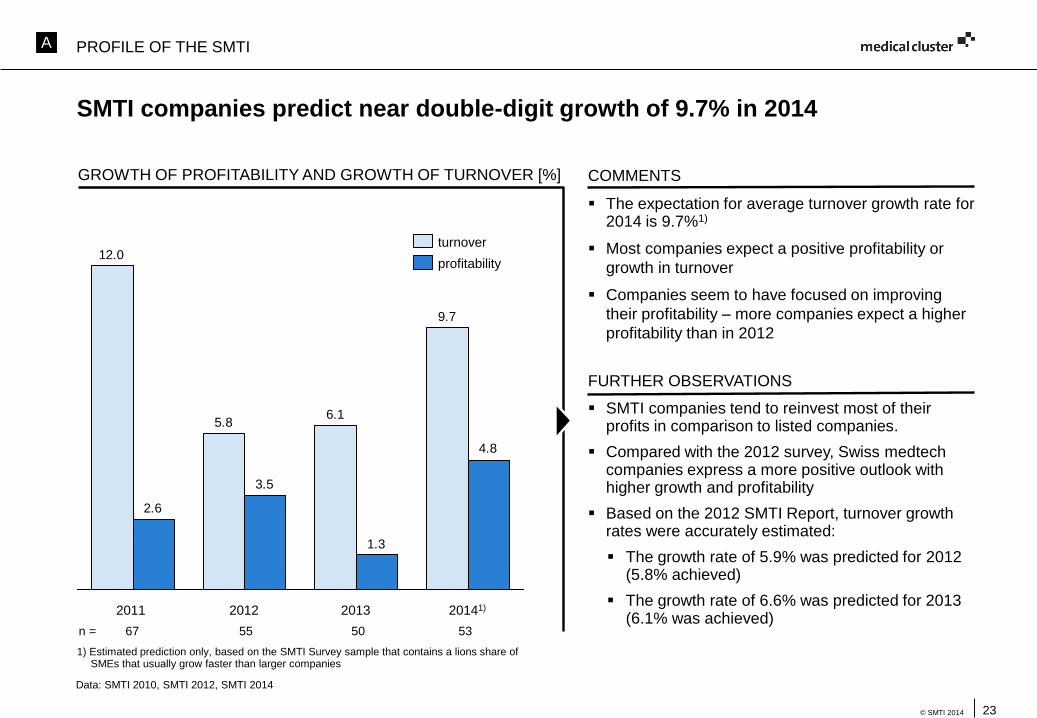
SMTI companies predict near double-digit growth of 9.7% in 2014
GROWTH OF PROFITABILITY AND GROWTH OF TURNOVER [%] COMMENTS
The expectation for average turnover growth rate for 2014 is 9.7%1)
Most companies expect a positive profitability or
growth in turnover
Companies seem to have focused on improving
their profitability – more companies expect a higher
profitability than in 20129.7
6.15.8
12.0
4.8
1.3
3.5
2.6
20122011 20141)2013
1) Estimated prediction only, based on the SMTI Survey sample that contains a lions share of SMEs that usually grow faster than larger companies
FURTHER OBSERVATIONS
SMTI companies tend to reinvest most of their profits in comparison to listed companies.
Compared with the 2012 survey, Swiss medtechcompanies express a more positive outlook with higher growth and profitability
Based on the 2012 SMTI Report, turnover growth rates were accurately estimated:
The growth rate of 5.9% was predicted for 2012 (5.8% achieved)
The growth rate of 6.6% was predicted for 2013 (6.1% was achieved)
n = 67 55 50 53
profitability
turnover
Data: SMTI 2010, SMTI 2012, SMTI 2014
A PROFILE OF THE SMTI
24© SMTI 2014
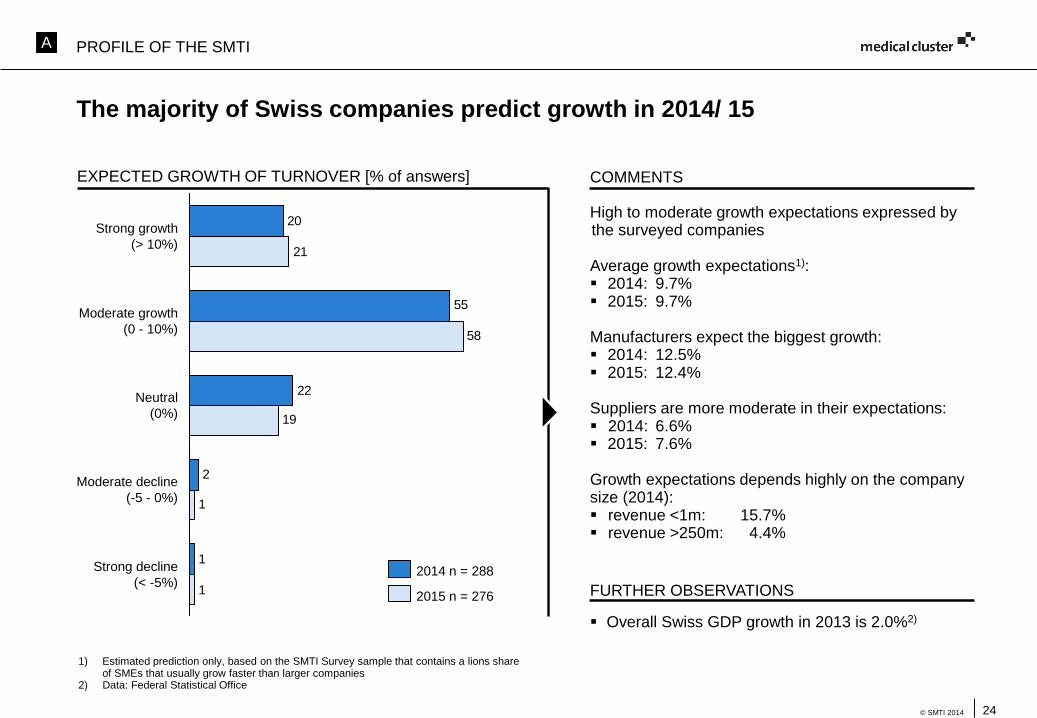
The majority of Swiss companies predict growth in 2014/ 15
EXPECTED GROWTH OF TURNOVER [% of answers]
2014 n = 288
2015 n = 276
20
1
2
22
55
58
1
1
19
21
Strong decline
(< -5%)
Neutral
(0%)
Moderate decline
(-5 - 0%)
Moderate growth
(0 - 10%)
Strong growth
(> 10%)
COMMENTS
High to moderate growth expectations expressed by the surveyed companies
Average growth expectations1): 2014: 9.7% 2015: 9.7%
Manufacturers expect the biggest growth: 2014: 12.5% 2015: 12.4%
Suppliers are more moderate in their expectations: 2014: 6.6% 2015: 7.6%
Growth expectations depends highly on the companysize (2014): revenue <1m: 15.7% revenue >250m: 4.4%
Overall Swiss GDP growth in 2013 is 2.0%2)
FURTHER OBSERVATIONS
1) Estimated prediction only, based on the SMTI Survey sample that contains a lions share of SMEs that usually grow faster than larger companies
2) Data: Federal Statistical Office
A PROFILE OF THE SMTI
25© SMTI 2014
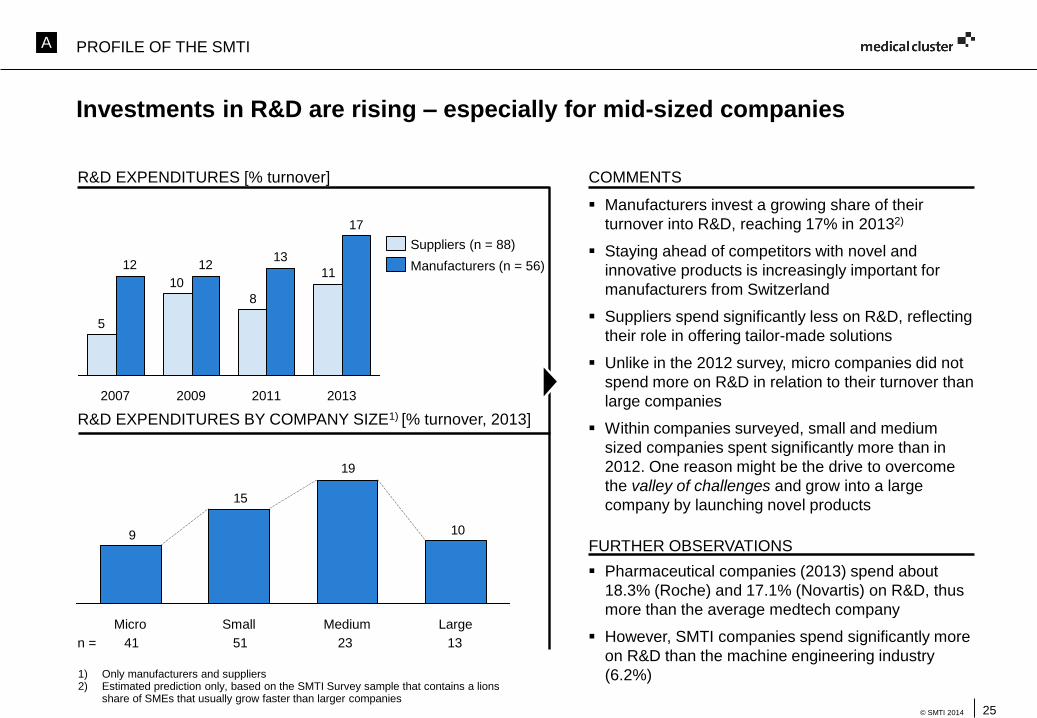
Investments in R&D are rising – especially for mid-sized companies
R&D EXPENDITURES [% turnover] COMMENTS
Manufacturers invest a growing share of their
turnover into R&D, reaching 17% in 20132)
Staying ahead of competitors with novel and
innovative products is increasingly important for
manufacturers from Switzerland
Suppliers spend significantly less on R&D, reflecting
their role in offering tailor-made solutions
Unlike in the 2012 survey, micro companies did not
spend more on R&D in relation to their turnover than
large companies
Within companies surveyed, small and medium
sized companies spent significantly more than in
2012. One reason might be the drive to overcome
the valley of challenges and grow into a large
company by launching novel products
11
8
10
5
17
131212
2007 20112009 2013
Manufacturers (n = 56)
Suppliers (n = 88)
R&D EXPENDITURES BY COMPANY SIZE1) [% turnover, 2013]
10
19
15
9
Medium LargeMicro Small
1) Only manufacturers and suppliers2) Estimated prediction only, based on the SMTI Survey sample that contains a lions
share of SMEs that usually grow faster than larger companies
FURTHER OBSERVATIONS
Pharmaceutical companies (2013) spend about
18.3% (Roche) and 17.1% (Novartis) on R&D, thus
more than the average medtech company
However, SMTI companies spend significantly more
on R&D than the machine engineering industry
(6.2%)
n = 41 51 23 13
A PROFILE OF THE SMTI
26© SMTI 2014
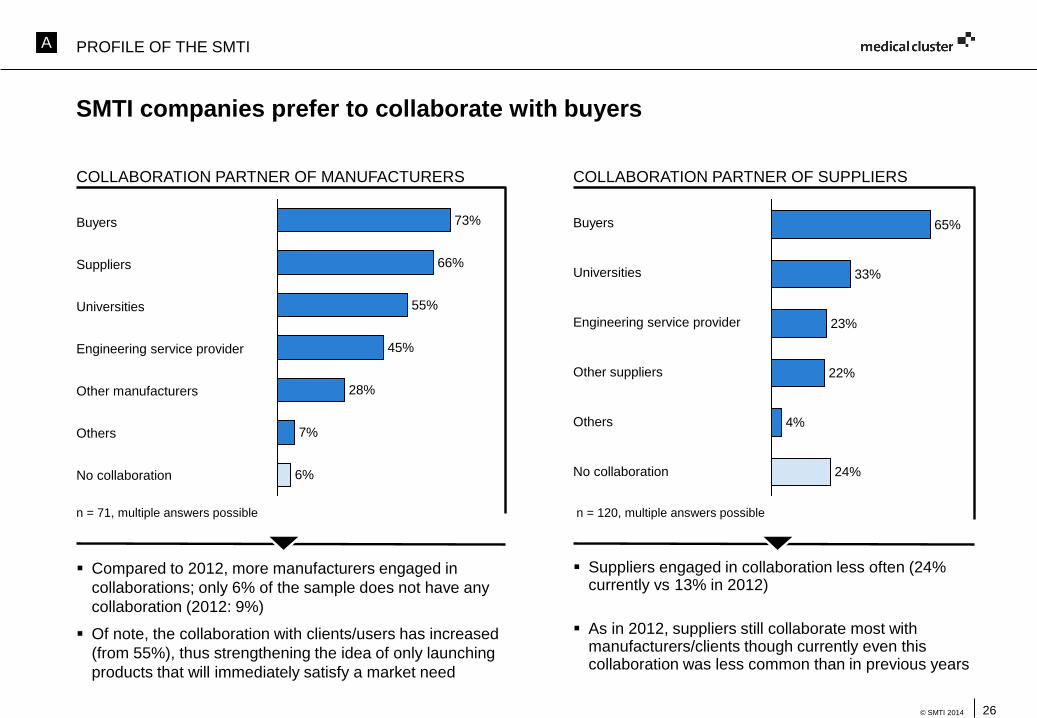
SMTI companies prefer to collaborate with buyers
55%
6%
7%
45%
28%
73%
66%
COLLABORATION PARTNER OF MANUFACTURERS
Compared to 2012, more manufacturers engaged in
collaborations; only 6% of the sample does not have any
collaboration (2012: 9%)
Of note, the collaboration with clients/users has increased
(from 55%), thus strengthening the idea of only launching
products that will immediately satisfy a market need
n = 71, multiple answers possible n = 120, multiple answers possible
24%
4%
23%
22%
33%
65%
COLLABORATION PARTNER OF SUPPLIERS
Suppliers engaged in collaboration less often (24% currently vs 13% in 2012)
As in 2012, suppliers still collaborate most with manufacturers/clients though currently even this collaboration was less common than in previous years
Buyers
Suppliers
Universities
Engineering service provider
Other manufacturers
Others
No collaboration
Buyers
Universities
Engineering service provider
Other suppliers
Others
No collaboration
A PROFILE OF THE SMTI
27© SMTI 2014
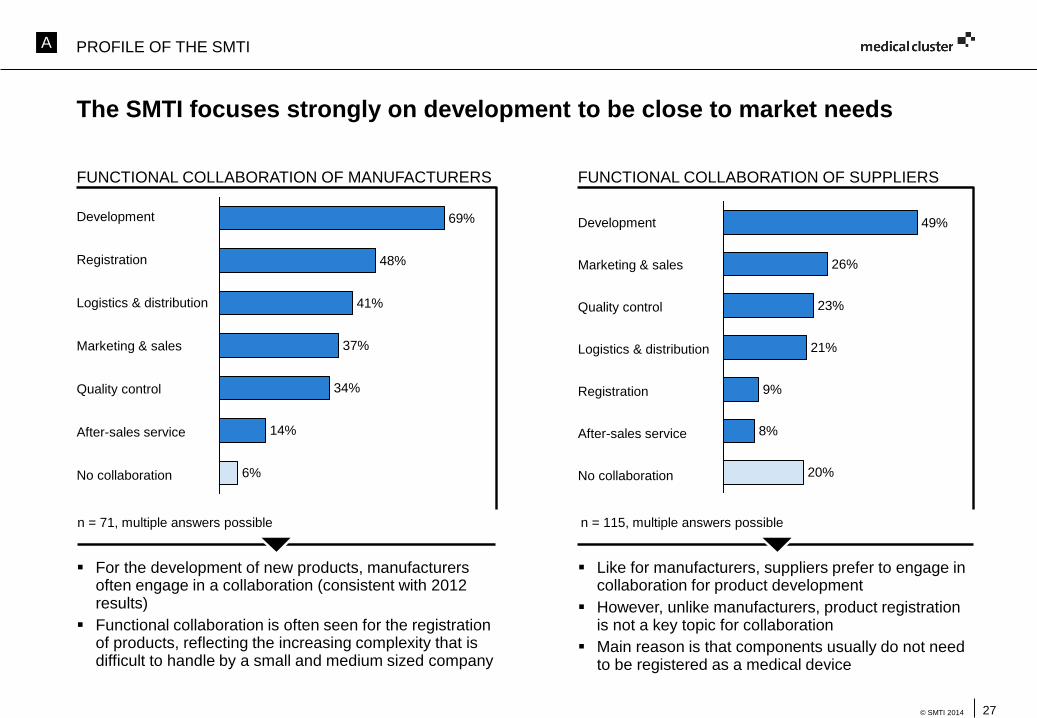
The SMTI focuses strongly on development to be close to market needs
FUNCTIONAL COLLABORATION OF MANUFACTURERS
For the development of new products, manufacturers often engage in a collaboration (consistent with 2012 results)
Functional collaboration is often seen for the registration of products, reflecting the increasing complexity that is difficult to handle by a small and medium sized company
37%
14%
69%
41%
48%
34%
6%
n = 71, multiple answers possible n = 115, multiple answers possible
FUNCTIONAL COLLABORATION OF SUPPLIERS
Like for manufacturers, suppliers prefer to engage in collaboration for product development
However, unlike manufacturers, product registration is not a key topic for collaboration
Main reason is that components usually do not need to be registered as a medical device
8%
9%
20%
26%
49%
21%
23%
Development
Registration
Logistics & distribution
Marketing & sales
Quality control
After-sales service
No collaboration
Development
Marketing & sales
Quality control
Logistics & distribution
Registration
After-sales service
No collaboration
A PROFILE OF THE SMTI
28© SMTI 2014
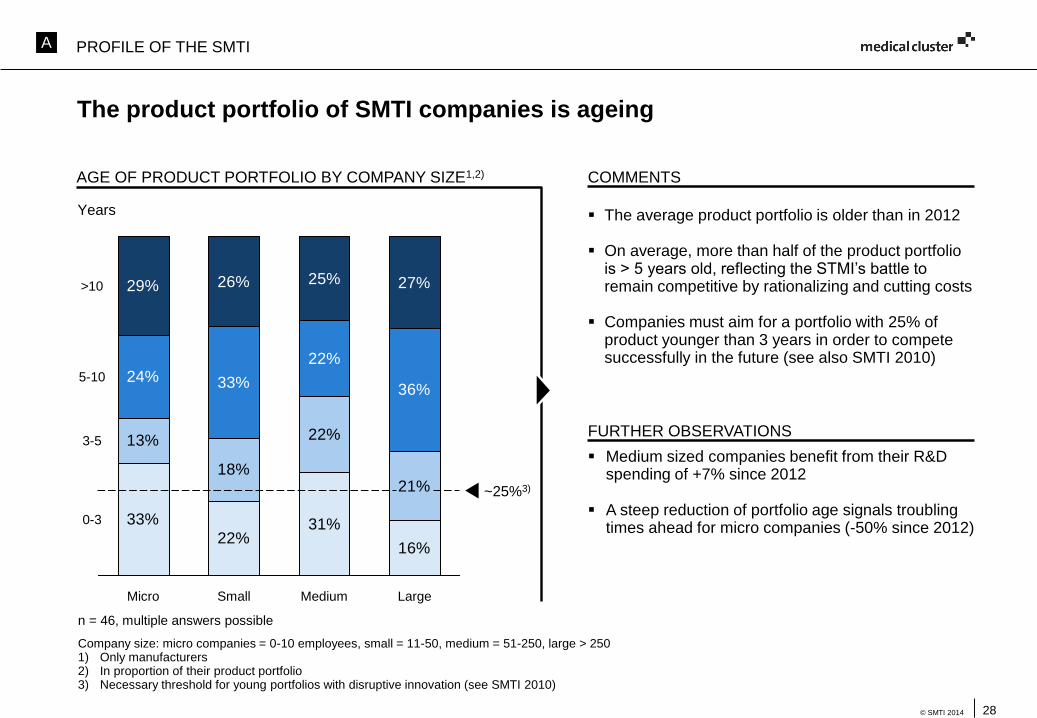
The product portfolio of SMTI companies is ageing
AGE OF PRODUCT PORTFOLIO BY COMPANY SIZE1,2) COMMENTS
Company size: micro companies = 0-10 employees, small = 11-50, medium = 51-250, large > 2501) Only manufacturers 2) In proportion of their product portfolio3) Necessary threshold for young portfolios with disruptive innovation (see SMTI 2010)
33%
22%31%
16%
13%
18%
22%
21%
24% 33%
22%
36%
29% 26% 25% 27%
3-5
LargeSmallMicro
0-3
5-10
~25%3)
Medium
>10
Years The average product portfolio is older than in 2012
On average, more than half of the product portfolio is > 5 years old, reflecting the STMI’s battle to remain competitive by rationalizing and cutting costs
Companies must aim for a portfolio with 25% of product younger than 3 years in order to compete successfully in the future (see also SMTI 2010)
n = 46, multiple answers possible
FURTHER OBSERVATIONS
Medium sized companies benefit from their R&D spending of +7% since 2012
A steep reduction of portfolio age signals troubling times ahead for micro companies (-50% since 2012)
A PROFILE OF THE SMTI
29© SMTI 2014
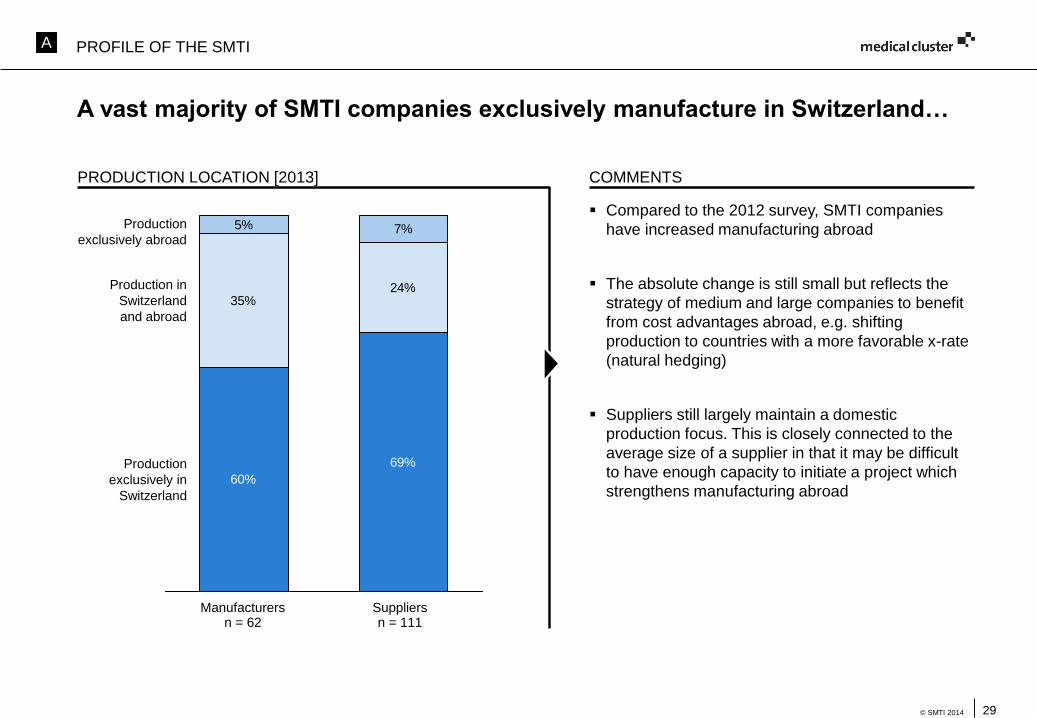
A vast majority of SMTI companies exclusively manufacture in Switzerland…
PRODUCTION LOCATION [2013] COMMENTS
Compared to the 2012 survey, SMTI companies
have increased manufacturing abroad
The absolute change is still small but reflects the
strategy of medium and large companies to benefit
from cost advantages abroad, e.g. shifting
production to countries with a more favorable x-rate
(natural hedging)
Suppliers still largely maintain a domestic
production focus. This is closely connected to the
average size of a supplier in that it may be difficult
to have enough capacity to initiate a project which
strengthens manufacturing abroad60%
69%
35%24%
5% 7%
Production
exclusively in
Switzerland
Production
exclusively abroad
Production in
Switzerland
and abroad
Manufacturersn = 62
Suppliersn = 111
A PROFILE OF THE SMTI
30© SMTI 2012
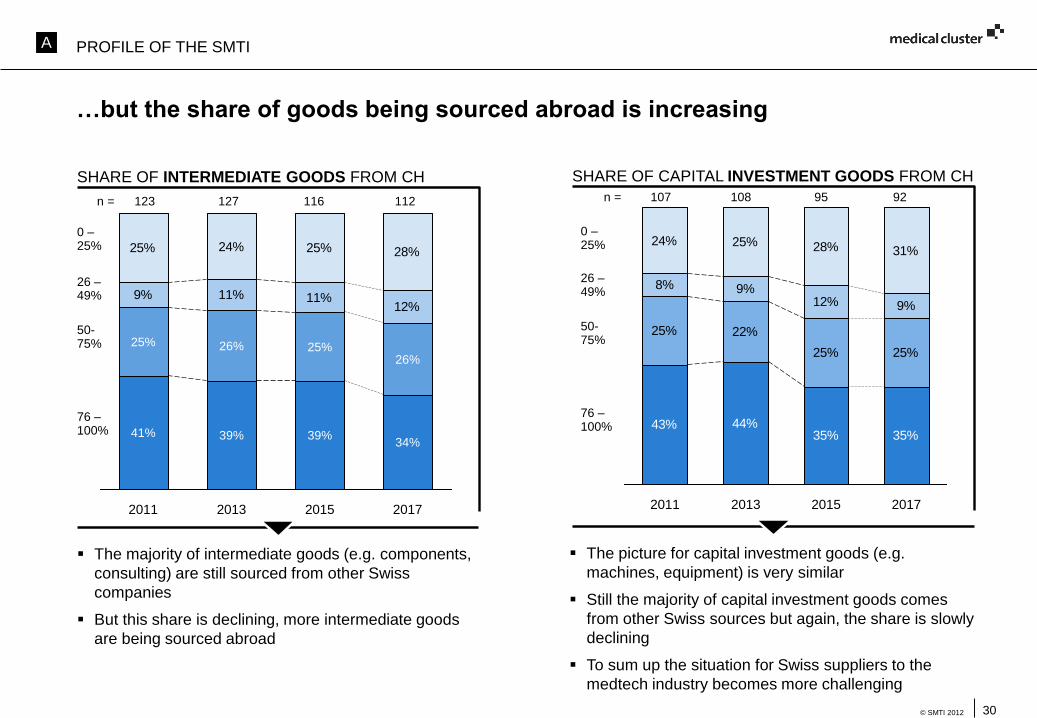
…but the share of goods being sourced abroad is increasing
SHARE OF INTERMEDIATE GOODS FROM CH SHARE OF CAPITAL INVESTMENT GOODS FROM CH
9% 11% 11%12%
25% 24% 25% 28%
26%
39%
2011 2013
26%
2015
25%
2017
34%39%41%
25%
43% 44%35% 35%
25% 22%
25% 25%
8% 9%12% 9%
24% 25% 28% 31%
2011 2013 20172015
The majority of intermediate goods (e.g. components,
consulting) are still sourced from other Swiss
companies
But this share is declining, more intermediate goods
are being sourced abroad
The picture for capital investment goods (e.g.
machines, equipment) is very similar
Still the majority of capital investment goods comes
from other Swiss sources but again, the share is slowly
declining
To sum up the situation for Swiss suppliers to the
medtech industry becomes more challenging
n = 107 108 95 92n = 123 127 116 112
0 –25%
26 –49%
50-75%
76 –100%
0 –25%
26 –49%
50-75%
76 –100%
A PROFILE OF THE SMTI
31© SMTI 2014
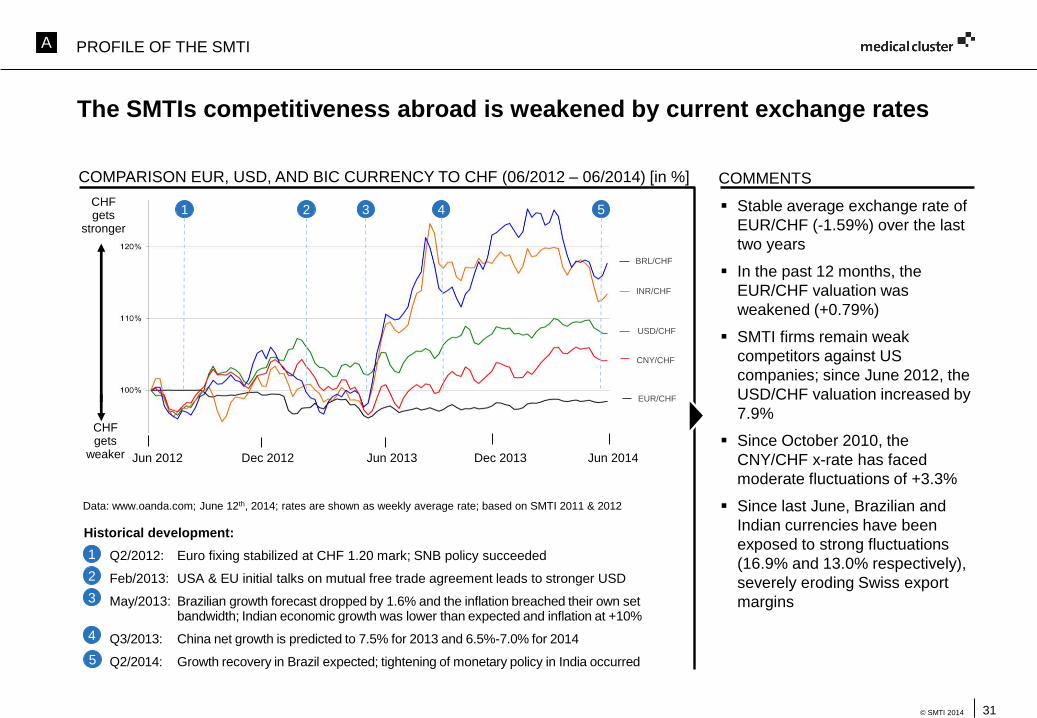
The SMTIs competitiveness abroad is weakened by current exchange rates
Stable average exchange rate of
EUR/CHF (-1.59%) over the last
two years
In the past 12 months, the
EUR/CHF valuation was
weakened (+0.79%)
SMTI firms remain weak
competitors against US
companies; since June 2012, the
USD/CHF valuation increased by
7.9%
Since October 2010, the
CNY/CHF x-rate has faced
moderate fluctuations of +3.3%
Since last June, Brazilian and
Indian currencies have been
exposed to strong fluctuations
(16.9% and 13.0% respectively),
severely eroding Swiss export
margins
COMMENTS
Historical development:
Q2/2012: Euro fixing stabilized at CHF 1.20 mark; SNB policy succeeded
• Feb/2013: USA & EU initial talks on mutual free trade agreement leads to stronger USD
May/2013: Brazilian growth forecast dropped by 1.6% and the inflation breached their own set bandwidth; Indian economic growth was lower than expected and inflation at +10%
Q3/2013: China net growth is predicted to 7.5% for 2013 and 6.5%-7.0% for 2014
Q2/2014: Growth recovery in Brazil expected; tightening of monetary policy in India occurred
1
2
3
4
Data: www.oanda.com; June 12th, 2014; rates are shown as weekly average rate; based on SMTI 2011 & 2012
COMPARISON EUR, USD, AND BIC CURRENCY TO CHF (06/2012 – 06/2014) [in %]
5
BRL/CHF
INR/CHF
CNY/CHF
USD/CHF
EUR/CHF
CHF gets
weaker Jun 2012 Jun 2014Jun 2013 Dec 2013Dec 2012
1 3 4 52CHF gets
stronger
A PROFILE OF THE SMTI
32© SMTI 2014
0
50
100
150
200
250
300
350
400
0 20 40 60 80
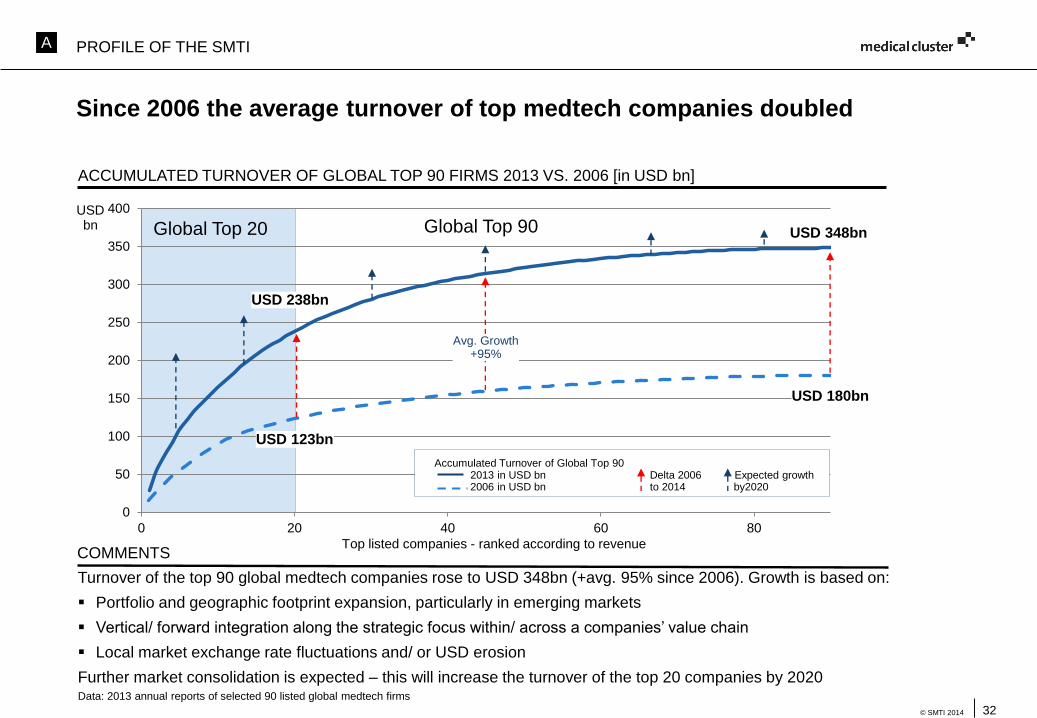
Since 2006 the average turnover of top medtech companies doubled
Avg. Growth+95%
Top listed companies - ranked according to revenue
USD bn
USD 238bn
USD 123bn
Global Top 20 Global Top 90 USD 348bn
USD 180bn
Turnover of the top 90 global medtech companies rose to USD 348bn (+avg. 95% since 2006). Growth is based on:
Portfolio and geographic footprint expansion, particularly in emerging markets
Vertical/ forward integration along the strategic focus within/ across a companies’ value chain
Local market exchange rate fluctuations and/ or USD erosion
Further market consolidation is expected – this will increase the turnover of the top 20 companies by 2020
COMMENTS
Accumulated Turnover of Global Top 90 2013 in USD bn Delta 2006 Expected growth2006 in USD bn to 2014 by2020
ACCUMULATED TURNOVER OF GLOBAL TOP 90 FIRMS 2013 VS. 2006 [in USD bn]
Data: 2013 annual reports of selected 90 listed global medtech firms
A PROFILE OF THE SMTI
33© SMTI 2014
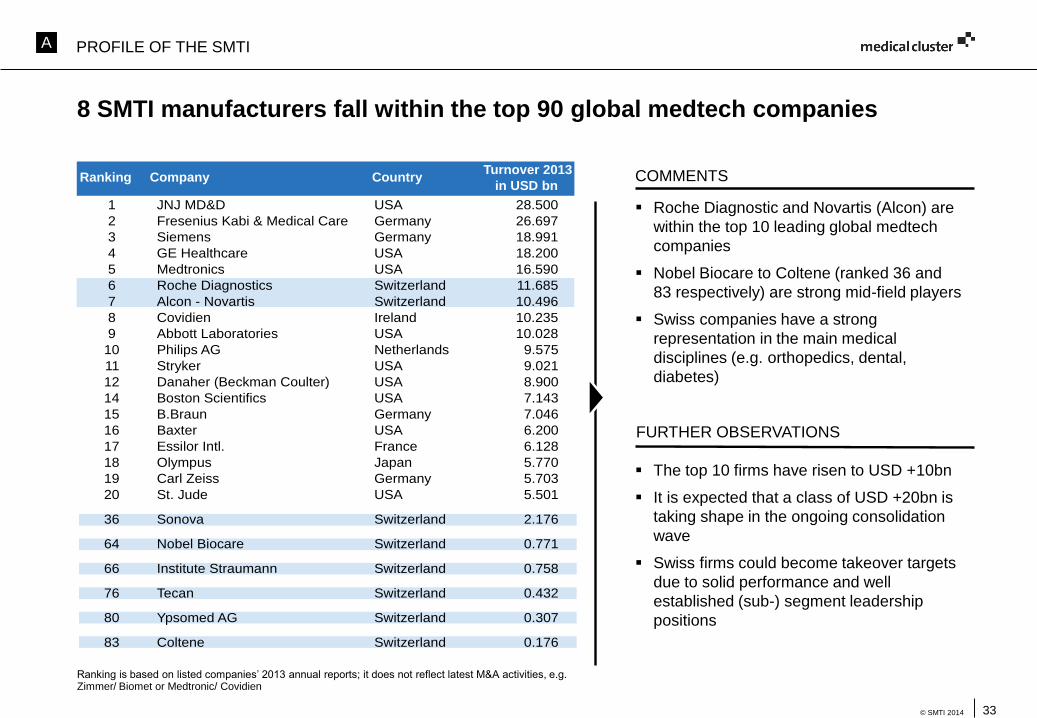
8 SMTI manufacturers fall within the top 90 global medtech companies
COMMENTS
Ranking is based on listed companies’ 2013 annual reports; it does not reflect latest M&A activities, e.g. Zimmer/ Biomet or Medtronic/ Covidien
Roche Diagnostic and Novartis (Alcon) are
within the top 10 leading global medtech
companies
Nobel Biocare to Coltene (ranked 36 and
83 respectively) are strong mid-field players
Swiss companies have a strong
representation in the main medical
disciplines (e.g. orthopedics, dental,
diabetes)
FURTHER OBSERVATIONS
The top 10 firms have risen to USD +10bn
It is expected that a class of USD +20bn is
taking shape in the ongoing consolidation
wave
Swiss firms could become takeover targets
due to solid performance and well
established (sub-) segment leadership
positions
Ranking Company Country Turnover 2013
in USD bn
1 Johnson&Johnson MD&D USA 28.500
2 Fresenius Germany 26.697
3 Siemens Germany 18.991
4 GE Healthcare USA 18.200
5 Medtronics USA 16.590
6 Roche Switzerland 11.685
7 Alcon USA 10.496
8 Covidien Ireland 10.235
9 Abbott Laboratories USA 10.028
10 Philips The Netherlands 9.575
11 Stryker USA 9.021
12 Danaher USA 8.900
13 Becton Dickinson USA 8.054
14 Boston Scientifics USA 7.143
15 B.Braun Germany 7.046
16 Baxter USA 6.200
17 Essilor Intl. France 6.128
18 Olympus Japan 5.770
19 Carl Zeiss Germany 5.703
20 St. Jude USA 5.501
36 Sonova Switzerland 2.176
64 Nobel Biocare Switzerland 0.771
66 Institute Straumann Switzerland 0.758
76 Tecan Switzerland 0.432
80 Ypsomed Switzerland 0.307
83 Coltene Switzerland 0.176
1 JNJ MD&D USA 28.500
2 Fresenius Kabi & Medical Care Germany 26.697
3 Siemens Germany 18.991
4 GE Healthcare USA 18.200
5 Medtronics USA 16.590
6 Roche Diagnostics Switzerland 11.685
7 Alcon - Novartis Switzerland 10.496
8 Covidien Ireland 10.235
9 Abbott Laboratories USA 10.028
10 Philips AG Netherlands 9.575
11 Stryker USA 9.021
12 Danaher (Beckman Coulter) USA 8.900
14 Boston Scientifics USA 7.143
15 B.Braun Germany 7.046
16 Baxter USA 6.200
17 Essilor Intl. France 6.128
18 Olympus Japan 5.770
19 Carl Zeiss Germany 5.703
20 St. Jude USA 5.501
36 Sonova Switzerland 2.176
64 Nobel Biocare Switzerland 0.771
66 Institute Straumann Switzerland 0.758
76 Tecan Switzerland 0.432
80 Ypsomed AG Switzerland 0.307
83 Coltene Switzerland 0.176
A PROFILE OF THE SMTI
34© SMTI 2014
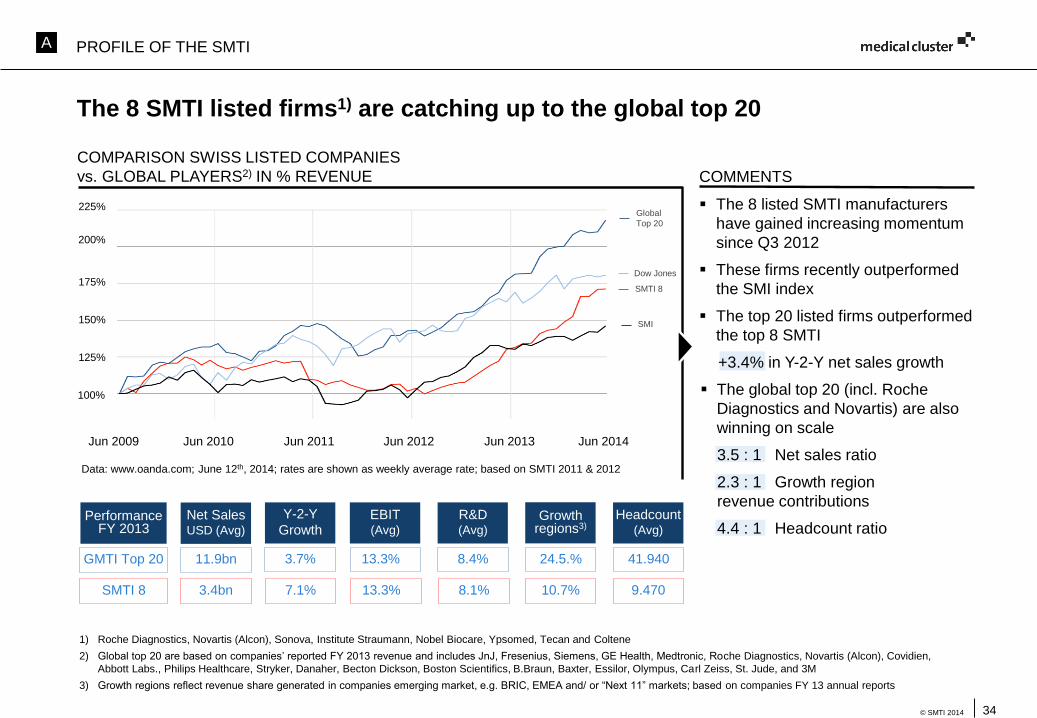
The 8 SMTI listed firms1) are catching up to the global top 20
COMMENTS
Jun 2009 Jun 2014Jun 2013Jun 2011Jun 2010
Data: www.oanda.com; June 12th, 2014; rates are shown as weekly average rate; based on SMTI 2011 & 2012
COMPARISON SWISS LISTED COMPANIES
vs. GLOBAL PLAYERS2) IN % REVENUE
Dow Jones
SMTI 8
Global
Top 20
SMI
Jun 2012
Net SalesUSD (Avg)
Y-2-Y
Growth R&D(Avg)
EBIT(Avg)
Headcount(Avg)
GMTI Top 20 3.7% 8.4%13.3% 41.94011.9bn
Growth regions3)
24.5.%
SMTI 8 7.1% 8.1%13.3% 9.4703.4bn 10.7%
1) Roche Diagnostics, Novartis (Alcon), Sonova, Institute Straumann, Nobel Biocare, Ypsomed, Tecan and Coltene
2) Global top 20 are based on companies’ reported FY 2013 revenue and includes JnJ, Fresenius, Siemens, GE Health, Medtronic, Roche Diagnostics, Novartis (Alcon), Covidien,
Abbott Labs., Philips Healthcare, Stryker, Danaher, Becton Dickson, Boston Scientifics, B.Braun, Baxter, Essilor, Olympus, Carl Zeiss, St. Jude, and 3M
3) Growth regions reflect revenue share generated in companies emerging market, e.g. BRIC, EMEA and/ or “Next 11” markets; based on companies FY 13 annual reports
Performance FY 2013
100%
225%
175%
200%
150%
125%
The 8 listed SMTI manufacturers
have gained increasing momentum
since Q3 2012
These firms recently outperformed
the SMI index
The top 20 listed firms outperformed
the top 8 SMTI
+3.4% in Y-2-Y net sales growth
The global top 20 (incl. Roche
Diagnostics and Novartis) are also
winning on scale
3.5 : 1 Net sales ratio
2.3 : 1 Growth region
revenue contributions
4.4 : 1 Headcount ratio
A PROFILE OF THE SMTI

B. Results of the survey
36© SMTI 2014
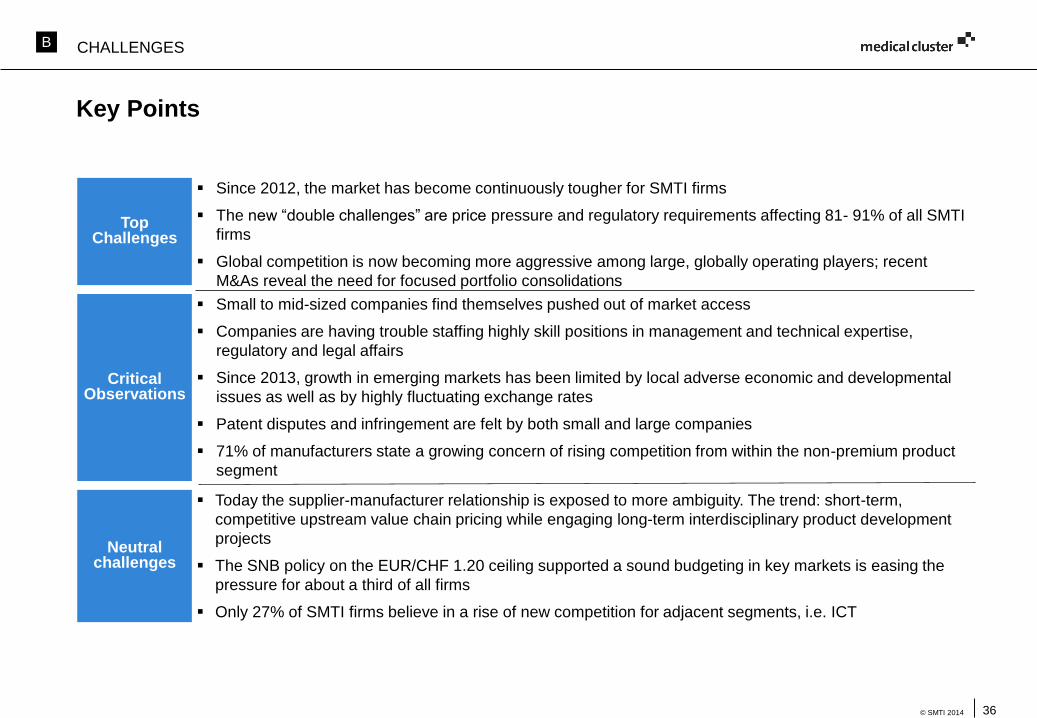
Key Points
CHALLENGESB
Since 2012, the market has become continuously tougher for SMTI firms
The new “double challenges” are price pressure and regulatory requirements affecting 81- 91% of all SMTI
firms
Global competition is now becoming more aggressive among large, globally operating players; recent
M&As reveal the need for focused portfolio consolidations
Small to mid-sized companies find themselves pushed out of market access
Companies are having trouble staffing highly skill positions in management and technical expertise,
regulatory and legal affairs
Since 2013, growth in emerging markets has been limited by local adverse economic and developmental
issues as well as by highly fluctuating exchange rates
Patent disputes and infringement are felt by both small and large companies
71% of manufacturers state a growing concern of rising competition from within the non-premium product
segment
Today the supplier-manufacturer relationship is exposed to more ambiguity. The trend: short-term,
competitive upstream value chain pricing while engaging long-term interdisciplinary product development
projects
The SNB policy on the EUR/CHF 1.20 ceiling supported a sound budgeting in key markets is easing the
pressure for about a third of all firms
Only 27% of SMTI firms believe in a rise of new competition for adjacent segments, i.e. ICT
Top Challenges
Critical Observations
Neutral challenges
37© SMTI 2014
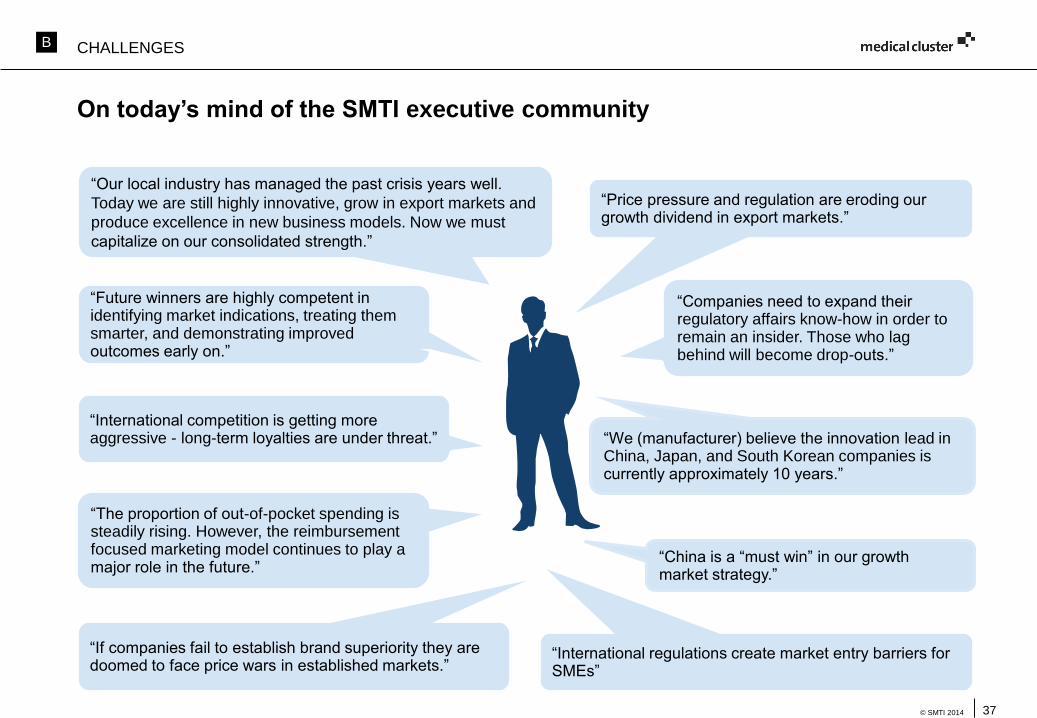
On today’s mind of the SMTI executive community
“Our local industry has managed the past crisis years well.
Today we are still highly innovative, grow in export markets and
produce excellence in new business models. Now we must
capitalize on our consolidated strength.”
“If companies fail to establish brand superiority they are doomed to face price wars in established markets.”
“International competition is getting more aggressive - long-term loyalties are under threat.”
“Companies need to expand their regulatory affairs know-how in order to remain an insider. Those who lag behind will become drop-outs.”
“We (manufacturer) believe the innovation lead in China, Japan, and South Korean companies is currently approximately 10 years.”
“Price pressure and regulation are eroding our growth dividend in export markets.”
“The proportion of out-of-pocket spending is steadily rising. However, the reimbursement focused marketing model continues to play a major role in the future.”
“China is a “must win” in our growth market strategy.”
“Future winners are highly competent in identifying market indications, treating them smarter, and demonstrating improved outcomes early on.”
“International regulations create market entry barriers for SMEs”
CHALLENGESB
38© SMTI 2014
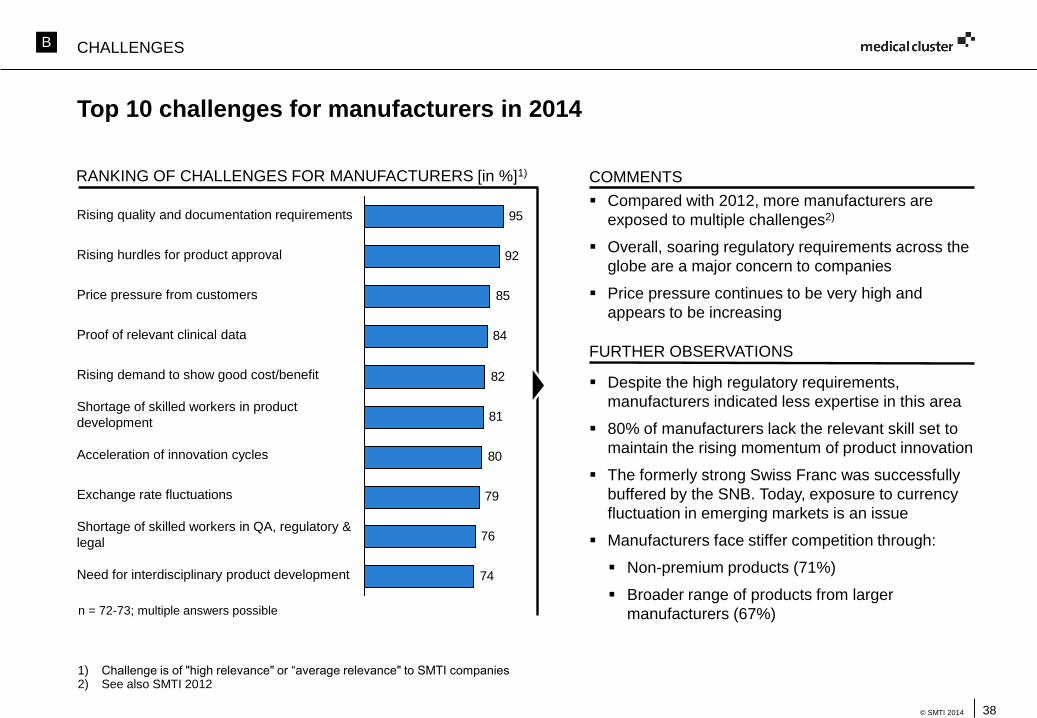
74
76
79
80
81
82
84
85
92
95Rising quality and documentation requirements
Rising hurdles for product approval
Price pressure from customers
Proof of relevant clinical data
Rising demand to show good cost/benefit
Shortage of skilled workers in product
development
Acceleration of innovation cycles
Exchange rate fluctuations
Shortage of skilled workers in QA, regulatory &
legal
Need for interdisciplinary product development
n = 72-73; multiple answers possible
COMMENTS
Compared with 2012, more manufacturers are
exposed to multiple challenges2)
Overall, soaring regulatory requirements across the
globe are a major concern to companies
Price pressure continues to be very high and
appears to be increasing
Despite the high regulatory requirements,
manufacturers indicated less expertise in this area
80% of manufacturers lack the relevant skill set to
maintain the rising momentum of product innovation
The formerly strong Swiss Franc was successfully
buffered by the SNB. Today, exposure to currency
fluctuation in emerging markets is an issue
Manufacturers face stiffer competition through:
Non-premium products (71%)
Broader range of products from larger
manufacturers (67%)
FURTHER OBSERVATIONS
RANKING OF CHALLENGES FOR MANUFACTURERS [in %]1)
1) Challenge is of "high relevance" or “average relevance" to SMTI companies2) See also SMTI 2012
CHALLENGESB
Top 10 challenges for manufacturers in 2014
39© SMTI 2014
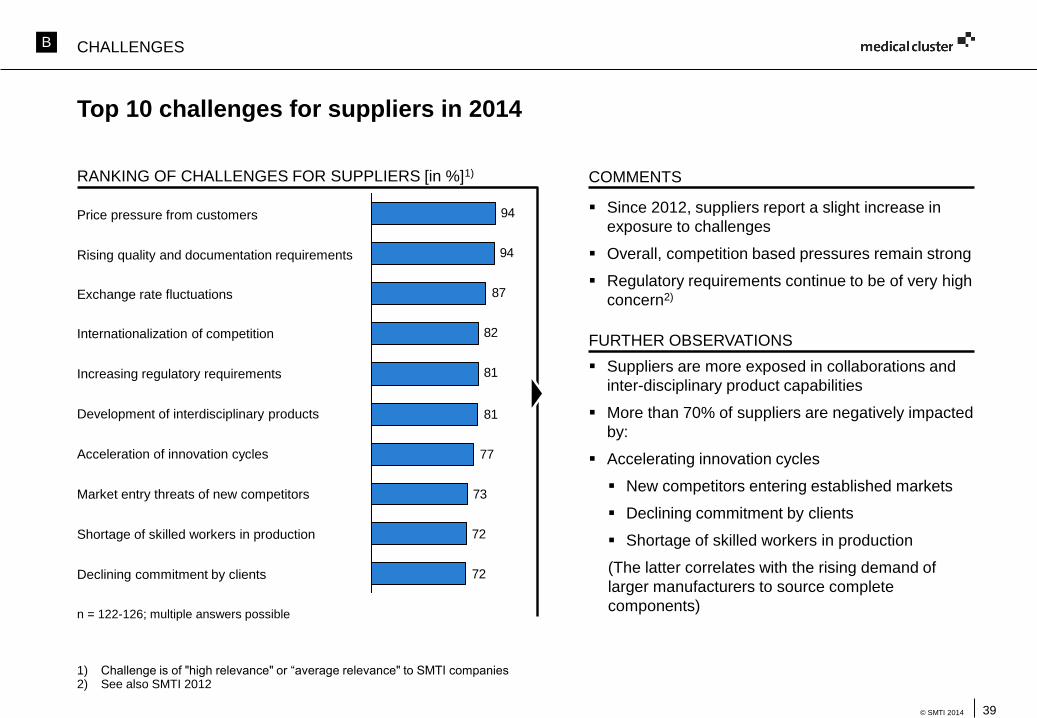
Top 10 challenges for suppliers in 2014
COMMENTS
Since 2012, suppliers report a slight increase in
exposure to challenges
Overall, competition based pressures remain strong
Regulatory requirements continue to be of very high
concern2)
Suppliers are more exposed in collaborations and
inter-disciplinary product capabilities
More than 70% of suppliers are negatively impacted
by:
Accelerating innovation cycles
New competitors entering established markets
Declining commitment by clients
Shortage of skilled workers in production
(The latter correlates with the rising demand of
larger manufacturers to source complete
components)
FURTHER OBSERVATIONS
RANKING OF CHALLENGES FOR SUPPLIERS [in %]1)
72
72
73
77
81
81
82
87
94
94Price pressure from customers
Rising quality and documentation requirements
Exchange rate fluctuations
Internationalization of competition
Increasing regulatory requirements
Development of interdisciplinary products
Acceleration of innovation cycles
Market entry threats of new competitors
Shortage of skilled workers in production
Declining commitment by clients
n = 122-126; multiple answers possible
1) Challenge is of "high relevance" or “average relevance" to SMTI companies2) See also SMTI 2012
CHALLENGESB
40© SMTI 2014
<10FTEs
Companysize
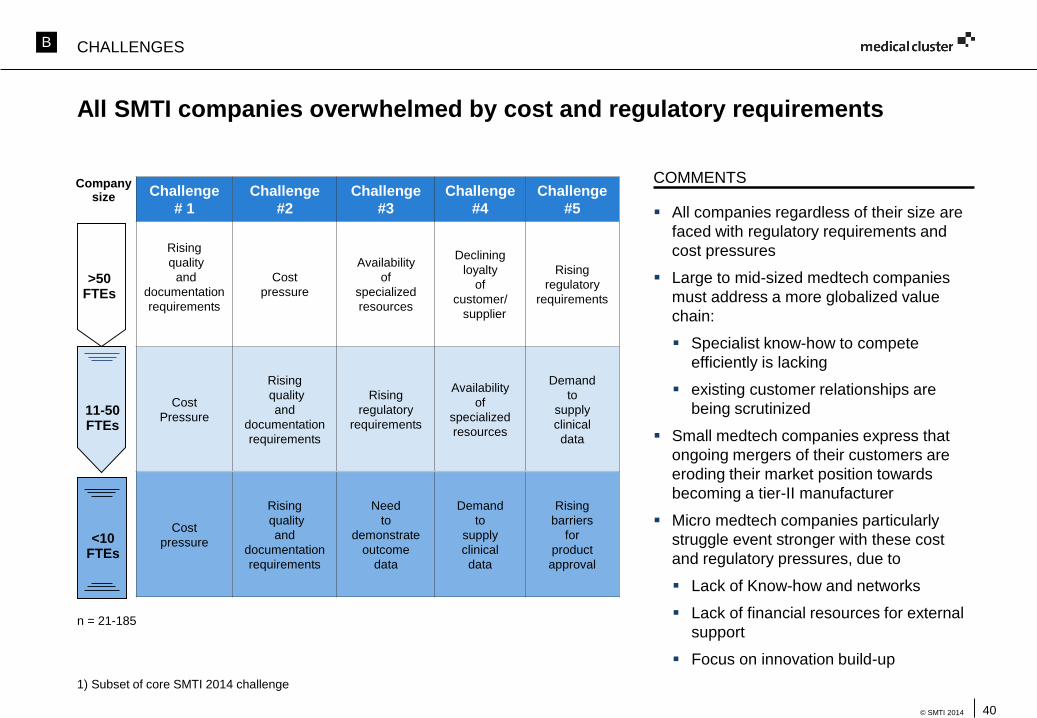
All SMTI companies overwhelmed by cost and regulatory requirements
COMMENTS
All companies regardless of their size are
faced with regulatory requirements and
cost pressures
Large to mid-sized medtech companies
must address a more globalized value
chain:
Specialist know-how to compete
efficiently is lacking
existing customer relationships are
being scrutinized
Small medtech companies express that
ongoing mergers of their customers are
eroding their market position towards
becoming a tier-II manufacturer
Micro medtech companies particularly
struggle event stronger with these cost
and regulatory pressures, due to
Lack of Know-how and networks
Lack of financial resources for external
support
Focus on innovation build-up
Challenge
# 1
Challenge
#2
Challenge
#3
Challenge
#4
Challenge
#5
Rising
quality
and
documentation
requirements
Cost
pressure
Availability
of
specialized
resources
Declining
loyalty
of
customer/
supplier
Rising
regulatory
requirements
Cost
Pressure
Rising
quality
and
documentation
requirements
Rising
regulatory
requirements
Availability
of
specialized
resources
Demand
to
supply
clinical
data
Cost
pressure
Rising
quality
and
documentation
requirements
Need
to
demonstrate
outcome
data
Demand
to
supply
clinical
data
Rising
barriers
for
product
approval
11-50FTEs
n = 21-185
1) Subset of core SMTI 2014 challenge
CHALLENGESB
>50FTEs
41© SMTI 2014
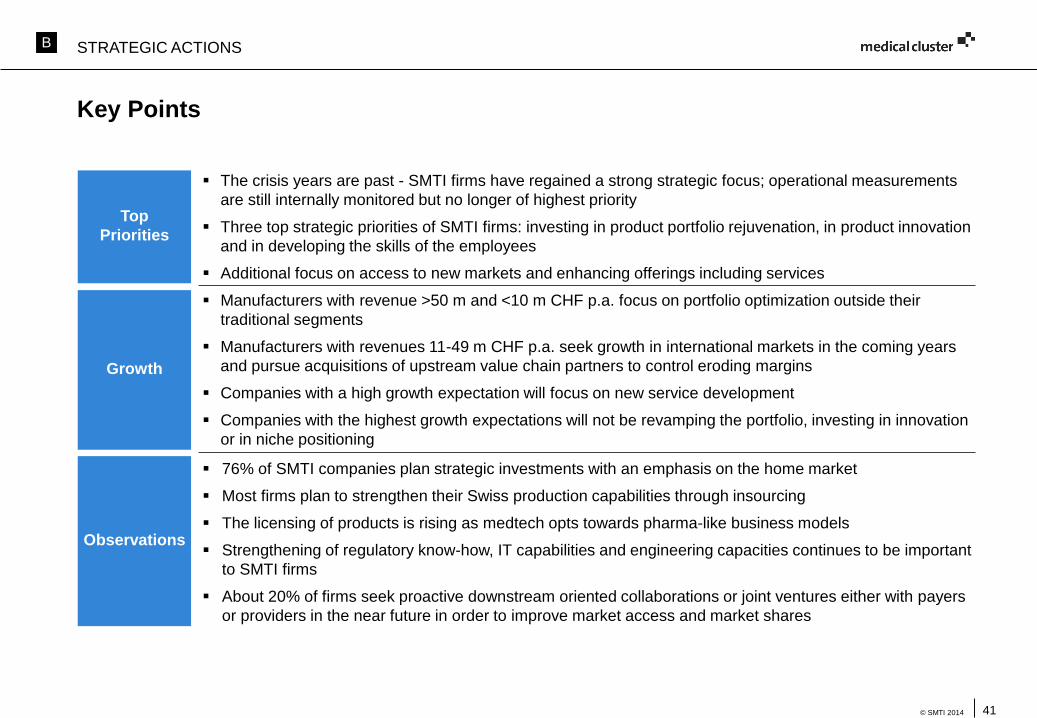
Key Points
STRATEGIC ACTIONS
The crisis years are past - SMTI firms have regained a strong strategic focus; operational measurements
are still internally monitored but no longer of highest priority
Three top strategic priorities of SMTI firms: investing in product portfolio rejuvenation, in product innovation
and in developing the skills of the employees
Additional focus on access to new markets and enhancing offerings including services
Manufacturers with revenue >50 m and <10 m CHF p.a. focus on portfolio optimization outside their
traditional segments
Manufacturers with revenues 11-49 m CHF p.a. seek growth in international markets in the coming years
and pursue acquisitions of upstream value chain partners to control eroding margins
Companies with a high growth expectation will focus on new service development
Companies with the highest growth expectations will not be revamping the portfolio, investing in innovation
or in niche positioning
76% of SMTI companies plan strategic investments with an emphasis on the home market
Most firms plan to strengthen their Swiss production capabilities through insourcing
The licensing of products is rising as medtech opts towards pharma-like business models
Strengthening of regulatory know-how, IT capabilities and engineering capacities continues to be important
to SMTI firms
About 20% of firms seek proactive downstream oriented collaborations or joint ventures either with payers
or providers in the near future in order to improve market access and market shares
Top
Priorities
Growth
Observations
B
42© SMTI 2014
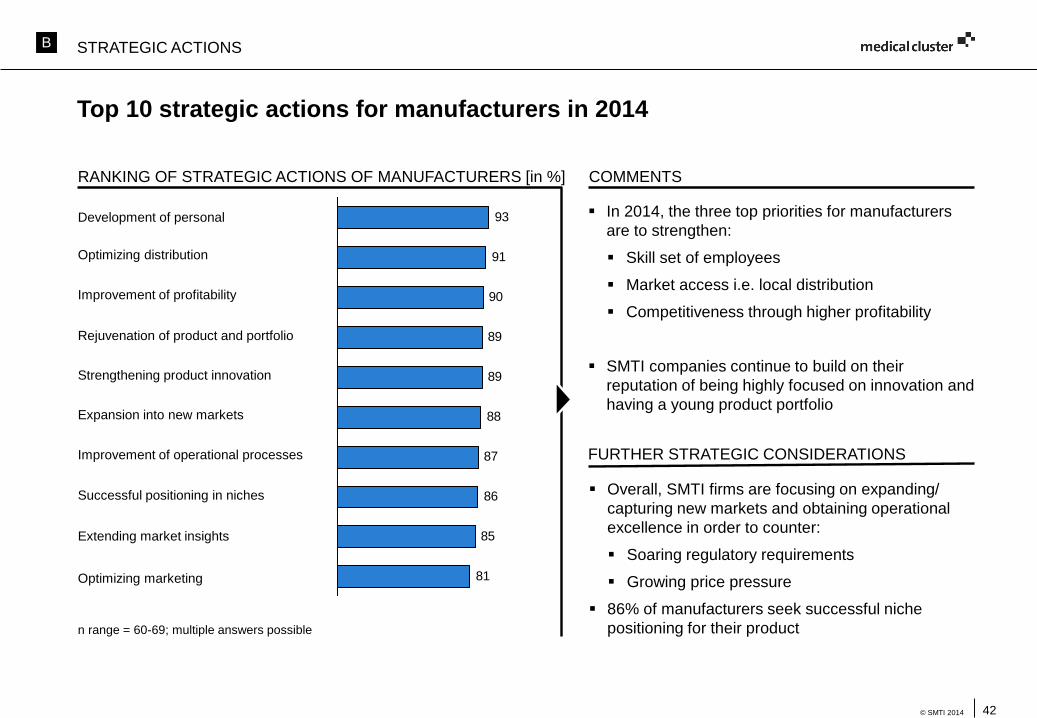
In 2014, the three top priorities for manufacturers
are to strengthen:
Skill set of employees
Market access i.e. local distribution
Competitiveness through higher profitability
SMTI companies continue to build on their
reputation of being highly focused on innovation and
having a young product portfolio
RANKING OF STRATEGIC ACTIONS OF MANUFACTURERS [in %] COMMENTS
Overall, SMTI firms are focusing on expanding/
capturing new markets and obtaining operational
excellence in order to counter:
Soaring regulatory requirements
Growing price pressure
86% of manufacturers seek successful niche
positioning for their product
FURTHER STRATEGIC CONSIDERATIONS
Top 10 strategic actions for manufacturers in 2014
n range = 60-69; multiple answers possible
81
85
86
87
88
89
89
90
91
93Development of personal
Optimizing distribution
Improvement of profitability
Rejuvenation of product and portfolio
Strengthening product innovation
Expansion into new markets
Improvement of operational processes
Successful positioning in niches
Extending market insights
Optimizing marketing
STRATEGIC ACTIONSB
43© SMTI 2014
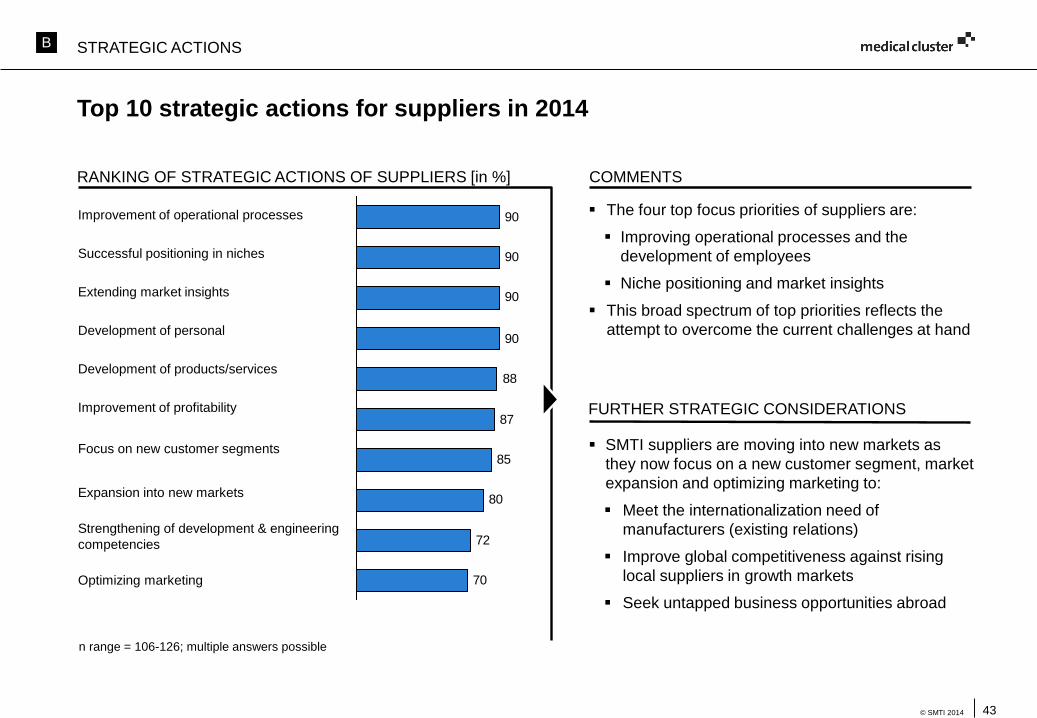
RANKING OF STRATEGIC ACTIONS OF SUPPLIERS [in %] COMMENTS
The four top focus priorities of suppliers are:
Improving operational processes and the
development of employees
Niche positioning and market insights
This broad spectrum of top priorities reflects the
attempt to overcome the current challenges at hand
SMTI suppliers are moving into new markets as
they now focus on a new customer segment, market
expansion and optimizing marketing to:
Meet the internationalization need of
manufacturers (existing relations)
Improve global competitiveness against rising
local suppliers in growth markets
Seek untapped business opportunities abroad
FURTHER STRATEGIC CONSIDERATIONS
Top 10 strategic actions for suppliers in 2014
n range = 106-126; multiple answers possible
70
72
80
85
87
88
90
90
90
90Improvement of operational processes
Successful positioning in niches
Extending market insights
Development of personal
Development of products/services
Improvement of profitability
Focus on new customer segments
Expansion into new markets
Strengthening of development & engineering
competencies
Optimizing marketing
STRATEGIC ACTIONSB
44© SMTI 2014
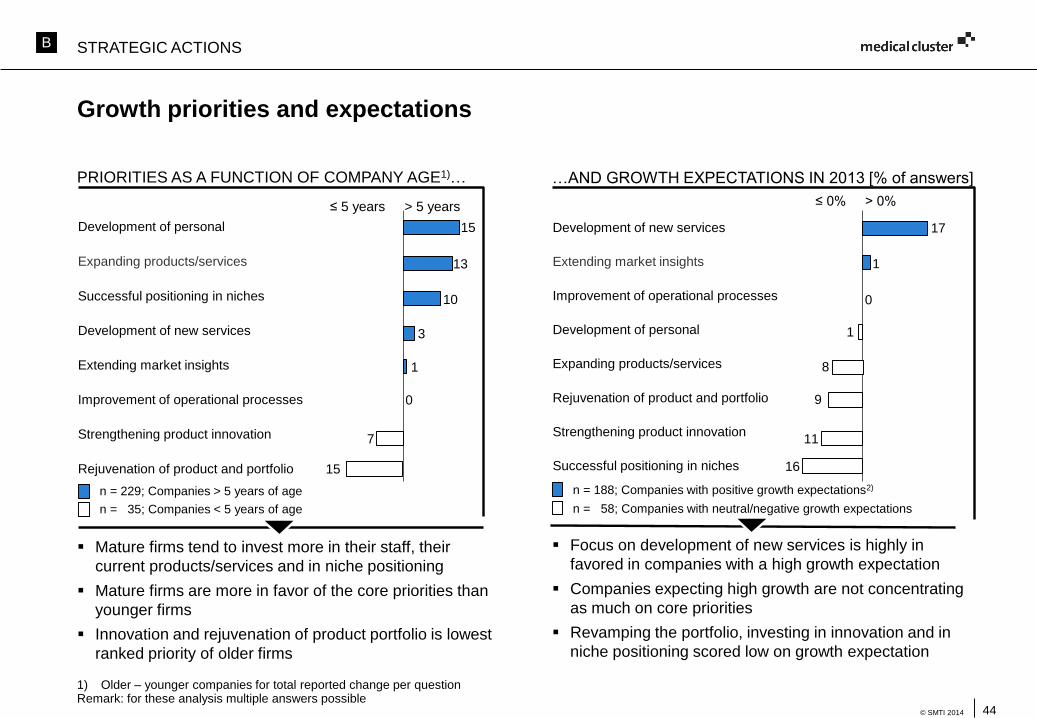
Growth priorities and expectations
PRIORITIES AS A FUNCTION OF COMPANY AGE1)…
Mature firms tend to invest more in their staff, their
current products/services and in niche positioning
Mature firms are more in favor of the core priorities than
younger firms
Innovation and rejuvenation of product portfolio is lowest
ranked priority of older firms
0
n = 35; Companies < 5 years of age
n = 229; Companies > 5 years of age
≤ 0% > 0%
n = 188; Companies with positive growth expectations2)
n = 58; Companies with neutral/negative growth expectations
Focus on development of new services is highly in
favored in companies with a high growth expectation
Companies expecting high growth are not concentrating
as much on core priorities
Revamping the portfolio, investing in innovation and in
niche positioning scored low on growth expectation
…AND GROWTH EXPECTATIONS IN 2013 [% of answers]
≤ 5 years > 5 years
10
1
15
7
15
13
3
0
1
16
8
17
9
11
1
Development of new services
Extending market insights
Improvement of operational processes
Development of personal
Expanding products/services
Rejuvenation of product and portfolio
Strengthening product innovation
Successful positioning in niches
Development of personal
Expanding products/services
Successful positioning in niches
Development of new services
Extending market insights
Improvement of operational processes
Strengthening product innovation
Rejuvenation of product and portfolio
1) Older – younger companies for total reported change per questionRemark: for these analysis multiple answers possible
STRATEGIC ACTIONSB
45© SMTI 2014
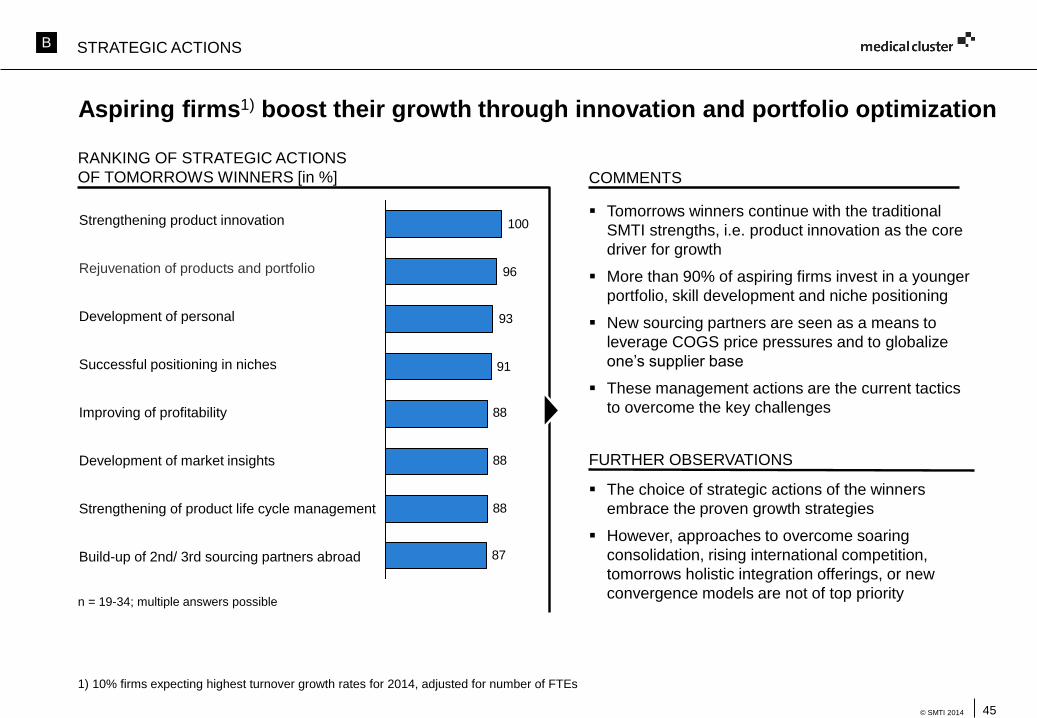
RANKING OF STRATEGIC ACTIONS
OF TOMORROWS WINNERS [in %] COMMENTS
Tomorrows winners continue with the traditional
SMTI strengths, i.e. product innovation as the core
driver for growth
More than 90% of aspiring firms invest in a younger
portfolio, skill development and niche positioning
New sourcing partners are seen as a means to
leverage COGS price pressures and to globalize
one’s supplier base
These management actions are the current tactics
to overcome the key challenges
FURTHER OBSERVATIONS
87
88
88
88
91
93
96
100
Aspiring firms1) boost their growth through innovation and portfolio optimization
n = 19-34; multiple answers possible
1) 10% firms expecting highest turnover growth rates for 2014, adjusted for number of FTEs
The choice of strategic actions of the winners
embrace the proven growth strategies
However, approaches to overcome soaring
consolidation, rising international competition,
tomorrows holistic integration offerings, or new
convergence models are not of top priority
Strengthening product innovation
Rejuvenation of products and portfolio
Development of personal
Successful positioning in niches
Improving of profitability
Development of market insights
Strengthening of product life cycle management
Build-up of 2nd/ 3rd sourcing partners abroad
STRATEGIC ACTIONSB
46© SMTI 2014
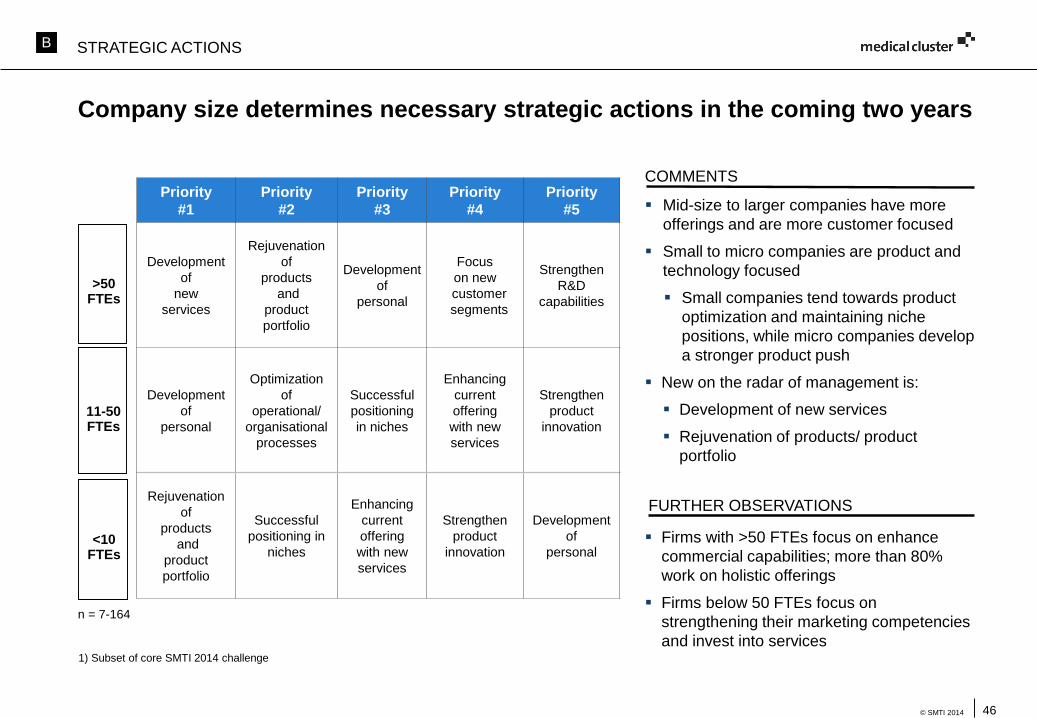
Company size determines necessary strategic actions in the coming two years
COMMENTS
Mid-size to larger companies have more
offerings and are more customer focused
Small to micro companies are product and
technology focused
Small companies tend towards product
optimization and maintaining niche
positions, while micro companies develop
a stronger product push
New on the radar of management is:
Development of new services
Rejuvenation of products/ product
portfolio
Firms with >50 FTEs focus on enhance
commercial capabilities; more than 80%
work on holistic offerings
Firms below 50 FTEs focus on
strengthening their marketing competencies
and invest into services
Priority
#1
Priority
#2
Priority
#3
Priority
#4
Priority
#5
Development
of
new
services
Rejuvenation
of
products
and
product
portfolio
Development
of
personal
Focus
on new
customer
segments
Strengthen
R&D
capabilities
Development
of
personal
Optimization
of
operational/
organisational
processes
Successful
positioning
in niches
Enhancing
current
offering
with new
services
Strengthen
product
innovation
Rejuvenation
of
products
and
product
portfolio
Successful
positioning in
niches
Enhancing
current
offering
with new
services
Strengthen
product
innovation
Development
of
personal
n = 7-164
1) Subset of core SMTI 2014 challenge
<10FTEs
11-50FTEs
>50FTEs
FURTHER OBSERVATIONS
STRATEGIC ACTIONSB
47© SMTI 2014
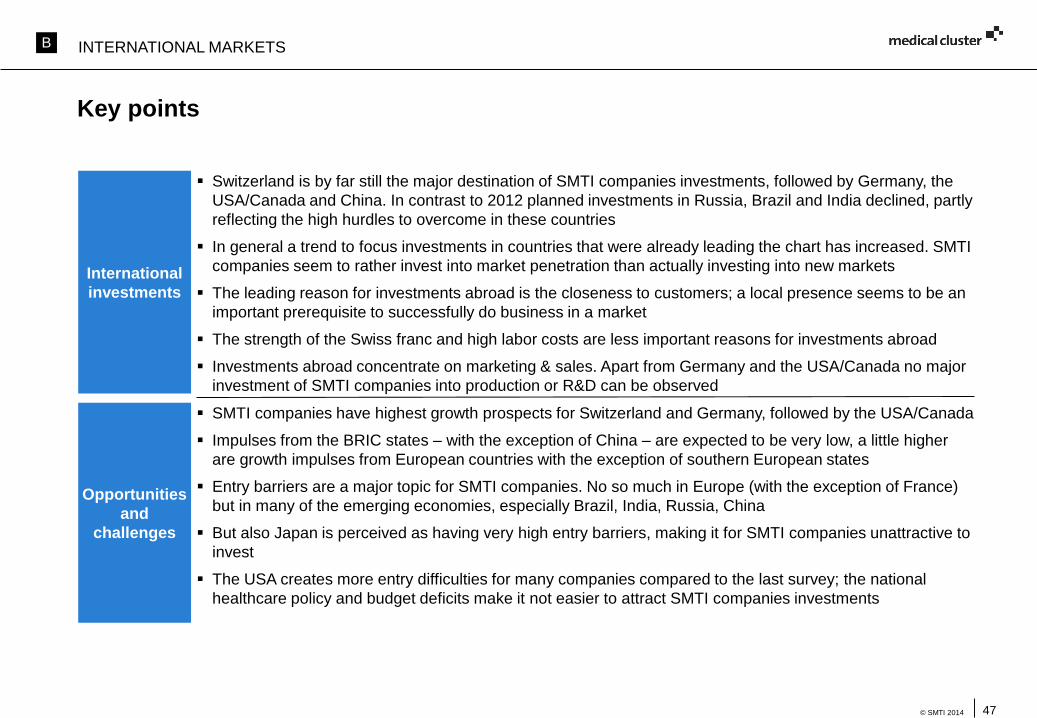
Key points
Switzerland is by far still the major destination of SMTI companies investments, followed by Germany, the
USA/Canada and China. In contrast to 2012 planned investments in Russia, Brazil and India declined, partly
reflecting the high hurdles to overcome in these countries
In general a trend to focus investments in countries that were already leading the chart has increased. SMTI
companies seem to rather invest into market penetration than actually investing into new markets
The leading reason for investments abroad is the closeness to customers; a local presence seems to be an
important prerequisite to successfully do business in a market
The strength of the Swiss franc and high labor costs are less important reasons for investments abroad
Investments abroad concentrate on marketing & sales. Apart from Germany and the USA/Canada no major
investment of SMTI companies into production or R&D can be observed
International
investments
SMTI companies have highest growth prospects for Switzerland and Germany, followed by the USA/Canada
Impulses from the BRIC states – with the exception of China – are expected to be very low, a little higher
are growth impulses from European countries with the exception of southern European states
Entry barriers are a major topic for SMTI companies. No so much in Europe (with the exception of France)
but in many of the emerging economies, especially Brazil, India, Russia, China
But also Japan is perceived as having very high entry barriers, making it for SMTI companies unattractive to
invest
The USA creates more entry difficulties for many companies compared to the last survey; the national
healthcare policy and budget deficits make it not easier to attract SMTI companies investments
Opportunities
and
challenges
INTERNATIONAL MARKETSB
48© SMTI 2014
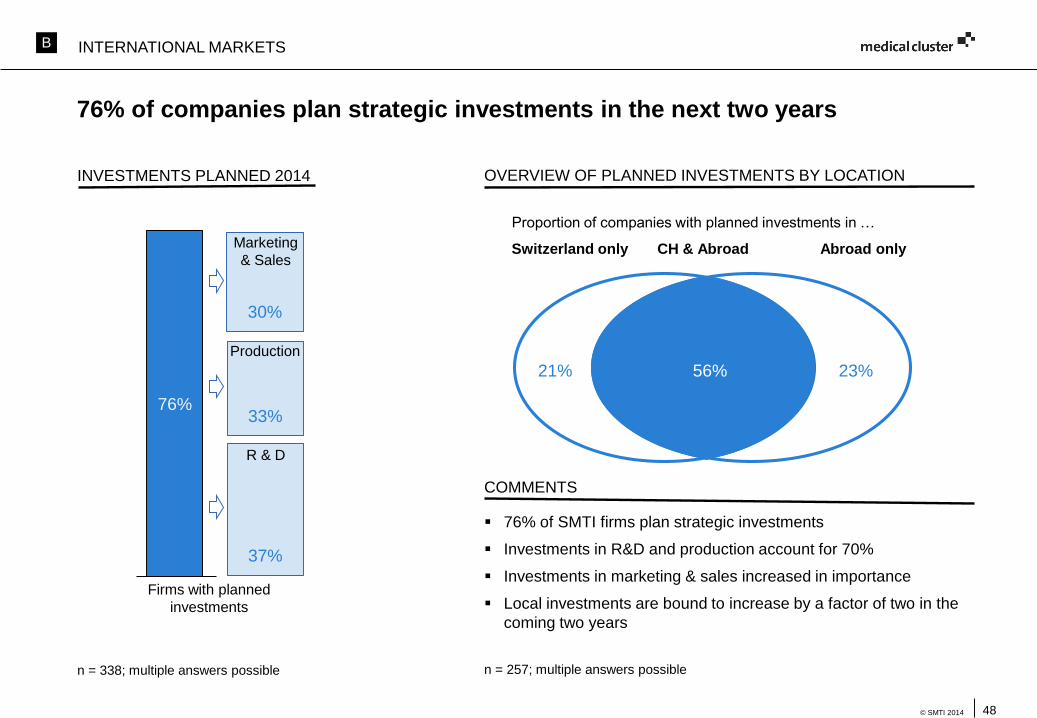
76% of companies plan strategic investments in the next two years
n = 338; multiple answers possible
INTERNATIONAL MARKETS
OVERVIEW OF PLANNED INVESTMENTS BY LOCATION
Proportion of companies with planned investments in …
Switzerland only Abroad onlyCH & Abroad
21% 23%56%
30%
33%
37%
76%
Firms with planned
investments
Marketing
& Sales
R & D
Production
n = 257; multiple answers possible
COMMENTS
76% of SMTI firms plan strategic investments
Investments in R&D and production account for 70%
Investments in marketing & sales increased in importance
Local investments are bound to increase by a factor of two in the
coming two years
INVESTMENTS PLANNED 2014
B
49© SMTI 2014
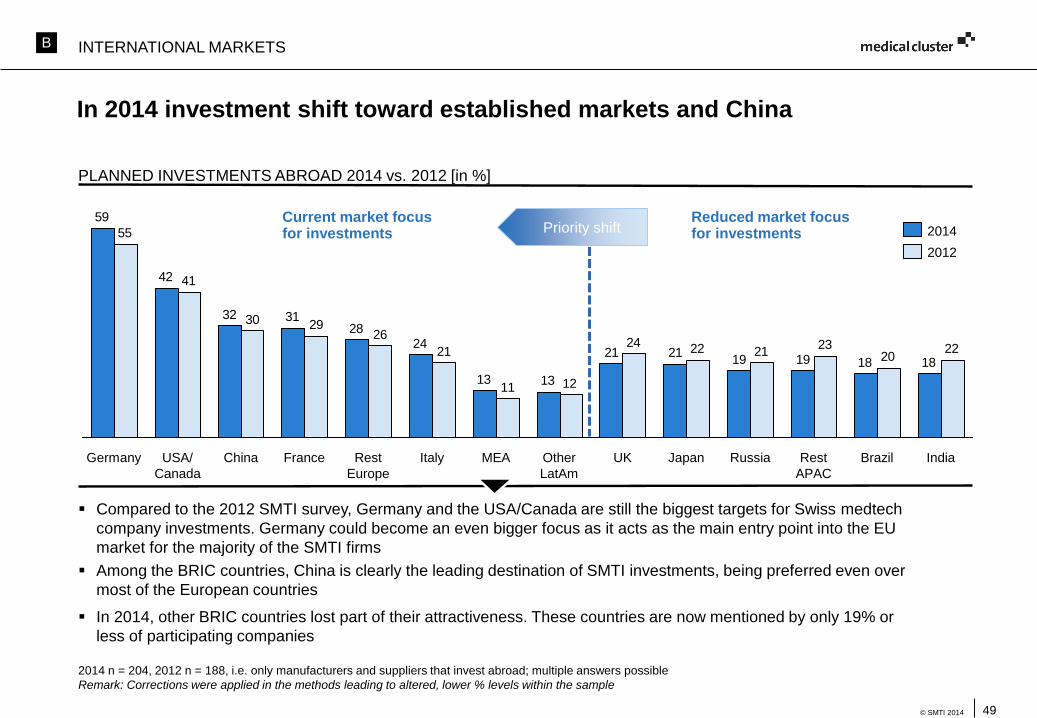
In 2014 investment shift toward established markets and China
PLANNED INVESTMENTS ABROAD 2014 vs. 2012 [in %]
2014 n = 204, 2012 n = 188, i.e. only manufacturers and suppliers that invest abroad; multiple answers possible
Remark: Corrections were applied in the methods leading to altered, lower % levels within the sample
Compared to the 2012 SMTI survey, Germany and the USA/Canada are still the biggest targets for Swiss medtech
company investments. Germany could become an even bigger focus as it acts as the main entry point into the EU
market for the majority of the SMTI firms
Among the BRIC countries, China is clearly the leading destination of SMTI investments, being preferred even over
most of the European countries
In 2014, other BRIC countries lost part of their attractiveness. These countries are now mentioned by only 19% or
less of participating companies
181819192121
1313
2428
3132
42
59
2220
23212224
1211
21
262930
41
55
France BrazilChina RussiaRest
Europe
Italy UK Japan Rest
APAC
USA/
Canada
Germany MEA Other
LatAm
India
Current market focus for investments
Reduced market focus for investmentsPriority shift
2012
2014
INTERNATIONAL MARKETSB
50© SMTI 2014
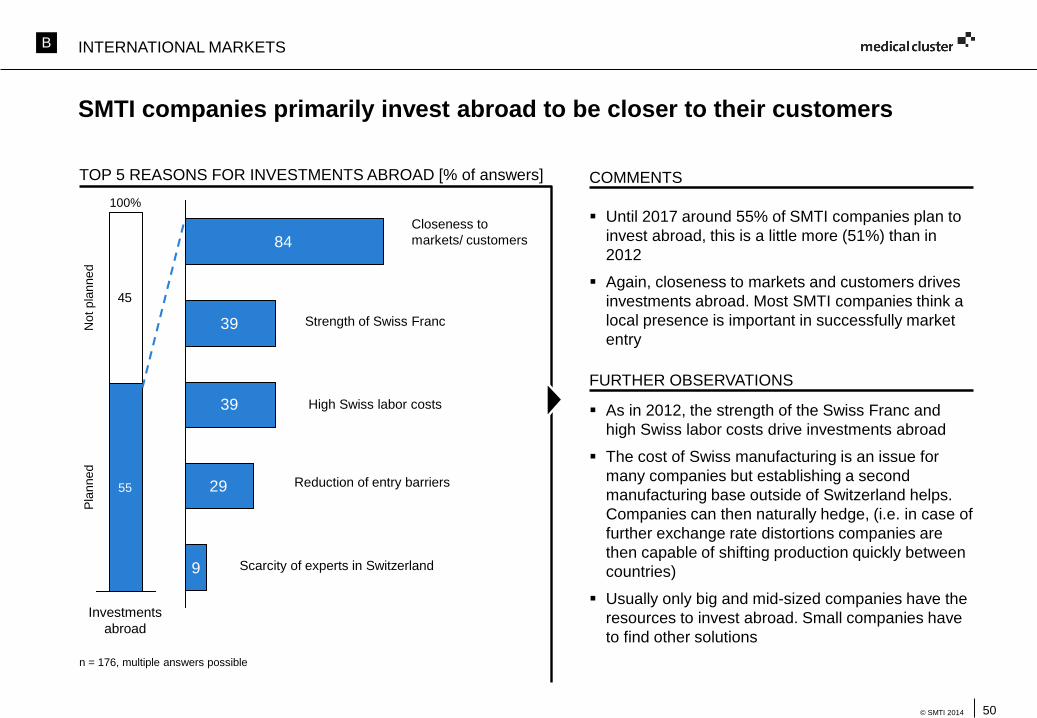
SMTI companies primarily invest abroad to be closer to their customers
TOP 5 REASONS FOR INVESTMENTS ABROAD [% of answers] COMMENTS
Until 2017 around 55% of SMTI companies plan to
invest abroad, this is a little more (51%) than in
2012
Again, closeness to markets and customers drives
investments abroad. Most SMTI companies think a
local presence is important in successfully market
entry
FURTHER OBSERVATIONS
As in 2012, the strength of the Swiss Franc and
high Swiss labor costs drive investments abroad
The cost of Swiss manufacturing is an issue for
many companies but establishing a second
manufacturing base outside of Switzerland helps.
Companies can then naturally hedge, (i.e. in case of
further exchange rate distortions companies are
then capable of shifting production quickly between
countries)
Usually only big and mid-sized companies have the
resources to invest abroad. Small companies have
to find other solutions
84
39
39
29
9
45
55
Not
pla
nne
d
Investments
abroad
100%
Pla
nned
n = 176, multiple answers possible
Closeness to
markets/ customers
Strength of Swiss Franc
High Swiss labor costs
Reduction of entry barriers
Scarcity of experts in Switzerland
INTERNATIONAL MARKETSB
51© SMTI 2014
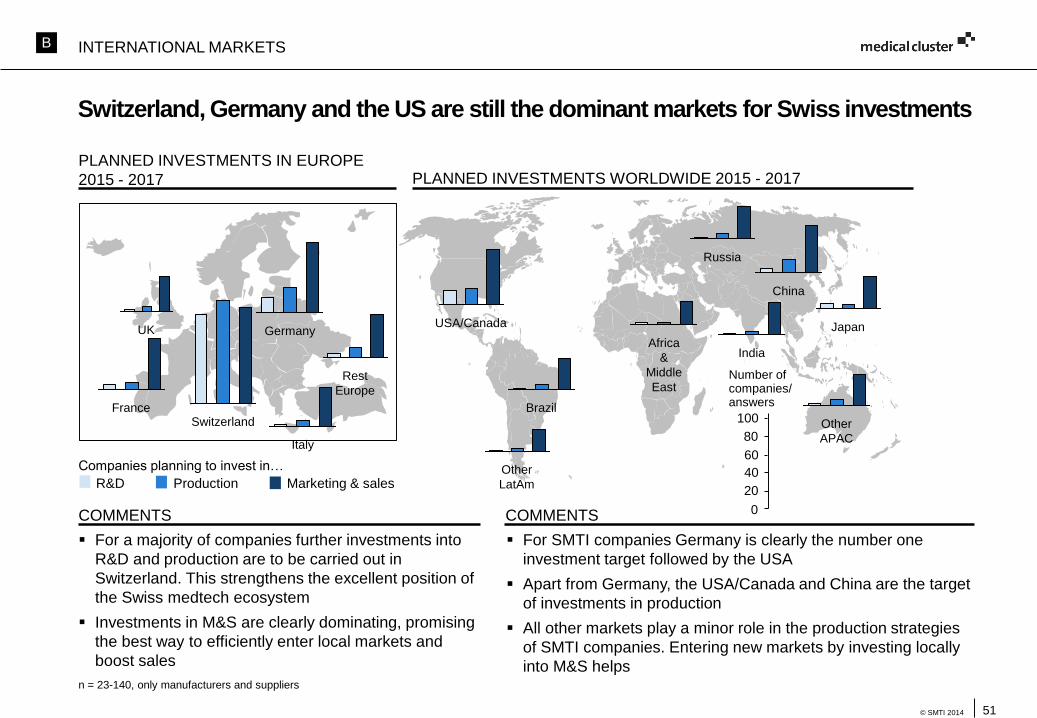
For a majority of companies further investments into
R&D and production are to be carried out in
Switzerland. This strengthens the excellent position of
the Swiss medtech ecosystem
Investments in M&S are clearly dominating, promising
the best way to efficiently enter local markets and
boost sales
n = 23-140, only manufacturers and suppliers
Switzerland, Germany and the US are still the dominant markets for Swiss investments
Switzerland
Companies planning to invest in…
R&D Production Marketing & sales
Germany
France
Italy
UK
Russia
Rest
Europe
USA/Canada
Brazil
Other
LatAm
India
China
Japan
Other
APAC
Africa
&
Middle
East
COMMENTS
PLANNED INVESTMENTS IN EUROPE
2015 - 2017 PLANNED INVESTMENTS WORLDWIDE 2015 - 2017
For SMTI companies Germany is clearly the number one
investment target followed by the USA
Apart from Germany, the USA/Canada and China are the target
of investments in production
All other markets play a minor role in the production strategies
of SMTI companies. Entering new markets by investing locally
into M&S helps
COMMENTS
100
80
60
40
20
0
Number of companies/answers
INTERNATIONAL MARKETSB
52© SMTI 2014
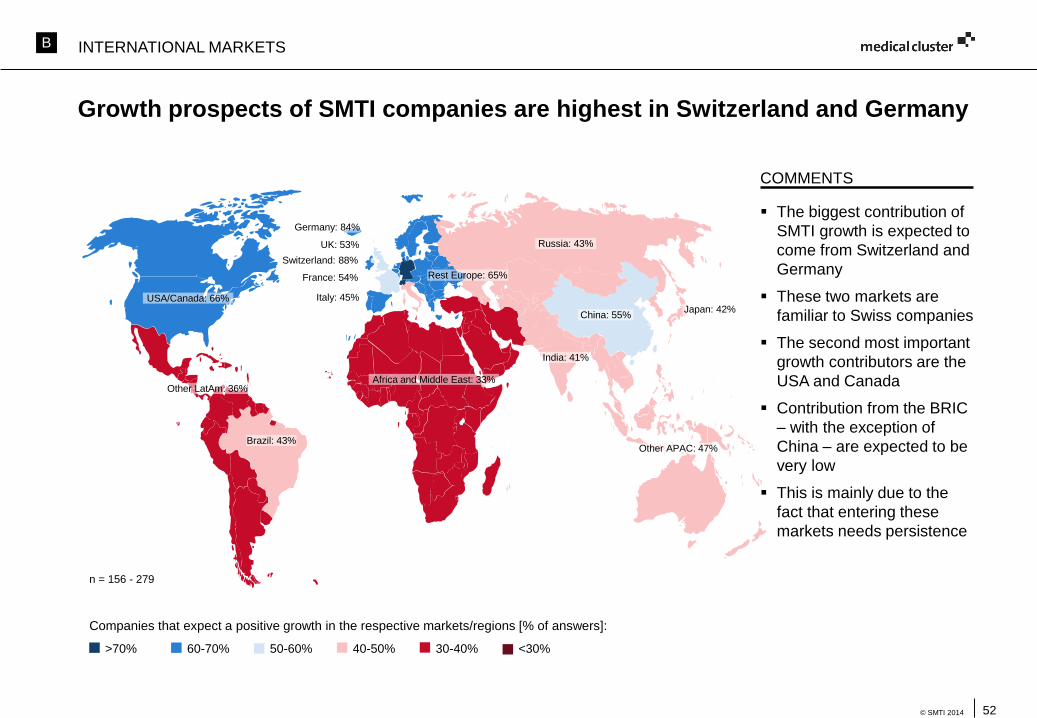
n = 156 - 279
Growth prospects of SMTI companies are highest in Switzerland and Germany
Companies that expect a positive growth in the respective markets/regions [% of answers]:
The biggest contribution of
SMTI growth is expected to
come from Switzerland and
Germany
These two markets are
familiar to Swiss companies
The second most important
growth contributors are the
USA and Canada
Contribution from the BRIC
– with the exception of
China – are expected to be
very low
This is mainly due to the
fact that entering these
markets needs persistence
COMMENTS
>70% 60-70% 40-50% 30-40% <30%50-60%
USA/Canada: 66%
Other LatAm: 36%
Brazil: 43%
Africa and Middle East: 33%
India: 41%
Rest Europe: 65%
Italy: 45%
France: 54%
UK: 53%
Germany: 84%
Switzerland: 88%
Russia: 43%
China: 55%
Other APAC: 47%
Japan: 42%
INTERNATIONAL MARKETSB
53© SMTI 2014
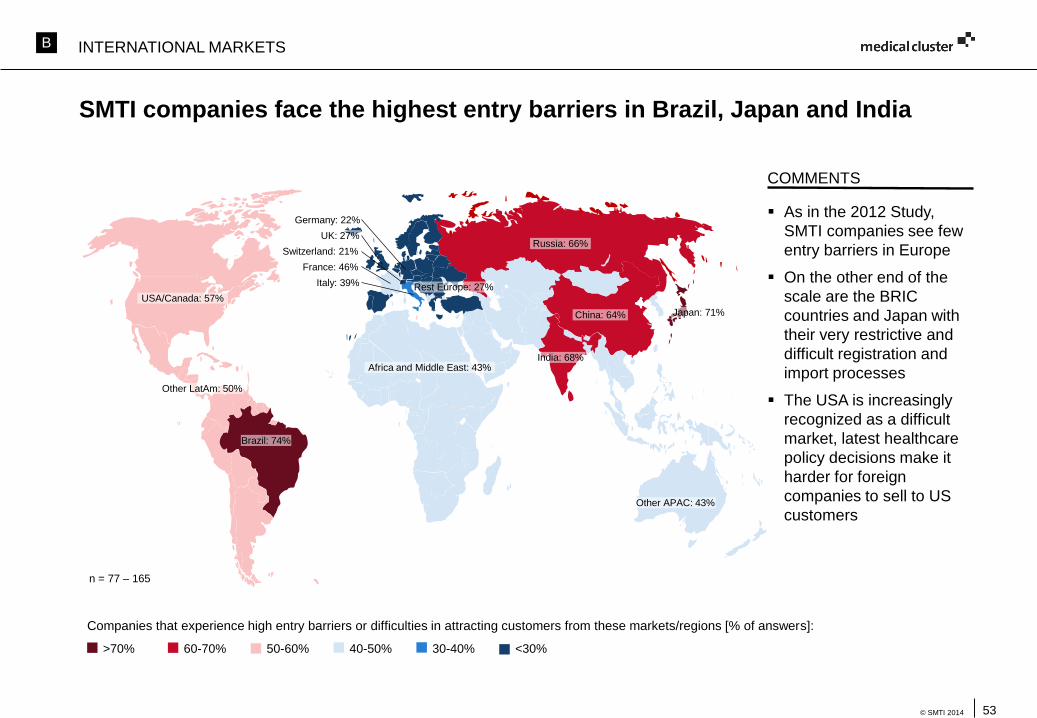
n = 77 – 165
SMTI companies face the highest entry barriers in Brazil, Japan and India
As in the 2012 Study,
SMTI companies see few
entry barriers in Europe
On the other end of the
scale are the BRIC
countries and Japan with
their very restrictive and
difficult registration and
import processes
The USA is increasingly
recognized as a difficult
market, latest healthcare
policy decisions make it
harder for foreign
companies to sell to US
customers
Companies that experience high entry barriers or difficulties in attracting customers from these markets/regions [% of answers]:
>70% 60-70% 40-50% 30-40% <30%50-60%
COMMENTS
USA/Canada: 57%
Other LatAm: 50%
Brazil: 74%
Africa and Middle East: 43%India: 68%
Rest Europe: 27%Italy: 39%
France: 46%
UK: 27%
Germany: 22%
Switzerland: 21%Russia: 66%
China: 64%
Other APAC: 43%
Japan: 71%
INTERNATIONAL MARKETSB
54© SMTI 2014
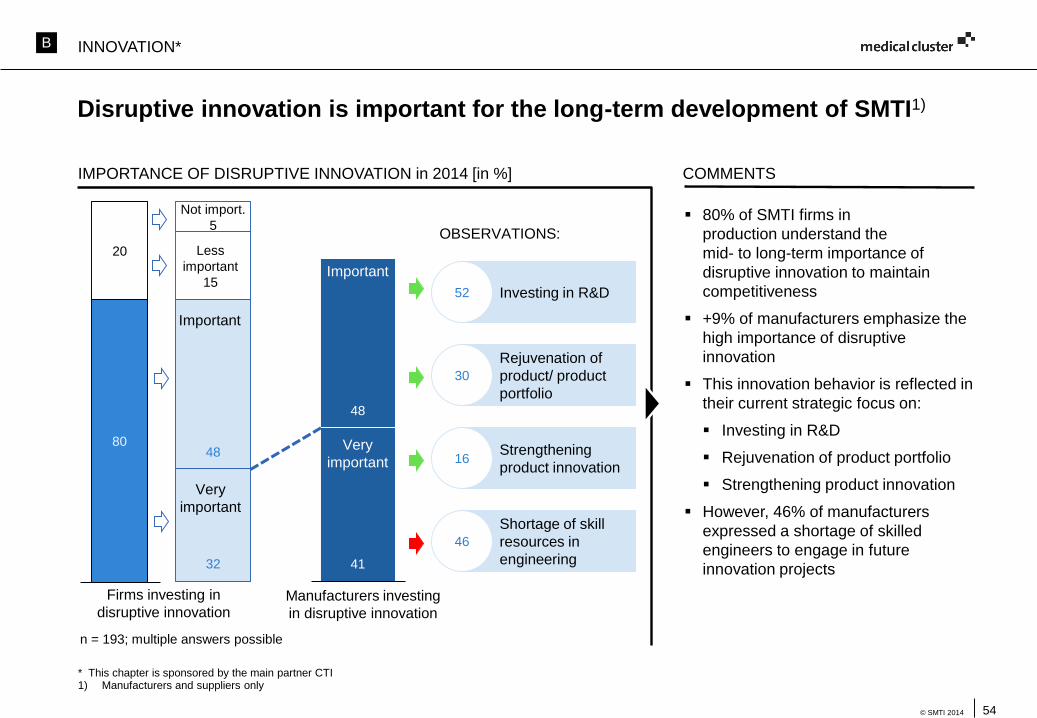
Disruptive innovation is important for the long-term development of SMTI1)
IMPORTANCE OF DISRUPTIVE INNOVATION in 2014 [in %] COMMENTS
80% of SMTI firms in
production understand the
mid- to long-term importance of
disruptive innovation to maintain
competitiveness
+9% of manufacturers emphasize the
high importance of disruptive
innovation
This innovation behavior is reflected in
their current strategic focus on:
Investing in R&D
Rejuvenation of product portfolio
Strengthening product innovation
However, 46% of manufacturers
expressed a shortage of skilled
engineers to engage in future
innovation projects
* This chapter is sponsored by the main partner CTI1) Manufacturers and suppliers only
n = 193; multiple answers possible
48
32
80
Firms investing in
disruptive innovation
Less
important
15
Very
important
Important
Not import.
5
20
Manufacturers investing
in disruptive innovation
48
41
Very
important
Important
OBSERVATIONS:
Investing in R&D52
Strengthening
product innovation16
Shortage of skill
resources in
engineering
46
Rejuvenation of
product/ product
portfolio
30
INNOVATION*B
55© SMTI 2014
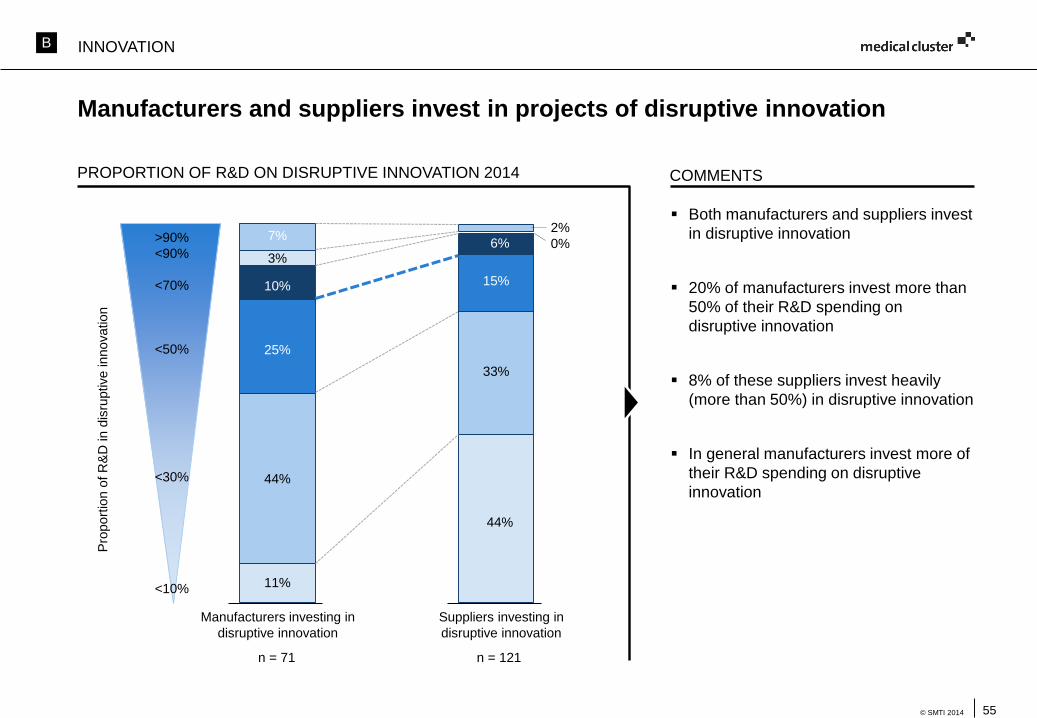
Manufacturers and suppliers invest in projects of disruptive innovation
PROPORTION OF R&D ON DISRUPTIVE INNOVATION 2014 COMMENTS
Both manufacturers and suppliers invest
in disruptive innovation
20% of manufacturers invest more than
50% of their R&D spending on
disruptive innovation
8% of these suppliers invest heavily
(more than 50%) in disruptive innovation
In general manufacturers invest more of
their R&D spending on disruptive
innovation
n = 71
Manufacturers investing in
disruptive innovation
7% >90%
<90%
<70%
<50%
<30%
<10%
n = 121
Suppliers investing in
disruptive innovation
3%
10%
25%
11%
44%
2%
0% 3%
15%
44%
33%
6%
INNOVATION
Pro
port
ion o
f R
&D
in d
isru
ptive innovation
B
56© SMTI 2014
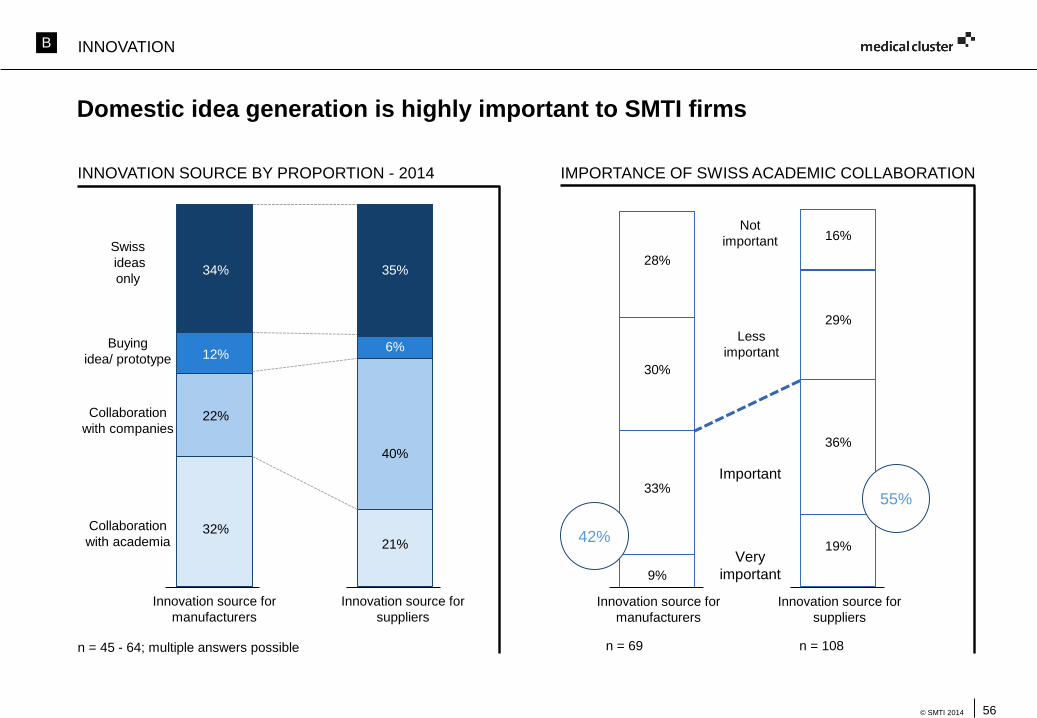
Domestic idea generation is highly important to SMTI firms
INNOVATION SOURCE BY PROPORTION - 2014
n = 45 - 64; multiple answers possible
IMPORTANCE OF SWISS ACADEMIC COLLABORATION
Innovation source for
manufacturers
Collaboration
with academia
Buying
idea/ prototype
Swiss
ideas
only10%
12%
32%
22%
21%
40%
6%
34% 35%
Collaboration
with companies
Innovation source for
suppliers
33%
9%
Less
important
Very
important
Important
Not
important
n = 69 n = 108
Innovation source for
manufacturers
Innovation source for
suppliers
28%
30%
36%
19%
29%
16%
42%
55%
INNOVATIONB
57© SMTI 2014
71
54
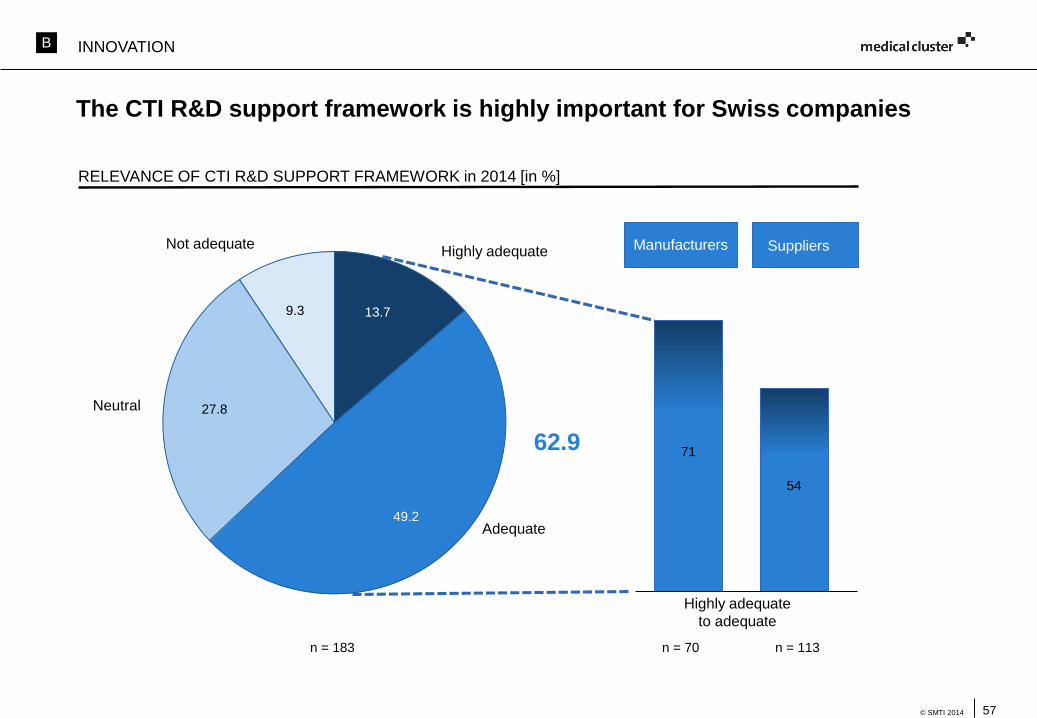
The CTI R&D support framework is highly important for Swiss companies
RELEVANCE OF CTI R&D SUPPORT FRAMEWORK in 2014 [in %]
n = 183
15%
13.7
49.2
27.8
9.3
Highly adequate
Adequate
Not adequate
Neutral
n = 70 n = 113
Highly adequate
to adequate
Manufacturers Suppliers
62.9
INNOVATIONB
58© SMTI 2014
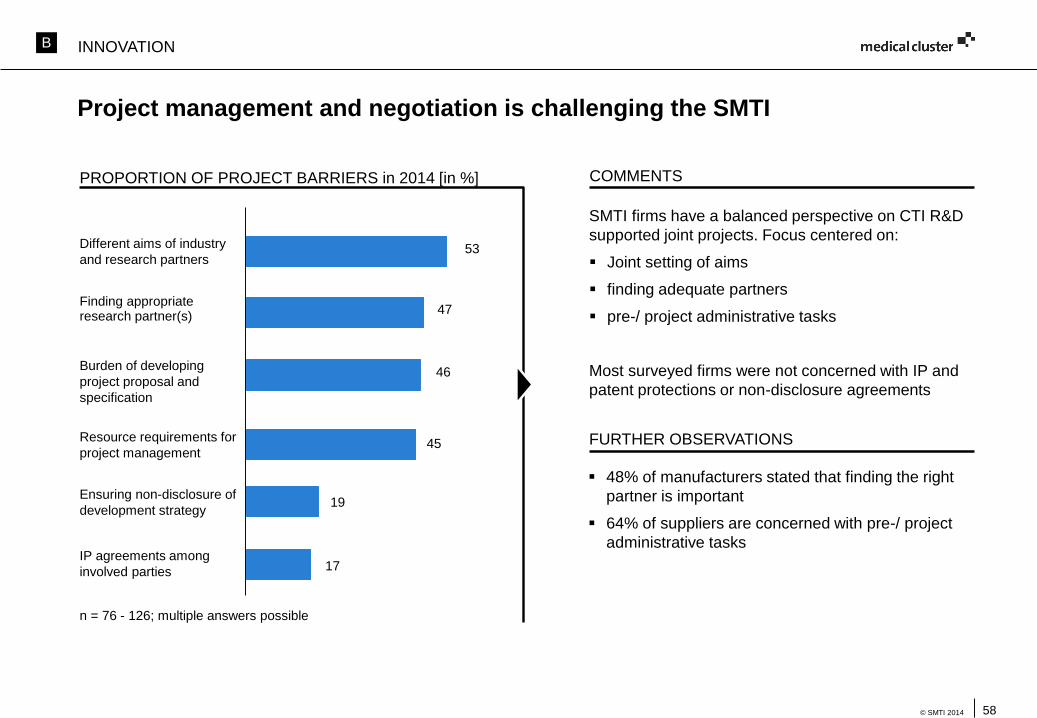
Project management and negotiation is challenging the SMTI
PROPORTION OF PROJECT BARRIERS in 2014 [in %]
n = 76 - 126; multiple answers possible
Finding appropriate research partner(s)
47
Ensuring non-disclosure of
development strategy19
IP agreements among
involved parties 17
Resource requirements for
project management45
Different aims of industry
and research partners53
Burden of developing
project proposal and
specification
46
COMMENTS
SMTI firms have a balanced perspective on CTI R&D
supported joint projects. Focus centered on:
Joint setting of aims
finding adequate partners
pre-/ project administrative tasks
Most surveyed firms were not concerned with IP and
patent protections or non-disclosure agreements
48% of manufacturers stated that finding the right
partner is important
64% of suppliers are concerned with pre-/ project
administrative tasks
FURTHER OBSERVATIONS
INNOVATIONB

C. Outlook: Trends and new opportunities
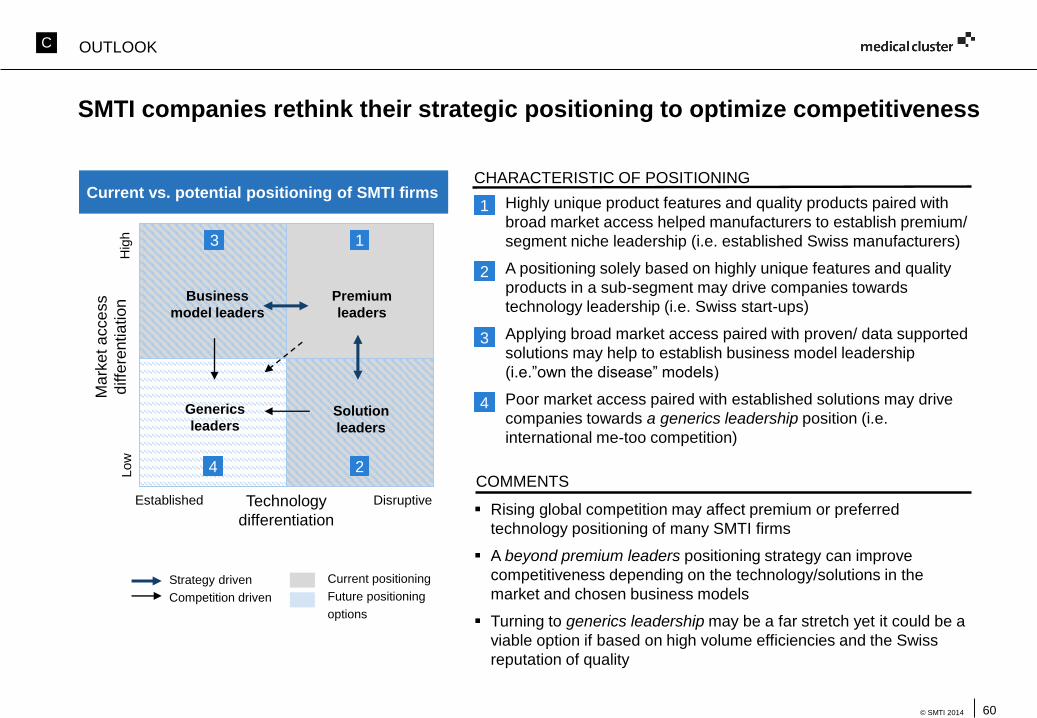
60© SMTI 2014
SMTI companies rethink their strategic positioning to optimize competitiveness
Highly unique product features and quality products paired with
broad market access helped manufacturers to establish premium/
segment niche leadership (i.e. established Swiss manufacturers)
A positioning solely based on highly unique features and quality
products in a sub-segment may drive companies towards
technology leadership (i.e. Swiss start-ups)
Applying broad market access paired with proven/ data supported
solutions may help to establish business model leadership
(i.e.”own the disease” models)
Poor market access paired with established solutions may drive
companies towards a generics leadership position (i.e.
international me-too competition)
CHARACTERISTIC OF POSITIONINGCurrent vs. potential positioning of SMTI firms
Ma
rket a
cce
ss
diffe
rentia
tion
Technology
differentiation
Hig
h
Established
Low
Disruptive
Premium
leaders
Business
model leaders
Generics
leadersSolution
leaders
Current positioning
Future positioning
options
Strategy driven
Competition driven
OUTLOOK
3 1
24
1
Rising global competition may affect premium or preferred
technology positioning of many SMTI firms
A beyond premium leaders positioning strategy can improve
competitiveness depending on the technology/solutions in the
market and chosen business models
Turning to generics leadership may be a far stretch yet it could be a
viable option if based on high volume efficiencies and the Swiss
reputation of quality
COMMENTS
2
3
4
C
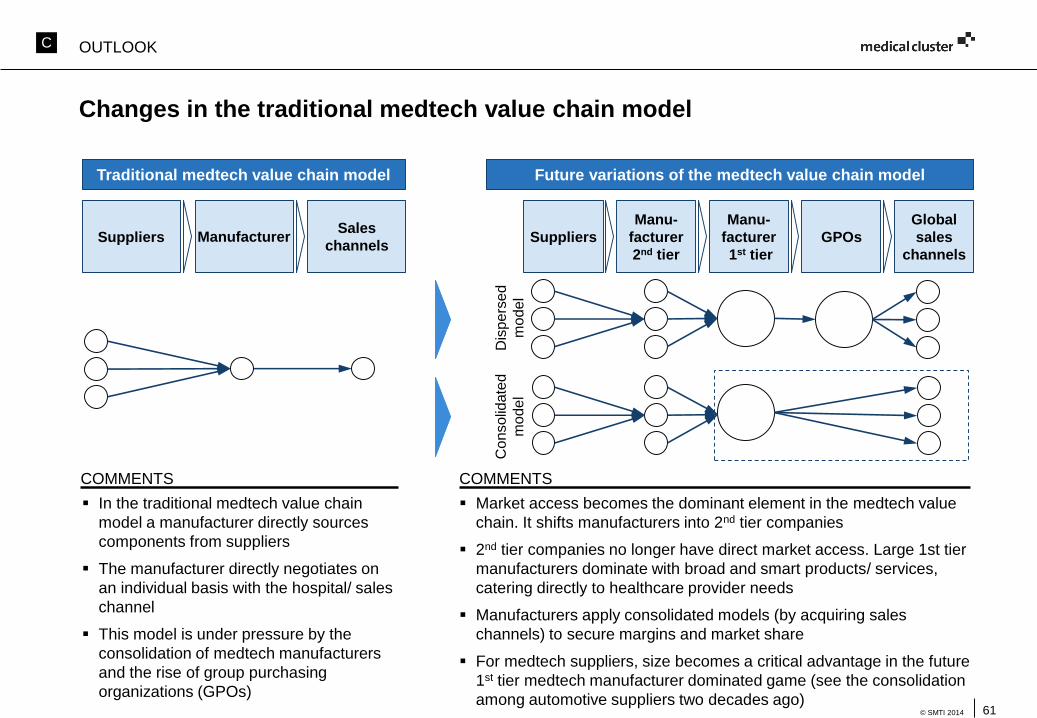
61© SMTI 2014
Changes in the traditional medtech value chain model
In the traditional medtech value chain
model a manufacturer directly sources
components from suppliers
The manufacturer directly negotiates on
an individual basis with the hospital/ sales
channel
This model is under pressure by the
consolidation of medtech manufacturers
and the rise of group purchasing
organizations (GPOs)
COMMENTS
Market access becomes the dominant element in the medtech value
chain. It shifts manufacturers into 2nd tier companies
2nd tier companies no longer have direct market access. Large 1st tier
manufacturers dominate with broad and smart products/ services,
catering directly to healthcare provider needs
Manufacturers apply consolidated models (by acquiring sales
channels) to secure margins and market share
For medtech suppliers, size becomes a critical advantage in the future
1st tier medtech manufacturer dominated game (see the consolidation
among automotive suppliers two decades ago)
COMMENTS
Suppliers ManufacturerSales
channels
Traditional medtech value chain model
Suppliers
Manu-
facturer
1st tier
Global
sales
channels
GPOs
Future variations of the medtech value chain model
Manu-
facturer
2nd tier
Co
nso
lidate
d
mo
de
l
Dis
pers
ed
model
OUTLOOKC
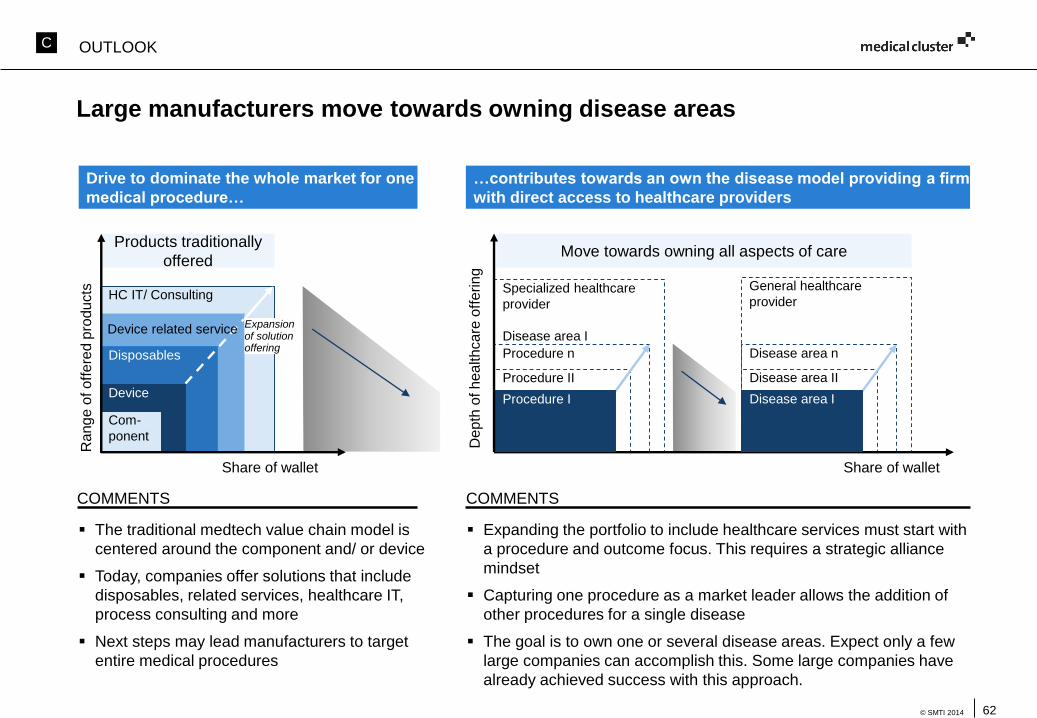
62© SMTI 2014
Products traditionally
offered
Specialized healthcare
provider
Disease area I
Procedure n
Procedure II
General healthcare
provider
Disease area n
Disease area II
HC IT/ Consulting
Disposables
Large manufacturers move towards owning disease areas
The traditional medtech value chain model is
centered around the component and/ or device
Today, companies offer solutions that include
disposables, related services, healthcare IT,
process consulting and more
Next steps may lead manufacturers to target
entire medical procedures
COMMENTS
Expanding the portfolio to include healthcare services must start with
a procedure and outcome focus. This requires a strategic alliance
mindset
Capturing one procedure as a market leader allows the addition of
other procedures for a single disease
The goal is to own one or several disease areas. Expect only a few
large companies can accomplish this. Some large companies have
already achieved success with this approach.
COMMENTS
Drive to dominate the whole market for one
medical procedure…
…contributes towards an own the disease model providing a firm
with direct access to healthcare providers
Rang
e o
f off
ere
d p
roducts
Share of walletD
epth
of h
ea
lth
care
off
erin
gShare of wallet
Expansion of solution offering
Move towards owning all aspects of care
Disease area IProcedure I
Device related service
Device
Com-
ponent
OUTLOOKC
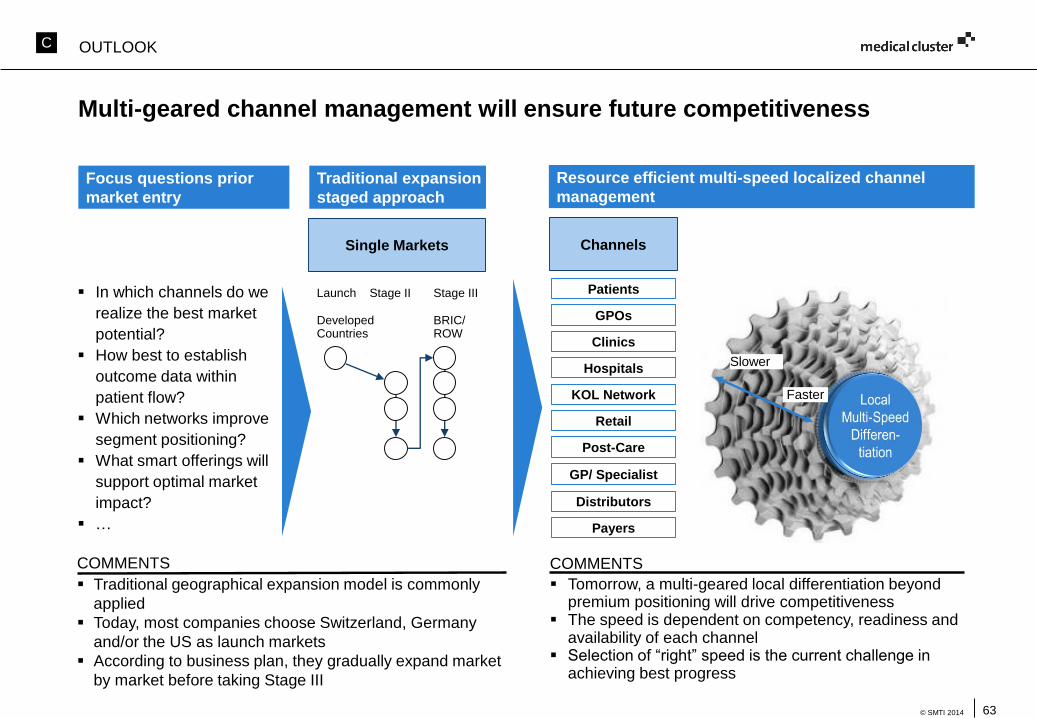
63© SMTI 2014
Multi-geared channel management will ensure future competitiveness
Traditional geographical expansion model is commonly
applied
Today, most companies choose Switzerland, Germany
and/or the US as launch markets
According to business plan, they gradually expand market
by market before taking Stage III
Tomorrow, a multi-geared local differentiation beyond premium positioning will drive competitiveness
The speed is dependent on competency, readiness and availability of each channel
Selection of “right” speed is the current challenge in achieving best progress
COMMENTS
Traditional expansion
staged approach
Resource efficient multi-speed localized channel
management
Single Markets
Developed Countries
BRIC/ROW
Launch Stage II Stage III
Focus questions prior
market entry
Faster
Slower
Patients
Post-Care
Payers
Hospitals
KOL Network
Channels
COMMENTS
Distributors
GPOs
Retail
GP/ Specialist
Clinics
In which channels do we
realize the best market
potential?
How best to establish
outcome data within
patient flow?
Which networks improve
segment positioning?
What smart offerings will
support optimal market
impact?
…
OUTLOOKC
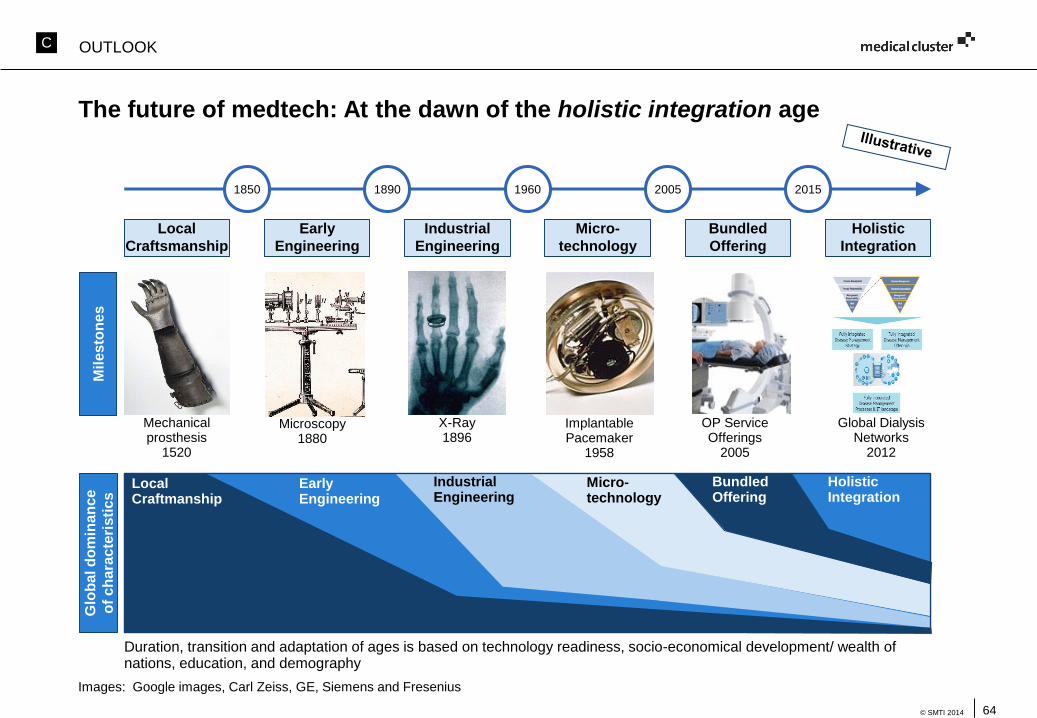
64© SMTI 2014
The future of medtech: At the dawn of the holistic integration age
Images: Google images, Carl Zeiss, GE, Siemens and Fresenius
1850 1890 1960 20152005
Mil
esto
ne
s
Early
Engineering
Industrial
Engineering
Micro-
technology
Bundled
Offering
Holistic
Integration
Mechanical prosthesis
1520
Local
Craftsmanship
Local Craftmanship
Early Engineering
Glo
ba
l d
om
inan
ce
of
ch
ara
cte
ris
tic
s
Duration, transition and adaptation of ages is based on technology readiness, socio-economical development/ wealth of nations, education, and demography
IndustrialEngineering
Micro-technology
Bundled Offering
Holistic Integration
Microscopy 1880
X-Ray1896
Implantable Pacemaker
1958
Global Dialysis Networks
2012
OP Service Offerings
2005
OUTLOOKC
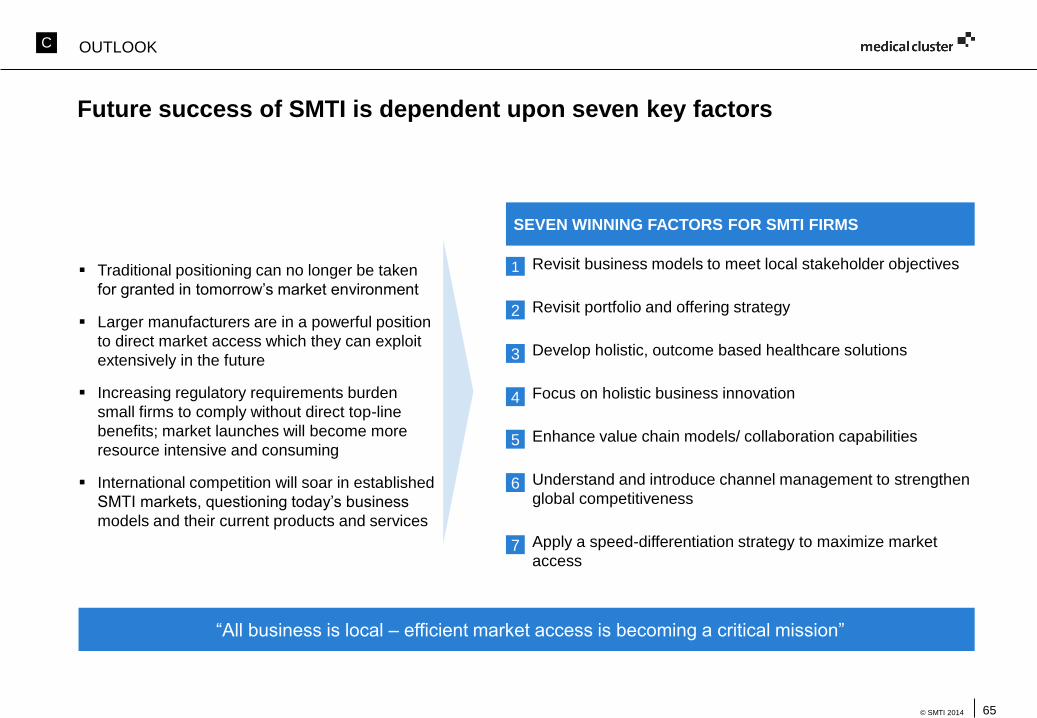
65© SMTI 2014
Future success of SMTI is dependent upon seven key factors
Traditional positioning can no longer be taken
for granted in tomorrow’s market environment
Larger manufacturers are in a powerful position
to direct market access which they can exploit
extensively in the future
Increasing regulatory requirements burden
small firms to comply without direct top-line
benefits; market launches will become more
resource intensive and consuming
International competition will soar in established
SMTI markets, questioning today’s business
models and their current products and services
“All business is local – efficient market access is becoming a critical mission”
Revisit business models to meet local stakeholder objectives
Revisit portfolio and offering strategy
Develop holistic, outcome based healthcare solutions
Focus on holistic business innovation
Enhance value chain models/ collaboration capabilities
Understand and introduce channel management to strengthen
global competitiveness
Apply a speed-differentiation strategy to maximize market
access
SEVEN WINNING FACTORS FOR SMTI FIRMS
1
2
3
4
5
6
7
OUTLOOKC

66© SMTI 2014
Appendix
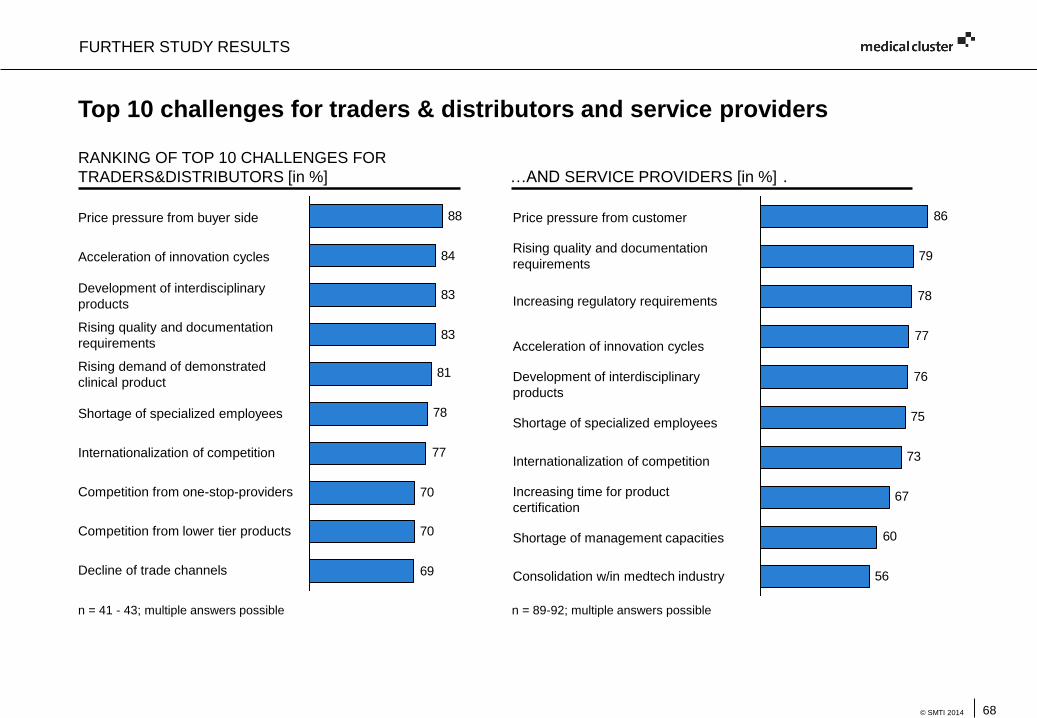
68© SMTI 2014
Top 10 challenges for traders & distributors and service providers
FURTHER STUDY RESULTS
RANKING OF TOP 10 CHALLENGES FOR
TRADERS&DISTRIBUTORS [in %] …AND SERVICE PROVIDERS [in %] .
56
60
67
73
75
76
77
78
79
86
69
70
70
77
78
81
83
83
84
88
n = 89-92; multiple answers possiblen = 41 - 43; multiple answers possible
Price pressure from buyer side
Acceleration of innovation cycles
Development of interdisciplinary
products
Rising quality and documentation
requirements
Rising demand of demonstrated
clinical product
Shortage of specialized employees
Internationalization of competition
Competition from one-stop-providers
Competition from lower tier products
Decline of trade channels
Price pressure from customer
Rising quality and documentation
requirements
Increasing regulatory requirements
Acceleration of innovation cycles
Development of interdisciplinary
products
Shortage of specialized employees
Internationalization of competition
Increasing time for product
certification
Shortage of management capacities
Consolidation w/in medtech industry
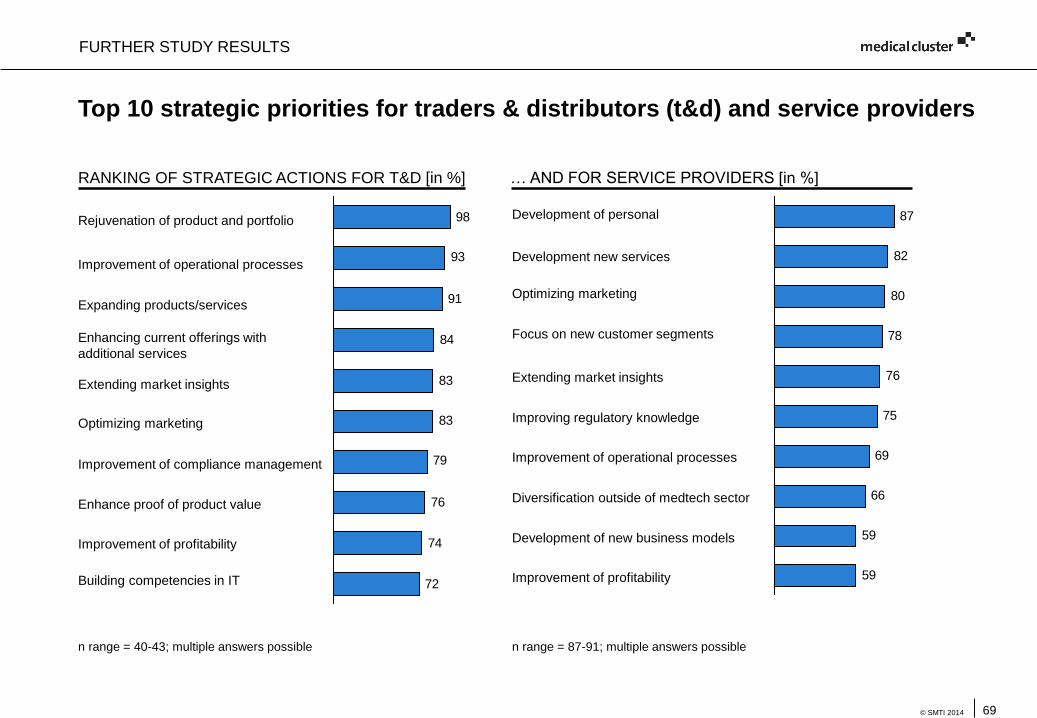
69© SMTI 2014
Top 10 strategic priorities for traders & distributors (t&d) and service providers
n range = 40-43; multiple answers possible n range = 87-91; multiple answers possible
RANKING OF STRATEGIC ACTIONS FOR T&D [in %] … AND FOR SERVICE PROVIDERS [in %]
72
74
76
79
83
83
84
91
93
98
59
59
66
69
75
76
78
80
82
87Rejuvenation of product and portfolio
Improvement of operational processes
Expanding products/services
Enhancing current offerings with
additional services
Extending market insights
Optimizing marketing
Improvement of compliance management
Enhance proof of product value
Improvement of profitability
Building competencies in IT
Development of personal
Development new services
Optimizing marketing
Focus on new customer segments
Extending market insights
Improving regulatory knowledge
Improvement of operational processes
Diversification outside of medtech sector
Development of new business models
Improvement of profitability
FURTHER STUDY RESULTS
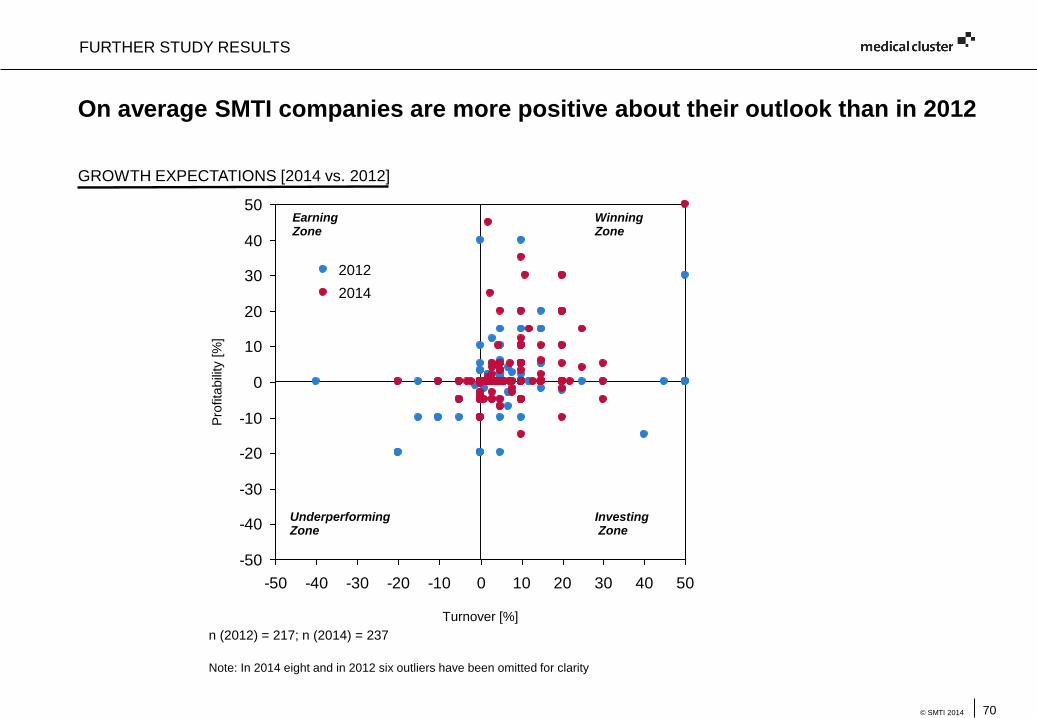
70© SMTI 2014
On average SMTI companies are more positive about their outlook than in 2012
n (2012) = 217; n (2014) = 237
InvestingZone
UnderperformingZone
EarningZone
Winning Zone
GROWTH EXPECTATIONS [2014 vs. 2012]
Note: In 2014 eight and in 2012 six outliers have been omitted for clarity
-50
-40
-30
-20
-10
0
10
20
30
40
50
-50 -40 -30 -20 -10 0 10 20 30 40 50
Turnover [%]
Pro
fita
bili
ty [
%]
2014
2012
FURTHER STUDY RESULTS
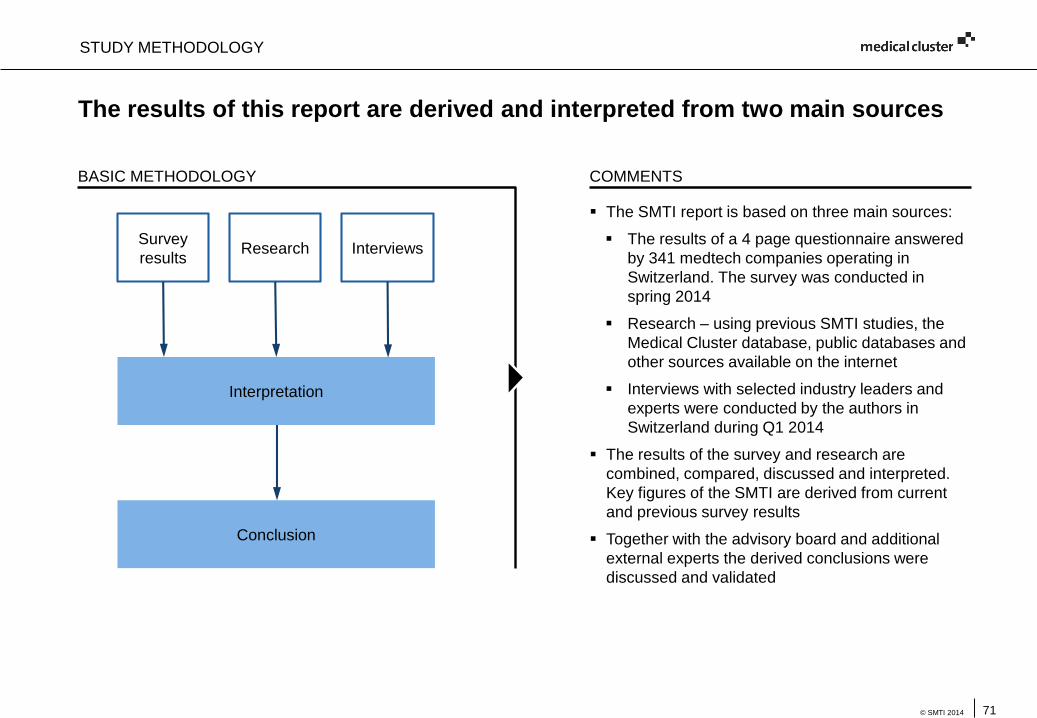
71© SMTI 2014
The results of this report are derived and interpreted from two main sources
STUDY METHODOLOGY
BASIC METHODOLOGY COMMENTS
The SMTI report is based on three main sources:
The results of a 4 page questionnaire answered
by 341 medtech companies operating in
Switzerland. The survey was conducted in
spring 2014
Research – using previous SMTI studies, the
Medical Cluster database, public databases and
other sources available on the internet
Interviews with selected industry leaders and
experts were conducted by the authors in
Switzerland during Q1 2014
The results of the survey and research are
combined, compared, discussed and interpreted.
Key figures of the SMTI are derived from current
and previous survey results
Together with the advisory board and additional
external experts the derived conclusions were
discussed and validated
Survey
resultsResearch
Interpretation
Conclusion
Interviews
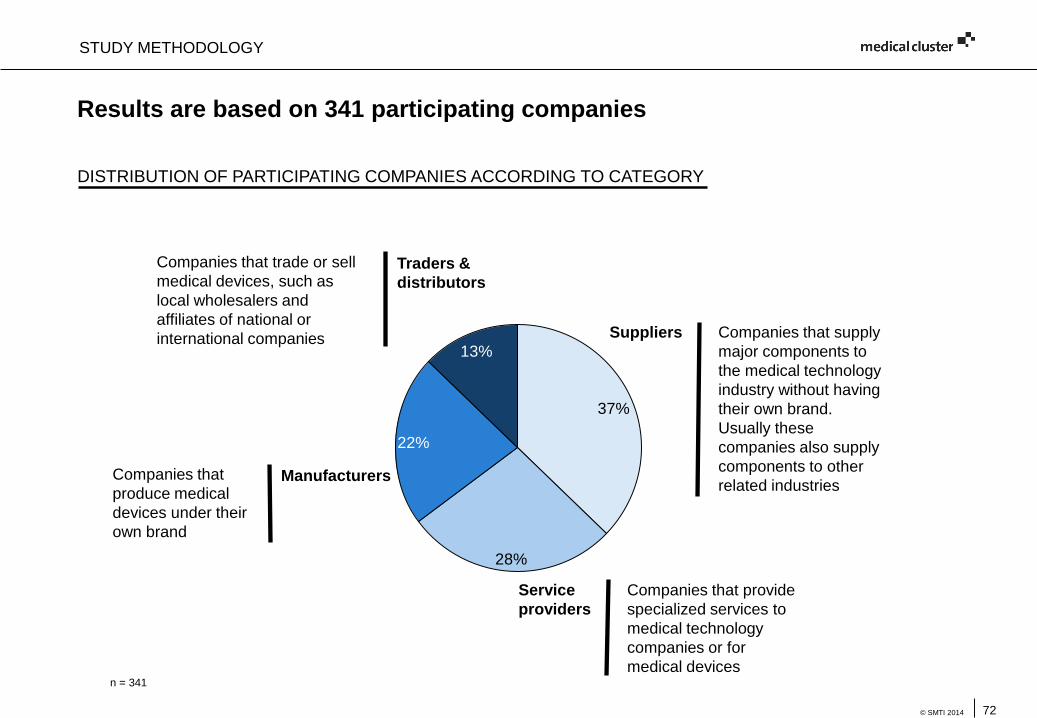
72© SMTI 2014
Results are based on 341 participating companies
Manufacturers
Suppliers
Companies that
produce medical
devices under their
own brand
Companies that supply
major components to
the medical technology
industry without having
their own brand.
Usually these
companies also supply
components to other
related industries
Service
providers
Traders &
distributors
Companies that provide
specialized services to
medical technology
companies or for
medical devices
Companies that trade or sell
medical devices, such as
local wholesalers and
affiliates of national or
international companies
n = 341
DISTRIBUTION OF PARTICIPATING COMPANIES ACCORDING TO CATEGORY
37%
13%
22%
28%
STUDY METHODOLOGY
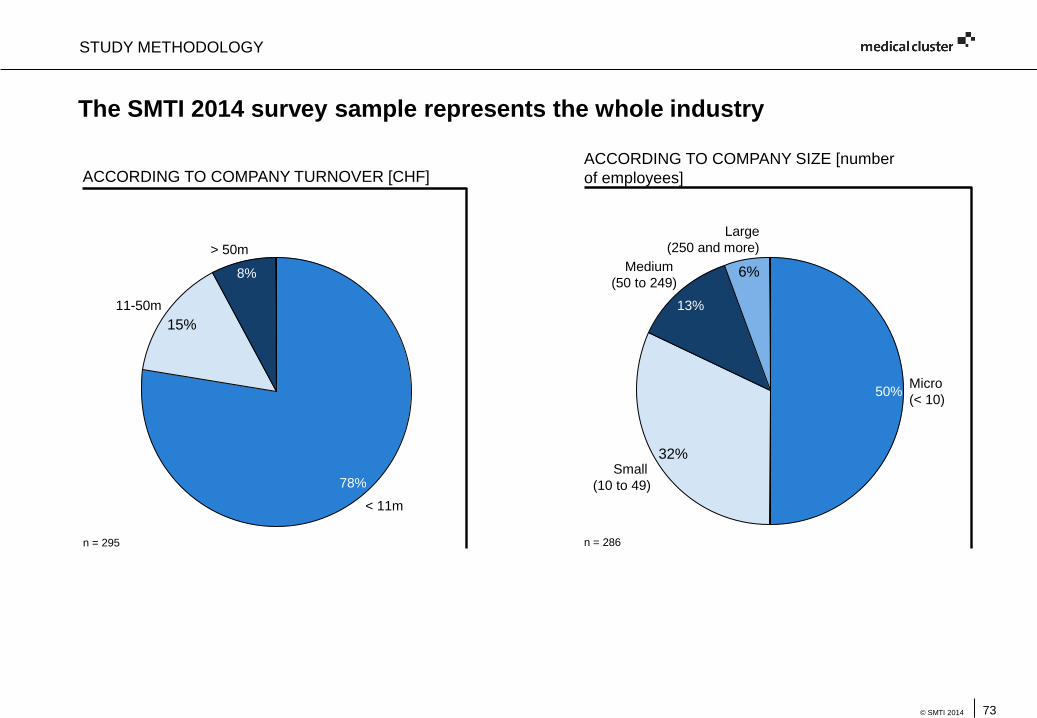
73© SMTI 2014
The SMTI 2014 survey sample represents the whole industry
11-50m
15%
< 11m
> 50m
8%
78%
ACCORDING TO COMPANY TURNOVER [CHF]ACCORDING TO COMPANY SIZE [number
of employees]
Medium
(50 to 249)
13%
Large
(250 and more)
6%
Small
(10 to 49)
Micro
(< 10)50%
32%
n = 295 n = 286
STUDY METHODOLOGY
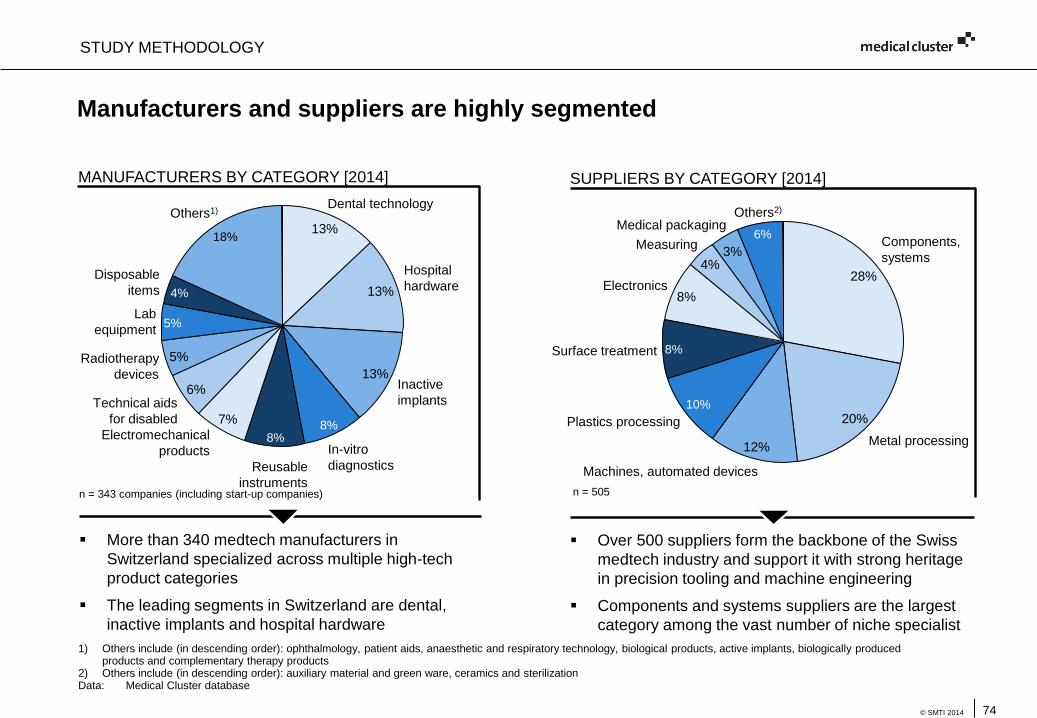
74© SMTI 2014
Manufacturers and suppliers are highly segmented
MANUFACTURERS BY CATEGORY [2014]
10%
12%
20%
Machines, automated devices
Metal processing
28%
Components,
systems
Plastics processing
6%
Others2)
Medical packaging
Measuring
4%
Electronics8%
Surface treatment 8%
n = 505
More than 340 medtech manufacturers in
Switzerland specialized across multiple high-tech
product categories
The leading segments in Switzerland are dental,
inactive implants and hospital hardware
Over 500 suppliers form the backbone of the Swiss
medtech industry and support it with strong heritage
in precision tooling and machine engineering
Components and systems suppliers are the largest
category among the vast number of niche specialist
SUPPLIERS BY CATEGORY [2014]
18%
Disposable
items 4%
Others1)
Lab
equipment
8%
5%
8%
13%
6% Inactive
implants
Dental technology
Electromechanical
products
13%
13%
Hospital
hardware
Radiotherapy
devices
Technical aids
for disabled 7%
Reusable
instruments
5%
In-vitro
diagnostics
n = 343 companies (including start-up companies)
1) Others include (in descending order): ophthalmology, patient aids, anaesthetic and respiratory technology, biological products, active implants, biologically produced products and complementary therapy products
2) Others include (in descending order): auxiliary material and green ware, ceramics and sterilizationData: Medical Cluster database
3%
STUDY METHODOLOGY
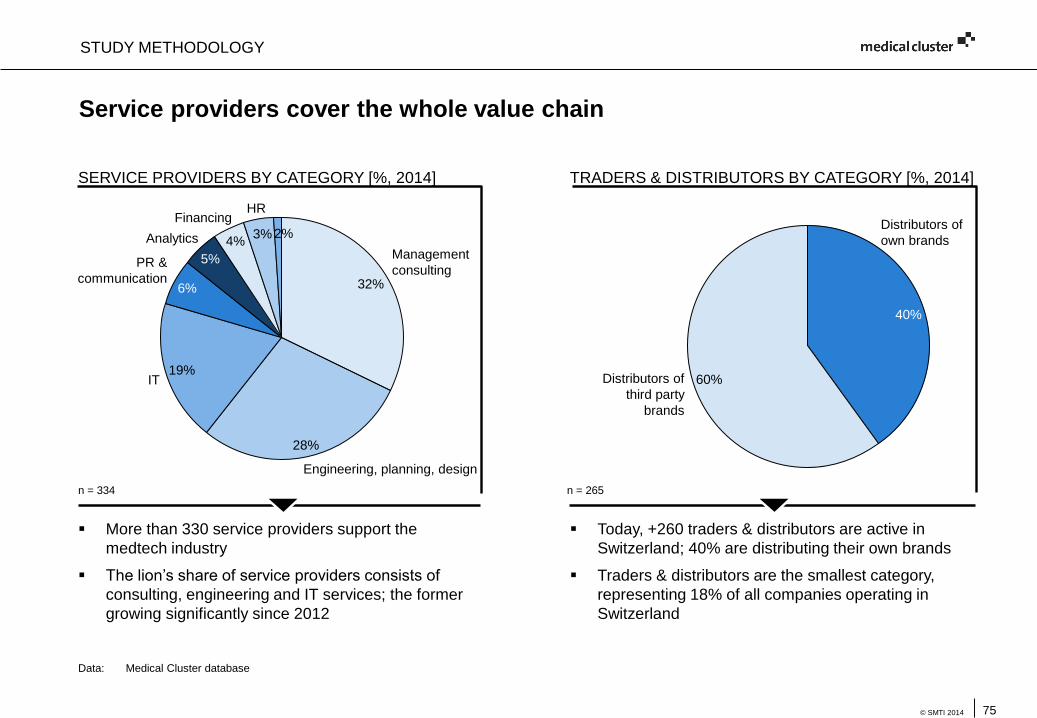
75© SMTI 2014
Service providers cover the whole value chain
SERVICE PROVIDERS BY CATEGORY [%, 2014] TRADERS & DISTRIBUTORS BY CATEGORY [%, 2014]
n = 334 n = 265
IT19%
Management
consulting32%
Engineering, planning, design
28%
Financing
Analytics
5%PR &
communication6%
HR
4%
More than 330 service providers support the
medtech industry
The lion’s share of service providers consists of
consulting, engineering and IT services; the former
growing significantly since 2012
Today, +260 traders & distributors are active in
Switzerland; 40% are distributing their own brands
Traders & distributors are the smallest category,
representing 18% of all companies operating in
Switzerland
Distributors of
third party
brands
60%
Distributors of
own brands
40%
Data: Medical Cluster database
3% 2%
STUDY METHODOLOGY
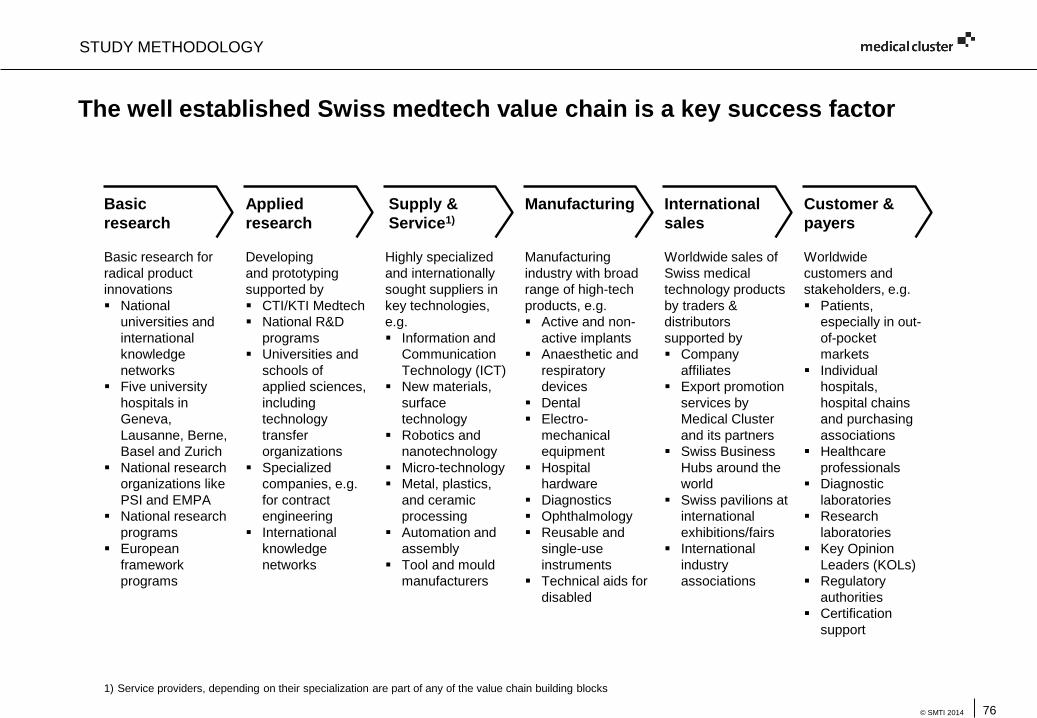
76© SMTI 2014
Basic research for
radical product
innovations
National
universities and
international
knowledge
networks
Five university
hospitals in
Geneva,
Lausanne, Berne,
Basel and Zurich
National research
organizations like
PSI and EMPA
National research
programs
European
framework
programs
Developing
and prototyping
supported by
CTI/KTI Medtech
National R&D
programs
Universities and
schools of
applied sciences,
including
technology
transfer
organizations
Specialized
companies, e.g.
for contract
engineering
International
knowledge
networks
Highly specialized
and internationally
sought suppliers in
key technologies,
e.g.
Information and
Communication
Technology (ICT)
New materials,
surface
technology
Robotics and
nanotechnology
Micro-technology
Metal, plastics,
and ceramic
processing
Automation and
assembly
Tool and mould
manufacturers
Manufacturing
industry with broad
range of high-tech
products, e.g.
Active and non-
active implants
Anaesthetic and
respiratory
devices
Dental
Electro-
mechanical
equipment
Hospital
hardware
Diagnostics
Ophthalmology
Reusable and
single-use
instruments
Technical aids for
disabled
Worldwide sales of
Swiss medical
technology products
by traders &
distributors
supported by
Company
affiliates
Export promotion
services by
Medical Cluster
and its partners
Swiss Business
Hubs around the
world
Swiss pavilions at
international
exhibitions/fairs
International
industry
associations
Applied
research
Supply &
Service1)
Manufacturing International
sales
Customer &
payers
Worldwide
customers and
stakeholders, e.g.
Patients,
especially in out-
of-pocket
markets
Individual
hospitals,
hospital chains
and purchasing
associations
Healthcare
professionals
Diagnostic
laboratories
Research
laboratories
Key Opinion
Leaders (KOLs)
Regulatory
authorities
Certification
support
Basic
research
1) Service providers, depending on their specialization are part of any of the value chain building blocks
The well established Swiss medtech value chain is a key success factor
STUDY METHODOLOGY
77© SMTI 2014
The Innovation Promotion Agency CTI – From Science to Market
Data: CTI/KTI
In 2013, the CTI assessed a total of 643 R&D funding applications
Experts from science and industry approved 331 projects
Nearly 10% of projects approved were in medtech
30 entrepreneurs received the CTI Start-up Label in 2013.
13% of start-up companies enrolled in the CTI Start-up and Entrepreneurship program are in
medtech
Successfully implemented in 2013, the CTI now operates with 13 innovation mentors that
inform SMEs about innovation funding opportunities in Switzerland
The CTI has received CHF 72 million for establishing the Swiss Competence Centers for
Energy Research (SCCER) in seven action areas.
The CTI is the Confederation’s Innovation Promotion Agency
CTI lends support to:
R&D projects relating to scientific innovations in all disciplines
Coaching and the development of start-up companies
Optimization of knowledge and technology transfer
Key Figures
PARTNERS
78© SMTI 2014
FASMED is the umbrella organisation of the Swiss medical technology industry and
has around 230 members
Aims: FASMED works toward maintaining and promoting market-based structures in the national
healthcare in order to enable the medical technology sector to contribute to high-quality care.
Range of services:
Representation of political interests through statements, position papers and PR work, highlighting
of issues and cultivation of contacts with authorities, administration and partners, media and the
public
Information and advice on health- and sector-specific issues, economic policy as well as legal and
regulatory matters
Platform for the exchange of ideas and experiences and further training
PARTNERS
We believe that innovation is key to success. Our innovations secure clients a lasting competitive
advantage and enable them to adapt to the ever-changing business environment. Loyal clients trust
our entrepreneurial culture and ability to combine business acumen, deep technical expertise,
creativity and passion for high-quality work. Our broad industry expertise coupled with specialized
skills are crucial elements for every successful product and technology development project.
5+ decades of bringing innovation to a broad range of industries and technology fields.
Our 3330 engineers and scientists compose our skilled cross-functional development teams.
We support clients from the inception of the idea through to the market launch.
The intellectual property rights for our innovations are assigned to clients.
Creativity and strong project execution enable clients to move into uncharted territory.
Our development centers utilize cutting-edge engineering tools and state-of-the-art infrastructure.
Helbling Technik, Innovation, together we do it.
79© SMTI 2014
Switzerland Global Enterprise (S-GE) works all over the world to support entrepreneurs and
promote Switzerland as a business location. Its role as a center of excellence for
internationalization is to foster exports, imports and investments, to help clients develop new
potential for their international businesses and to strengthen Switzerland as an economic
hub. S-GE is a strong and trusted partner for its clients, the cantons and the Swiss
government, with a global network of experienced advisers and experts.
S-GE is represented abroad by Swiss Business Hubs. The majority of these local teams are
based at a Swiss Embassy or Swiss Consulate-General. Following an initial consulting
session in Switzerland, the Swiss Business Hubs are the next point of contact with S-GE in
the export country concerned. All hubs have a first-rate network of contacts abroad on
account of their official status. In addition, these hubs are responsible for promoting
Switzerland as a business location abroad.
Switzerland Global Enterprise
PARTNERS
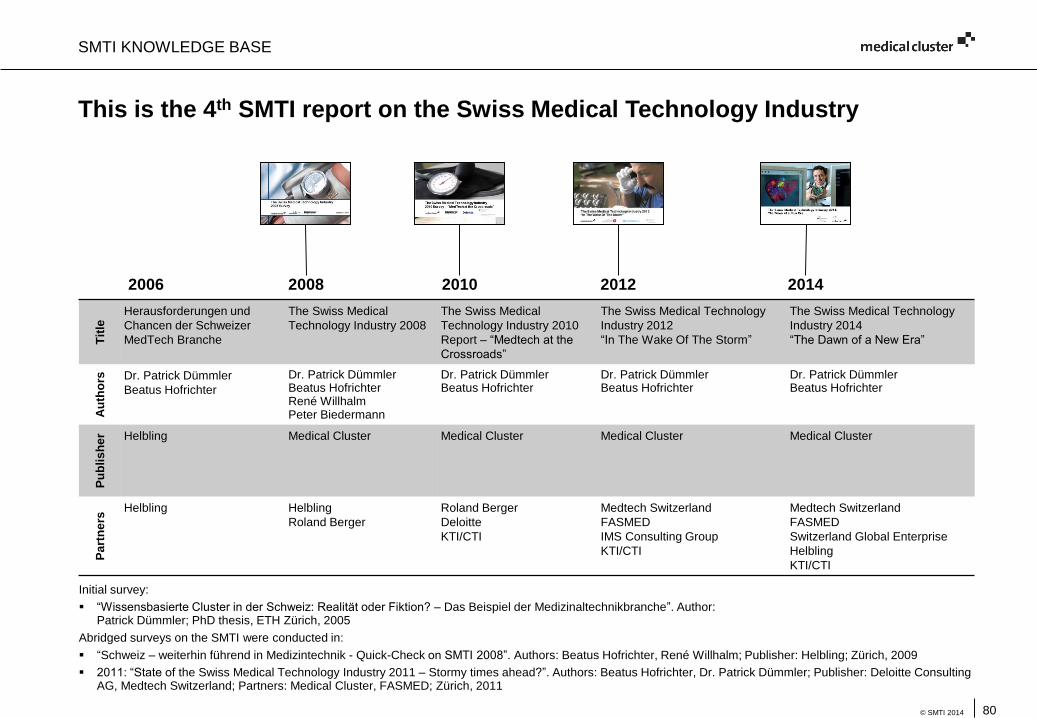
80© SMTI 2014
This is the 4th SMTI report on the Swiss Medical Technology Industry
2006 2008 2010 2012
Tit
le
Herausforderungen und
Chancen der Schweizer
MedTech Branche
The Swiss Medical
Technology Industry 2008
The Swiss Medical
Technology Industry 2010
Report – “Medtech at the
Crossroads”
The Swiss Medical Technology
Industry 2012
“In The Wake Of The Storm”
The Swiss Medical Technology
Industry 2014
“The Dawn of a New Era”
Au
tho
rs Dr. Patrick Dümmler
Beatus Hofrichter
Dr. Patrick DümmlerBeatus HofrichterRené WillhalmPeter Biedermann
Dr. Patrick DümmlerBeatus Hofrichter
Dr. Patrick DümmlerBeatus Hofrichter
Dr. Patrick DümmlerBeatus Hofrichter
Pu
bli
sh
er Helbling Medical Cluster Medical Cluster Medical Cluster Medical Cluster
Pa
rtn
ers
Helbling Helbling
Roland Berger
Roland Berger
Deloitte
KTI/CTI
Medtech Switzerland
FASMED
IMS Consulting Group
KTI/CTI
Medtech Switzerland
FASMED
Switzerland Global Enterprise
Helbling
KTI/CTI
SMTI KNOWLEDGE BASE
2014
Initial survey:
“Wissensbasierte Cluster in der Schweiz: Realität oder Fiktion? – Das Beispiel der Medizinaltechnikbranche”. Author: Patrick Dümmler; PhD thesis, ETH Zürich, 2005
Abridged surveys on the SMTI were conducted in:
“Schweiz – weiterhin führend in Medizintechnik - Quick-Check on SMTI 2008”. Authors: Beatus Hofrichter, René Willhalm; Publisher: Helbling; Zürich, 2009
2011: “State of the Swiss Medical Technology Industry 2011 – Stormy times ahead?”. Authors: Beatus Hofrichter, Dr. Patrick Dümmler; Publisher: Deloitte Consulting AG, Medtech Switzerland; Partners: Medical Cluster, FASMED; Zürich, 2011
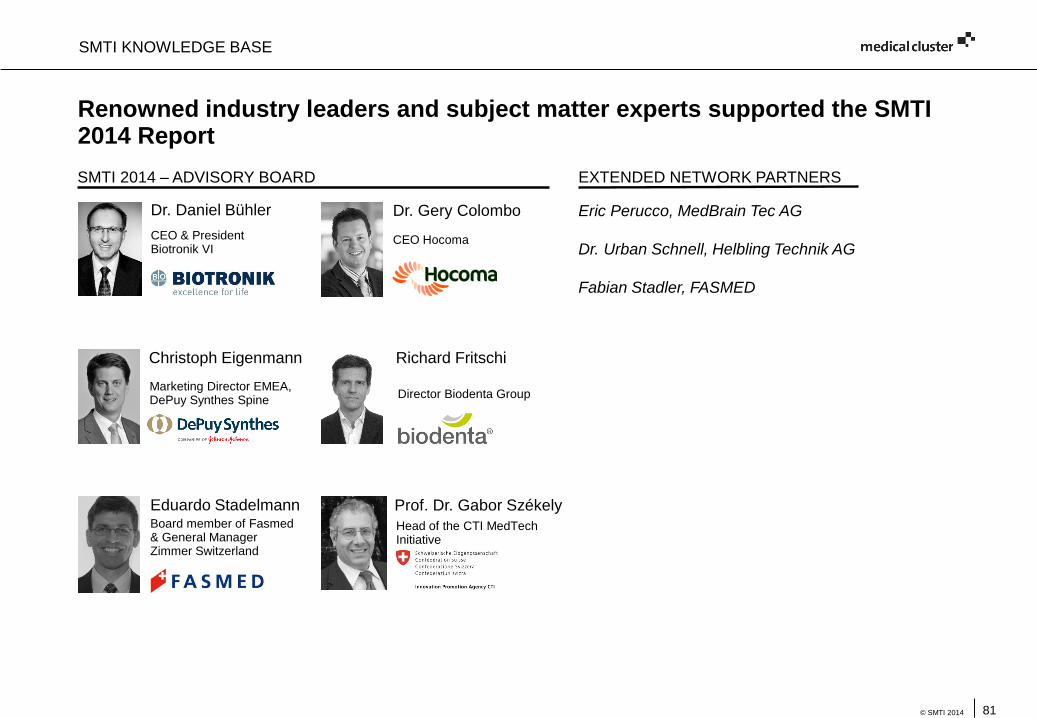
81© SMTI 2014
Eric Perucco, MedBrain Tec AG
Dr. Urban Schnell, Helbling Technik AG
Fabian Stadler, FASMED
Renowned industry leaders and subject matter experts supported the SMTI 2014 Report
SMTI 2014 – ADVISORY BOARD
Prof. Dr. Gabor Székely
Head of the CTI MedTechInitiative
Richard Fritschi
Director Biodenta Group
Christoph Eigenmann
Marketing Director EMEA, DePuy Synthes Spine
Dr. Gery Colombo
CEO Hocoma
SMTI KNOWLEDGE BASE
Eduardo Stadelmann
Dr. Daniel Bühler
CEO & PresidentBiotronik VI
Board member of Fasmed& General Manager Zimmer Switzerland
EXTENDED NETWORK PARTNERS
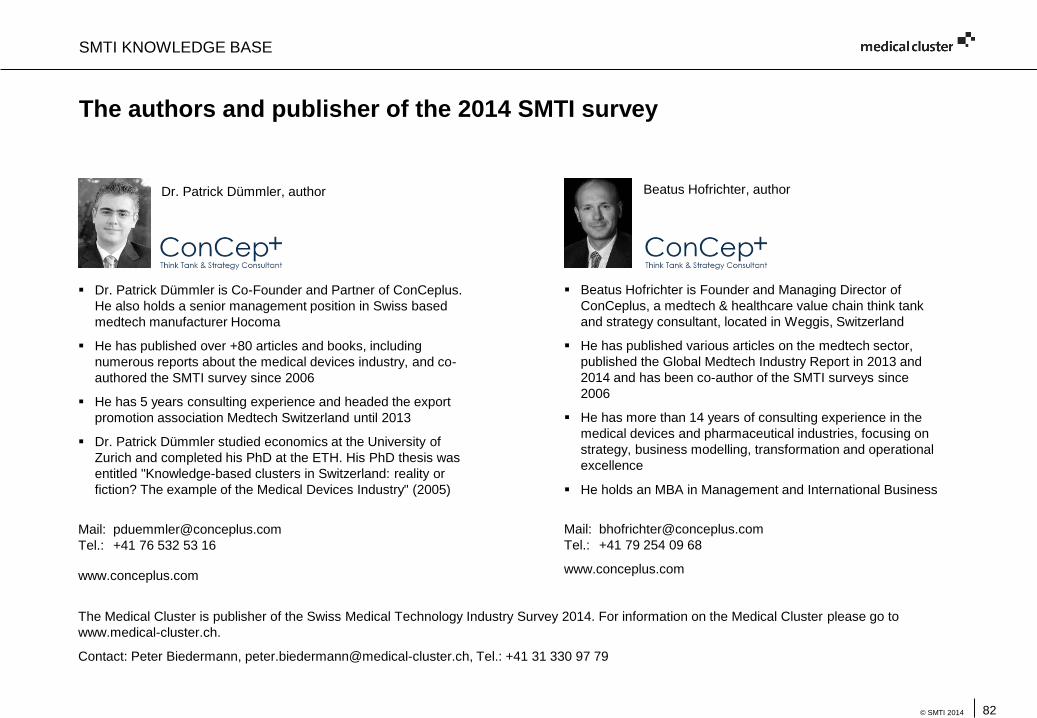
82© SMTI 2014
The authors and publisher of the 2014 SMTI survey
Dr. Patrick Dümmler, author
Dr. Patrick Dümmler is Co-Founder and Partner of ConCeplus.
He also holds a senior management position in Swiss based
medtech manufacturer Hocoma
He has published over +80 articles and books, including
numerous reports about the medical devices industry, and co-
authored the SMTI survey since 2006
He has 5 years consulting experience and headed the export
promotion association Medtech Switzerland until 2013
Dr. Patrick Dümmler studied economics at the University of
Zurich and completed his PhD at the ETH. His PhD thesis was
entitled "Knowledge-based clusters in Switzerland: reality or
fiction? The example of the Medical Devices Industry" (2005)
Mail: [email protected]
Tel.: +41 76 532 53 16
www.conceplus.com
Beatus Hofrichter is Founder and Managing Director of
ConCeplus, a medtech & healthcare value chain think tank
and strategy consultant, located in Weggis, Switzerland
He has published various articles on the medtech sector,
published the Global Medtech Industry Report in 2013 and
2014 and has been co-author of the SMTI surveys since
2006
He has more than 14 years of consulting experience in the
medical devices and pharmaceutical industries, focusing on
strategy, business modelling, transformation and operational
excellence
He holds an MBA in Management and International Business
Beatus Hofrichter, author
Mail: [email protected]
Tel.: +41 79 254 09 68
www.conceplus.com
SMTI KNOWLEDGE BASE
The Medical Cluster is publisher of the Swiss Medical Technology Industry Survey 2014. For information on the Medical Cluster please go to
www.medical-cluster.ch.
Contact: Peter Biedermann, [email protected], Tel.: +41 31 330 97 79
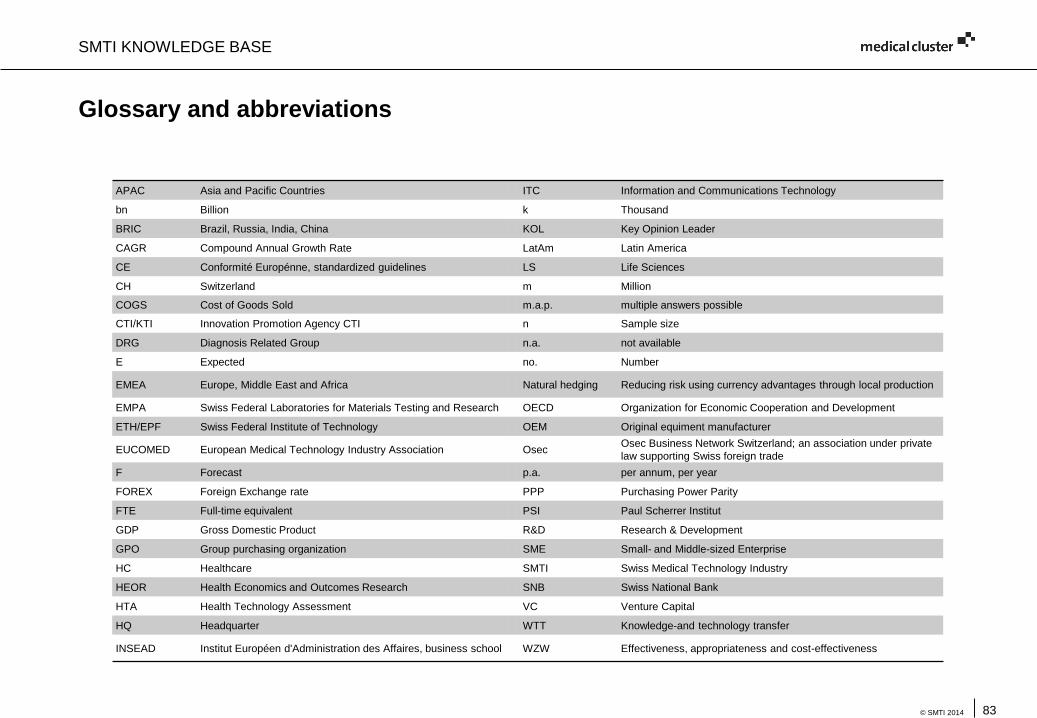
83© SMTI 2014
Glossary and abbreviations
APAC Asia and Pacific Countries ITC Information and Communications Technology
bn Billion k Thousand
BRIC Brazil, Russia, India, China KOL Key Opinion Leader
CAGR Compound Annual Growth Rate LatAm Latin America
CE Conformité Europénne, standardized guidelines LS Life Sciences
CH Switzerland m Million
COGS Cost of Goods Sold m.a.p. multiple answers possible
CTI/KTI Innovation Promotion Agency CTI n Sample size
DRG Diagnosis Related Group n.a. not available
E Expected no. Number
EMEA Europe, Middle East and Africa Natural hedging Reducing risk using currency advantages through local production
EMPA Swiss Federal Laboratories for Materials Testing and Research OECD Organization for Economic Cooperation and Development
ETH/EPF Swiss Federal Institute of Technology OEM Original equiment manufacturer
EUCOMED European Medical Technology Industry Association OsecOsec Business Network Switzerland; an association under private
law supporting Swiss foreign trade
F Forecast p.a. per annum, per year
FOREX Foreign Exchange rate PPP Purchasing Power Parity
FTE Full-time equivalent PSI Paul Scherrer Institut
GDP Gross Domestic Product R&D Research & Development
GPO Group purchasing organization SME Small- and Middle-sized Enterprise
HC Healthcare SMTI Swiss Medical Technology Industry
HEOR Health Economics and Outcomes Research SNB Swiss National Bank
HTA Health Technology Assessment VC Venture Capital
HQ Headquarter WTT Knowledge-and technology transfer
INSEAD Institut Européen d'Administration des Affaires, business school WZW Effectiveness, appropriateness and cost-effectiveness
SMTI KNOWLEDGE BASE
84© SMTI 2014
Disclaimer
No part of this publication may be reprinted, sold, redistributed, stored in a retrieval system or transmitted in any form by any means, electronic,
mechanical, photocopying, recording or otherwise, without the prior written permission of the publisher and the authors.
This report was written in the summer of 2014 involving 341 companies in the field of medical technology in Switzerland. It makes use of the database of
the Medical Cluster, Advisory Board input, additional expert interviews and desk research. The statistical data presented reflects the opinion of the
participating companies at the time of the data gathering (March to May 2014) and may therefore not reflect the current market environment at the time of
reading.
The pictures in this report have been used with the kind permission of Matthias Peterhans,CAScination AG (p. 1), Jonas Frey (p. 4), Medartis AG (p. 8 and
67), ALPGIS AG (p. 19), Forteq Nidau AG (p. 35).
The parties involved in the study confirm that the collection, analysis and interpretation of all data was carried out carefully and anonymously. This
publication contains information in summary form and is therefore intended for general guidance only. The publisher and the authors cannot accept any
responsibility for loss occasioned to any person acting or refraining from action as a result of any material in this publication
© All rights relating to this publication are the exclusive property of the publisher, authors and their respective companies (Medical Cluster, Dr. Patrick
Dümmler, Beatus Hofrichter)
Publisher of the SMTI 2014 Sponsors of the SMTI 2014
Beatus Hofrichter
Authors of the SMTI 2014
Dr. Patrick Dümmler