the structure of an exhumed intraplate seismogenic fault in crystalline basement
TRANSCRIPT
Tectonophysics 599 (2013) 29–44
Contents lists available at SciVerse ScienceDirect
Tectonophysics
j ourna l homepage: www.e lsev ie r .com/ locate / tecto
The structure of an exhumed intraplate seismogenic fault in crystalline basement
Steven A.F. Smith a,⁎, Andrea Bistacchi b, Thomas M. Mitchell a,c, Silvia Mittempergher d, Giulio Di Toro a,d
a Istituto Nazionale di Geofisica e Vulcanologia (INGV), Via di Vigna Murata 605, 00143, Rome, Italyb Dipartimento di Scienze Geologiche e Geotecnologie, Università di Milano Bicocca, Piazza delle Scienza 4, 20126, Milan, Italyc Department of Geosciences, Ruhr-Universität Bochum, 44780, Bochum, Germanyd Dipartimento di Geoscience, Università di Padova, Via G. Gradenigo 6, 35131, Padua, Italy
⁎ Corresponding author. Tel.: +39 0651 860 730.E-mail address: [email protected] (S.A.F. Smith).
0040-1951/$ – see front matter © 2013 Elsevier B.V. Allhttp://dx.doi.org/10.1016/j.tecto.2013.03.031
a b s t r a c t
a r t i c l e i n f oArticle history:Received 10 January 2013Received in revised form 13 March 2013Accepted 27 March 2013Available online 6 April 2013
Keywords:Fault structureFracture damageFluid flowAlterationCataclasiteAdamello
The 600 m-thick Gole Larghe Fault Zone (GLFZ) is hosted in jointed crystalline basement and exposed acrossglacier-polished outcrops in the Italian Alps. Ancient seismicity is attested by the widespread occurrence ofcataclasites associated with pseudotachylytes (solidified frictional melts) formed at 9–11 km depth and am-bient temperatures of 250–300 °C. Previous work focused on the southern part of the fault zone; here wequantitatively document fault zone structure across the full width of the GLFZ and surrounding tonalitehost rocks by using a combination of structural line transects and image analysis of samples collected acrossfault strike. These new datasets indicate that the GLFZ has a broadly symmetric across-strike damage struc-ture and contains distinct southern, central and northern zones distinguished by large variations in fracturedensity, distribution of pseudotachylytes, volume of fault rock materials, and microfracture sealing character-istics. The c. 100 m wide central zone is bound by two thick (~2 m) and laterally continuous (>1 km)protocataclastic to ultracataclastic horizons.Within and immediately surrounding the central zone, fracture den-sity is relatively high due to cataclastic fault–fracture networks that reworked earlier-formed pseudotachylytes.The fault–fracture networks were associated with pervasive microcracking and fluid–rock interaction, resultingin the development of a c. 200 m thick alteration zone delimited by lobate fluid infiltration fronts. In the c. 250 mthick southern and northern zones, fracture densities aremuch lower and pseudotachylytes systematically over-print cataclastic faults that exploited pre-existing magmatic cooling joints. Analysis of the structure of the GLFZsuggests that it shares certain characteristics with the seismogenic source responsible for the 2002 Au SableForks intraplate earthquake sequence in the northeastern USA, including seismicity distributed across a faultzone 500–1000 m thick and large (>100 MPa) static stress drops associated with frictional melting.
© 2013 Elsevier B.V. All rights reserved.
1. Introduction
Current understanding of seismogenic fault zone structure is basedprimarily on field and laboratory analysis of exhumed fault zones(e.g. Chester et al., 2004; Faulkner et al., 2003; Sibson, 1983), geo-physical measurements of fault zone properties (e.g. seismic wavevelocities, Ben-Zion, 1998; Cochran et al., 2009), and the results of dril-ling projects that intersect active faults at depths b3.5 km (e.g. Alpinefault drilling project, Sutherland et al., 2012; Chelungpu fault drillingproject, Boullier et al., 2009; San Andreas Fault Observatory at Depth,Zoback et al., 2011; Wenchuan fault drilling project, Li et al., 2012).One of the clearest outcomes from these studies is that fault zone struc-ture and the dominant fault rock associations vary considerably withdepth, fault displacement, and host rock lithology (for recent reviewssee Faulkner et al., 2010;Wibberley et al., 2008). Additionally, the phys-ical properties of fault zones may transiently change as strain rate and
rights reserved.
fluid availability evolve during the seismic cycle (e.g. Gratier andGueydan, 2007; Gratier et al., 2003).
Documenting fault zone structure in the depth range 7–15 km isparticularly relevant in terms of earthquake mechanics, as this repre-sents the typical depth range of earthquake nucleation in “normal”continental crust (depending on tectonic regime, rock composition,temperature gradient etc; Scholz, 2002; Sibson, 1983). This depthrange is currently out of reach of fault drilling projects, but a pictureof seismogenic fault structure can be achieved by geophysical methodsor by examining former seismogenic faults now exposed at the Earth'ssurface. Although the latter approach allows a particularly high levelof resolution, it is challenging to find exhumed fault zones that meetthe following criteria: exhumation from depths of 7–15 km; excellentpreservation of fault-related fracture networks across extensive expo-sures; presence of structural markers that allows the determination ofslip across individual fault strands; and the presence of solidified fric-tional melts (pseudotachylytes) attesting to past seismic activity.
The purpose of this paper is to document the structure of the GoleLarghe Fault Zone (GLFZ), an exhumed seismogenic fault hosted incrystalline basement. Previous work on the GLFZ focused on the
30 S.A.F. Smith et al. / Tectonophysics 599 (2013) 29–44
evolution of fault rocks, including pseudotachylytes, exposed in thesouthern part of the fault zone (Di Toro and Pennacchioni, 2004,2005; Di Toro et al., 2005). Here, we focus on the larger-scale struc-ture of the fault zone, and draw conclusions regarding the evolutionof fracture damage and fluid flow at seismogenic depths. Several fac-tors combine to make the GLFZ an exceptional target to understandseismogenic fault zone structure: 1) certain areas of the fault zone(e.g. the Lobbia Glacier area studied here) are exposed across glacier-polished outcrops for kilometers both along- and across-strike; 2) thepressure and temperature conditions of faulting are well constrainedfrom previous field observations together with microstructural andthermochronological analyses of the fault rock assemblages (Di Toroand Pennacchioni, 2005; Di Toro et al., 2005; Pennacchioni et al.,2006) and wall rocks (Reverman et al., 2012; Stipp et al., 2004; Violaet al., 2001); 3) the GLFZ cuts a young (c. 34–32 Ma) homogenous igne-ous intrusion belonging to the Adamello batholith, and; 4) there is nostructural evidence for tilting of the Adamello batholith during exhuma-tion from depth (e.g. Brack, 1981). Additionally, the fault rock assem-blages formed at depths of 9–11 km show no significant structuraloverprint (Pennacchioni et al., 2006), and thus it is less likely that suc-cessive (and shallower) deformation events will hinder the interpreta-tion of fault structure. The concomitance of these various factors allowsa comparison to bemade between the structure of the GLFZ and that ofactive seismogenic fault zones imaged using high-resolution seismolog-ical techniques (e.g., Au Sable Forks 2002 earthquake sequence, Seeberet al., 2002; Viegas et al., 2010).
2. Geological setting and previous work
2.1. The Adamello batholith
The Adamello massif is a major batholith in the Italian SouthernAlps (Fig. 1). It is composed of four main intrusions of predominantlygranodiorite–tonalite composition whose ages decrease progressively(42–29 Ma) from south-west to north-east (Fig. 1; Del Moro et al.,1983; Viola et al., 2001). The batholith intruded thrust nappes com-posed of pre-Alpine metamorphic basement and its Permo-Triassicsedimentary cover belonging to the Southern Alps (Schonborn, 1992),in a region located between two major segments of the 700-km longPeriadriatic lineament: the Tonale Line to the north, and the (South)Giudicarie Line to the east (e.g. Castellarin and Cantelli, 2000).
Mineral assemblages preserved in the contact aureole of theAdamellobatholith indicate syn-intrusive pressures in the range 0.25–0.35 GPa,corresponding to an intrusion depth of ~9–11 km (assuming typicalrock densities; John and Blundy, 1993; Riklin, 1985; Stipp et al., 2004).Along the northern contact of the batholith, intrusion of the Vald'Avio–Val di Genova and Presanella plutons was broadly synchronouswith dextral strike-slip movements along the Tonale Line (Stipp et al.,2004).
Post-magmatic deformation of the Adamello batholith is recordedby a down-temperature sequence of ductile and brittle structures in theAdamello and Val d'Avio–Val di Genova plutons, including (Di Toro andPennacchioni, 2005; Pennacchioni, 2005; Pennacchioni et al., 2006):1) four sets (approximately E-,W-, S-, N-dipping) of early-formed coolingjoints and fractures, sometimes intruded by aplite dykes, that formedat >600 °C; 2) amphibolite-facies mylonitic shear zones formed at~500 °C that nucleated mainly on E- and W-dipping cooling joints;3) pseudotachylytes and epidote + chlorite-bearing cataclastic faultsformed at 250–300 °C, mainly found reactivating S-dipping coolingjoints, and; 4) late-stage zeolite-bearing faults and vein networks
Fig. 1. Geological setting of the Gole Larghe Fault Zone after Mittempergher et al. (2009), (aGole Larghe Fault Zone; PCFZ, Passo Cercen Fault Zone; GSFZ, Gole Strette Fault Zone; LF, Lararea surrounding the Gole Larghe Fault Zone, showing the main fault zones and lineamentsdue to intersection of the dipping fault with surface topography. The Gole Larghe Fault Zonthe area in front of the Lobbia Glacier studied here and covered in Fig. 2a.
formed at b200 °C, exploiting E-, W-, and S-dipping joints as well aspseudotachylyte- and cataclasite-bearing faults. Pseudotachylyte- andcataclasite-bearing faults are found predominantly within east–westto NW–SE trending fault zones including the Gole Larghe Fault Zone(GLFZ) discussed here, the Lares Fault Zone and Gole Strette FaultZone to the south, and the Passo Cercen Fault Zone to the north (Fig. 1modified from Mittempergher et al., 2009).
2.2. The Gole Larghe Fault Zone
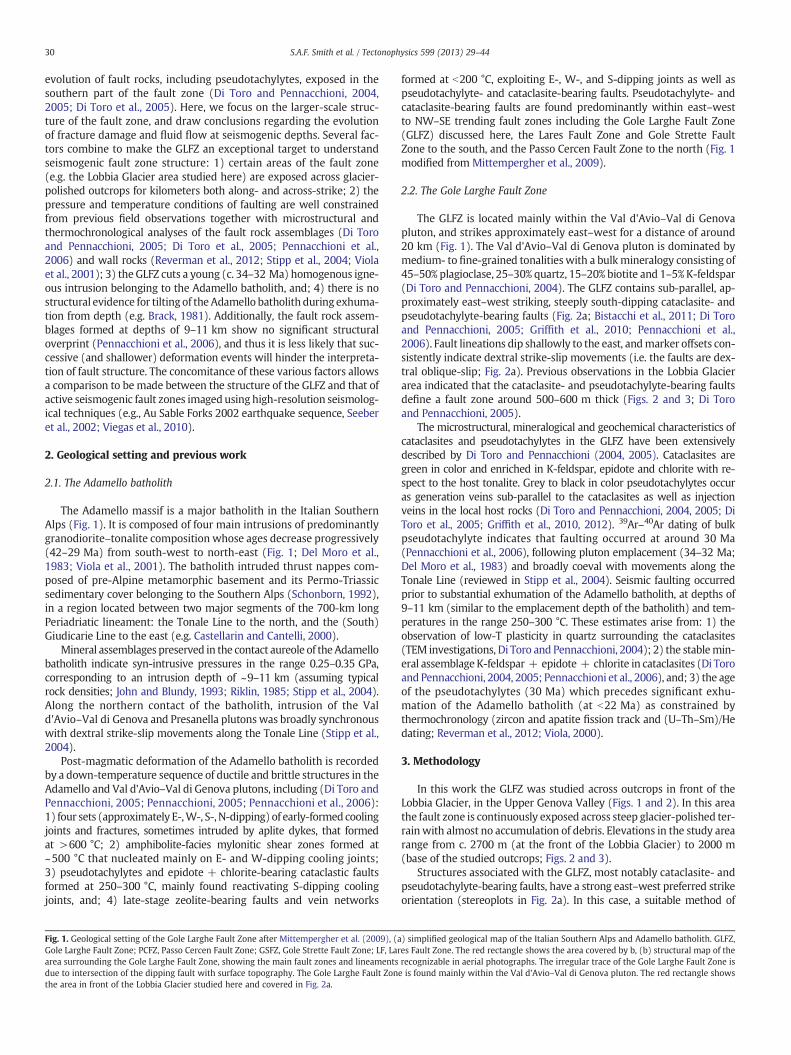
The GLFZ is located mainly within the Val d'Avio–Val di Genovapluton, and strikes approximately east–west for a distance of around20 km (Fig. 1). The Val d'Avio–Val di Genova pluton is dominated bymedium- to fine-grained tonalitieswith a bulkmineralogy consisting of45–50% plagioclase, 25–30% quartz, 15–20% biotite and 1–5%K-feldspar(Di Toro and Pennacchioni, 2004). The GLFZ contains sub-parallel, ap-proximately east–west striking, steeply south-dipping cataclasite- andpseudotachylyte-bearing faults (Fig. 2a; Bistacchi et al., 2011; Di Toroand Pennacchioni, 2005; Griffith et al., 2010; Pennacchioni et al.,2006). Fault lineations dip shallowly to the east, andmarker offsets con-sistently indicate dextral strike-slip movements (i.e. the faults are dex-tral oblique-slip; Fig. 2a). Previous observations in the Lobbia Glacierarea indicated that the cataclasite- and pseudotachylyte-bearing faultsdefine a fault zone around 500–600 m thick (Figs. 2 and 3; Di Toroand Pennacchioni, 2005).
The microstructural, mineralogical and geochemical characteristics ofcataclasites and pseudotachylytes in the GLFZ have been extensivelydescribed by Di Toro and Pennacchioni (2004, 2005). Cataclasites aregreen in color and enriched in K-feldspar, epidote and chlorite with re-spect to the host tonalite. Grey to black in color pseudotachylytes occuras generation veins sub-parallel to the cataclasites as well as injectionveins in the local host rocks (Di Toro and Pennacchioni, 2004, 2005; DiToro et al., 2005; Griffith et al., 2010, 2012). 39Ar–40Ar dating of bulkpseudotachylyte indicates that faulting occurred at around 30 Ma(Pennacchioni et al., 2006), following pluton emplacement (34–32 Ma;Del Moro et al., 1983) and broadly coeval with movements along theTonale Line (reviewed in Stipp et al., 2004). Seismic faulting occurredprior to substantial exhumation of the Adamello batholith, at depths of9–11 km (similar to the emplacement depth of the batholith) and tem-peratures in the range 250–300 °C. These estimates arise from: 1) theobservation of low-T plasticity in quartz surrounding the cataclasites(TEM investigations, Di Toro and Pennacchioni, 2004); 2) the stablemin-eral assemblage K-feldspar + epidote + chlorite in cataclasites (Di Toroand Pennacchioni, 2004, 2005; Pennacchioni et al., 2006), and; 3) the ageof the pseudotachylytes (30 Ma) which precedes significant exhu-mation of the Adamello batholith (at b22 Ma) as constrained bythermochronology (zircon and apatite fission track and (U–Th–Sm)/Hedating; Reverman et al., 2012; Viola, 2000).
3. Methodology
In this work the GLFZ was studied across outcrops in front of theLobbia Glacier, in the Upper Genova Valley (Figs. 1 and 2). In this areathe fault zone is continuously exposed across steep glacier-polished ter-rainwith almost no accumulation of debris. Elevations in the study arearange from c. 2700 m (at the front of the Lobbia Glacier) to 2000 m(base of the studied outcrops; Figs. 2 and 3).
Structures associated with the GLFZ, most notably cataclasite- andpseudotachylyte-bearing faults, have a strong east–west preferred strikeorientation (stereoplots in Fig. 2a). In this case, a suitable method of
) simplified geological map of the Italian Southern Alps and Adamello batholith. GLFZ,es Fault Zone. The red rectangle shows the area covered by b, (b) structural map of therecognizable in aerial photographs. The irregular trace of the Gole Larghe Fault Zone ise is found mainly within the Val d'Avio–Val di Genova pluton. The red rectangle shows

31S.A.F. Smith et al. / Tectonophysics 599 (2013) 29–44

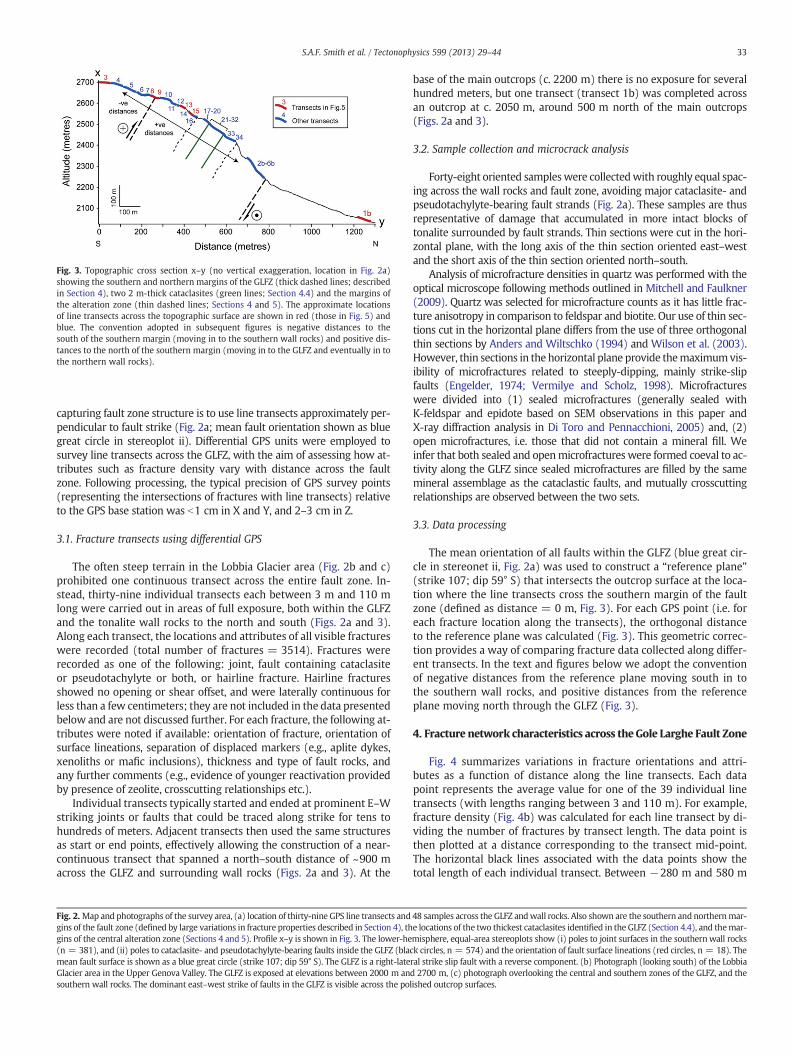
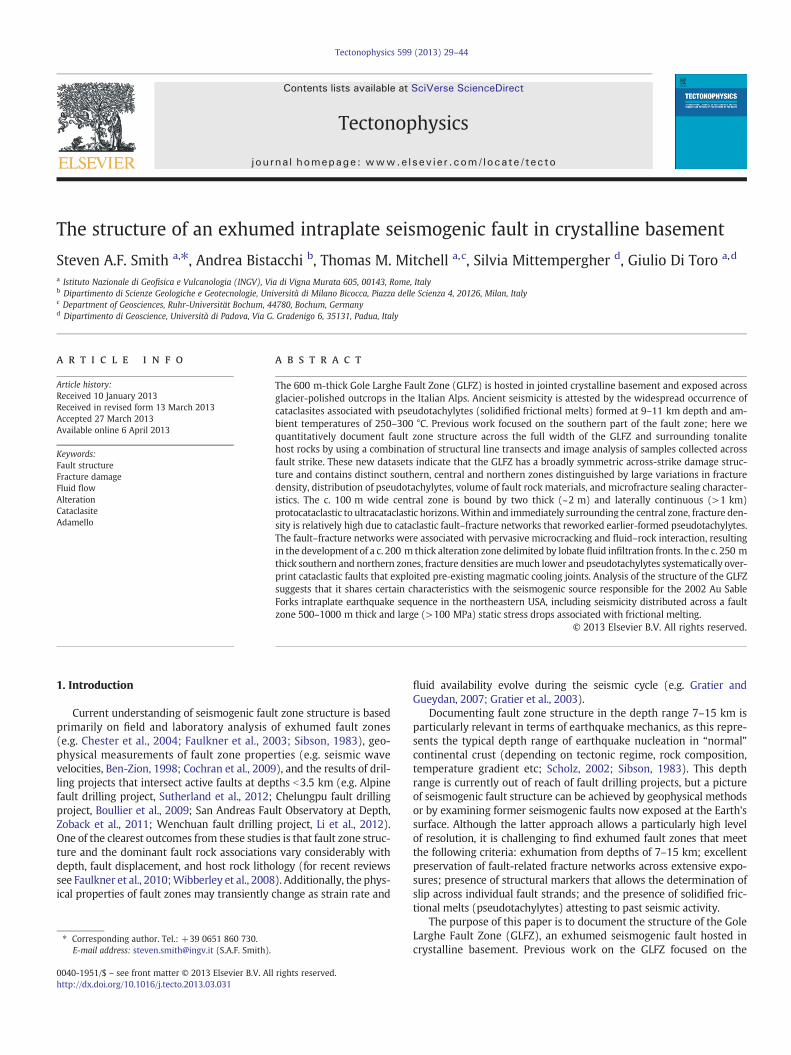
Fig. 3. Topographic cross section x–y (no vertical exaggeration, location in Fig. 2a)showing the southern and northern margins of the GLFZ (thick dashed lines; describedin Section 4), two 2 m-thick cataclasites (green lines; Section 4.4) and the margins ofthe alteration zone (thin dashed lines; Sections 4 and 5). The approximate locationsof line transects across the topographic surface are shown in red (those in Fig. 5) andblue. The convention adopted in subsequent figures is negative distances to thesouth of the southern margin (moving in to the southern wall rocks) and positive dis-tances to the north of the southern margin (moving in to the GLFZ and eventually in tothe northern wall rocks).
33S.A.F. Smith et al. / Tectonophysics 599 (2013) 29–44
capturing fault zone structure is to use line transects approximately per-pendicular to fault strike (Fig. 2a; mean fault orientation shown as bluegreat circle in stereoplot ii). Differential GPS units were employed tosurvey line transects across the GLFZ, with the aim of assessing how at-tributes such as fracture density vary with distance across the faultzone. Following processing, the typical precision of GPS survey points(representing the intersections of fractures with line transects) relativeto the GPS base station was b1 cm in X and Y, and 2–3 cm in Z.
3.1. Fracture transects using differential GPS
The often steep terrain in the Lobbia Glacier area (Fig. 2b and c)prohibited one continuous transect across the entire fault zone. In-stead, thirty-nine individual transects each between 3 m and 110 mlong were carried out in areas of full exposure, both within the GLFZand the tonalite wall rocks to the north and south (Figs. 2a and 3).Along each transect, the locations and attributes of all visible fractureswere recorded (total number of fractures = 3514). Fractures wererecorded as one of the following: joint, fault containing cataclasiteor pseudotachylyte or both, or hairline fracture. Hairline fracturesshowed no opening or shear offset, and were laterally continuous forless than a few centimeters; they are not included in the data presentedbelow and are not discussed further. For each fracture, the following at-tributes were noted if available: orientation of fracture, orientation ofsurface lineations, separation of displaced markers (e.g., aplite dykes,xenoliths or mafic inclusions), thickness and type of fault rocks, andany further comments (e.g., evidence of younger reactivation providedby presence of zeolite, crosscutting relationships etc.).
Individual transects typically started and ended at prominent E–Wstriking joints or faults that could be traced along strike for tens tohundreds of meters. Adjacent transects then used the same structuresas start or end points, effectively allowing the construction of a near-continuous transect that spanned a north–south distance of ~900 macross the GLFZ and surrounding wall rocks (Figs. 2a and 3). At the
Fig. 2. Map and photographs of the survey area, (a) location of thirty-nine GPS line transects andgins of the fault zone (defined by large variations in fracture properties described in Section 4), thgins of the central alteration zone (Sections 4 and 5). Profile x–y is shown in Fig. 3. The lower-he(n = 381), and (ii) poles to cataclasite- and pseudotachylyte-bearing faults inside the GLFZ (blacmean fault surface is shown as a blue great circle (strike 107; dip 59° S). The GLFZ is a right-lateGlacier area in the Upper Genova Valley. The GLFZ is exposed at elevations between 2000 m ansouthern wall rocks. The dominant east–west strike of faults in the GLFZ is visible across the pol
base of the main outcrops (c. 2200 m) there is no exposure for severalhundred meters, but one transect (transect 1b) was completed acrossan outcrop at c. 2050 m, around 500 m north of the main outcrops(Figs. 2a and 3).
3.2. Sample collection and microcrack analysis
Forty-eight oriented sampleswere collectedwith roughly equal spac-ing across the wall rocks and fault zone, avoiding major cataclasite- andpseudotachylyte-bearing fault strands (Fig. 2a). These samples are thusrepresentative of damage that accumulated in more intact blocks oftonalite surrounded by fault strands. Thin sections were cut in the hori-zontal plane, with the long axis of the thin section oriented east–westand the short axis of the thin section oriented north–south.
Analysis of microfracture densities in quartz was performed with theoptical microscope following methods outlined in Mitchell and Faulkner(2009). Quartz was selected for microfracture counts as it has little frac-ture anisotropy in comparison to feldspar and biotite. Our use of thin sec-tions cut in the horizontal plane differs from the use of three orthogonalthin sections by Anders and Wiltschko (1994) and Wilson et al. (2003).However, thin sections in the horizontal plane provide themaximumvis-ibility of microfractures related to steeply-dipping, mainly strike-slipfaults (Engelder, 1974; Vermilye and Scholz, 1998). Microfractureswere divided into (1) sealed microfractures (generally sealed withK-feldspar and epidote based on SEM observations in this paper andX-ray diffraction analysis in Di Toro and Pennacchioni, 2005) and, (2)open microfractures, i.e. those that did not contain a mineral fill. Weinfer that both sealed and openmicrofractures were formed coeval to ac-tivity along the GLFZ since sealed microfractures are filled by the samemineral assemblage as the cataclastic faults, and mutually crosscuttingrelationships are observed between the two sets.
3.3. Data processing
The mean orientation of all faults within the GLFZ (blue great cir-cle in stereonet ii, Fig. 2a) was used to construct a “reference plane”(strike 107; dip 59° S) that intersects the outcrop surface at the loca-tion where the line transects cross the southern margin of the faultzone (defined as distance = 0 m, Fig. 3). For each GPS point (i.e. foreach fracture location along the transects), the orthogonal distanceto the reference plane was calculated (Fig. 3). This geometric correc-tion provides a way of comparing fracture data collected along differ-ent transects. In the text and figures below we adopt the conventionof negative distances from the reference plane moving south in tothe southern wall rocks, and positive distances from the referenceplane moving north through the GLFZ (Fig. 3).
4. Fracture network characteristics across the Gole Larghe Fault Zone
Fig. 4 summarizes variations in fracture orientations and attri-butes as a function of distance along the line transects. Each datapoint represents the average value for one of the 39 individual linetransects (with lengths ranging between 3 and 110 m). For example,fracture density (Fig. 4b) was calculated for each line transect by di-viding the number of fractures by transect length. The data point isthen plotted at a distance corresponding to the transect mid-point.The horizontal black lines associated with the data points show thetotal length of each individual transect. Between −280 m and 580 m
48 samples across the GLFZ andwall rocks. Also shown are the southern and northernmar-e locations of the two thickest cataclasites identified in the GLFZ (Section 4.4), and themar-misphere, equal-area stereoplots show (i) poles to joint surfaces in the southernwall rocksk circles, n = 574) and the orientation of fault surface lineations (red circles, n = 18). Theral strike slip fault with a reverse component. (b) Photograph (looking south) of the Lobbiad 2700 m, (c) photograph overlooking the central and southern zones of the GLFZ, and theished outcrop surfaces.

Fig. 4. Variations in fracture orientations and attributeswith distance across theGLFZ. In parts b–d each data point represents the average value for an individual line transect (39 transectsin total), and the total length of each transect is shownby the horizontal black lines (transect lengths range between3 and 110 m) , (a) rose diagrams (2° sectorwidth) showing the strikesof fractures (joints and faults) in different areas of the fault zone and wall rocks, (b) fracture density vs. distance along transect, (c) percentage of faults and joints vs. distance (red data),and the percentage of faults containing pseudotachylytes vs. distance (grey data), (d) fault rock (cataclasite + pseudotachylyte) thickness as a percentage of transect length vs. distance.Inset shows a detail from the central part of the fault zone containing the 2 m-thick cataclasites (Section 4.4).
34 S.A.F. Smith et al. / Tectonophysics 599 (2013) 29–44

35S.A.F. Smith et al. / Tectonophysics 599 (2013) 29–44
almost complete outcrop coverage was achieved. Between 580 m and1100 m there is no data because of a lack of exposure. An isolated tran-sect (transect 1b) was measured between 1100 and 1150 m.
Also shown in Fig. 4 are the locations of the two thickest cataclasticfaults identified in the Lobbia Glacier area to date (described inSection 4.4). Both of these faults appear as dark green, highly indu-rated horizons and contain a c. 2 m thick cataclasite/ultracataclasite,surrounded by up to several meters of protocataclasite and highlyfractured tonalite host rocks. They are exceptional because a largemajority of cataclastic faults in the GLFZ are at most a few centime-ters thick, with rare examples up to a few tens of centimeters thickand only one other fault identified with a thickness of almost 1 m.Moreover, these two thick cataclastic faults are distinguished fromall others in the GLFZ because they are laterally continuous alongstrike for distances >500 m.
4.1. Fracture density
Fractures include both early-formed magmatic cooling joints andcataclasite- and pseudotachylyte-bearing faults. Fracture density isrelatively low in the southern wall rocks, averaging between 1 and3 fractures per meter (Fig. 4b). At the southern margin of the faultzone there is a small but abrupt increase in fracture density (Fig. 4b).Fracture density then increases within the southern zone to reach max-imum values of 12–18 fractures per meter in the central zone betweenthe2 m-thick cataclasites (Fig. 4b). In the northern zone, fracture densitydecreases again to 3–5 fractures per meter at a distance of 500–600 mfrom the southern margin (Fig. 4b). At this distance, the fracture densityis similar to within the southern wall rocks and the isolated transect inthe northern wall rocks located at 1100 m. For this reason, we considerthat the northern margin of the GLFZ is located at c. 600 m along thetransects (Fig. 4b).
4.2. Relative importance of faults vs. joints and distribution ofpseudotachylyte
In the southern wall rocks >80% of fractures are represented byconjugate sets of early-formed magmatic cooling joints (Figs. 4c and5a). These joints strike mainly east–west, with a minor set strikingapproximately north–south (Figs. 4a and 5a). Occasionally, reworkingof joints by cataclasite-bearing faults occurs in the southern wallrocks (Fig. 5a), and this increases in frequency towards the southernmargin of the fault zone (Fig. 4c). Joints that are reworked by cataclasticfaults are typically those that are continuous along strike for tens tohundreds of meters, and have orientations similar to themean fault ori-entation (approximately east–west striking, moderately south dipping;Fig. 5a). Reworked joints are spaced regularly at distances of 5–10 m(Fig. 5a). Measured values of separation across reworked joints in thesouthern wall rocks are up to 70 cm (Fig. 5a). Pseudotachylytes are ab-sent in the southern wall rocks (Fig. 4c).
The southern margin of the GLFZ is most clearly defined by a largeand abrupt increase in the percentage of faults with respect to joints,the transition occurring across a single moderately south-dippingcataclastic fault (Figs. 4c and 5b). Although this abrupt transitionhas been captured by the line transects only in one location, observa-tions along fault-strike, particularly in the area immediately to thenorth of the Lobbia Glacier terminus, suggest that it is characteristicof the southern fault zone margin.
In both the southern and northern zones, typically between 80and 100% of fractures are cataclasite- and pseudotachylyte-bearingfaults (Figs. 4c and 5c–d). Pseudotachylytes are particularly commonin the southern zone, where they are present along 20–60% of faults(Fig. 4c). Faults in these areas are dominantly WNW–ESE strikingand dip moderately to the south (Figs. 4a and 5c–d). Measured valuesof separation across individual faults in the southern and northernzones are up to 7.5 m, with larger separations typically occurring
across faults with thicker cataclastic horizons (Fig. 5c–d). Along tran-sect 15 (Fig. 5d) separation of displaced markers could be measuredacross most faults, including all of those with cataclasites thicker than2 cm. Total separation for this 15.9 m long transect was 28.54 m,resulting in a separation to fault thickness ratio (γ) of 1.8. This ratio islikely a slight underestimate considering that separation could not bemeasured across some of the more minor faults (those with millimeter-thick cataclasites).
In the central zone (i.e. between the 2 m-thick cataclasites), between50 and 80% of fractures are cataclasite- and pseudotachylyte-bearingfaults (Fig. 4c). However, pseudotachylytes are relatively scarce, beingpresent along b10% of faults. Field andmicrostructural observations sug-gest that the scarcity of pseudotachylytes in the central zone is due topervasive reworking and alteration by dense cataclastic fault–fracturenetworks (described in Section 4.4 and Fig. 7). The presence of these frac-ture networks largely accounts for the high fracture densities in the cen-tral zone (Fig. 4b). Fault orientations are much more widely distributedin the central zone, and structures forming a high angle with the meanfault strike are more common (Fig. 4a).
In the northern wall rocks (represented by the transect at 1100 mdistance) ~90% of fractures are cataclasite-bearing faults, despite thelow overall fracture density (Figs. 4c and 5e). This highlights an asym-metry in the style of deformation to the south and north of the GLFZ.Faults in the northern wall rocks are typically clustered, each clusterbeing separated by intact blocks of tonalite a few meters wide (Fig. 5e).Measured separations are smaller than within the GLFZ, with maximumvalues of a few tens of centimeters (Fig. 5e).
4.3. Fault rock thickness
The total thickness of cataclasite + pseudotachylyte along eachline transect is plotted as a percentage of transect length in Fig. 4d.This mirrors somewhat the fracture density (Fig. 4b), but it illustratesparticularly well certain characteristics of the GLFZ. In the southernand northern zones, fault rock thickness is generally b10% of transectlength. However, in the central zone between the 2 m-thick cataclasitesfault rocks account for >20%, and in some cases >40% of transectlength, reflecting the presence of dense cataclastic fault–fracture net-works (Fig. 4d, Section 4.4). The inset in Fig. 4d shows that the transectswith the greatest thickness of fault rocks are immediately adjacent tothe 2 m-thick cataclasites, with a slight decrease in fault rock thicknessin the middle of the central zone (c. 300 m distance).
4.4. Fault rocks
The southern zone was previously studied by Di Toro andPennacchioni (2005). These authors developed a model involvingcataclasis along pre-existing magmatic cooling joints, followed byfrictional melting and formation of pseudotachylytes. Our field ob-servations suggest that this model is also applicable to the north-ern zone, where pseudotachylytes generally crosscut cataclasitesand thus represent the youngest stage of deformation (Fig. 6). Alterationin these areas is mainly limited to the cataclasite fault layers andthe tonalite host rocks a few centimeters either side of the faults.In most faults, a black, unaltered pseudotachylyte cuts across thecataclasites, altered tonalite and, in the most important faults, reworkedpseudotachylyte (Fig. 6a–c). Themineral assemblage of pseudotachylytesin this area includes “high temperature” mineral phases (plagioclase,biotite, dmisteinbergite) and several well preserved textures diagnosticof rapid cooling of a melt (plagioclase microlites, fluidal structures,spherulites, Fig. 6d; Di Toro and Pennacchioni, 2004; Nestola et al., 2010).
The central zone includes two main characteristics that are clearlydifferent from the southern and northern zones: (i) the occurrence ofdense cataclastic fault–fracture networks (Fig. 7a and b) and (ii) thepresence of two 2 m-thick cataclastic faults (Fig. 7c–g). The pervasivenetworks of fractures and faults in the central zone are responsible for
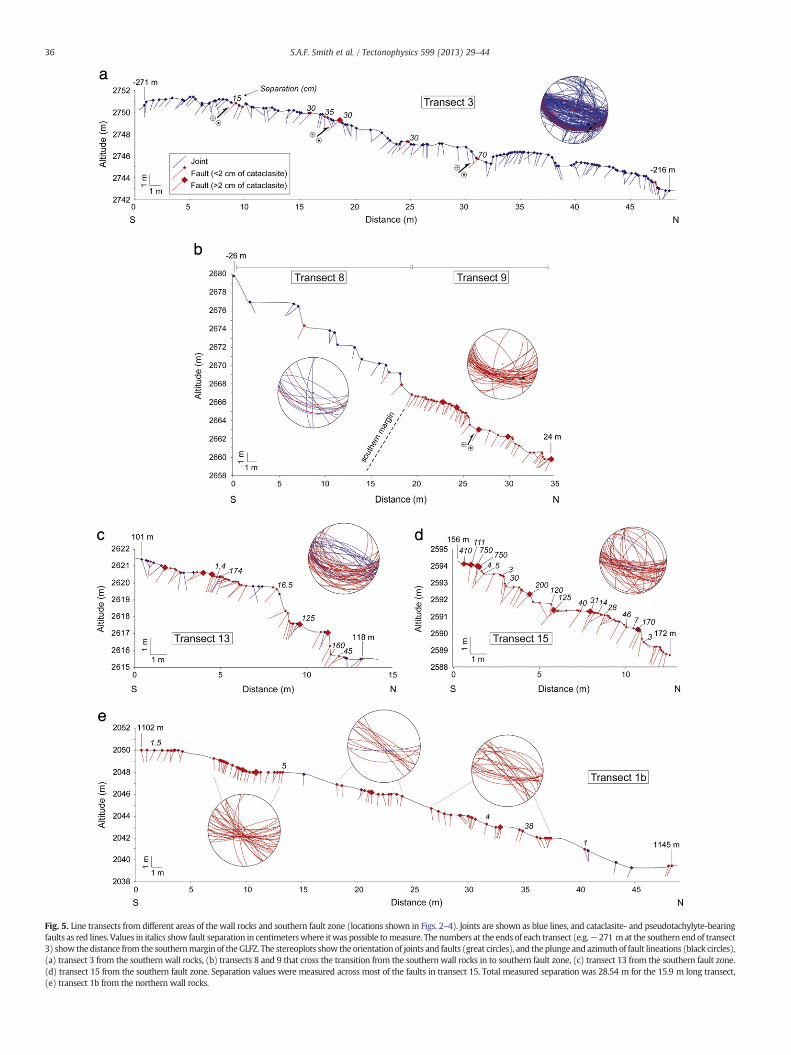
Fig. 5. Line transects from different areas of the wall rocks and southern fault zone (locations shown in Figs. 2–4). Joints are shown as blue lines, and cataclasite- and pseudotachylyte-bearingfaults as red lines. Values in italics show fault separation in centimeterswhere itwas possible tomeasure. The numbers at the ends of each transect (e.g.−271 mat the southern end of transect3) show the distance from the southernmargin of the GLFZ. The stereoplots show the orientation of joints and faults (great circles), and the plunge and azimuth of fault lineations (black circles),(a) transect 3 from the southern wall rocks, (b) transects 8 and 9 that cross the transition from the southern wall rocks in to southern fault zone, (c) transect 13 from the southern fault zone.(d) transect 15 from the southern fault zone. Separation values were measured across most of the faults in transect 15. Total measured separation was 28.54 m for the 15.9 m long transect,(e) transect 1b from the northern wall rocks.
36 S.A.F. Smith et al. / Tectonophysics 599 (2013) 29–44
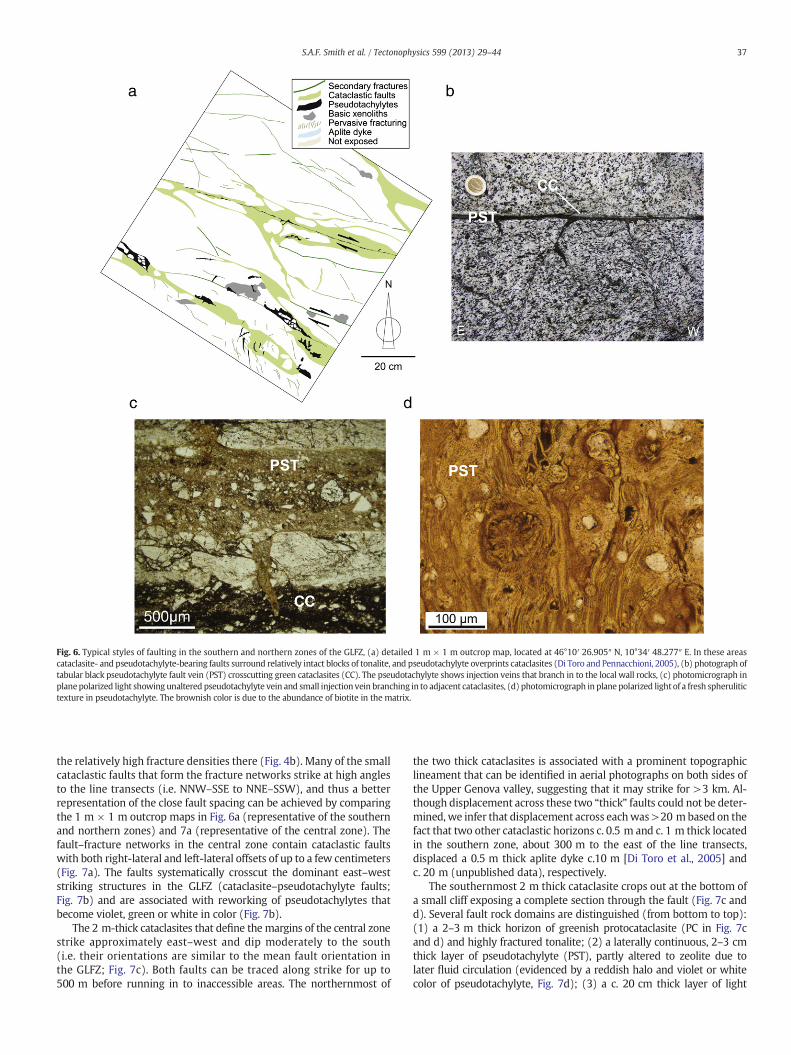
Fig. 6. Typical styles of faulting in the southern and northern zones of the GLFZ, (a) detailed 1 m × 1 m outcrop map, located at 46°10′ 26.905″ N, 10°34′ 48.277″ E. In these areascataclasite- and pseudotachylyte-bearing faults surround relatively intact blocks of tonalite, and pseudotachylyte overprints cataclasites (Di Toro and Pennacchioni, 2005), (b) photograph oftabular black pseudotachylyte fault vein (PST) crosscutting green cataclasites (CC). The pseudotachylyte shows injection veins that branch in to the local wall rocks, (c) photomicrograph inplanepolarized light showing unaltered pseudotachylyte vein and small injection vein branching in to adjacent cataclasites, (d) photomicrograph in plane polarized light of a fresh spherulitictexture in pseudotachylyte. The brownish color is due to the abundance of biotite in the matrix.
37S.A.F. Smith et al. / Tectonophysics 599 (2013) 29–44
the relatively high fracture densities there (Fig. 4b). Many of the smallcataclastic faults that form the fracture networks strike at high anglesto the line transects (i.e. NNW–SSE to NNE–SSW), and thus a betterrepresentation of the close fault spacing can be achieved by comparingthe 1 m × 1 m outcrop maps in Fig. 6a (representative of the southernand northern zones) and 7a (representative of the central zone). Thefault–fracture networks in the central zone contain cataclastic faultswith both right-lateral and left-lateral offsets of up to a few centimeters(Fig. 7a). The faults systematically crosscut the dominant east–weststriking structures in the GLFZ (cataclasite–pseudotachylyte faults;Fig. 7b) and are associated with reworking of pseudotachylytes thatbecome violet, green or white in color (Fig. 7b).
The 2 m-thick cataclasites that define the margins of the central zonestrike approximately east–west and dip moderately to the south(i.e. their orientations are similar to the mean fault orientation inthe GLFZ; Fig. 7c). Both faults can be traced along strike for up to500 m before running in to inaccessible areas. The northernmost of
the two thick cataclasites is associated with a prominent topographiclineament that can be identified in aerial photographs on both sides ofthe Upper Genova valley, suggesting that it may strike for >3 km. Al-though displacement across these two “thick” faults could not be deter-mined, we infer that displacement across eachwas>20 mbased on thefact that two other cataclastic horizons c. 0.5 m and c. 1 m thick locatedin the southern zone, about 300 m to the east of the line transects,displaced a 0.5 m thick aplite dyke c.10 m [Di Toro et al., 2005] andc. 20 m (unpublished data), respectively.
The southernmost 2 m thick cataclasite crops out at the bottom ofa small cliff exposing a complete section through the fault (Fig. 7c andd). Several fault rock domains are distinguished (from bottom to top):(1) a 2–3 m thick horizon of greenish protocataclasite (PC in Fig. 7cand d) and highly fractured tonalite; (2) a laterally continuous, 2–3 cmthick layer of pseudotachylyte (PST), partly altered to zeolite due tolater fluid circulation (evidenced by a reddish halo and violet or whitecolor of pseudotachylyte, Fig. 7d); (3) a c. 20 cm thick layer of light

Fig. 7. Typical styles of faulting in the central zone of the GLFZ, (a) detailed 1 m × 1 m outcrop map, located at 46°10′ 27.619″ N, 10°34′ 52.868″ E. In the central zone the fracturedensity is much higher due to the presence of cataclastic fault–fracture networks that give the outcrop a distinct green coloration. Legend as for Fig. 6a. (b) Photograph of E–Wstriking altered pseudotachylyte fault vein dissected by a network of small-displacement cataclastic faults striking dominantly NNW–NNE, (c) schematic of the southernmost2 m-thick cataclasite. At the base of the fault is a 20 cm-thick layer of ultracataclasite (UC). The upper 180 cm is composed of cataclasites (CC) and protocataclasites (PC). Theboundaries with the surrounding protocataclasites and fractured tonalite host rocks are marked by centimeter-thick, continuous layers of pseudotachylyte (PST), (d) photographof the basal ultracataclasite and overlying cataclasites. The red and white layers surrounding the pseudotachylyte vein are due to late-stage zeolite mineralization, (e) photomicro-graph in plane polarized light of the ultracataclastic matrix (UC) containing a reworked clast of pseudotachylyte (PST). The white dashed line marks a wavy foliation developedaround the margins of the pseudotachylyte clast, (f) photomicrograph in plane polarized light of an altered spherulitic domain in a reworked pseudotachylyte slab. The matrixis white due to the leaching of biotite (compare with Fig. 6d) and the spherulites are partly obliterated by growth of chlorite and epidote, (g) photomicrograph in plane polarizedlight of the cataclastic matrix (CC) containing reworked fragments of protocataclasite (PC) as well as clasts of pseudotachylytes (white arrows).
38 S.A.F. Smith et al. / Tectonophysics 599 (2013) 29–44
green ultracataclasite (UC); (4) a 140–180 cm thick horizon of dark greencataclasite (CC) grading upwards to protocataclasite; (5) a 20–60 cmthick horizon of greenish protocataclasite (PC); (6) a laterally continuous2–3 cm thick layer of pseudotachylyte (PST), crosscutting all other struc-tures and much better preserved than layer 2; and (7) a 3–5 m thick ho-rizon of greenish protocataclasite (PC) and highly fractured tonalite. All ofthe cataclastic fault rocks contain reworked clasts of pseudotachylyte(e.g. Fig. 7e). Within reworked pseudotachylyte clasts “primary”
microstructures diagnostic of rapid cooling of a melt (e.g. spherulites)are often overprinted and obliterated by precipitation of K-feldspar,chlorite and epidote, and leaching of biotite (Fig. 7f).
Under the optical microscope, the light green ultracataclasites(layer 3) are composed of a microcrystalline matrix of epidoteand K-feldspar (Fig. 7e), surrounding clasts of reworked cataclasite,pseudotachylyte and, to a lesser extent, quartz and plagioclase. Pla-gioclase clasts are rare and overprinted by saussuritic alteration of
39S.A.F. Smith et al. / Tectonophysics 599 (2013) 29–44
microcrystals of epidote and white mica. A wavy foliation of dark,fine grained minerals is locally developed, mostly around hard ob-jects such as pseudotachylyte clasts (Fig. 7e).
The dark green cataclasites (layer 4) are composed of multiple in-dividual cataclasite layers, bounding less deformed, protocataclasticdomains (Fig. 7g). In the cataclasites, clasts of quartz, plagioclase,and reworked pseudotachylytes and cataclasites are cemented bychlorite, epidote and K-feldspar (Fig. 7g). In contact with chlorite,quartz clasts have lobate–cuspate boundaries, and a wavy foliationdefined by dark, fine grained layers of titanite, chlorite and opaqueminerals is locally developed.
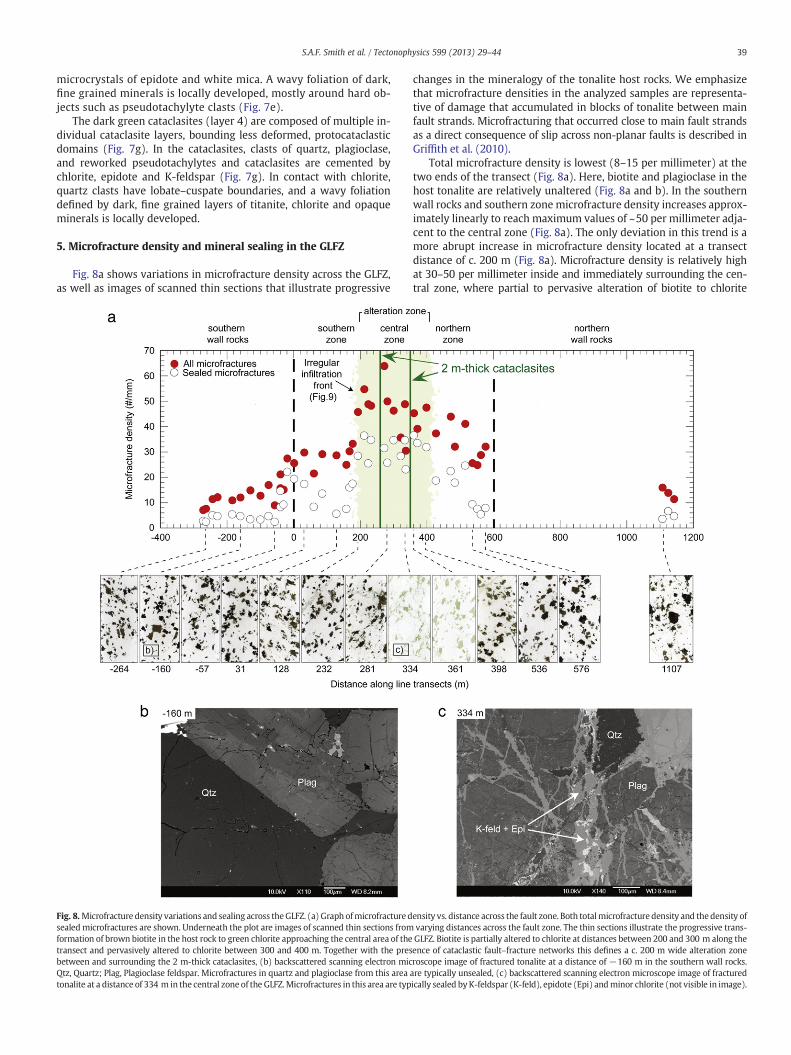
5. Microfracture density and mineral sealing in the GLFZ
Fig. 8a shows variations in microfracture density across the GLFZ,as well as images of scanned thin sections that illustrate progressive
Fig. 8.Microfracture density variations and sealing across theGLFZ. (a) Graph ofmicrofracture dsealedmicrofractures are shown. Underneath the plot are images of scanned thin sections fromformation of brown biotite in the host rock to green chlorite approaching the central area of thetransect and pervasively altered to chlorite between 300 and 400 m. Together with the presbetween and surrounding the 2 m-thick cataclasites, (b) backscattered scanning electron micQtz, Quartz; Plag, Plagioclase feldspar. Microfractures in quartz and plagioclase from this areatonalite at a distance of 334 m in the central zone of the GLFZ.Microfractures in this area are typ
changes in the mineralogy of the tonalite host rocks. We emphasizethat microfracture densities in the analyzed samples are representa-tive of damage that accumulated in blocks of tonalite between mainfault strands. Microfracturing that occurred close to main fault strandsas a direct consequence of slip across non-planar faults is described inGriffith et al. (2010).
Total microfracture density is lowest (8–15 per millimeter) at thetwo ends of the transect (Fig. 8a). Here, biotite and plagioclase in thehost tonalite are relatively unaltered (Fig. 8a and b). In the southernwall rocks and southern zone microfracture density increases approx-imately linearly to reach maximum values of ~50 per millimeter adja-cent to the central zone (Fig. 8a). The only deviation in this trend is amore abrupt increase in microfracture density located at a transectdistance of c. 200 m (Fig. 8a). Microfracture density is relatively highat 30–50 per millimeter inside and immediately surrounding the cen-tral zone, where partial to pervasive alteration of biotite to chlorite
ensity vs. distance across the fault zone. Both totalmicrofracture density and thedensity ofvarying distances across the fault zone. The thin sections illustrate the progressive trans-GLFZ. Biotite is partially altered to chlorite at distances between 200 and 300 m along theence of cataclastic fault–fracture networks this defines a c. 200 m wide alteration zoneroscope image of fractured tonalite at a distance of −160 m in the southern wall rocks.are typically unsealed, (c) backscattered scanning electron microscope image of fracturedically sealed byK-feldspar (K-feld), epidote (Epi) andminor chlorite (not visible in image).
40 S.A.F. Smith et al. / Tectonophysics 599 (2013) 29–44
occurs in the host tonalite (Fig. 8a). Microfracture density then de-creases again in the northern zone, although it is on average 30% higherthan in the southern zone.
In the southern wall rocks and southern zone, between 20 and 40%of microfractures are sealed (Fig. 8a and b). There is a spike in sealedmicrofracture density around the southern margin of the fault zone,where they account for 50–80% of the total (Fig. 8a). Within and ad-jacent to the central zone, sealed microfractures account for 50–85%of the total microfracture density (Fig. 8a). Backscattered scanningelectron microscope images, combined with the results of powder X-raydiffraction analysis reported in Di Toro and Pennacchioni (2005), indicatethat microfractures are sealed mainly by K-feldspar and epidote, withminor chlorite (Fig. 8c).
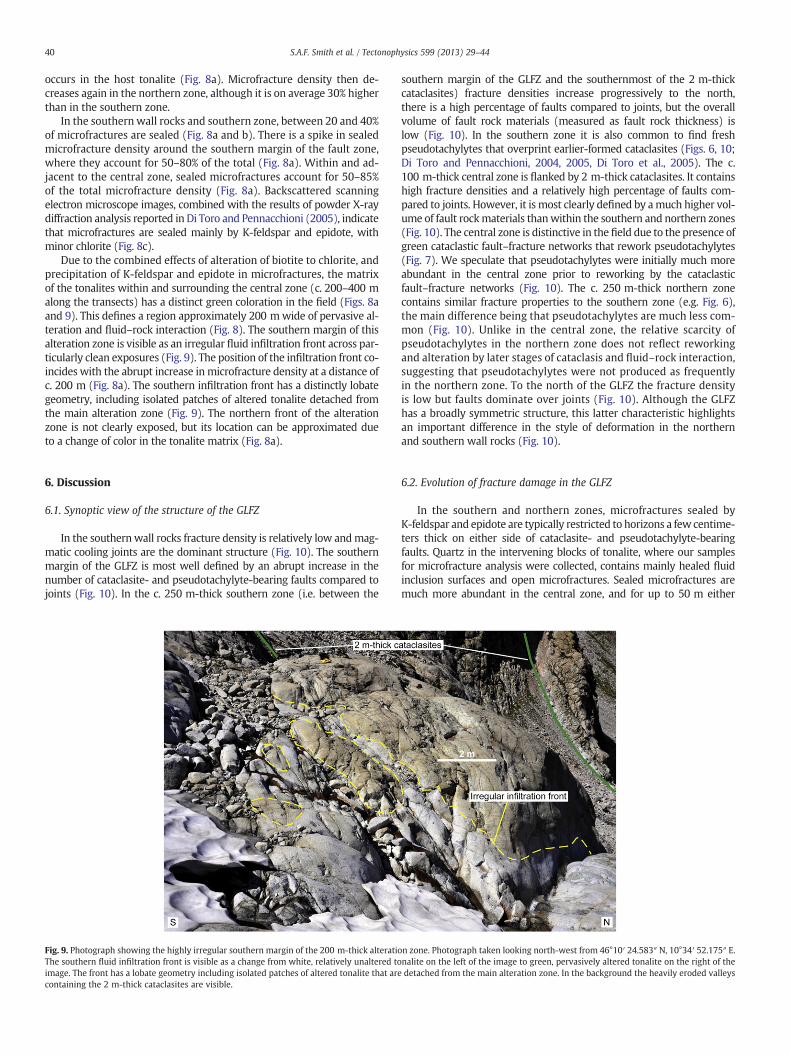
Due to the combined effects of alteration of biotite to chlorite, andprecipitation of K-feldspar and epidote in microfractures, the matrixof the tonalites within and surrounding the central zone (c. 200–400 malong the transects) has a distinct green coloration in the field (Figs. 8aand 9). This defines a region approximately 200 mwide of pervasive al-teration and fluid–rock interaction (Fig. 8). The southern margin of thisalteration zone is visible as an irregular fluid infiltration front across par-ticularly clean exposures (Fig. 9). The position of the infiltration front co-incides with the abrupt increase in microfracture density at a distance ofc. 200 m (Fig. 8a). The southern infiltration front has a distinctly lobategeometry, including isolated patches of altered tonalite detached fromthe main alteration zone (Fig. 9). The northern front of the alterationzone is not clearly exposed, but its location can be approximated dueto a change of color in the tonalite matrix (Fig. 8a).
6. Discussion
6.1. Synoptic view of the structure of the GLFZ
In the southernwall rocks fracture density is relatively low andmag-matic cooling joints are the dominant structure (Fig. 10). The southernmargin of the GLFZ is most well defined by an abrupt increase in thenumber of cataclasite- and pseudotachylyte-bearing faults compared tojoints (Fig. 10). In the c. 250 m-thick southern zone (i.e. between the
Fig. 9. Photograph showing the highly irregular southern margin of the 200 m-thick alteratioThe southern fluid infiltration front is visible as a change from white, relatively unaltered toimage. The front has a lobate geometry including isolated patches of altered tonalite that arecontaining the 2 m-thick cataclasites are visible.
southern margin of the GLFZ and the southernmost of the 2 m-thickcataclasites) fracture densities increase progressively to the north,there is a high percentage of faults compared to joints, but the overallvolume of fault rock materials (measured as fault rock thickness) islow (Fig. 10). In the southern zone it is also common to find freshpseudotachylytes that overprint earlier-formed cataclasites (Figs. 6, 10;Di Toro and Pennacchioni, 2004, 2005, Di Toro et al., 2005). The c.100 m-thick central zone is flanked by 2 m-thick cataclasites. It containshigh fracture densities and a relatively high percentage of faults com-pared to joints. However, it is most clearly defined by amuch higher vol-ume of fault rockmaterials thanwithin the southern and northern zones(Fig. 10). The central zone is distinctive in the field due to the presence ofgreen cataclastic fault–fracture networks that rework pseudotachylytes(Fig. 7). We speculate that pseudotachylytes were initially much moreabundant in the central zone prior to reworking by the cataclasticfault–fracture networks (Fig. 10). The c. 250 m-thick northern zonecontains similar fracture properties to the southern zone (e.g. Fig. 6),the main difference being that pseudotachylytes are much less com-mon (Fig. 10). Unlike in the central zone, the relative scarcity ofpseudotachylytes in the northern zone does not reflect reworkingand alteration by later stages of cataclasis and fluid–rock interaction,suggesting that pseudotachylytes were not produced as frequentlyin the northern zone. To the north of the GLFZ the fracture densityis low but faults dominate over joints (Fig. 10). Although the GLFZhas a broadly symmetric structure, this latter characteristic highlightsan important difference in the style of deformation in the northernand southern wall rocks (Fig. 10).
6.2. Evolution of fracture damage in the GLFZ
In the southern and northern zones, microfractures sealed byK-feldspar and epidote are typically restricted to horizons a few centime-ters thick on either side of cataclasite- and pseudotachylyte-bearingfaults. Quartz in the intervening blocks of tonalite, where our samplesfor microfracture analysis were collected, contains mainly healed fluidinclusion surfaces and open microfractures. Sealed microfractures aremuch more abundant in the central zone, and for up to 50 m either
n zone. Photograph taken looking north-west from 46°10′ 24.583″ N, 10°34′ 52.175″ E.nalite on the left of the image to green, pervasively altered tonalite on the right of thedetached from the main alteration zone. In the background the heavily eroded valleys

Fig. 10. Synoptic view of the structure of the GLFZ based on field surveys and microstructural analysis. (a) Schematic plots showing how the relative intensity of various fractureattributes vary with distance across the fault zone. The fine dashed line in the third plot from top shows an interpretation of the distribution of pseudotachylyte prior to itsreworking by cataclastic fault–fracture meshes in the central zone. (b) Simplified geological sketch of the structure of the GLFZ. The sketch highlights the main zones within theGLFZ, including the c. 200 m-wide alteration zone associated with pervasive fluid–rock interaction. The γ values show the ratio of fault thickness to fault displacement measuredin two areas of the southern zone (see Section 6.2 for an explanation).
41S.A.F. Smith et al. / Tectonophysics 599 (2013) 29–44
side of the central zone, where they are found in association with thecataclastic fault–fracture networks responsible for the high fracturedensities. In these areas sealed microfractures are not only found closeto cataclastic horizons, but are widespread within the interveningblocks of tonalite, defining a c. 200 m-wide region of pervasive alter-ation and fluid–rock interaction (Fig. 10). Although a large majority ofpseudotachylytes within the alteration zone are reworked (Fig. 7b),there are some examples of pseudotachylytes that crosscut thecataclastic fault–fracture networks and associated microfractures,including the laterally continuous, centimeter-thick pseudotachylytesfound along the margins of the southernmost 2 m-thick cataclasite(Fig. 7c). This indicates thatfluid–rock interaction and subsequentminer-alizationwithin the alteration zoneoccurred at least partly at seismogenicdepths. Geochemical data are not presently available to distinguish theorigin(s) of fluids in the central, highly altered part of the GLFZ. However,the mineral assemblages filling sealed microfractures (K-feldspar, epi-dote, chlorite) in the alteration zone are the same as those found in
cataclastic faults in the southern zone. In the southern zone, the abun-dance of large ion lithophile elements (Rb, Ba, U, Th) in the cataclasiteswith respect to the tonalitic wall rocks and to the older mylonitessuggests that induration of the cataclasites involved hydrothermalwater-rich fluids (Di Toro and Pennacchioni, 2005). Additionally,the interpretation of hydrogen isotope data (δD) suggests that thefluids are compatible with a crustal source (i.e., the involvement ofsurficial, meteoric fluids is excluded; Dallai et al., 2009).
As in many fault zones with intense fracture damage, it is difficult toestimate how much displacement was accommodated in the southern,central, and northern zones of the GLFZ. Di Toro and Pennacchioni(2005) traced a 0.4 m thick aplite dyke for c. 25 m across fault strike inthe southern zone. The aplite dyke was offset a total of c. 48 m, resultingin a fault displacement to fault thickness ratio, γ, of 1.95 (Fig. 10). This issimilar to γ of 1.8 measured across transect 15 (likely a slight underesti-mate; Figs. 5e and 10). Adoptingγ of 1.95 for the c. 250-m thick southernzone indicates that around 500 m of cumulative displacement was

42 S.A.F. Smith et al. / Tectonophysics 599 (2013) 29–44
accommodated in this zone. We consider this a reasonably wellconstrained estimate of cumulative displacement in the southern zonebecause nearly complete outcrop coverage was achieved along theline transects here, and no faults were observed that individually ac-commodated displacements greater than a fewmeters. Given that frac-ture properties (e.g. density, percentage of faults/joints, volume of faultrocks) and the general style of faulting in the c. 250-m thick northernzone are similar (Figs. 6 and 10), we tentatively suggest that cumulativedisplacement in the northern zonewas also on the order of several hun-dreds of meters, although quantitative estimates of γ in the northernzone are lacking.
It is more difficult to estimate how much displacement was ac-commodated in the central zone because of extreme disruption tostructural markers. The markedly higher fracture densities and volumeof fault rock materials in the central zone (Fig. 10) may suggest thatcumulative displacement was significantly higher than elsewhere inthe GLFZ. However, it is evident from detailed mapping in the centralzone that the relatively high fracture densities result from the presenceof networks of small-displacement cataclastic faults (Fig. 7a and b). Dis-placements across these faultswheremeasurable are typically no great-er than a few centimeters (Fig. 7a and b), and no faults were identifiedthat may have accommodated displacements larger than a few meters.From this, and also considering the thickness of the central zone(c. 100 m) with respect to the southern and northern zones (c. 250 m),we suggest that cumulative displacement in the central zone is unlikelyto have been more than a few hundred meters.
The most likely candidates for large-displacement structures inthe GLFZ are the 2 m-thick cataclastic horizons recognized at the mar-gins of the central zone (Fig. 10). Based on the thickness of these twostructures, and the fact that they are each associated with surroundingzones of protocataclasite up to several meters thick, it seems reasonableto suggest that they individually accommodated between several tensand several hundreds of meters displacement. Even if this is the case, itis evident that, in general, displacement in the GLFZ occurred by diffusefaulting across the entire fault zone width, with relevant displacementsbeing accommodated throughout the southern, central and northernzones. Additionally, the presence of pseudotachylytes across the entirefault zone width of c. 600 m (albeit in lower quantities in the northernzone), as well as at significant distances to the north of the GLFZ(Fig. 4), suggests that seismicity was broadly distributed over distancesof several hundreds of meters to kilometers.
6.3. Comparison to ancient and active seismogenic sources
The GLFZ shares certain characteristics with other large seismogenicstrike-slip fault zones cutting crystalline basement rocks and exhumedfrom depths of 7–15 km, including the Fort Foster Brittle Zone inMaine(hosted in phyllitic and quartzitic metasedimentary rocks; Swanson,1988, 2006), the Homestake Shear Zone in Colorado (hosted in LowerProterozoic gneisses and plutonic rocks of granitic to intermediate com-position; Allen, 2005) and the Glacier Lakes Fault in the Sierra Nevada(hosted in Mesozoic granites and granodiorites; Kirkpatrick et al.,2008). In each of these cases, deformation and seismicity (preservedas pseudotachylytes) were distributed amongst complex, linked zonesof damage hundreds of meters to kilometers in width, rather thanbeing localized within relatively narrow (less than a few meters) faultcores as has been documented for several large-displacement strike-slipfaults exhumed from shallower (b5 km) depths (e.g. Punchbowl andNorth Branch San Gabriel Faults, California, Chester et al., 1993; 2004;Chester and Logan, 1986; Schulz and Evans, 2000). In the HomestakeShear Zone and Fort Foster Brittle Zone, cataclasites and pseudotachylytesexploited pre-existing, finely-spaced (mm-scale)metamorphic foliationsin the host rocks. In particular, the structure of theGLFZ appears similar tothe Caleta Coloso fault in northern Chile (although no direct evidence forseismic slip has been identified in this fault; Faulkner et al., 2008;Mitchelland Faulkner, 2009). This large strike-slip fault is hosted mainly in
granodiorites, accommodated at least 5 km of left-lateral displacementandwas exhumed from5 to 10 kmdepth. The fault consists of a distinctlygreen in color, 200–300 m thick hydrothermally altered fault “core”containing protocataclasites and higher-strain ultracataclasite horizons,reminiscent of the central zone in the GLFZ (Faulkner et al., 2008). Thecore of hydrothermal alteration in the Caleta Coloso faultwas interpretedto result from extensive fluid–rock interaction and precipitation-strengthening (Faulkner et al., 2008). This is surrounded by zonesc. 150 m thick inwhich fracture andmicrofracture densities decrease to-wards background levels in the country rocks (Mitchell and Faulkner,2009), similar to within the southern and northern zones of the GLFZ.The GLFZ, with a total displacement on the order of 1–2 km,may be rep-resentative of an earlier stage in the evolution of large strike-slip faults inbasement with respect to that exhibited by the Caleta Coloso fault.
Field observations from the GLFZ and the other large (in some casespseudotachylyte-bearing) strike-slip faults above indicate that faultingand seismicity in crystalline basement of the middle crust may bemore widely distributed than is often assumed for faults in the uppercrust. This is compatible with recent seismological observations ofearthquake sequences in themiddle crust that show ruptures occurringwithin rock volumes hundreds of meters to kilometers wide, an exam-ple of which is described in the following two paragraphs.
A seismically active equivalent of the GLFZ and of the othermid-crustal pseudotachylyte-bearing fault zones above may be thefault network responsible for the 2002 Au Sable Forks M5 intraplateearthquake sequence (Kim and Abercrombie, 2006; Viegas et al., 2010).The hypocentral depths of the main shock and aftershocks in this earth-quake sequence were between 9.5 and 12 km (Viegas et al., 2010). Seis-mic reflection and tomographic studies measured high Vp/Vs ratios(1.84–1.81) and high Vp (6.6 km/s) at these depths, suggesting thepresence of dry rocks (low fluid pore-pressures) of mafic to tonaliticcomposition, consistentwith lithologies documented in the area by sur-face geological mapping (anorthosites, tonalites, gabbros, granulites;Musacchio et al., 1997;Wiener et al., 1984). A portable seismic networkinstalled in the week following the M5 mainshock allowed localizationof aftershock hypocenters to within an error of 500 m radius, makingthem the most well localized earthquakes in the northeastern US todate (Kim and Abercrombie, 2006; Viegas et al., 2010). Although themainshock fault surface could not be precisely determined (Seeberet al., 2002; Viegas et al., 2010), the aftershocks of the Au Sable Forksearthquake sequence illuminated a 700–1000 m thick seismicallyactive layer, most likely containing several sub-parallel fault strands(Viegas et al., 2010). Other high-precision earthquake relocation andtomographic studies have also documented aftershock sequences inthe middle crust (5–15 km) that define broad fault zones hundredsof meters to several kilometers wide (e.g. active strike-slip faults insouthern California, Allam and Ben-Zion, 2012; Hauksson, 2010; ac-tive normal faults in central Italy, Valoroso et al., 2013).
A second important characteristic of the Au Sable Forks earthquakesequence was the high static stress drops (187 MPa for the mainshock, and 104 MPa for the median of the M > 3 earthquakes) andthe high (roughly five times larger than plate boundary earthquakes)radiated energy and apparent stress (Viegas et al., 2010). Dry, maficrocks are amongst the most prone to melting in the case of extreme lo-calization under seismic deformation conditions (Niemeijer et al., 2011;Sibson and Toy, 2006). Frictional melting often results in melt lubrica-tion, at least for displacements larger than a few centimeters, whichcan induce large dynamic and static stress drops (Di Toro et al., 2011;Niemeijer et al., 2011). Given the favorable conditions and lithologies(dry silicate rocks), we might infer that pseudotachylytes were pro-duced during the Au Sable Forks earthquake sequence. The occurrenceof seismicity distributed over wide areas and, possibly, large stressdrops associated with frictional melting are characteristics that the AuSable Forks earthquake sequence shares with the GLFZ. These charac-teristics might be typical of mid-crustal earthquake sequences hostedin dry crystalline basement.
43S.A.F. Smith et al. / Tectonophysics 599 (2013) 29–44
7. Conclusions
The seismogenic GLFZ in the Italian Southern Alps is ~600 m thick inthe study area and contains a broadly symmetric across-strike damagestructure. It developed in tonalite host rocks containing pre-existingsets of magmatic cooling joints. The fault zone contains southern, cen-tral and northern zones distinguished by large variations in fractureproperties. The c. 100 m thick central zone has pervasive fracture dam-age in the form of dense cataclastic fault–fracture networks, and is bor-dered by two unusually thick and continuous cataclastic horizons. Thisis surrounded by c. 250 m thick southern and northern zones wherethe fracture density is lower and individual fault surfaces surroundrelatively intact blocks of tonalite. Microfractures sealed by K-feldspar,epidote and chlorite are most abundant within and immediately sur-rounding the central zone, suggesting that development of the fault–fracture networks was associatedwith pervasive fluid–rock interaction.Although pseudotachylytes are reworked and altered in the centralzone, their distribution overall suggests that seismicity associatedwith the GLFZ occurred over an area several hundreds of meters to kilo-meters wide. Qualitatively, the structure of the GLFZ resembles that ofother pseudotachylyte-bearing strike slip faults hosted in crystallinebasement and exhumed from mid-crustal depths. An active equivalentof the GLFZ may be the fault system responsible for the 2002 Au SableForks intraplate earthquake sequence, hosted in dry Precambrian crys-talline basement. We suggest that large stress drops andwidely distrib-uted seismicity will be typical of earthquake sequences in crystallinebasement, particularly in areas with distributed pre-existing anisot-ropies (joints, foliations) that favor the development of segmentedand discontinuous faulting.
Acknowledgments
This study was funded by the European Research Council StartingGrant USEMS (no. 205175). Ashley Griffith, Andre Niemeijer, MariekeRempe and Elena Spagnuolo are warmly acknowledged for their helpduring fieldwork. Andrea Cavallo provided assistance with the FE-SEMat INGV, Rome.
References
Allam, A.A., Ben-Zion, Y., 2012. Seismic velocity structures in the southern Californiaplate-boundary environment from double-difference tomography. GeophysicalJournal International 190, 1181–1196.
Allen, J.L., 2005. Amulti-kilometer pseudotachylyte system as an exhumed record of earth-quake rupture geometry at hypocentral depths (Colorado, USA). Tectonophysics 402(1–4), 37–54.
Anders, M.H., Wiltschko, D.V., 1994. Microfracturing, paleostress and the growth ofnormal faults. Journal of Structural Geology 16 (6), 795–815.
Ben-Zion, Y., 1998. Properties of seismic fault zone waves and their utility for imaginglow-velocity structures. Journal of Geophysical Research—Solid Earth 103 (B6),12567–12585.
Bistacchi, A., et al., 2011. Fault roughness at seismogenic depths from LIDAR and pho-togrammetric analysis. Pure and Applied Geophysics 168 (12), 2345–2363.
Boullier, A.M., Yeh, E.-C., Boutareaud, S., Song, S.-R., Tsai, C.-H., 2009. Microscale anatomyof the 1999 Chi–Chi earthquake fault zone. Geochemistry, Geophysics, Geosystems10 (3), Q03016. http://dx.doi.org/10.1029/2008GC002252.
Brack, P., 1981. Structures in the southwestern border of the Adamello intrusion.Schweizerische Mineralogische und Petrographische Mitteilungen 61, 37–50.
Castellarin, A., Cantelli, L., 2000. Neo-Alpine evolution of the Southern Eastern Alps.Journal of Geodynamics 30, 251–274.
Chester, F.M., Logan, J.M., 1986. Implications for mechanical-properties of brittle faults fromobservations of the Punchbowl Fault Zone, California. Pure and Applied Geophysics124 (1–2), 79–106.
Chester, F.M., Evans, J.P., Biegel, R.L., 1993. Internal structure and weakening mecha-nisms of the San-Andreas Fault. Journal of Geophysical Research—Solid Earth 98(B1), 771–786.
Chester, F.M., Chester, J.S., Kirschner, D.L., Schulz, S.E., Evans, J.P., 2004. Structure of large-displacement, strike-slip fault zones in the brittle continental crust. In: Karner, G.D.,Taylor, B., Driscoll, N.W., Kohlstedt, D.L. (Eds.), Rheology and Deformation in the Lith-osphere at Continental Margins. Columbia University Press, New York.
Cochran, E.S., Li, Y.G., Shearer, P.M., Barbot, S., Fialko, Y., Vidale, J.E., 2009. Seismic andgeodetic evidence for extensive, long-lived fault damage zones. Geology 37 (4),315–318.
Dallai, L., Mittempergher, S., Di Toro, G., Pennacchioni, G., 2009. Origin of fluids in seis-mic faults from stable isotopes study of pseudotachylytes. European GeosciencesUnion General Assembly: Geophysical Research Abstracts. Copernicus, Vienna,pp. EGU2009–EGU3351.
Del Moro, A., Pardini, G., Quercioli, C., Villa, I.M., Callegari, E., 1983. Rb/Sr and K/Ar chro-nology of Adamello granitoids, southern Alps. Memorie della Societa' GeologicaItaliana 26, 285–299.
Di Toro, G., Pennacchioni, G., 2004. Superheated friction-induced melts in zonedpseudotachylytes within the Adamello tonalites (Italian Southern Alps). Journalof Structural Geology 26 (10), 1783–1801.
Di Toro, G., Pennacchioni, G., 2005. Fault plane processes and mesoscopic structure of astrong-type seismogenic fault in tonalites (Adamello batholith, Southern Alps).Tectonophysics 402 (1–4), 55–80.
Di Toro, G., Nielsen, S., Pennacchioni, G., 2005. Earthquake rupture dynamics frozen inexhumed ancient faults. Nature 436 (7053), 1009–1012.
Di Toro, G., Han, R., Hirose, T., De Paola, N., Nielsen, S., Mizoguchi, K., Ferri, F., Cocco, M.,Shimamoto, T., 2011. Fault lubrication during earthquakes. Nature 471 (7339), 494–498.
Engelder, J.T., 1974. Cataclasis and the generation of fault gouge. Geological Society ofAmerica Bulletin 85, 1515–1522.
Faulkner, D.R., Lewis, A.C., Rutter, E.H., 2003. On the internal structure and mechanicsof large strike-slip fault zones: field observations of the Carboneras fault insoutheastem Spain. Tectonophysics 367 (3–4), 235–251.
Faulkner, D.R., Mitchell, T.M., Rutter, E.H., Cembrano, J., 2008. On the structure and me-chanical properties of large strike-slip faults. In: Wibberley, C.A.J., Kurz, W., Imber,J., Holdsworth, R.E., Collettini, C. (Eds.), The Internal Structure of Fault Zones:Implications for Mechanical and Fluid Flow Properties. The Geological Society ofLondon, London, pp. 139–150.
Faulkner, D.R., Jackson, C.A.L., Lunn, R.J., Schlische, R.W., Shipton, Z.K., Wibberley, C.A.J.,Withjack, M.O., 2010. A review of recent developments concerning the structure,mechanics and fluid flow properties of fault zones. Journal of Structural Geology32, 1557–1575.
Gratier, J.P., Gueydan, F., 2007. Deformation in the presence of fluids andmineral reactions:effects of fracturing and fluid–rock interaction on seismic cycles. In: Handy, M.R., Hirth,G., Hovius, N. (Eds.), DahlemWorkshop Reports, Tectonic Faults: Agents of Change ona Dynamic Earth. The MIT Press, pp. 319–356.
Gratier, J.P., Favreau, P., Renard, F., 2003. Modeling fluid transfer along California faultswhen integrating pressure solution crack sealing and compaction processes. Jour-nal of Geophysical Research 108 (B2), 2014.
Griffith, W.A., Nielsen, S., Di Toro, G., Smith, S.A.F., 2010. Rough faults, distributed weaken-ing, and off-fault deformation. Journal of Geophysical Research 115. http://dx.doi.org/10.1029/2009JB006925.
Griffith,W.A., Mitchell, T.M., Renner, J., Di Toro, G., 2012. Coseismic damage and softeningof fault rocks at seismogenic depths. Earth and Planetary Science Letters 353,219–230.
Hauksson, E., 2010. Spatial separation of large earthquakes, aftershocks, and back-ground seismicity: analysis of interseismic and coseismic seismicity patterns insouthern California. Pure and Applied Geophysics 167, 979–997.
John, B.E., Blundy, J.D., 1993. Emplacement-related deformation of granitoid magmas,southern Adamello Massif, Italy. Bulletin of the Geological Society of America105, 1517–1541.
Kim, W.-Y., Abercrombie, R.E., 2006. Source scaling of earthquakes in the northeasternUnited States. NEHRP Final Technical Report, Award Number 04HQGR-0018.
Kirkpatrick, J.D., Shipton, Z.K., Evans, J.P., Micklethwaite, S., Lim, S.J., McKillop, P., 2008.Strike-slip fault terminations at seismogenic depths: the structure and kinematicsof the Glacier Lakes fault, Sierra Nevada United States. Journal of Geophysical Re-search 113 (B4). http://dx.doi.org/10.1029/2007jb005311.
Li, H., Wang, H., Xu, Z., Si, J., Pei, J., Li, T., Huang, Y., Song, S.-R., Kuo, L.-W., Sun, Z.,Chevalier, M.-L., Liu, D., 2012. Characteristics of the fault-related rocks, faultzones and the principal slip zone in the Wenchuan Earthquake Fault Scientific Dril-ling Project Hole-1 (WFSD-1). Tectonophysics 584, 23–42.
Mitchell, T.M., Faulkner, D.R., 2009. The nature and origin of off-fault damage surroundingstrike-slip fault zones with a wide range of displacements: a field study from theAtacama fault system, northern Chile. Journal of Structural Geology 31 (8), 802–816.
Mittempergher, S., Pennacchioni, G., Di Toro, G., 2009. The effects of fault orientationand fluid infiltration on fault rock assemblages at seismogenic depths. Journal ofStructural Geology 31 (12), 1511–1524.
Musacchio, G., Mooney, W.D., Luetgert, J.H., Christensen, N.I., 1997. Composition of thecrust in the Grenville and Appalachian Provinces of North America inferred fromVp/Vs ratios. Journal of Geophysical Research 102 (B7), 15,225–15,241.
Nestola, F., Mittempergher, S., Di Toro, G., Zorzi, F., Pedron, D., 2010. Evidence ofdmisteinbergite (hexagonal form of CaAl(2)Si(2)O(8)) in pseudotachylyte: a toolto constrain the thermal history of a seismic event. American Mineralogist 95(2–3), 405–409.
Niemeijer, A., Di Toro, G., Nielsen, S., Di Felice, F., 2011. Frictionalmelting of gabbro under ex-treme experimental conditions of normal stress, acceleration, and sliding velocity. Jour-nal of Geophysical Research—Solid Earth 116. http://dx.doi.org/10.1029/2010jb008181.
Pennacchioni, G., 2005. Control of the geometry of precursor brittle structures on thetype of ductile shear zone in the Adamello tonalites, Southern Alps (Italy). Journalof Structural Geology 27 (4), 627–644.
Pennacchioni, G., Di Toro, G., Brack, P., Menegon, L., Villa, I.M., 2006. Brittle–ductile–brittle deformation during cooling of tonalite (Adamello, Southern Italian Alps).Tectonophysics 427 (1–4), 171–197.
Reverman, R.L., Fellin, G., Herman, F., Willett, S.D., Fitoussi, C., 2012. Climatically versustectonically forced erosion in the Alps: thermochronometric constraints from theAdamello Complex, Southern Alps, Italy. Earth and Planetary Science Letters339–340, 127–138.
44 S.A.F. Smith et al. / Tectonophysics 599 (2013) 29–44
Riklin, K., 1985. Contact metamorphism of Permian “red sandstones” in the Adamelloarea. Memorie della Societa' Geologica Italiana 26, 159–169.
Scholz, C.H., 2002. The Mechanics of Earthquakes and Faulting. Cambridge UniversityPress, Cambridge (471 pp.).
Schonborn, G., 1992. Alpine tectonic and kinematic models of Central Southern Alps.Memorie di Scienze Geologiche 44, 229–393.
Schulz, S.E., Evans, J.P., 2000. Mesoscopic structure of the Punchbowl Fault, SouthernCalifornia and the geologic and geophysical structure of active strike-slip faults.Journal of Structural Geology 22 (7), 913–930.
Seeber, L., Kim, W.-Y., Armbruster, J.G., Du, W., Lerner-Lam, A., 2002. The 20 April 2002Mw 5.0 earthquake near Au Sable Forks, Adirondacks, New York: a first glance at anew sequence. Seismological Research Letters 74 (4), 480–489.
Sibson, R.H., 1983. Continental fault structure and the shallow earthquake source. Jour-nal of the Geological Society 140, 741–767 (Sep).
Sibson, R.H., Toy, V.G., 2006. The habitat of fault-generated pseudotachylyte: presencevs. absence of friction-melt. In: Abercrombie, R., McGarr, A., Di Toro, G., Kanamori,H. (Eds.), Earthquakes: Radiated Energy and the Physics of Faulting. : GeophysicalMonograph Series. American Geophysical Union, Washington, pp. 153–166.
Stipp, M., Fugenschuh, B., Gromet, L.P., Stunitz, H., Schmid, S.M., 2004. Contempora-neous plutonism and strike slip faulting: a case study from the Tonale fault zonenorth of the Adamello pluton (Italian Alps). Tectonics 23. http://dx.doi.org/10.1029/2003tc001515.
Sutherland, R., Toy, V.G., Townend, J., Cox, S.C., Eccles, J.D., Faulkner, D.R., Prior, D.J.,Norris, R.J., Mariani, E., Boulton, C., Carpenter, B.M., Menzies, C.D., Little, T.A.,Hasting, M., De Pascale, G.P., Langridge, R.M., Scott, H.R., Lindroos, Z.R., Fleming,B., Kopf, A.J., 2012. Drilling reveals fluid control on architecture and rupture ofthe Alpine fault, New Zealand. Geology 40, 1143–1146.
Swanson, M.T., 1988. Pseudotachylyte-bearing strike-slip duplex structures in the FortFoster Brittle Zone, S Maine. Journal of Structural Geology 10 (8), 813–828.
Swanson, M.T., 2006. Pseudotachylyte-bearing strike-slip faults in mylonitic host rocks,Fort Foster Brittle Zone, Kittery, Maine. Earthquakes: Radiated Energy and thePhysics of Faulting 170, 167–179.
Valoroso, L., Chiaraluce, L., Piccinini, D., Di Stefano, R., Schaff, D., Waldhauser, F., 2013. Ra-diography of a normal fault system by 64,000 high-precision earthquake locations:the 2009 L'Aquila (central Italy) case study. Journal of Geophysical Research—SolidEarth. http://dx.doi.org/10.1002/jgrb.50130.
Vermilye, J.M., Scholz, C.H., 1998. The process zone: a microstructural view of faultgrowth. Journal of Geophysical Research—Solid Earth 103 (B6), 12223–12237.
Viegas, G., Abercrombie, R.E., Kim, Y., 2010. The 2002 M5 Au Sable Forks, NY, earth-quake sequence: source scaling relationships and energy budget. Journal of Geo-physical Research 115, B07310.
Viola, G., 2000. Kinematics and Timing of the Periadriatic Fault System in the GiudicarieRegion (Central Eastern-Alps). ETH Zurich, Zurich.
Viola, G., Mancktelow, N., Seward, D., 2001. Late Oligocene–Neogene evolution of Europe–Adria collision: new structural and geochronological evidence from the Giudicarie faultsystem (Italian Eastern Alps). Tectonics 20, 999–1020.
Wibberley, C.A.J., Yielding, G., Di Toro, G., 2008. Recent advances in the understandingof fault zone internal structure: a review. In: Wibberley, C.A.J., Kurz, W., Imber, J.,Holdsworth, R.E., Collettini, C. (Eds.), The Internal Structure of Fault Zones: Impli-cations for Mechanical and Fluid Flow Properties. The Geological Society of London,London, pp. 5–33.
Wiener, R.W., McLelland, J.M., Isachsen, W.I., Hall, L.M., 1984. Stratigraphy and struc-tural geology of the Adirondack Mountains, New York: review and synthesis. In:Bartholomew, M.J. (Ed.), The Grenville Event in the Appalachians and RelatedTopics: Geological Society of America Special Papers, pp. 1–55.
Wilson, J.E., Chester, J.S., Chester, F.M., 2003. Microfracture analysis of fault growth andwear processes, Punchbowl fault, San Andreas system. Journal of Structural Geology25 (11), 1855–1873.
Zoback, M.D., Hickman, S., Ellsworth, W.L., SAFOD Science Team, 2011. Scientificdrilling into the San Andreas Fault Zone—an overview of SAFOD's first five years.Scientific Drilling 11, 14–28.