the solow productivity paradox in...
TRANSCRIPT
THE SOLOW PRODUCTIVITY PARADOX IN HISTORICAL PERSPECTIVE
By
Nicholas Crafts
(London School of Economics)
November 2001.
Abstract A growth accounting methodology is used to compare the contributions to growth in terms of capital-deepening and total factor productivity growth of three general-purpose technologies, namely, steam in Britain during 1780-1860, electricity and information and communications technology in the United States during 1899-1929 and 1974-2000, respectively. The format permits explicit comparison of earlier episodes with the results for ICT obtained by Oliner and Sichel. The results suggest that the contribution of ICT was already relatively large before 1995 and it is suggested that the true productivity paradox is why economists expected more sooner from ICT. Funding from ESRC grant R000239536 is gratefully acknowledged. I am grateful to Bob Allen, Dudley Baines, Tam Bayoumi, Steve Broadberry, Bill Kennedy, Tim Leunig, Bill Martin, Mar Rubio, and Joachim Voth for constructive criticism. Earlier versions were presented to the conference "Long Term Trends in the World Economy", Copenhagen and to seminars at Cambridge, HM Treasury, LSE, Southampton and Universidade Nova de Lisboa where I have benefited from comments by participants. I am responsible for all errors.
1
1. Introduction
Robert Solow's famous 1987 quip that "You can see the computer age everywhere but in the
productivity statistics" still continues to provoke a great deal of research, although for the
very recent past, at last, it no longer appears to be quite so apposite (Oliner and Sichel, 2000).
For example, Triplett (1999) reviews no less than eight common 'explanations' for Solow's
productivity paradox. However, relatively little attention has been paid to placing the recent
experience of Information and Communications Technology (ICT) in historical perspective
with the notable exception of the computer-dynamo analogy suggested in David (1991).
This paper attempts to fill this gap by examining the impact of the two previous technological
breakthroughs with similar claims to be regarded as general purpose technologies (Bresnahan
and Trajtenberg, 1995), namely, steam and electricity, in a growth accounting framework.
The results of this exercise are striking: they suggest that the growth contribution of ICT in
the past 25 years has exceeeded that of steam and at least matched that of electricity over
comparable periods and that the true paradox is why more should have been expected of ICT.
The ambitions of the present paper are relatively modest and extend simply to compiling the
available evidence into formats which readily permit comparison between these episodes of
technological change. There are important lacunae in the currently available information
which, if filled, might revise the picture. These relate especially to total factor productivity
(TFP) spillovers. In this sense, and because the ICT revolution may be far from complete,
the comparisons are inevitably provisional.
2
2. Contributions of New Technology to Growth: an Endogenous Innovation Growth
Accounting Methodology
Recent estimates of the ICT contribution to OECD economic growth have relied on variants
of growth accounting techniques derived from the new growth economics (Colecchia, 2001).
The traditional neoclassical single sector approach captures a contribution to growth from
exogenous technological change in the Solow residual (TFP growth). With the standard
Cobb-Douglas production function and competitive assumptions
Y = AKαL1 − α (1)
the Solow residual is computed as
∆A/A = ∆Y/Y − sK∆K/K − sL∆L/L (2)
where sK and sL are the factor income shares of capital and labor respectively.
A straightforward generalization of this is used by Oliner and Sichel (2000) which features
different varieties of capital (including computer hardware, software and communication
equipment as types of ICT capital) whose growth contributions are weighted by their shares
in income, and in which TFP growth is decomposed into TFP growth in making ICT capital
and in other activities weighted by output shares. The contribution of innovations in ICT is
captured through two components: extra TFP growth and through the three additional capital
inputs. This is similar to the endogenous innovation based growth accounting for the
3
expanding varieties growth models of Romer (1990) and Grossman and Helpman (1991), as
set out in Barro (1999).
A different strand of endogenous growth economics is adopted by Schreyer (2000) in which
ICT capital goods are 'special' in that they provide knowledge spillovers or other positive
externalities to the economy similar to the formulation in Romer (1986). To capture this idea
in the one sector model, equation (1) is rewritten as
Y = AKα + β L1 − α (3)
where β > 0 represents the impact of the knowledge spillover on output. If the contribution
of capital is still weighted by sK = α, then the standard Solow residual becomes
∆Y/Y − sK∆K/K − sL∆L/L = ∆A/A + β∆K/K (4)
so it comprises both exogenous technological change and the growth effect from spillovers.
These potential impacts of ICT on growth can be combined in a growth accounting equation
of the following type
∆Y/Y = sKO∆KO/KO + sKICTU∆KICTU/KICTU + + sL∆L/L + γ(∆A/A)ICTM +
(φ)(∆A/A)NICTM + β∆KICTU/KICTU (5)
4
where KICTU is ICT capital goods used in production, KO is non-ICT capital goods, and γ
and φ are the gross output shares of the ICT capital goods making sector, ICTM and the rest
of the economy, NICTM. The contribution of ICT innovation comes from the new capital
goods involved in its use and from TFP growth both in making ICT capital goods and also in
knowledge spillovers from their use.
The framework of equation (5), with its summation of the growth contributions of a new
technology in terms of capital deepening, reductions in the real cost of producing the capital
goods in which it is embodied and TFP spillovers, can readily be employed to examine the
impact on growth of earlier advances in technology. This paper does just this to estimate the
impact on growth of steam in Britain during the first industrial revolution and of electricity in
the United States in the early twentieth century, in each instance a case of a new general
purpose technology being developed in the leading economy of the day and thus interesting
parallels from which to develop an historical perspective on today's ICT revolution.
In general, growth accounting attempts to measure the realised results of investment that has
taken place and addresses the question 'how much did the new technology contribute ?' rather
than the question 'how much more did it contribute than an alternative investment might have
yielded ?' which is the focus of the social saving methodology widely used in cliometrics
(Fogel, 1979). In particular, the growth accounting that has been used to quantify the impact
of ICT is based on an endogenous innovation growth model in which new technology is
embodied in capital equipment. If the results are taken to be the net contribution of the
innovation, then the implicit assumption is that the there is no substitution of investment in
these capital goods for older types of capital and that there are no offsets to TFP growth from
5
the move of resources to the new activity. Thus, the estimated contribution to growth is gross
rather than net.
3. Growth Accounting Estimates for Electricity, ICT and Steam
Table 1 reports a summary of the growth accounting results for the impact of ICT on US
economic growth in the period 1974-2000 presented in the update by Sichel of the well-
known study by Oliner and Sichel (2000). The estimates include contributions both from the
use of ICT capital and from TFP growth in the production of computing equipment. The
overall ICT growth effect is estimated to have been about 0.7 percentage points per year
through the mid-1990s but with a sharp acceleration to over double this in the late 1990s. It
is important to note that the impact would be considerably smaller if software and
communication equipment were excluded, as they were in most earlier studies, with the ICT
capital contribution falling to 0.29, 0.21 and 0.65 percentage points and the overall impact to
0.46, 0.45 and 1.15 percentage points in the successive periods.
The estimates in Table 1 will be used for comparisons with electricity and steam in the
following section and are preferred for this purpose to the alternative estimates in Jorgenson
and Stiroh (2000) and Whelan (2000). The former included software and communication
equipment but found a lower contribution from ICT capital; for the periods 1973-90, 1990-5
and 1995-8 they estimated an impact of 0.32, 0.35 and 0.63 percentage points, respectively.
The difference is largely accounted for by their use of a broader concept of income which
includes imputations for consumer durable services and thus has a lower income share for
ICT capital. The latter deals only with the effect of computer hardware use which was found
to be about 0.1 percentage points per year higher than in Table 1 through 1995 and TFP
6
growth in computer production estimated to contribute about 0.04 percentage points more.
The difference in Whelan's estimates comes primarily from the use of a different assumption
about depreciation rates in computer capital. Neither of these studies is as suitable for
historical comparisons as that of Oliner and Sichel (2000); Jorgenson and Stiroh's income
concept is not comparable with the data for earlier periods and Whelan's coverage is too
narrow. Nevertheless, their results will be borne in mind.
There is no entry in Table 1 for TFP spillovers. Evidence of these has been quite hard to
come by and the most detailed cross-sectional study, that of Stiroh (1998) covering the years
1974 to 1991, concluded that the null hypothesis that, at the sectoral level, investment in
computers had no effect on TFP growth could not be rejected. In the later 1990s, however,
there was a notable surge in TFP growth not related to ICT production − its contribution to
growth rose from 0.51 per cent per year in 1974-1995 to 1.13 per cent per year in 1996-2000
(Sichel, 2001). It is widely agreed that this owed something to spillovers from ICT capital
formation but as yet it has not been possible to quantify these effects (Pilat and Lee, 2001).
There is also no attempt in Table 1 to correct for cyclical effects which are claimed by some
commentators to have had a substantial impact on productivity performance in the ICT using
sectors of the economy (Gordon, 2000). These may have been important in terms both of
unsustainable ICT capital deepening and of creating a confusion of capacity utilization
effects for TFP spillovers. It is too soon to be sure how to interpret the productivity
performance of the late 1990s. Nevertheless, the sectoral pattern of labor productivity
growth, which was heavily skewed towards contributions from ICT-intensive industries
(Stiroh, 2001), and the evidence of micro studies that find important lagged productivity
gains from reorganizations of work facilitated by ICT (Brynjolffson and Hitt, 2000) suggest
7
that a significant part of the economy wide TFP acceleration in these years may have been
due to TFP spillover effects from ICT investment.
The next task is to implement the growth accounting framework of equation (5) for the earlier
technological breakthroughs of steam in the nineteenth century and electricity in the early
twentieth century. By following an approach as similar as possible to that which has been
used for the ICT revolution, it will be possible to benchmark that experience in terms of the
past. Obviously, the data is of lower quality in these cases but they are good enough to
provide reasonably clear yardsticks with which to put the Solow productivity paradox in an
historical perspective. To compensate for the quality of the data, the implementation of the
growth accounting exercises will follow a strategy of providing upper bound estimates for
these earlier episodes where possible.
In examining the contribution of steam to nineteenth century economic growth, we can draw
on early research in cliometrics. A central theme of that literature was that even major
technological changes had modest impacts on growth. The central point made by Fogel's
study of the railroad in the United States was that "no single innovation was vital for
economic growth in the nineteenth century" (1964, p. 234). Similarly, von Tunzelmann
(1978) estimated that, if James Watt had not invented the improved steam engine in 1769, the
national income of Great Britain in 1800 would have been reduced by only about 0.1 per
cent.
Table 2 reports the results of a compilation of information from existing studies on the impact
of stationary steam engines used in industry and of railways (a sector wholly dependent on
setam power) into a growth accounting format comparable with that for ICT in Table 1. The
8
data on steam engines is incomplete, especially for the period between 1800 when Watt's
patents expired and 1838 when the first returns under the Factory Acts were made.
Nevertheless, there is general agreement on the broad picture of the use of steam power. In
1800 there were about 35,000 and in 1830 about 160,000 steam horsepower (Kanefsky,
1979a) and even in 1870 only about 1.7 million steam horsepower were in use (Kanefsky,
1979b), representing about 2.5 per cent of the capital stock. Steam power was intensively
used in textiles, the iron industry and coal mining but important sectors of the economy
including agriculture and the tertiary sector outside of transport were virtually untouched by
it. For a very long time water power remained cheaper for most users. Thus the capital
deepening contribution reported in Table 2 is quite small.
Although Watt's steam engine represented an important advance, from 1800 to about 1840
there was little further advance and the capital costs of steam engines did not fall − there was
no equivalent to Moore's Law in operation then. There followed a period of further advance;
many steam engines were upgraded to work at higher pressures and the price of steam power
to the user had approximately halved by the mid-1850s (von Tunzelmann, 1978). Insofar as
this represented an upgrading in quality in the steam engine, it is (imperfectly) captured in the
data which after 1860 are for 'indicated' horsepower. There are, however, no hedonic prices
for steam engines with which to refine the national accounts data.
Table 2 shows an appreciable contribution to growth from steam only during the railway age
which is conventionally dated from the opening of the Liverpool and Manchester Railway in
1830. A massive investment in railway construction ensued although the profits obtained
were relatively modest. Railway technology developed rapidly but the research carried out
by Hawke (1970) in a study that followed Fogel's lead in seeking to estimate the social
9
savings of railways and whose results are incorporated in Table 2 shows clearly that the
contribution to TFP growth was fairly modest.
Taken at face value, the message of Table 2 is quite clear: steam power's impact on economic
growth was modest throughout the industrial revolution and on into the railway age when
compared with that of ICT. TFP growth in the computer sector has exceeded that on the
railroads by massive amounts, especially recently. But the much greater impact of ICT
applies not only to TFP growth but also to capital inputs, and was apparent prior to the post-
1995 growth spurt.
Table 2 includes estimates of the contribution from capital deepening and own TFP growth
but does not, however, include any estimate of TFP spillovers from steam. With regard to
railways, this was considered very explicitly in the social savings calculation made by Hawke
who firmly rejected the notion that these were important (Hawke, 1970, ch. 14). The
intuition behind this finding is that railways seem to have had very little impact on location
decisions in the mid nineteenth century in an economy which had already adapted to canals.
Where the steam engine is concerned, the situation is more complicated.
Von Tunzelmann examined the impact of steam power on technological progress in the
textile industries where the main effects were most likely to be found. He noted that all the
famous developments of the eighteenth century were originally developed for other forms of
power; if there were important forward linkages, he suggested that they came late in the day
in the period 1847 to 1860 (1978, p. 183, 292). Crude estimates based on Blaug (1961)
indicate that TFP growth in cotton textiles was around 2 per cent per year during 1830-60 in
an industry whose gross output was about 10 per cent of GDP (Deane and Cole, 1962). If
10
this were all attributed to spillovers from steam, the addition to its growth contribution would
only be about 0.2 per cent per year for 1830-60.
Alternatively, in search of an upper bound for TFP spillovers from steam recourse may be
had to the estimates using Domar weights made by Harley (1999, p. 184) of contributions to
TFP growth in Britain by steam intensive sectors (cottons, woollens, iron) for the period
1780-1860. These amount to 0.22 per cent per year. Adding this to the estimates for capital
deepening and own TFP growth in Table 2 does not produce a growth contribution to match
that of ICT prior to 1995.
The NBER research program of the Kuznets era into capital formation and productivity
growth provides most of the data that is required to pursue the impact of electricity on
economic growth through a growth accounting framework. In addition, the impact of
electricification on manufacturing productivity has been intensively studied by economic
historians (David and Wright, 1999; Devine, 1983) and this provides considerable insight
into the issue of TFP spillovers.
The most important gap in the information set is the non-availability of estimates of capital
income shares. It seems clear, however, that the profits from owning these new forms of
capital were competitive rather than supernormal (Brookes and Wahhaj, 2000) and the shares
of capital income have therefore been assumed to correspond to shares of the capital stock in
1925. That year is the earliest for which data are available. It should be noted that the use of
such a late year relative to the midpoint of the period imparts a considerable upward bias to
the estimates for 1899-1929 (though obviously not for 1919-1929) and is tantamount to
assuming quite sizeable excess returns.
11
Table 3 reports the results of converting the data on the electricals sector into the same
growth accounting framework that was employed in the earlier tables. In this case, it is
possible to include an estimate of the impact of TFP spillovers which are generally thought to
have been substantial during the productivity growth surge of the 1920s though negligible
earlier. TFP growth in manufacturing rose from 0.5 per cent per year in 1899-1919 to 5.3 per
cent per year in 1919-29 (Kendrick, 1961). The spillovers resulted from the widespread
adoption of electric unit drive. This permitted substantial improvements in factory design
and associated capital savings, the achievement of which was based on learning externalities.
The results of a cross-section regression that relates the sectoral acceleration of TFP growth
in the 1920s to the extent of adoption of electric unit drive imply that this made a
contribution of 2.4 percentage points per year to total manufacturing TFP growth (David and
Wright, 1999, p.41). The estimate in Table 3 is based on this result, and assumes no effect in
the remaining 70 percent or so of GDP or before 1919.
The message of Table 3 is less clear cut than that of Table 2, notably because of the strong
growth contribution of electricity in the 1920s. Prior to this, the total growth contribution of
electricals was only about half that for ICT reported in Table 1. In Tables 1 and 3, the
proportion of GDP/person growth accounted for by electricity in 1899-1929 appears
comparable with that of ICT during 1974-90.
The difference after 1919 is entirely due to the effect of the TFP spillovers kicking in.
Absent this contribution, even in the 1920s, the total impact on growth would only have been
about 0.3 per cent per year. Over the whole period, however, it is noticeable that TFP growth
in the production of electricity and electrical machinery compares unfavorably with that in
12
computer production reported in Table 1 and that the share of electrical capital goods in the
capital stock was even smaller than that of ICT. The large TFP spillovers component for
1920s electricity pushes its growth contribution in that decade ahead of anything achieved by
ICT before the mid-1990s but appears to have been matched in the late 1990s even on the
estimates in Jorgenson and Stiroh (2000) which show a total ICT contribution of 1.07 per
cent per year for 1995-8.
The claim that the contribution to economic growth to date of ICT outweighs that of
electricity over a comparable period is strengthened when it is recognized both that the
results for 1899-1929 are biased upwards by use of capital shares for 1925 and also that it is
likely that there are some TFP spillovers to ICT which have eluded measurement thus far. It
should be noted that parts of the service sector are among the main users of ICT and that the
response of output to ICT may be masked by measurement problems (McGuckin and Stiroh,
2000). On the other hand, there may also have been further TFP spillovers from electricity.
In particular, the literature has not yet seriously considered the potential impact of
reorganization effects in offices in the service sector which may in some ways parallel the
experience of the factory.
Thus, growth accounting estimates suggest that, even prior to 1995, the growth contribution
of ICT exceeded that of steam and electricity in their early days. However, it must be
remembered that the data that have been used to make these calculations are not entirely
comparable across these episodes. In particular, the estimates for ICT have benefited from
the use of hedonic price indices to measure real expenditure on computers and software
whereas these are not available for steam or electricity.
13
The principle of using hedonic prices is not now in dispute. Has the practise made a great
deal of difference to the estimated growth contribution of ICT such that the apparently
greater impact on growth of ICT is potentially just a reflection of superior statistical
technique ? An answer to this question can be obtained by comparing the rates of price
decrease for computers and software according to the national accounts of the USA and of
the UK, a country which continued to use traditional methods to estimate price declines for
these items. The data presented in Oulton (2001) show that price decreases in the United
States for computers (software) were greater by 7.3 (0.6) per cent per year for 1979-89 and
8.8 (3.4) per cent per year for 1989-94. This suggests that the use of hedonic prices in Table
1 raises the ICT capital-deepening contribution by a little less than 0.1 percentage points per
year and the own TFP contribution by a similar amount. If a correction of this magnitude
were made, then the impact of ICT on growth prior to 1995 would still far outstrip steam but
would be fairly similar to electricity for 1899-1929.
It seems clear that the ICT revolution has had an impact on economic growth that dominates
that of steam and is comparable with that of electricity. The notion of a productivity paradox
in the context of ICT was greatly overplayed. It was valid only in terms of the apparent
absence of TFP spillovers not in terms of the overall impact on growth of output and labor
productivity. As with other general purpose technologies, in the early stages the impact was
muted by the small shares of output and the capital stock accounted for by production and use
of the new varieties of capital. Although to economists the growth impact may for a long
time have seemed disappointing, to economic historians it would seem unrealistic to expect
too much too soon.
4. Conclusions
14
Recent estimates of the contribution of ICT to US economic growth have employed growth
accounting methodologies in which the new technology potentially has impacts through use
of new capital goods, TFP growth in making the new capital goods and TFP spillovers. This
paper has used a similar approach to generate estimates of the impacts of earlier general
purpose technologies, electricity and steam, that can be compared with those of ICT.
The main results of this benchmarking exercise are:
(1) Even before the mid-1990s, ICT had a much bigger impact on growth than steam and at
least a similar impact to that of electricity in a similar early phase.
(2) The Solow productivity paradox stems largely from unrealistic expectations. In the early
phases of general purpose technologies their impact on growth is modest because the new
varieties of capital have only a small weight relative to the economy as a whole.
(3) If there has been an ICT productivity paradox, it comprises an apparent absence of TFP
spillovers; in this respect, the contribution made by electricity in the 1920s through its impact
on the reorganization of factory work has probably not yet been matched by ICT.
There are, of course, still weaknesses in the evidence that it is hoped will be remedied by
future research. In each of the three cases reviewed here it would be highly desirable to
devote more effort to attempts to quantify TFP spillovers from the use of the new technology.
And more precise estimates of the impacts of steam and electricity could be obtained if it
15

becomes possible to construct hedonic price indices for the capital goods in which those
technologies were embodied.
16
References Barro, R. J. (1999), "Notes on Growth Accounting", Journal of Economic Growth, 4, 119- 137. Blaug, M. (1961), "The Productivity of Capital in the Lancashire Cotton Industry during the Nineteenth Century", Economic History Review, 13, 358-381. Bresnahan, T. F. and Trajtenberg, M. (1995), "General Purpose Technologies: 'Engines of Growth'?", Journal of Econometrics, 65, 83-108. Brynjolffson, E. and Hitt, L. M. (2000), "Beyond Computation: Information Technology, Organizational Transformation and Business Performance", Journal of Economic Perspectives, 14(4), 23-48. Brookes, M. and Wahhaj, Z. (2000), "Is the Internet Better than Electricity ?", Goldman Sachs Global Economics Paper No. 49. Bureau of Economic Analysis (1974), Fixed Nonresidential Business Capital in the United States, 1925-1973. Washington, DC: Government Printing Office. Colecchia, A. (2001), "The Impact of Information and Communiactions Technology on Growth", OECD STI Working Paper, forthcoming. David, P. A. (1991), "Computer and Dynamo: The Modern Productivity Paradox in a Not- Too-Distant Mirror", in OECD, Technology and Productivity: The Challenge for Economic Policy. Paris: OECD, 315-348. David, P. A. and Wright, G. (1999), "Early Twentieth Century Productivity Growth Dynamics: An Inquiry into the Economic History of 'Our Ignorance'", University of Oxford Discussion Papers in Economic History No. 33. Deane, P. and Cole, W. A. (1962), British Economic Growth, 1688-1959. Cambridge: Cambridge University Press. Devine, W. (1983), "From Shafts to Wires: Historical Perspective on Electrification", Journal of Economic History, 43, 347-372. Fabricant, S. (1940), The Output of Manufacturing Industries, 1899-1937. New York: National Bureau of Economic Research. Feinstein, C. H. (1988), "National Statistics, 1760-1920", in C. H. Feinstein and S. Pollard (eds.), Studies in Capital Formation in the United Kingdom, 1750-1920. Oxford: Clarendon Press, 257-471. Fogel, R. W. (1964), Railroads and American Economic Growth: Essays in Econometric History. Baltimore: Johns Hopkins University Press. Gordon, R. J. (2000), "Does the 'New Economy' Measure Up to the Great Inventions of the
17
Past ?", Journal of Economic Perspectives, 14(4), 49-74. Gould, J. M. (1946), Output and Productivity in the Electric and Gas Utilities, 1899-1942. New York: National Bureau of Economic Research. Grossman, G. M. and Helpman, E. (1991), Innovation and Growth in the Global Economy. Cambridge, Mass.: MIT Press. Harley, C. K. (1999), "Reassessing the Industrial Revolution: A Macro View", in J. Mokyr (ed.), The British Industrial Revolution: An Economic Perspective. Oxford: Westview Press, 160-205. Hawke, G. R. (1970), Railways and Economic Growth in England and Wales, 1840-1870. Oxford: Clarendon Press. Jorgenson, D. W. and Stiroh, K. J. (2000), "Raising the Speed Limit: US Economic Growth in the Information Age", Brookings Papers on Economic Activity, 1, 125-211. Kanefsky, J. W. (1979a), "The Diffusion of Power Technology in British Industry", unpublished Ph. D. thesis, University of Exeter. Kanefsky, J. W. (1979b), "Motive Power in British Industry and the Accuracy of the 1870 Factory Return", Economic History Review, 32, 360-375. Kendrick, J. W. (1961), Productivity Trends in the United States. Princeton: Princeton University Press. McGuckin, R. H. and Stiroh, K. J. (2000), "Do Computers Make Output Harder to Measure ?", Journal of Technology Transfer, forthcoming. Mitchell, B. R. (1988), British Historical Statistics. Cambridge: Cambridge University Press. Musson, A. E. (1976), "Industrial Motive Power in the United Kingdom, 1800-1870", Economic History Review, 29, 415-439. Oliner, S. D. and Sichel, D. E. (2000), "The Resurgence of Growth in the Late 1990s: Is Information Technology the Story ?", Journal of Economic Perspectives, 14(4), 3-22. Oulton, N. (2001), "ICT and Productivity Growth in the United Kingdom", Bank of England Working Paper, No. 140. Pilat, D. and Lee, F. (2001), "Productivity Growth in ICT-Producing and ICT-Using Industries: a Source of Growth Differentials in the OECD?", OECD STI Working Paper, forthcoming. Romer, P. M. (1986), "Increasing Returns and Long Run Growth ", Journal of Political Economy, 95, 1002-1037. Romer, P. M. (1990), "Endogenous Technological Change", Journal of Political Economy,
18
98, S71-S102. Schreyer, P. (2000), "The Contribution of Information and Communication Technology to Output Growth: A Study of the G7 Countries", OECD STI Working Paper No 2000/2. Sichel, D. E. (2001), "The Resurgence of US Growth in the Late 1990s: An Update and What Lies Ahead", paper presented to HM Treasury seminar, London Stiroh, K. J. (1998), "Computers, Productivity, and Input Substitution", Economic Inquiry, 36, 175-191. Stiroh, K. J. (2001), "Information Technology and the US Productivity Revival: What Do the Industry Data Say ?", Federal Reserve Board of New York Working Paper No. 115. Triplett, J. (1999), "The Solow Productivity Paradox: What Do Computers Do to Productivity ?", Canadian Journal of Economics, 32, 309-334. von Tunzelmann, G. N. (1978), Steam Power and British Industrialization to 1860. Oxford: Clarendon Press. Whelan, K. (2000), "Computers, Obsolescence, and Productivity", mimeo, Federal Reserve Board.
19
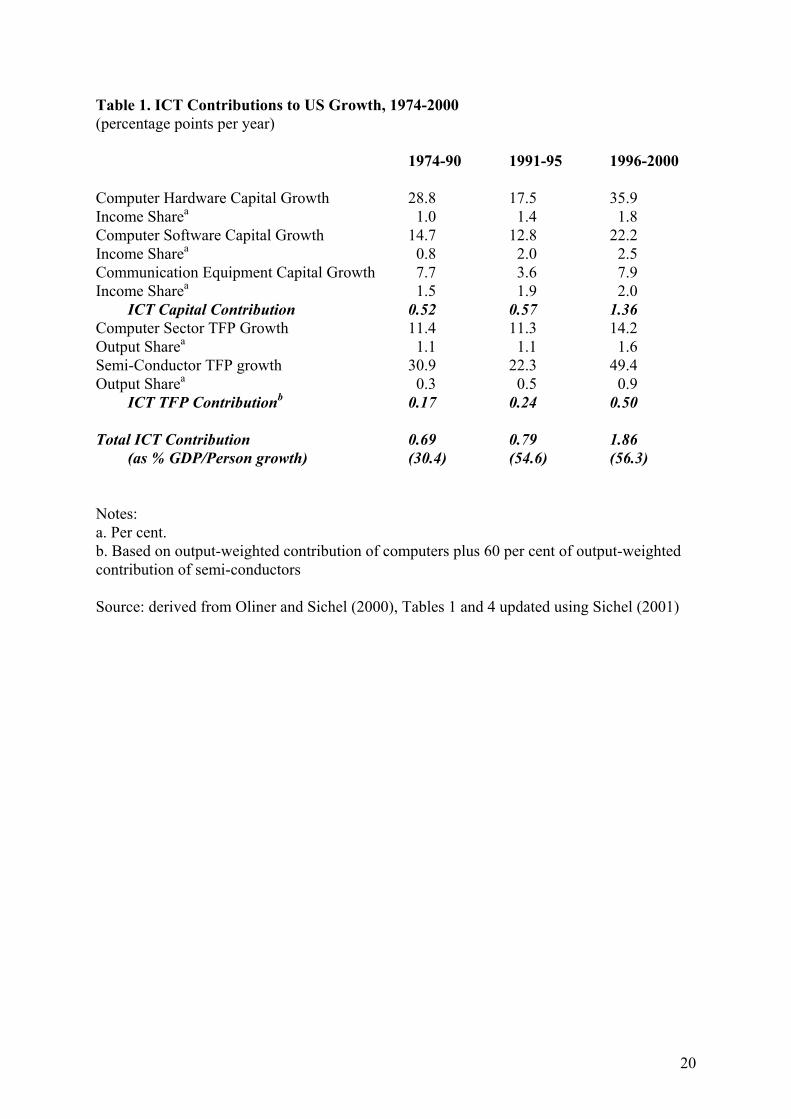
Table 1. ICT Contributions to US Growth, 1974-2000 (percentage points per year) 1974-90 1991-95 1996-2000 Computer Hardware Capital Growth 28.8 17.5 35.9 Income Sharea 1.0 1.4 1.8 Computer Software Capital Growth 14.7 12.8 22.2 Income Sharea 0.8 2.0 2.5 Communication Equipment Capital Growth 7.7 3.6 7.9 Income Sharea 1.5 1.9 2.0 ICT Capital Contribution 0.52 0.57 1.36 Computer Sector TFP Growth 11.4 11.3 14.2 Output Sharea 1.1 1.1 1.6 Semi-Conductor TFP growth 30.9 22.3 49.4 Output Sharea 0.3 0.5 0.9 ICT TFP Contributionb 0.17 0.24 0.50 Total ICT Contribution 0.69 0.79 1.86 (as % GDP/Person growth) (30.4) (54.6) (56.3) Notes: a. Per cent. b. Based on output-weighted contribution of computers plus 60 per cent of output-weighted contribution of semi-conductors Source: derived from Oliner and Sichel (2000), Tables 1 and 4 updated using Sichel (2001)
20
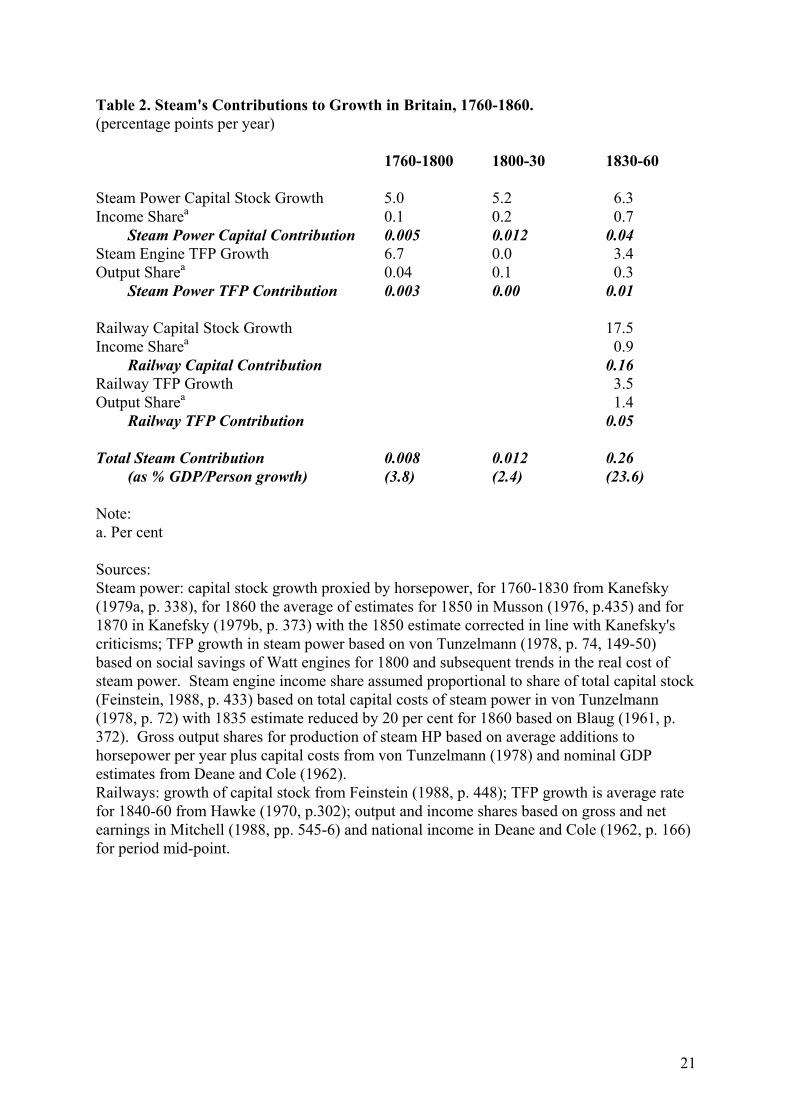
Table 2. Steam's Contributions to Growth in Britain, 1760-1860. (percentage points per year) 1760-1800 1800-30 1830-60 Steam Power Capital Stock Growth 5.0 5.2 6.3 Income Sharea 0.1 0.2 0.7 Steam Power Capital Contribution 0.005 0.012 0.04 Steam Engine TFP Growth 6.7 0.0 3.4 Output Sharea 0.04 0.1 0.3 Steam Power TFP Contribution 0.003 0.00 0.01 Railway Capital Stock Growth 17.5 Income Sharea 0.9 Railway Capital Contribution 0.16 Railway TFP Growth 3.5 Output Sharea 1.4 Railway TFP Contribution 0.05 Total Steam Contribution 0.008 0.012 0.26 (as % GDP/Person growth) (3.8) (2.4) (23.6) Note: a. Per cent Sources: Steam power: capital stock growth proxied by horsepower, for 1760-1830 from Kanefsky (1979a, p. 338), for 1860 the average of estimates for 1850 in Musson (1976, p.435) and for 1870 in Kanefsky (1979b, p. 373) with the 1850 estimate corrected in line with Kanefsky's criticisms; TFP growth in steam power based on von Tunzelmann (1978, p. 74, 149-50) based on social savings of Watt engines for 1800 and subsequent trends in the real cost of steam power. Steam engine income share assumed proportional to share of total capital stock (Feinstein, 1988, p. 433) based on total capital costs of steam power in von Tunzelmann (1978, p. 72) with 1835 estimate reduced by 20 per cent for 1860 based on Blaug (1961, p. 372). Gross output shares for production of steam HP based on average additions to horsepower per year plus capital costs from von Tunzelmann (1978) and nominal GDP estimates from Deane and Cole (1962). Railways: growth of capital stock from Feinstein (1988, p. 448); TFP growth is average rate for 1840-60 from Hawke (1970, p.302); output and income shares based on gross and net earnings in Mitchell (1988, pp. 545-6) and national income in Deane and Cole (1962, p. 166) for period mid-point.
21
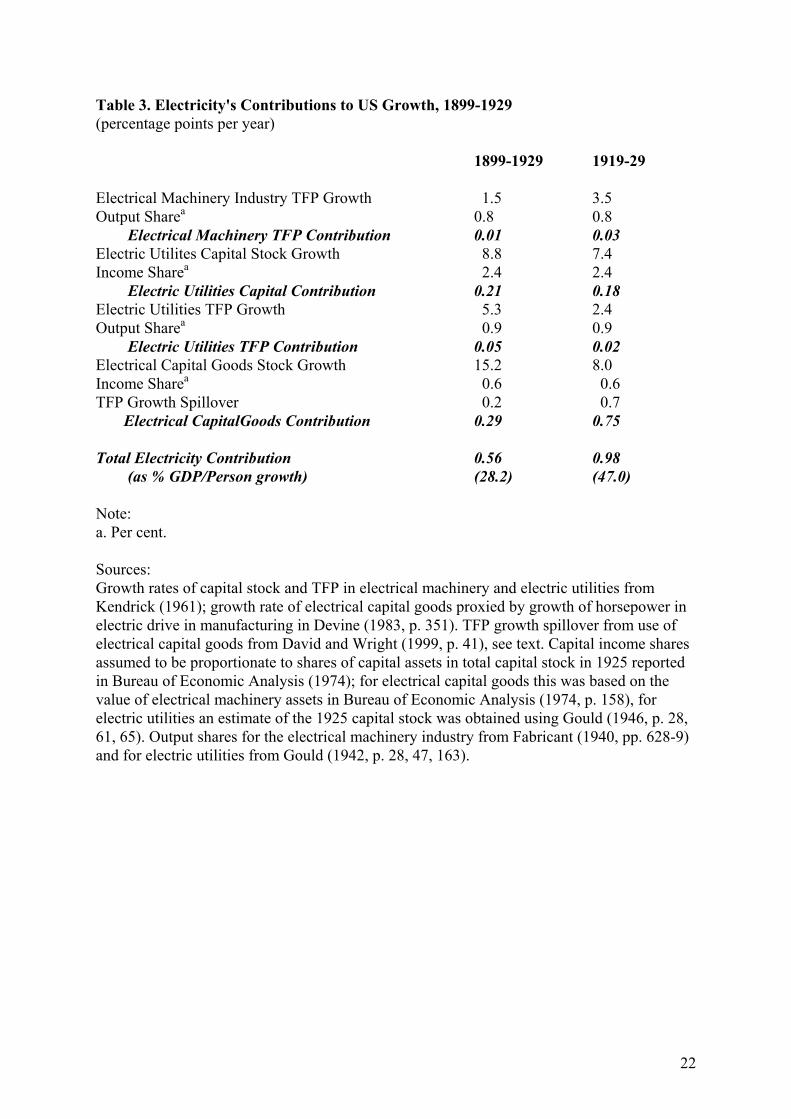
Table 3. Electricity's Contributions to US Growth, 1899-1929 (percentage points per year) 1899-1929 1919-29 Electrical Machinery Industry TFP Growth 1.5 3.5 Output Sharea 0.8 0.8 Electrical Machinery TFP Contribution 0.01 0.03 Electric Utilites Capital Stock Growth 8.8 7.4 Income Sharea 2.4 2.4 Electric Utilities Capital Contribution 0.21 0.18 Electric Utilities TFP Growth 5.3 2.4 Output Sharea 0.9 0.9 Electric Utilities TFP Contribution 0.05 0.02 Electrical Capital Goods Stock Growth 15.2 8.0 Income Sharea 0.6 0.6 TFP Growth Spillover 0.2 0.7 Electrical CapitalGoods Contribution 0.29 0.75 Total Electricity Contribution 0.56 0.98 (as % GDP/Person growth) (28.2) (47.0) Note: a. Per cent. Sources: Growth rates of capital stock and TFP in electrical machinery and electric utilities from Kendrick (1961); growth rate of electrical capital goods proxied by growth of horsepower in electric drive in manufacturing in Devine (1983, p. 351). TFP growth spillover from use of electrical capital goods from David and Wright (1999, p. 41), see text. Capital income shares assumed to be proportionate to shares of capital assets in total capital stock in 1925 reported in Bureau of Economic Analysis (1974); for electrical capital goods this was based on the value of electrical machinery assets in Bureau of Economic Analysis (1974, p. 158), for electric utilities an estimate of the 1925 capital stock was obtained using Gould (1946, p. 28, 61, 65). Output shares for the electrical machinery industry from Fabricant (1940, pp. 628-9) and for electric utilities from Gould (1942, p. 28, 47, 163).
22