the seasonal growth and succession of plankton algae in the white nile
TRANSCRIPT
The Seasonal Growth and Succession of Plankton Algae in the White NileAuthor(s): G. A. Prowse and J. F. TallingSource: Limnology and Oceanography, Vol. 3, No. 2 (Apr., 1958), pp. 222-238Published by: American Society of Limnology and OceanographyStable URL: http://www.jstor.org/stable/2832543 .
Accessed: 17/06/2014 19:41
Your use of the JSTOR archive indicates your acceptance of the Terms & Conditions of Use, available at .http://www.jstor.org/page/info/about/policies/terms.jsp
.JSTOR is a not-for-profit service that helps scholars, researchers, and students discover, use, and build upon a wide range ofcontent in a trusted digital archive. We use information technology and tools to increase productivity and facilitate new formsof scholarship. For more information about JSTOR, please contact [email protected].
.
American Society of Limnology and Oceanography is collaborating with JSTOR to digitize, preserve andextend access to Limnology and Oceanography.
http://www.jstor.org
This content downloaded from 195.34.79.176 on Tue, 17 Jun 2014 19:41:16 PMAll use subject to JSTOR Terms and Conditions

The Seasonal Growth and Succession of Plankton Algae in the White Nile
G. A. PROWSE' AND J. F. TALLING2
Department of Botany and Hydrobiological Research Unit, University College, Khartoum, Sudan
ABSTRACT
A description is given of the seasonal growth and succession, over five years, of plank- tonic algae in a region of the White Nile affected by a reservoir. Dense populations develop during the period of water storage, and are dominated by the diatom Melosira granulata and the bluegreen alga Anabaena fios aquae var. intermedia f. spiroides. The sequence of their development is related to their abundance in the river water entering the reservoir basin. Reactions of algal development upon water characteristics include a considerable increase in pH and depletion of nitrate, phosphate, and probably silicon concentrations. Deficiency of inorganic nitrogen probably limits the maximum densities of Melosira. Maxi- mum algal densities were in the range 20 1t 8 mm3 cell volume (or approximately mg dry weight) per L, and were associated with high rates of photosynthetic production, esti- mated in 1953 as approximately 2.2 g carbon/m2/day. The variation of photosynthetic rates with depth and population density is described for the decline of the 1953 population maximum.
INTRODUCTION
The seasonal growth of plankton algae in tropical freshwaters is a largely un- explored subject. Almost all detailed quan- titative knowledge of plankton periodicity is derived from temperate regions, where the timing of the annual cycle is usually influenced by the pronounced winter mini- mum in solar radiation. This seasonal check to phytoplankton growth is absent in the tropics, and it has been held that conditions in a large tropical lake "allow the phytoplankton to grow continuously and to a density limited only by the avail- ability of some essential nutrient salt" (Beauchamp 1952). At present there ap- pears to be no seasonal study sufficiently detailed to test this statement. In par- ticular, it is not clear to what extent the nutrient limitations may operate discon- tinously in time, so as to delimit temporary maxima or "pulses" of phytoplankton growth comparable in form to the classic spring maxima of many temperate waters. Fish (1957) has shown that such brief maxima may develop in response to a seasonal breakdown of stratification in Lake Victoria. Their origin under other
' Present address: Fish Culture Research Station, Batu Berendam, Malacca.
2 Present address: Scripps Institution of Oceanography, La Jolla, California.
circumstances in tropical waters is de- scribed in the present paper.
The evidence is derived from a quan- titative study of phytoplankton growth and decline in the White Nile near Khar- toum. Here the yearly closure of a dam creates a temporary "river-lake" in which dense populations of phyto- and zoo-plank- ton develop. Between 1951 and 1956 this development has been followed quanti- tatively in both space (along the river) and time. Some spatial aspects have been described in detail by Brook and Rzoska (1954) from observations in December 1951, and a summary of the main features of sea- sonal succession between 1951 and 1953 is given by Rzoska, Brook, and Prowse (1955). The latter evidence shows that although high densities of phytoplankton are only realized during the period of water storage, the numbers of several species become lim- ited, or decline, before the end of that period.
In this paper such cycles of growth are described from the full five-year period for which estimates of algal densities are avail- able. For the last two years a comparison is made between algal development and and certain physical and chemical factors of the environment, in an attempt to identify the factors limiting the algal maxima. Par- ticular attention is given to the reaction of algal growth upon water characteristics,
222
This content downloaded from 195.34.79.176 on Tue, 17 Jun 2014 19:41:16 PMAll use subject to JSTOR Terms and Conditions

GROWTH OF PLANKTON ALGAE IN THE NILE 223
a subject which is also illustrated from lon- gitudinal surveys along the river. Algal maxima are assessed in terms of both mor- phological units and-for wider comparison -by the amounts of materials estimated to be incorporated in the crops. Changes in the magnitude of primary productivity, measured as the rate of photosynthetic production under unit area, were followed during one population maximum. Esti- mates of photosynthetic production, and its control, on other occasions are described by Talling (1957c).
We wish to express our indebtedness to Dr. A. J. Brook for making available his unpublished data, to Mr. F. J. H. Mackereth for chemical analyses of algal cells, and to the Egyptian Irrigation Department in Khartoum for hydrological data. This work forms part of the studies on Nile biology carried out by the Hydrobiological Research Unit of the University College (now University) of Khartoum. To its stimulating leadership by Dr. J. Rzoska, and his continuous help and assistance when on the river, we owe the greatest debt of gratitude. Finally the paper has benefitted from helpful comments by Dr. J. W. G. Lund.
METHODS
Seasonal changes were followed by means of water-samples collected from one local- ity (Gordon's Tree) some 40 km below the dam at Gebel Aulia (see map in Brook and Rz6ska 1954, Fig. 1), above which water storage occurs. Longitudinal surveys along the river, described by Brook and Rz6ska (1954) and on pp. 224-6, show that the den- sity and composition of the plankton at this sampling station are generally similar to that present in the reservoir immediately above the dam. Consequently the seasonal changes recorded are likely to be a close "reflection of the ainual plankton cycle in the basin itself" (Rzoska et al., 1955, p. 333). Direct knowledge of conditions in the basin was obtained from series of samples taken longitudinally up the river in December 1953, June, October and December 1954, and October 1955. Certain gaps in the sampling record (see Fig. 2) were due to our
absence from Khartoum, but chiefly oc- curred when the reservoir was discharged and the phytoplankton growth small.
On all occasions samples of surface water were taken, and during 1951-3 samples from the middle and bottom of the water- column as well collected at a considerable distance from the bank. Plankton counts from the various depths were then averaged, as indicated by Rzoska et al. (1955). For 1954-6 all the estimations given here refer to surface samples, as the previous obser- vations had shown that there was usually little or no indication of marked stratifica- tion of plankton at the Gordon's Tree sta- tion (cf. also Brook and Rzoska 1954, Table 1). In the deeper areas of the reservoir basin diurnal changes of thermal stratifica- tion may cause a surface accumulation of bluegreen algae in the afternoon (Talling 1957c), but samples obtained under such circumstances are not considered in the present account. The stratification of algae recorded by Brook and Rzoska (1954) is not large enough to affect seriously the re- liability of population census based on sur- face samples. A similar conclusion was reached from a comparison of surface and bottom samples collected along the basin in October 1954. These samples also showed little stratification in water char- acteristics other than temperature, dissolved oxygen, and pH, which were subject to a pronounced diurnal stratification near the dam (Talling 1957c).
The samples from the middle and bottom layers were collected using a Friedinger or Ruttner sampler. Counts of phytoplankton were made with a Naumann cell during 1951-2 (Brook and Rz6ska 1954, p. 103), with a Sedgwick-Rafter cell during 1952-5, and using an inverted microscope-and iodine sedimentation method (Utermohl 1931, Lund 1949) during 1955-6. In the 1952-5 estimations the volumes of water involved in the counts were about 0.05-0.10 ml (as areal percentages of the total volume, 1 ml, in the counting cell). With the inverted micro- scope, the volumes used were sufficient to yield 50-100 individuals of the principal algae. Counts of algae during 1951-2 were made by Dr. A. J. Brook, who has kindly
This content downloaded from 195.34.79.176 on Tue, 17 Jun 2014 19:41:16 PMAll use subject to JSTOR Terms and Conditions

224 G. A. PROWSE AND J. F. TALLING
placed unpublished data at our disposal. Estimations of physical and chemical water characteristics were made by the methods described by Talling (1957e). The pro- cedure involved in field experiments on photosynthesis has also been described else- where (Talling 1957c). Samples of surface water were used in exposures of 1-3 hours.
The dry weight and chemical constitu- tion of algal material were obtained using net catches, collected on 30 October 1955 (Melosira) and 12 October 1955 (Anabaena). Total organic nitrogen was determined by a micro-Kjeldahl method, total phosphorus by the method of Mackereth (1953), and silicon by the ammonium molybdate method after solution with sodium hydroxide. Sulphur was estimated after oxidation to sulphate, using ion exchange resins. We are greatly indebted to Mr. F. J. H. Mackereth for these analyses.
THE HYDROLOGICAL BACKGROUND
The magnitude and timing of the chief hydrological events, the storage and release of water in the reservoir basin, vary only slightly in successive years. An outline of these changes is given below; Hurst (1950) gives a detailed account covering earlier years. The main closure of the dam and filling of the basin occurs between 14 July and 21 August, the exact period varying in different years (Fig. 2). A secondary filling occurs after 1 September, and the high level then reached persists until February-April, after which the storage water is progressively released. The timing of the release also varies slightly in different years. Falling water levels and true river conditions prevail until the next filling after July.
The most obvious and probable overriding effect of water storage is the increased time made available for the growth of plankton algae in the reservoir basin. This addi- tional time can be estimated from a knowl- edge of the rates of water discharge at the dam, and the storage capacity of the basin estimated from water levels according to Hurst (1950). An estimate for the period of high water level, calculated by dividing the estimated water storage by the discharge, is approximately 40-70 days. Loss of water
by evaporation is neglected here, but in- volves only a minor correction. The ap- plication of a similar measure to the prob- lems of plankton development in small water bodies has been discussed by Brook and Woodward (1956).
An additional but natural damming affects the lowest region of the White Nile (includ- ing the sampling station at Gordon's Tree) in each year, usually during July and Au- gust. At this time high flood water in the Blue Nile at its junction with the White Nile produces a secondary damming of the latter (see Hurst 1950), into which some brown flood water from the Blue Nile pene- trates. Samples collected at Gordon's Tree at this time require special interpretation (see Fig. 3 and p. 230).
LONGITUDINAL SUCCESSION ALONG THE RIVER
Knowledge of the development of phyto- plankton with distance along a slowly mov- ing water mass, as is present in the reservoir basin, can clearly provide evidence on devel- opment in time. From this viewpoint four longitudinal surveys of the basin are con- sidered below, beginning with the survey in 1951 by Brook and Rzoska (1954). The results are compared later with the temporal changes observed at the single station below the reservoir.
Sampling in several seasons has shown that the diatom Melosira granulata (Ehr.) Ralfs, with its narrow "variety angustis- sima" (discussed below) is generally the predominant plankton alga in the river above the main reservoir region (Brook and Rzoska 1954, Table 1; Prowse 1954). It is present there in comparatively low densi- ties, often below 100 cells per ml, which have not been estimated with accuracy. In De- cember 1951 these densities were found to increase between 410 and 80 km from Khartoum (Stations 15 to 4).3 At this point the increase was halted, and there were no very significant changes in the lower stations near the dam (nos. 4 to 1). Also present at the lower stations were large densities of bluegreen algae, dominated by
3 The scale of Brook and Rzoska (1954, Fig. 2) is in miles and not km as stated.
This content downloaded from 195.34.79.176 on Tue, 17 Jun 2014 19:41:16 PMAll use subject to JSTOR Terms and Conditions

GROWTH OF PLANKTON ALGAE IN THE NILE 225
OCTOBER 1954 OCTOBER 1955
algal d] ,,e._____ > | ] ototal total density . , Melosira jMeosira
Anoboena" s^, 'broad lo2- M \ Melosira 10-
Si Si ~~~~~~~~~~~~~~- Si -.
(mg/l pH
0. -8 l pH ~~~~~~~~~~~pH
0.05- F ] 0.10
(mg/I.) L I i
L P04.P .--~~~~~~ N 03.N
1.0- transparency L
E, L I ? || ( an
transparency -100
0~~~~~~~~ I~~8
- lp N sar
8-- ~~~~~~~- BLUE A ~st. E ~ I ~GFREEN -~~6
4J BLUE RED*-
0 RED I
DAM 100 200 300 DAM 00 200
distance along river from Khartoum (kml
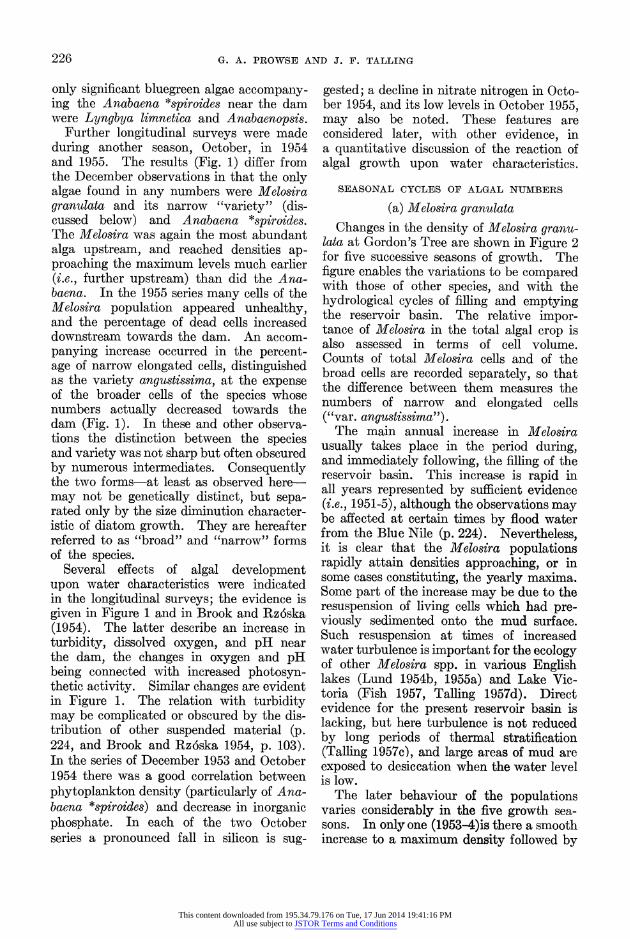
FIG. 1. The longitudinal variation along the river, during 3-7 Octoberl 1954 and 10-11 October 1955, of (a) algal densities, in cells per ml (Melosira) or coil-turns per ml (Anabaena * spiroides) on a logarithmic scale; (b) pH and dissolved silicon; (c) phosphate phosphorus and nitrate nitrogen; (d) transparency, and dissolved oxygen (% saturation); (e) vertical extinction coefficients for red, green, and blue light shown on a logarithmic scale.
Anabaena flos aquae Born. et Flah. var. intermedia f. spiroides Woron. (hereafter shortened to Anabaena *spiroides). These algae were present in extremely low, and usually indeterminable, densities at the upper stations. Probably due to this handi- cap, their observed increase to high densi- ties near the dam occurred later (i.e., further downstream) than was the case for Melosira.
Besides the dominant Anabaena *spiroides, species of Anabaenopsis [A. cunningtonii R. Taylor and A. tanganyikae (G.S. West) Wolosz. et Miller], Oscillatoria [0. geminata (Menegh.) Gom. and 0. planktonica Wolosz.], and Lyngbya limnetica Lemm. were present near the dam. A much less detailed survey in the same month of 1953 suggested a situation similar in essentials, although the
This content downloaded from 195.34.79.176 on Tue, 17 Jun 2014 19:41:16 PMAll use subject to JSTOR Terms and Conditions
226 G. A. PROWSE AND J. F. TALLING
only significant bluegreen algae accompany- ing the Anabaena *spiroides near the dam were Lyngbya limnetica and Anabaenopsis.
Further longitudinal surveys were made during another season, October, in 1954 and 1955. The results (Fig. 1) differ from the December observations in that the only algae found in any numbers were Melosira granulata and its narrow "variety" (dis- cussed below) and Anabaena *spiroides. The Melosira was again the most abundant alga upstream, and reached densities ap- proaching the maximum levels much earlier (i.e., further upstream) than did the Ana- baena. In the 1955 series many cells of the Melosira population appeared unhealthy, and the percentage of dead cells increased downstream towards the dam. An accom- panying increase occurred in the percent- age of narrow elongated cells, distinguished as the variety angustissima, at the expense of the broader cells of the species whose numbers actually decreased towards the dam (Fig. 1). In these and other observa- tions the distinction between the species and variety was not sharp but often obscured by numerous intermediates. Consequently the two forms-at least as observed here- may not be genetically distinct, but sepa- rated only by the size diminution character- istic of diatom growth. They are hereafter referred to as "broad" and "narrow" forms of the species.
Several effects of algal development upon water characteristics were indicated in the longitudinal surveys; the evidence is given in Figure 1 and in Brook and Rz6ska (1954). The latter describe an increase in turbidity, dissolved oxygen, and pH near the dam, the changes in oxygen and pH being connected with increased photosyn- thetic activity. Similar changes are evident in Figure 1. The relation with turbidity may be complicated or obscured by the dis- tribution of other suspended material (p. 224, and Brook and Rzz6ska 1954, p. 103). In the series of December 1953 and October 1954 there was a good correlation between phytoplankton density (particularly of Ana- baena *spiroides) and decrease in inorganic phosphate. In each of the two October series a pronounced fall in silicon is sug-
gested; a decline in nitrate nitrogen in Octo- ber 1954, and its low levels in October 1955, may also be noted. These features are considered later, with other evidence, in a quantitative discussion of the reaction of algal growth upon water characteristics.
SEASONAL CYCLES OF ALGAL NUMBERS
(a) Melosira granulata Changes in the density of Melosira granu-
lata at Gordon's Tree are shown in Figure 2 for five successive seasons of growth. The figure enables the variations to be compared with those of other species, and with the hydrological cycles of filling and emptying the reservoir basin. The relative impor- tance of Melosira in the total algal crop is also assessed in terms of cell volume. Counts of total Melosira cells and of the broad cells are recorded separately, so that the difference between them measures the numbers of narrow and elongated cells ("var. angustissima").
The main annual increase in Melosira usually takes place in the period during, and immediately following, the filling of the reservoir basin. This increase is rapid in all years represented by sufficient evidence (i.e., 1951-5), although the observations may be affected at certain times by flood water from the Blue Nile (p. 224). Nevertheless, it is clear that the Melosira populations rapidly attain densities approaching, or in some cases constituting, the yearly maxima. Some part of the increase may be due to the resuspension of living cells which had pre- viously sedimented onto the mud surface. Such resuspension at times of increased water turbulence is important for the ecology of other Melosira spp. in various English lakes (Lund 1954b, 1955a) and Lake Vic- toria (Fish 1957, Talling 1957d). Direct evidence for the present reservoir basin is lacking, but here turbulence is not reduced by long periods of thermal stratification (Talling 1957c), and large areas of mud are exposed to desiccation when the water level is low.
The later behaviour of the populations varies considerably in the five growth sea- sons. In only one (1953-4)is there a smooth increase to a maximum density followed by
This content downloaded from 195.34.79.176 on Tue, 17 Jun 2014 19:41:16 PMAll use subject to JSTOR Terms and Conditions

GROWTH OF PLANKTON ALGAE IN THE NILE 227
regular decline. During 1954-5 the later part of the increase, in September, is inter- rupted by a temporary decline, and a simi- larly placed but more pronounced interrup- tion is present in 1955-6. In 1951-2 and 1952-3 the primary increase is not halted until November, and the succeeding decline persists longer before a secondary increase appears. Variability between successive years is also characteristic of the timing of the final decline.
The proportion of narrow and elongated cells in the total Melosira population changes significantly according to the phases of pop- ulation growth. It is generally small during periods of population increase, becoming larger during population decline. These facts, and the longitudinal succession in October 1955 described earlier, suggest that the nar- row form is more resistant to conditions unfavorable to the species, and consequently possesses a selective advantage in such cir- cumstances. Further studies on the rela- tionship of the two forms would be interest- ing.
(b) Anabaena *spiroides
This bluegreen alga usually constitutes the greater part of the maximum densities (assessed by cell volume, Fig. 2) that are attained yearly by the phytoplankton. Its main annual increase at measurable densi- ties occurs after the filling of the reservoir basin, but 1-2 months later than the corre- sponding increase of Melosira. The differ- ence may result only from the lower densi- ties of Anabaena in the water of the upper river, which bears the "inoculum" for growth in the reservoir basin. Analogous differ- ences between the succession of the species along the reservoir basin (p. 225) may origi- nate in the same way. The Anabaena in- crease is probably not subject to the same limitation which ends that of Melosira, as increase in Anabaena populations often con- tinues through a period of decrease in Melo- sira.
Rapid increase in the Anabaena population is usually halted in November. Later be- haviour follows one of two patterns. High or fairly high densities may be maintained, with minor fluctuations, for several months,
finally declining in March or later (e.g., 1951-2, 1954-5, 1955-6). Alternately the maximum may be short-lived, and ended by an earlier decline in December to January (e.g.,1952-3,1953-4). In 1955-6 the persist- ent maximum was dominated, in the later stages, by filaments in unusually small coils, which suggested a depauperate condition. The existence of such a condition in earlier years is uncertain.
(c) Lyngbya limnetica
This alga shows a simple periodicity, with well-defined annual maxima of brief dura- tion. The number of filaments per ml may reach high values, but the corresponding cell volumes are not large owing to the small filament dimensions. The period of increase may coincide with that of Anabaena *spi- roides (1953), or take place slightly earlier (1951, 1952) or later (1955). Despite these differences, which could result from varia- tions in the proportions of the two species in the upper river "inoculum", the increase of Lyngbya usually ceases about the same time as that of Anabaena. A common fac- tor, limiting the maximum densities of the two algae, is therefore suggested. Whatever the later behaviour of the Anabaena, the de- cline of the Lyngbya population is both early and rapid.
(d) Other species Although many other algae (listed by
Brook 1954) occur in the plankton, few at- tain notable densities or show a regular annual periodicity. Anabaenopsis tangan- yikae and A. cunningtonii occur in some num- bers in at least four of the five years studied (Fig. 2). Maxima, of the order of 1000- 5000 filaments per ml (about 1.5-7.5 mm3 cell volume per L), are reached at a rela- tively late phase in the yearly season of phytoplankton growth.
Other species appeared to be of more irreg- lar occurrence. The diatom Synedra acus Kg. was recorded in small numbers during all years, and in 1951 and 1955 rose to pro- nounced November maxima of 300 and 700 cells per ml, respectively. This latter maxi- mum occurred at a time when the numbers of the principal diatom, Melosira, were de-
This content downloaded from 195.34.79.176 on Tue, 17 Jun 2014 19:41:16 PMAll use subject to JSTOR Terms and Conditions

228 G. A. PROWSE AND J. F. TALLING
378-
374 -~t- ar ,
20 - 'tX IxiI I I IIII r I I I I I8 i I II i A l 1 I I 1
I'~~~~~I
to~~~~~~~~~~~~~~~~~~~~~~~~~~~~~~~~~~~~i
__,_1x_7 "xi' II Iix I ~~Ix I
, II I ' Cx
~~~~~~~~~~~~~~~~~~~~~~~~~~~~~~~~~~~ C
A ~ ~~~~ - -- 'x'x'I1 III - E
1951 - 1952 1952 1953 1953-1954
FIG 2A FIG. 2. Seasonal changes during 1951-6 of water level (m above sea-level) upstream of the dam whose
full closure is indicated by black columns (a), and densities of various algae in units of cell volume per L (b) and of inadividuals per ml (c -e). In (c) - (e) "individuals" of Melosira are filaments (1951-2) or cells (1952-6); of Anabaena * spiroides, filaments (1951-2) or coil-turns (1952-6); of Lyngbya, Anabaenop- sis, and Anabaena aphanizomienoides, filaments.
clining. In November of 1951 and 1955 another species of Anabaena, A. aphani- zomenoides Forti, reached notable but short- lived maxima (Fig. 2) of 850 and 1540 fila- ments per ml (about 1.7 and 3.1 mm3 cell volume per L), respectively, but had an in- conspicuous history in other years. Green
algae were relatively unimportant during all years, although species of Pediastrum were often present in small numbers.
(e) Total algal density An approximate measure of the total algal
density was obtained by summing the cell
This content downloaded from 195.34.79.176 on Tue, 17 Jun 2014 19:41:16 PMAll use subject to JSTOR Terms and Conditions

GROWTH OF PLANKTON ALGAE IN THE NILE 229
378- LX(
20 III IV l Vl lv r* x t xi I, - 'II v 7V-il Tex 7xi I' I ftil
rCELL VOLUME ( mm/ ) A 10- total count b
1- Melosira A '
total Melosira aP a
: 1--, broad - - a
Melosira a a
Id ?- ? 'ywt t { 1t |d~~~~~~~It
10 - - - -
Anobaena fe
s2X apirnkoides oides a a
timnetica 0~~~~~~~~~ a
a a
I0 -- I I - - - I a a A
tota - A nabaena
aphaizoide oide
1 954 -1955 1955 - I1956 FIG 2B
volumes (determined from cell dimensions), of the principal algae present. The unit of cell volume, 1 mm3, is also very roughly equivalent to 1 mg of dry weight (Table 1; cf. also Ruttner 1937). The seasonal varia- tion (Fig. 2) shows that appreciable densities of algae are realized only during the annual period of water storage in the reservoir basin, as was described by Rzoska et al. (1955) from counts of total algal "indi- viduals" (cf. their Figs. 1 and 2). Maxi-
mum total densities are usually not reached until November, three months after the pri- mary filling of the reservoir, owing to the time required for growth from the low den- sities characteristic of the upper river stretches; the exponential nature of the population increase (better shown on the logarithmic scales used for individual spe- cies) must also be considered. The expected decline of the total density during the emptying of the reservoir (March-April) is
This content downloaded from 195.34.79.176 on Tue, 17 Jun 2014 19:41:16 PMAll use subject to JSTOR Terms and Conditions

230 G. A. PROWSE AND J. F. TALLING
TABLE 1. The cell volume and chemical composition of the principal algae
- = Elementary composition
Species Unit o (% dry weight) counted 5t r
> N P Si S
Melosira granulata average broad form cell 1.03 1.12 0.88 0.16 25.3 0.34 average narrow cell 0.20 - - - _
form Anabaena *spiroides coil-turn 1.60 1.60 7.5 0.28 -
(ca. 20 cells)
Lyngbya limnetica filament 0.11 _ _ _ _ Anabaenopsis tan- coil-turn 1.30 - - - -
ganyikae Anabaenopsis cun- filament 1.65 - - - -
ningtonii Synedra acus cell 0.80 - - - - A nabaena aephanizo- filament 2.00 - - - -
menoides
* = A. flos aguae var. intermedia f. spiroides
less well documented. It is clear, however, that the main decline usually takes place during an earlier period (December-Janu- ary) and must be due to other causes.
In all years one diatom, Melosira granu- lata, and one bluegreen alga, Anabaena *spiroides, account for most of the volume of algal population. Other bluegreen algae rarely contribute more than 4 mm3 of cell volume per L and develop mainly in the later part of the growth season. The earlier part is typically dominated by Melosira, and the following transition to a dominantly bluegreen community is perhaps the most significant qualitative change in the entire growth season, with implications for the associated animal communities (described briefly by Rzoska et al. 1955) and nutrient circulation. The same type of change is evident in longitudinal succession along the reservoir basin, and is emphasized by Brook and Rzoska (1954).
NUTRIENT DEPLETION AND POPULATION MAXIMA
The preceding account of population changes has been largely a descriptive sum- mary of events. Their better understanding requires a more detailed consideration of the physical, chemical, and biological factors involved. The distribution of certain essen- tial nutrients, and the possible significance
of their depletion by algal populations, is discussed below. The quantities available are determined by the chemical history of the river water in the upper reaches of the 'White Nile, which is described by Talling (1957e).
(a) Inorganic nitrogen
The availability of inorganic nitrogen is here deduced from the concentration of ni- trate nitrogen. Nitrite nitrogen was never detected with certainty, although the sensi- tive Griess-Ilosvay test was used. Routine estimations of ammonia nitrogen were at- tempted, but during the periods considered here the concentrations were very small, below 0.04 mg per L, and in a range where the relatively insensitive method used (di- rect Nesslerization) is neither accurate nor reliable. The larger changes in nitrate ni- trogen could be determined down to con- centrations of about 0.01 mg per L.
The seasonal variation of nitrate nitrogen during 1954-6 (Fig. 3) shows highest con- centrations at the beginning and end of the season of phytoplankton development. A local flush of nitrate from Blue Nile water (p. 224) was demonstrated for 1954. The low concentrations in the intermediate pe- riod could arise from uptake by the algal populations or a reduced rate of supply from the upper river region. The latter effect is certainly involved in December, as concen- trations in water entering the reservoir were low in December 1953 and 1954 compared to concentrations during June 1954, October 1954, and October 1955. The evidence is derived from Figure 1, Talling (1957e), and unpublished observations. During October there are indications of the depletion of nitrate by algal populations, particularly of Melosira. The evidence for this includes (a) a fall in nitrate accompanying the first increase of Melosira before the development of Anabaena, (b) an inverse correlation be- tween nitrate concentration and Melosira density during a Melosira maximum in September 1954, (c) a decrease in nitrate parallel with an increase in Melosira in a longitudinal section of the reservoir basin (Fig. 1, and p. 226), (d) an approximate equivalence between the combireed nitrogen
This content downloaded from 195.34.79.176 on Tue, 17 Jun 2014 19:41:16 PMAll use subject to JSTOR Terms and Conditions

GROWTH OF PLANKTON ALGAE IN THE NILE 231
'5 CELL
VOLUME-
V= II ix xi I xI I I I I
9.0- pH
PO4.P '
Si
(mg/1) ...
3S l o < - 0.,
(Mg/I.)
30 q temperature (OC)
20 -4--.Q.
V alkalinity__ _ N )__ _ _ _ _ _ _ _ _ _ _ _ _
viii IX' xi Ii 111 IX' 'xi Ii Iii 1954 - 1955 1955 - 1956
FIG. 3. Seasonal changes during 1954-5 and 1955-6 of algal density (upper graph, with the Melosira component shaded) and of various dissolved nutrients (P04.P, Si, NO3.N) and other water character- istics (pH, temperature, alkalinity). Stippled regions indicate periods with admixture of Blue Nile water.
in the maximum Melosira crops and the concentrations in the river water entering the reservoir basin; thus in 1954 and 1955 the Melosira maxima (October-November) lie between 4 and 8 mm3 cell volume per L (Fig. 3) or (from Table 1) approximately 4 and 8 mg dry weight per L. These crops may be expected to contain approximately 0.035 to 0.070 mg N per L, using the analy-
sis from the population maximum of 1955 (Table 1). Such quantities of nitrogen are of the same order as the amounts of nitrate nitrogen found in river water entering the head of the reservoir basin (cf. Fig. 1, and Tailing 1957d).
If nitrate is the principal source of nitro- gen for the Melosira populations, and the cell nitrogen content cannot fall much below
This content downloaded from 195.34.79.176 on Tue, 17 Jun 2014 19:41:16 PMAll use subject to JSTOR Terms and Conditions

232 G. A. PROWSE AND J. F. TALLING
the low value (0.88 % of the dry weight) recorded, it is likely from Figure 3 that the Melosira maxima are limited by nitrogen deficiency. The only cell analysis available, from the population maximum of 1955, shows an unusually low nitrogen content and so suggests possible nitrogen starvation. The periodicity data (Fig. 3) indicate that a concentration of nitrate nitrogen of about 0.02 mg per L may be a critical level for uptake by cells, although it is possible that this level may depend upon population den- sity. The observed minimal concentrations possibly also depend upon rates of regenera- tion. However, values of about 0.02 mg per L were also associated with an unhealthy and partly declining population of Melosira along the reservoir basin during the longi- tudinal survey of October 1955 (Fig. 1, and p. 226).
The relation between nitrate nitrogen and the nitrogen content of the populations of bluegreen algae (particularly the dominant Anabaena *spiroides) is entirely different. The content in populations of A. *spiroides alone must rise to amounts far higher than the maxima recorded for nitrate nitrogen. The analysis for cell nitrogen (7.5 % of the dry weight) is in agreement with other data for bluegreen algae (cf. Lund 1950, Table 1), and implies that the amounts combined in maximum crops during 1954 and 1955 reach 0.7 mg N per L. It seems inevitable that such high requirements must be obtained from other sources of nitrogen, either at- mospheric or dissolved organic nitrogen. Data on the fixation of atmospheric nitrogen are not available for the species involved here, but the capacity has been demon- strated in other species of Anabaena and Anabaenopsis though not of Lyngbya (Fogg and Wolf 1955, Table 1). It is noteworthy that the sources of nitrogen utilized by planktonic Myxophyceae in general are far from clear (Lund 1954a, pp. 499-501). Ni- trate depletion is unlikely to limit the present Anabaena populations, but the latter may well participate in maintaining a low level of nitrate throughout the main growth period.
(b) Inorganic phosphate The seasonal variation of inorganic phos-
phate also shows evidence of depletion dur- ing periods of algal abundance. As with nitrate, changes in the supply from the upper river reaches are also involved, par- ticularly in the decrease from the high con- centrations (reaching 0.2 mg P04 P per L) recorded in June to August (Fig. 3, and Talling 1957e). Longitudinal surveys along the reservoir basin, at times when algae were well developed (i.e., December 1953, October and December 1954, and October 1955), generally show a reduction in phos- phate from the concentrations in water entering the basin (Fig. 1, Talling 1957e, and unpublished data).
Observations of algal distribution in space and time do not allow this depletion to be analysed with certainty, but there are sug- gestions of a closer relation to the develop- ment of bluegreen algae rather than of Melosira. An example is the fall in phos- phate and rise in Anabaena *spiroides along the reservoir basin in October 1954 (Fig. 1). If the analysis of the Anabaena cells (0.28 % P, on a dry weight basis) is representative, the observed population maxima in No- vember 1954 and February 1955 contain approximately half the quantity of inorganic phosphate to be found in an equivalent volume of river water entering the reservoir basin in October 1954 and December 1954, respectively. These concentrations were 0.08 and 0.042 mg per L. There is no proof, however, that the reduction of inor- ganic phosphate actually limits the popula- tion maxima, as in other examples of phyto- plankton growth a pronounced depletion is merely accompanied by storage of phosphate in the algal cells in excess of their immediate requirements (Mackereth 1953).
(c) Silicon Changes in dissolved silicon during 1954-6
(Fig. 3) include pronounced minima between September and November. This period is also characterized by the main increase in Melosira, the only alga likely to cause a depletion of silicon. Changes of silicon con- centration may also result from the variable
This content downloaded from 195.34.79.176 on Tue, 17 Jun 2014 19:41:16 PMAll use subject to JSTOR Terms and Conditions

GROWTH OF PLANKTON ALGAE IN THE NILE 233
discharge of certain upper tributaries rich or poor in this nutrient (Talling 1957e; cf. also Hurst 1957, Fig. 17), but minima would be unlikely to occur at the season under discussion.
In both years the fall in silicon concentra- tion was approximately 5 mg per L. The relation with the increase of Melosira does not extend to finer details of timing, or to the quantities of silica estimated (from Table 1) to be incorporated in the diatom populations. These quantities are approxi- mately 1 to 2 mg Si per L for the maxima in 1954 and 1955, respectively. Although less than the total decrease in the open water, the silicon incorporated into dead cells has not been taken into account, nor have possible losses of cells by grazing and sedimentation. These categories may well account for the apparent irregularities, al- though further examination is clearly de- sirable. The fall in silica concentration is large in comparison with examples of deple- tion observed in other waters during diatom maxima (e.g., Lund 1950), although that described by Yoshimura (1939) is of similar magnitude.
(d) Carbon dioxide and bicarbonate
Possible sources of the carbon dioxide re- quired in photosynthesis by the algal popu- lations are dissolved carbon dioxide and bicarbonate (cf. Rabinowitch 1951 pp. 888- 91, 1956 pp. 1886-92; Ruttner 1953). Up- take of either from the bicarbonate-carbon- ate buffer system of natural waters results in a rise of pH, the increase being related to the amount of uptake and the alkalinity determined by titration. Such increase in pH is evident during algal growth in 1954-6, from initial values of around 8.2 to maxima of 9.2 or 9.3 (Fig. 3) at times of greatest popu- lation density. There is also a pronounced diurnal variation of pH (Talling 1957c), and the maximum values given, from measure- ments around midday, may slightly underes- timate the true maxima to be expected later in the day.
It appears unlikely that high pH, or asso- ciated deficiency of carbon dioxide or bi- carbonate, ever seriously limits the photo-
synthesis of the algal populations. Several experiments during the population maximum of 1953 (p. 234) showed that high photo- synthetic rates per unit amount of algae could be obtained in river water with initial pH values ranging between 9.2 and 9.5. Higher pH values than these were involved in the limitation of photosynthesis claimed by Steemann Nielsen (1955) for a lake popu- lation, and also in other laboratory studies with aquatic plants able to utilize bicar- bonate.
(e) Other nutrients The seasonal variation in other nutrients
is not known in detail, so that there is no direct evidence for their possible depletion. The concentrations of four nutrients, meas- ured at various times, are as follows: calcium, 8-14 mg per L; magnesium, 8-9 mg per L; sulphate, 1.5 mg per L; potassium (from measurements by Beam 1906, 1908), 4-22 mg per L. Uptake of these lnutrients by the algal populations probably involves quanti- ties that are small in comparison with the amounts in solution, with the doubtful ex- ception of sulphate whose true concentration was not measureable. The concentratioln of total iron is 0.2-0.6 mg per L, but the frac- tion available for algae is uncertain (cf. Lund 1955b, p. 88). Beauchamp (1953) has suggested that limitation by sulphate de- ficiency is important for phytoplankton growth in African inland waters, with 0.5 mg per L as an approximate limiting level. More evidence is required (see however Fish 1956) and could be provided by more sensitive measurements of the low sulphate concentrations in the present reservoir. If the sulphur content (Table 1) obtained for one sample of Anabaena cells is also charac- teristic of the population maxima in 1954-6, their sulphate requirements would be of the order of only 0.07 mg per L.
RATES OF PRODUCTION DURING POPULATION MAXIMA
The changes of population density ulti- mately depend upon rates of increase and depletion of algal substance, assessed per unit of population. The measurement of
This content downloaded from 195.34.79.176 on Tue, 17 Jun 2014 19:41:16 PMAll use subject to JSTOR Terms and Conditions

234 G. A. PROWSE AND J. F. TALLING
rates of depletion (e.g., from grazing and sedimentation) is difficult (Lund and Tall- ing 1957) and was not attempted here, but rates of photosynthetic production were estimated and are described below. An- other source of evidence, from the relative growth rates of the populations, could not be used in this work on flowing waters. Rapid rates of relative increase in popula- tions were often recorded, with a doubling of density in 5-10 days during the main phase of population increase. However such increase may reflect only changes in the time available for growth ("retention quotient" of Brook and Woodward 1956) in the reservoir basin, and not the true rate of population growth.
The variation of photosynthetic rate with depth was studied during the algal maximum of 1953-4 (Fig. 4). The results are also used to show variation in maximum rates of photosynthesis per unit of population (Pmax), and in rates of photosynthetic production per unit area of water surface (Fig. 4) during the decline of the population. These char- acteristics were also investigated during December 1954 and October 1955 at a sta- tion in the reservoir basin, although any variation with algal periodicity could not be
followed; the results have been described elsewhere (Talling 1957c).
During the maximum of 1953-4, photo- synthetic production at the Gordon's Tree station was largely confined to the upper- most meter stratum. Although light -pene- tration was not measured directly, the variation of photosynthetic rate with depth implies a rapid extinction of light with depth, as was found on later occasions both here and in the reservoir basin (Fig. 1, and Talling 1957c, 1957e). The rates of photo- synthesis often exhibit light saturation and occasionally a slight inhibition near the surface. Saturation effects are more prom- inent in the later experiments, possibly due to the lower temperatures then prevailing (Fig. 4, and Talling 1957a, 1957b).
A separate calculation was made of the maximum (i.e., light saturated) rates of photosynthesis (Pmax), expressed per unit of cell volume (Table 2). The order of mag- nitude is similar to that in the later experi- ments of 1954-5; the range in 1953 is 0.090 i 0.021, and in 1954-5 is 0.14 i 0.04 mg oxygen/mm3 hour. The mean rates are much higher than most values recorded from temperate waters, as pointed out by Talling (1957c). If converted into the units
20
2 A -- temperature 0o areal
_ 15' " \ --............. productivity
Anaboena" (g 02/m. hour) 101 1.0
-5F Melosira-
I x x ix I I photosynthetic rote (mg oxygen/ t. hour)
1.0 1.0 1.0 1.0 1.0 0.5 0.5
El
0 Lo- A B C ID FE F G
I.5j FIG. 4. Growth and decline of the 1953-4 algal population, showing two main components, in mm'
cell volume per L, and of associated rates of photosynthetic production per m2 (histograms). The latter are calculated from depth profiles of photosynthetic rate shown in the lower graphs.
This content downloaded from 195.34.79.176 on Tue, 17 Jun 2014 19:41:16 PMAll use subject to JSTOR Terms and Conditions

GROWTH OF PLANKTON ALGAE IN THE NILE 235
TABLE, 2. Photosynthetic rates and productivity under unit area of water surface
Population Maximum photosynthetic rates Areal 02 Estimated Place and date Temperature density (n) production daily C
(m3OC) .PmXnear midday fixation (mms/L) ( n. 02/L.hr) (mg 02/mm3. hr) (g 02/m2. hr) (g C/M2. day)
A. Gordona's Tree, 40 km below dam
6. xi. 1953 26 20 1.4 0.072 0.75 2.4 13. xi. 1953 17 1.4 0.082 0.75 2.4 20. xi. 1953 13.5 1.5 0.11 0.84 2.7 27. xi. 1953 20 12 1.2 0.10 0.71 2.3 4. xii. 1953 17 10.5 1.0 0.10 0.74 2.4
12. xii. 1953 17 6.0 0.59 0.098 0.36 1.15 B. Buoy 1 km south of
(i.e. above) the Gebel Aulia dam
19. xii. 1953 16 7.0 0.48 0.069 0.38 1.2 12. xii. 1954 20 5.9 0.60 0.10 0.75 2.4 7. x. 1955 30 1.9 0.35 0.18 0.28 0.90
C. Station 6 km south of (i.e. above) the Ge- bel Aulia dam
6. x. 1954 30 8.8 1.0 0.12 1.35 4.3
of relative growth rate, assuming an equiva- lence between the carbon assimilated in photosynthesis and that incorporated in growth, values of the order of 1.6-2.5 cell divisions per day are obtained. This esti- mation (cf. also Talling 1955, p. 339) assumes a photosynthetic quotient of unity, and a carbon content of 50 % of the cell dry weight. Although clearly very approxi- mate, the values obtained are comparable with relative growth rates recorded for a variety of unicellular algae under favourable culture conditions (see, e.g., Myers 1953, p. 44). Because of possible errors involved in algal counts and in estimation of cell volume, the relatively small variation in rates of photosynthesis during the 1953 algal maxi- mum is of doubtful significance. The im- portant feature is that relatively high photo- synthetic rates continue into the period of population decline, as was also recorded for the diatom Asterionella formosa Hass. at the beginning of population decline in an English lake (Talling 1957a).
Rates of photosynthetic production per unit area (Table 2 and Fig. 4) were calcu- lated by planimetry of the corresponding depth profiles of photosynthetic rate. These areal rates probably approximate the daily maxima, as the experiments were
carried out near midday in full sunshine. An analysis of photosynthetic production per day (Talling 1957c, Table 3) suggests that this is approximately 8.5 times the hourly production at midday, under the present conditions of daylength and radia- tion. To aid comparison with other work, daily production values (in g carbon/M2. day) have been estimated (Table 2) using this factor and adopting a photosynthetic quotient of unity. The true value of the quotient may well have been higher, prob- ably in the range 1.0-1.4 (cf. Ryther 1956).
Over a period of 30 days during the popu- lation maximum the rate of areal production is 0.77 =? 0.07 g oxygen/M2. /hour as maxi- mum hourly rates, or an estimated 2.4 i 0.2 g carbon/m2 . day. Later in December there is a decline to approximately half these values, for which decrease in popula- tion density and in temperature may be responsible. Changes in the incident daily radiation are relatively small, and its reduc- tion by clouding is negligible. The daily carbon fixation corresponds to the higher rates obtained for phytoplankton in other waters (e.g., Steemann Nielsen 1954, 1956). Similarly high values were obtained from an analysis of diurnal changes of dissolved oxygen in the reservoir basin (Talling 1957c).
This content downloaded from 195.34.79.176 on Tue, 17 Jun 2014 19:41:16 PMAll use subject to JSTOR Terms and Conditions

236 G. A. PROWSE AND J. F. TALLING
Such high productivity is probably only possible in waters where extinction of light by the suspended algae is large (cf. Stee- mann Nielsen 1954, 1956), so that the un- usually shallow photosynthetic zone of about 1 m in the present work is no anomaly.
DISCUSSION
This work is essentially a quantitative description and attempted analysis of phyto- plankton development in and below a tem- porary "river-lake." Plankton develop- ment in such water-bodies has received some attention in temperate regions but examples from the tropics and subtropics are rare, although they include a river in Indo- China (Blache 1951) and two reservoir basins elsewhere on the Nile (Abdin 1948, and Rzoska et al. 1955). A dominating influ- ence of current velocity is often evident in the yearly periodicity, particularly its re- duction during water storage to give lake- like conditions. The causation of later events under such conditions is more ob- scure, particularly in relation to the succes- sion of species, the limitation of population maxima, and the possible depletion of nu- trients.
The limitation of population maxima has been discussed earlier in relation to nutrient depletion, with little attention to physical or biological factors. Temperature changes are probably of little significance here, as a similar pattern of algal periodicity is known for the lnearby Blue Nile under different temperature conditions (Rzoska et al. 1955, Talling 1956, Prowse and Talling in prepara- tion). The highest temperatures, about 300C, often occur in the season of most rapid algal increase and so are unlikely to be detrimental. The intensity of the inci- dent radiation does not show marked sea- sonal changes during the periods considered, and strong absorption of light in the water may not prevent active phytoplankton growth (e.g., in October 1955, Fig. 1). Com- petition between algae, e.g., for nutrients, is probable, but clearly established examples cannot be cited. Densities of Melosira and Anabaena *spiroides often show an inverse relationship, but this is not the case during the maximum of 1954-5. The significance
of grazing by zooplankton (cf. the review by Edmondson 1957) is unknown. However most of the algal material occurs in rela- tively large units (e.g., linear filaments of Melosira, coiled filaments of Anabaena *spi- roides), probably too big for direct ingestion by most of the associated Entomostraca and Rotatoria.
The results obtained, and previously de- scribed in separate sections, may be sum- marized as follows. Lake-like conditions, with slow water movement, are created each year on the river after the primary closure of the dam in July to August. Increase in the small phytoplankton population enter- ing the reservoir basin is thereafter evident. The sequence of species in this initial phase of growth, and the timing of the species maxima, are related to their abundance in the inflowing water. Melosira granulata is usually predominant here and forms the first species maximum. Its limitation and decline-in which two morphological forms behave differently-is probably due to de- pletion of inorganic nitrogen, particularly nitrate. Silicon depletion may also occur, but not to limiting levels. A maximum of Anabaena *spiroides follows, often accom- panied by Lyngbya limnetica and sometimes a second maximum of Melosira. The total algal densities attained (range 20 i 8 mm3 cell volume per L, in November-December) are the highest in the year. They are asso- ciated with conspicuous reactions upon some water characteristics, particularly pH, dissolved oxygen, transparency, and inor- ganic phosphate concentration. Depletion of the latter is most closely connected with the development of Anabaena *spiroides, whose large nitrogen requirements appear to be satisfied by sources other than dissolved inorganic nitrogen. Rates of primary (pho- tosynthetic) production at this time are high, estimated as approximately 2.2 g car- bon/m2 - day in 1953, despite a shallow photosynthetic zone. The decline of A. *spiroides may be early or late, but species of Anabaenopsis are usually prominent in the final phase. Other algae are of less regular occurrence, but may show maxima of short duration. The release of storage water in March-April prevents any later growth of
This content downloaded from 195.34.79.176 on Tue, 17 Jun 2014 19:41:16 PMAll use subject to JSTOR Terms and Conditions

GROWTH OF PLANKTON ALGAE IN THE NILE 237
dense phytoplankton, but often the main algal decline occurs much earlier and must be due to other causes.
As storage of water in the reservoir basin is discontinuous, and the water-masses are in movement downstream, conditions are very different from those of a tropical -lake with a possibly continuous growth period (cf. p. 222). Nevertheless the results suggest that large oscillations of population density may well occur in tropical lakes as a result of nutrient depletion, with catastrophic de- cline in the populations. An alternative be- haviour, with high densities persisting for long periods after their original limitation, is also illustrated by Anabaena *spiroides.
REFERENCES
ABDIN, G. 1948. The conditions of growth and periodicity of the algal flora of the Aswan reservoir (Upper Egypt). Bull. Fac. Sci. Fouad Univ., no. 27: 157-175.
BEAM, W. 1906. Chemical composition of the Nile waters. Second Report, Wellcome Res. Labs., Khartoum, pp. 206-214.
--. 1908. Nile Waters. Third Report, Wellcome Res. Labs., Khartoum, pp. 386-395.
BEAUCHAMP, R. S. A. 1952. Introduction. In: East African Fisheries Res. Org., Annual Rep., p. 1.
- . 1953. Sulphates in African inland waters. Nature, Lond., 171: 769-771.
BLACHE, J. 1951. Apercu sur le plancton des eaux douces du Cambodge. Cybium, 6: 62-94.
BROOK, A. J. 1954. A systematic account of the phytoplankton of the Blue and White Nile. Ann. Mag. Nat. Hist., Ser. 12, 7: 648-656.
BROOK, A. J., AND J. Rz6SKA. 1954. The influ- ence of the Gebel Aulyia dam on the develop- ment of Nile plankton. J. Anim. Ecol., 23: 101-114.
BROOK, A. J., AND W. B. WOODWARD. 1956. Some observations on the effects of water inflow and outflow on the plankton of small lakes. J. Anim. Ecol., 25: 22-35.
EDMONDSON, W. T. 1957. Trophic relations of the zooplankton. Trans. Amer. Micr. Soc., 76: 225-245.
FISH, G. R. 1956. Chemical factors limiting growth of phytoplankton in Lake Victoria. East Afr. Agric. J., 21: 152-158.
---. 1957. A seiche movement and its effect upon the hydrology of Lake Victoria. Fish. Publ., Lond., 10: 68 pp.
FOGG) G. E., AND M. WOLF. 1955. The nitrogen metabolism of the blue-green algae (Myxo- phyceae). Symposia Soc. Gen. Microbiol., 4: 99-125.
HURST, H. E. 1950. The Nile Basin. Vol. VIII. The hydrology of the Sobat and
White Nile and the topography of the Blue Nile and Atbara. Physical Dept. Paper no. 55. Govt. Press, Cairo.
. 1957. The Nile. Second revised edi- tion. London, Constable. xv + 331 pp.
LUND, J. W. G. 1949. Studies on Asterionella formosa Hass. I. The origin and nature of the cells producing seasonal maxima. J. Ecol., 37: 389-419.
. 1950. Studies on Asterionella formosa Hass. II. Nutrient depletion and the spring maximum. J. Ecol., 38: 1-35.
. 1954a. The importance of algae to waterworks engineers. J. Inst. Water Engrs., 8: 497-504.
1954b. The seasonal cycle of the plank- ton diatom, Melosira italica (Ehr.) Kutz. subsp. subarctica 0. Mull. J. Ecol., 42: 151- 179.
. 1955a. Further observations on the seasonal cycle of Melosira italica (Ehr.) Kuitz. subsp. subarctica 0. Mull. J. Ecol., 43: 90-102.
- . 1955b. The ecology of algae and water- works practice. Proc. Soc. Water Treatment and Examination, 4: 83-109.
LUND, J. W. G., AND J. F. TALLING. 1957. Botanical limnological methods with special reference to the algae. Bot. Rev., 23:489-583.
MACKERETH, F. J. 1953. Phosphorus utilisation by Asterionella formosa Hass. J. Exp. Bot., 4: 296-313.
MYERS, J. 1953. Growth characteristics of algae in relation to the problems of mass culture. In: Burlew, J. S. (ed.), Algal culture from laboratory to pilot plant, pp. 37-54. Car- negie Institution of Washington, Publ. 600. ix + 357 pp.
PROWSE, G. A. 1954. Phytoplankton. First Annual Rep., Hydrobiol. Res. Unit, Univer- sity College of Khartoum, pp. 12-14.
PROWSE, G. A., AND J. IF. TALLING. In prep. The seasonal growth of plankton algae in the Blue Nile.
RABINOWITCH, E. I. 1951. Photosynthesis and related processes. Vol. II, pt. 1. Inter- science Publ. Inc., New York. xi + 1208 pp.
. 1956. Photosynthesis and related proc- esses. Vol. II, pt. 2. Interscience Publ. Inc., New York. xvi + 2088 pp.
RUTTNER, F. 1937. Limnologische Studien an einigen Seen der Ostalpen. Arch. Hydrobiol., 32: 167-319. -. 1953. Die Kbhlenstoffquellen fiur die
Kohlensaureassimilation submerser Wasser- pflanzen. Scientia 6 ser., 47 an.; 1-8.
RYTHER, J. H. 1956. The measurement of pri- mary production. Limnol. & Oceanogr., 1: 72-84.
RZ6SKA, J., A. J. BROOK, AND G. A. PROWSE. 1955. Seasonal plankton development in the White and Blue Nile near Khartoum. Verh. Int. Ver. Limnol., 12: 327-334.
STEEMANN NIELSEN, E. 1954. On organic
This content downloaded from 195.34.79.176 on Tue, 17 Jun 2014 19:41:16 PMAll use subject to JSTOR Terms and Conditions

238 G. A. PROWSE AND J. F. TALLING
production in the oceans. J. Cons. Int. Explor. Mer, 19: 309-328.
- . 1955. The production of organic matter by the phytoplankton in a Danish lake receiv- ing extraordinarily great amounts of nutrient salts. Hydrobiologia, 7: 68-74.
. 1956. Production of organic matter in the oceans. J. Mar. Res., 14: 374-386.
TALLING, J. F. 1955. The relative growth rates of three plankton diatoms in relation to underwater radiation and temperature. Ann. Bot., Lond., 19: 329-341.
. 1956. The seasonal growth of plankton algae in the Nile near Khartoum. Third Annual Rep., Hydrobiol. Res. Unit, Univer- sity College of Khartoum, pp. 8-10.
. 1957a. Photosynthetic characteristics of some freshwater plankton diatoms in relation to underwater radiation. New Phytol., 56: 29-50.
. 1957b. The phytoplankton population as a compound photosynthetic system. New Phytol., 56: 133-149.
. 1957c. Diurnal changes of stratification and photosynthesis in some tropical African waters. Proc. Roy. Soc. B, 147: 57-83. -. 1957d. Some observations on the strati- fication of Lake Victoria. Limnol. & Ocea- nogr., 2: 213-221.
- 1957e. The longitudinal succession of water characteristics in the White Nile. Hydrobiologia, 11; 73-89.
UTERMOHL, H. 1931. Neue Wege in der quanti- tativen Erfassung des Planktons. Verh. Int. Ver. Limnol., 5: 567-596.
YOSHIMURA, S. 1939. Seasonal variations in the silica- and diatom-contents of the water of Takasuka Pond, Saitama, Japan. Jubilee Publ. in commem. Prof. H. Yabe 60th birth- day: pp. 210-282.
This content downloaded from 195.34.79.176 on Tue, 17 Jun 2014 19:41:16 PMAll use subject to JSTOR Terms and Conditions