the science of social selling: measuring adoption and results with linkedin
TRANSCRIPT
Are you presenting at a breakout session?
Make sure your title slide is the right color.
To swap the slide master...
On the View tab, click Normal.
In Normal View, in the thumbnail pane on the left, click the
slide that you want to apply a layout to.
On the Home tab, click Layout, and then select the layout
that you want.
Keynotes & general
sessions
The Future of Sales
and Marketing
breakout track
Habits of High
Performing Reps
breakout track
How to Build a Social
Selling Organization
breakout track
title title title title
Lauren Mullenholz
Insights Leader
The Science of Social Selling: Measuring adoption and results with LinkedIn
Philip Amato
Marketing Communications
Manager at Microsoft
Brian Galicia
Director, Technical Sales
Microsoft Dynamics CRM
#salesconnect
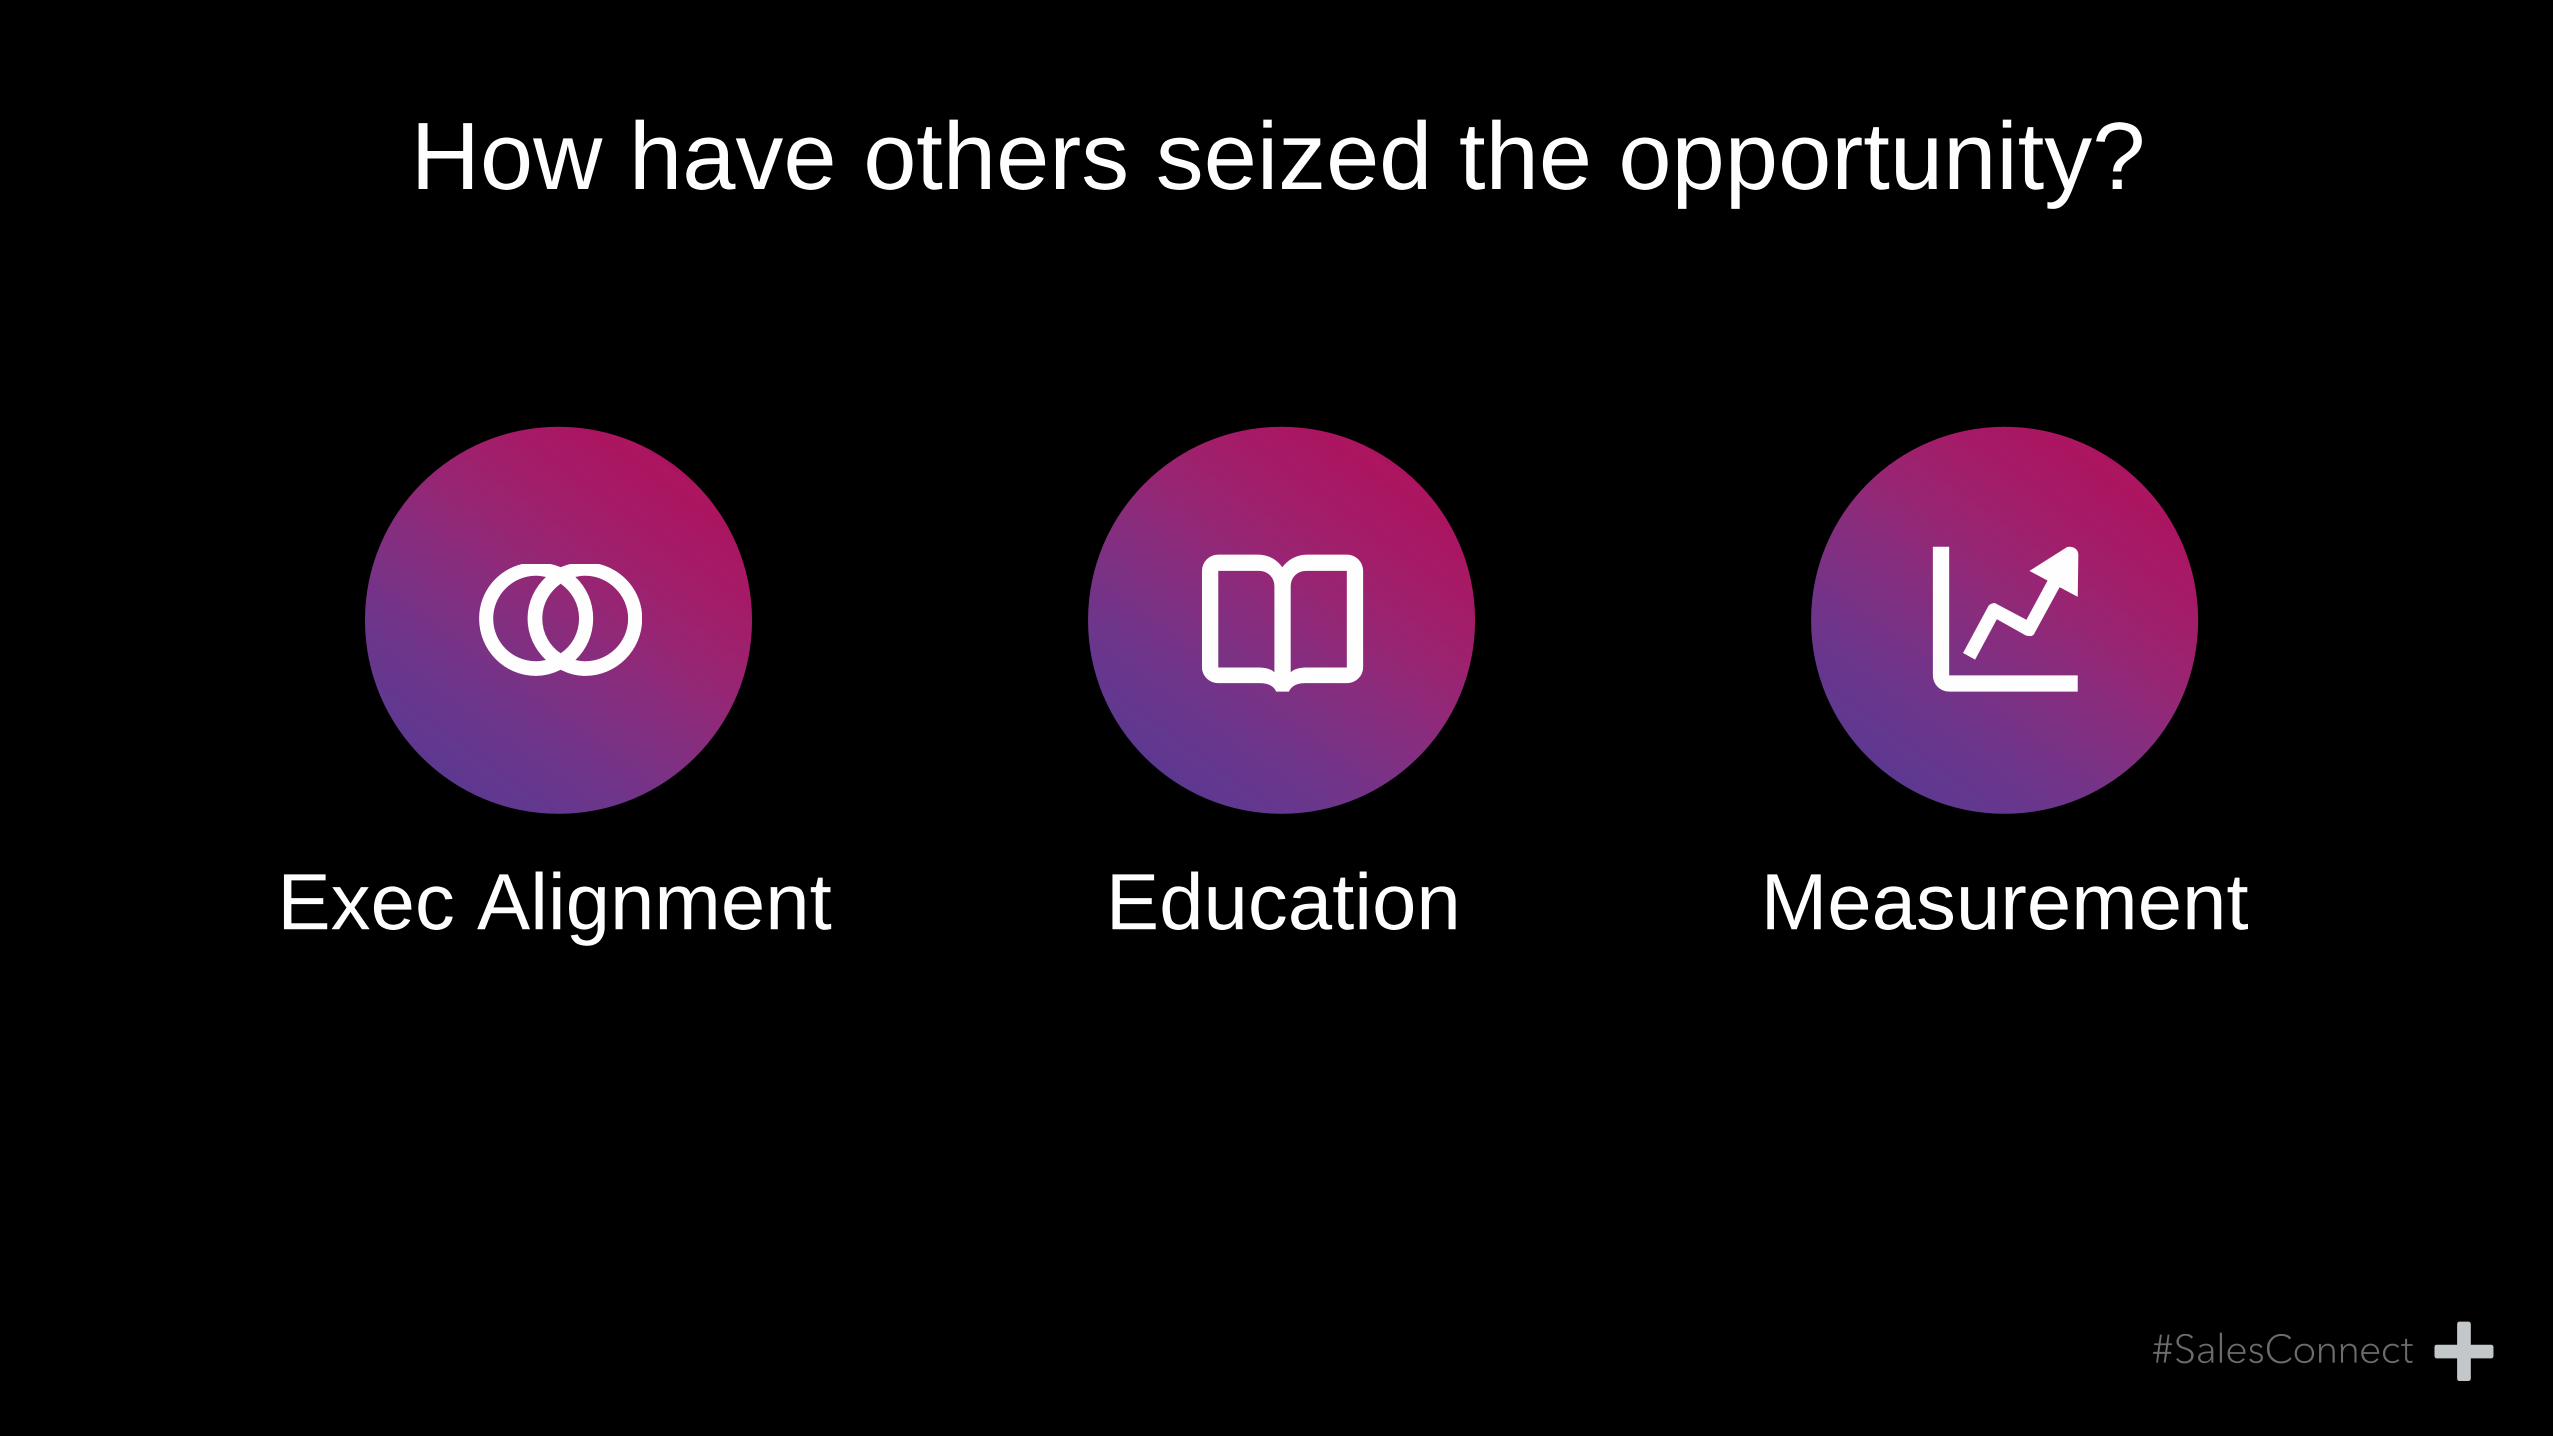
How have others seized the opportunity?
Measurement Education Exec Alignment
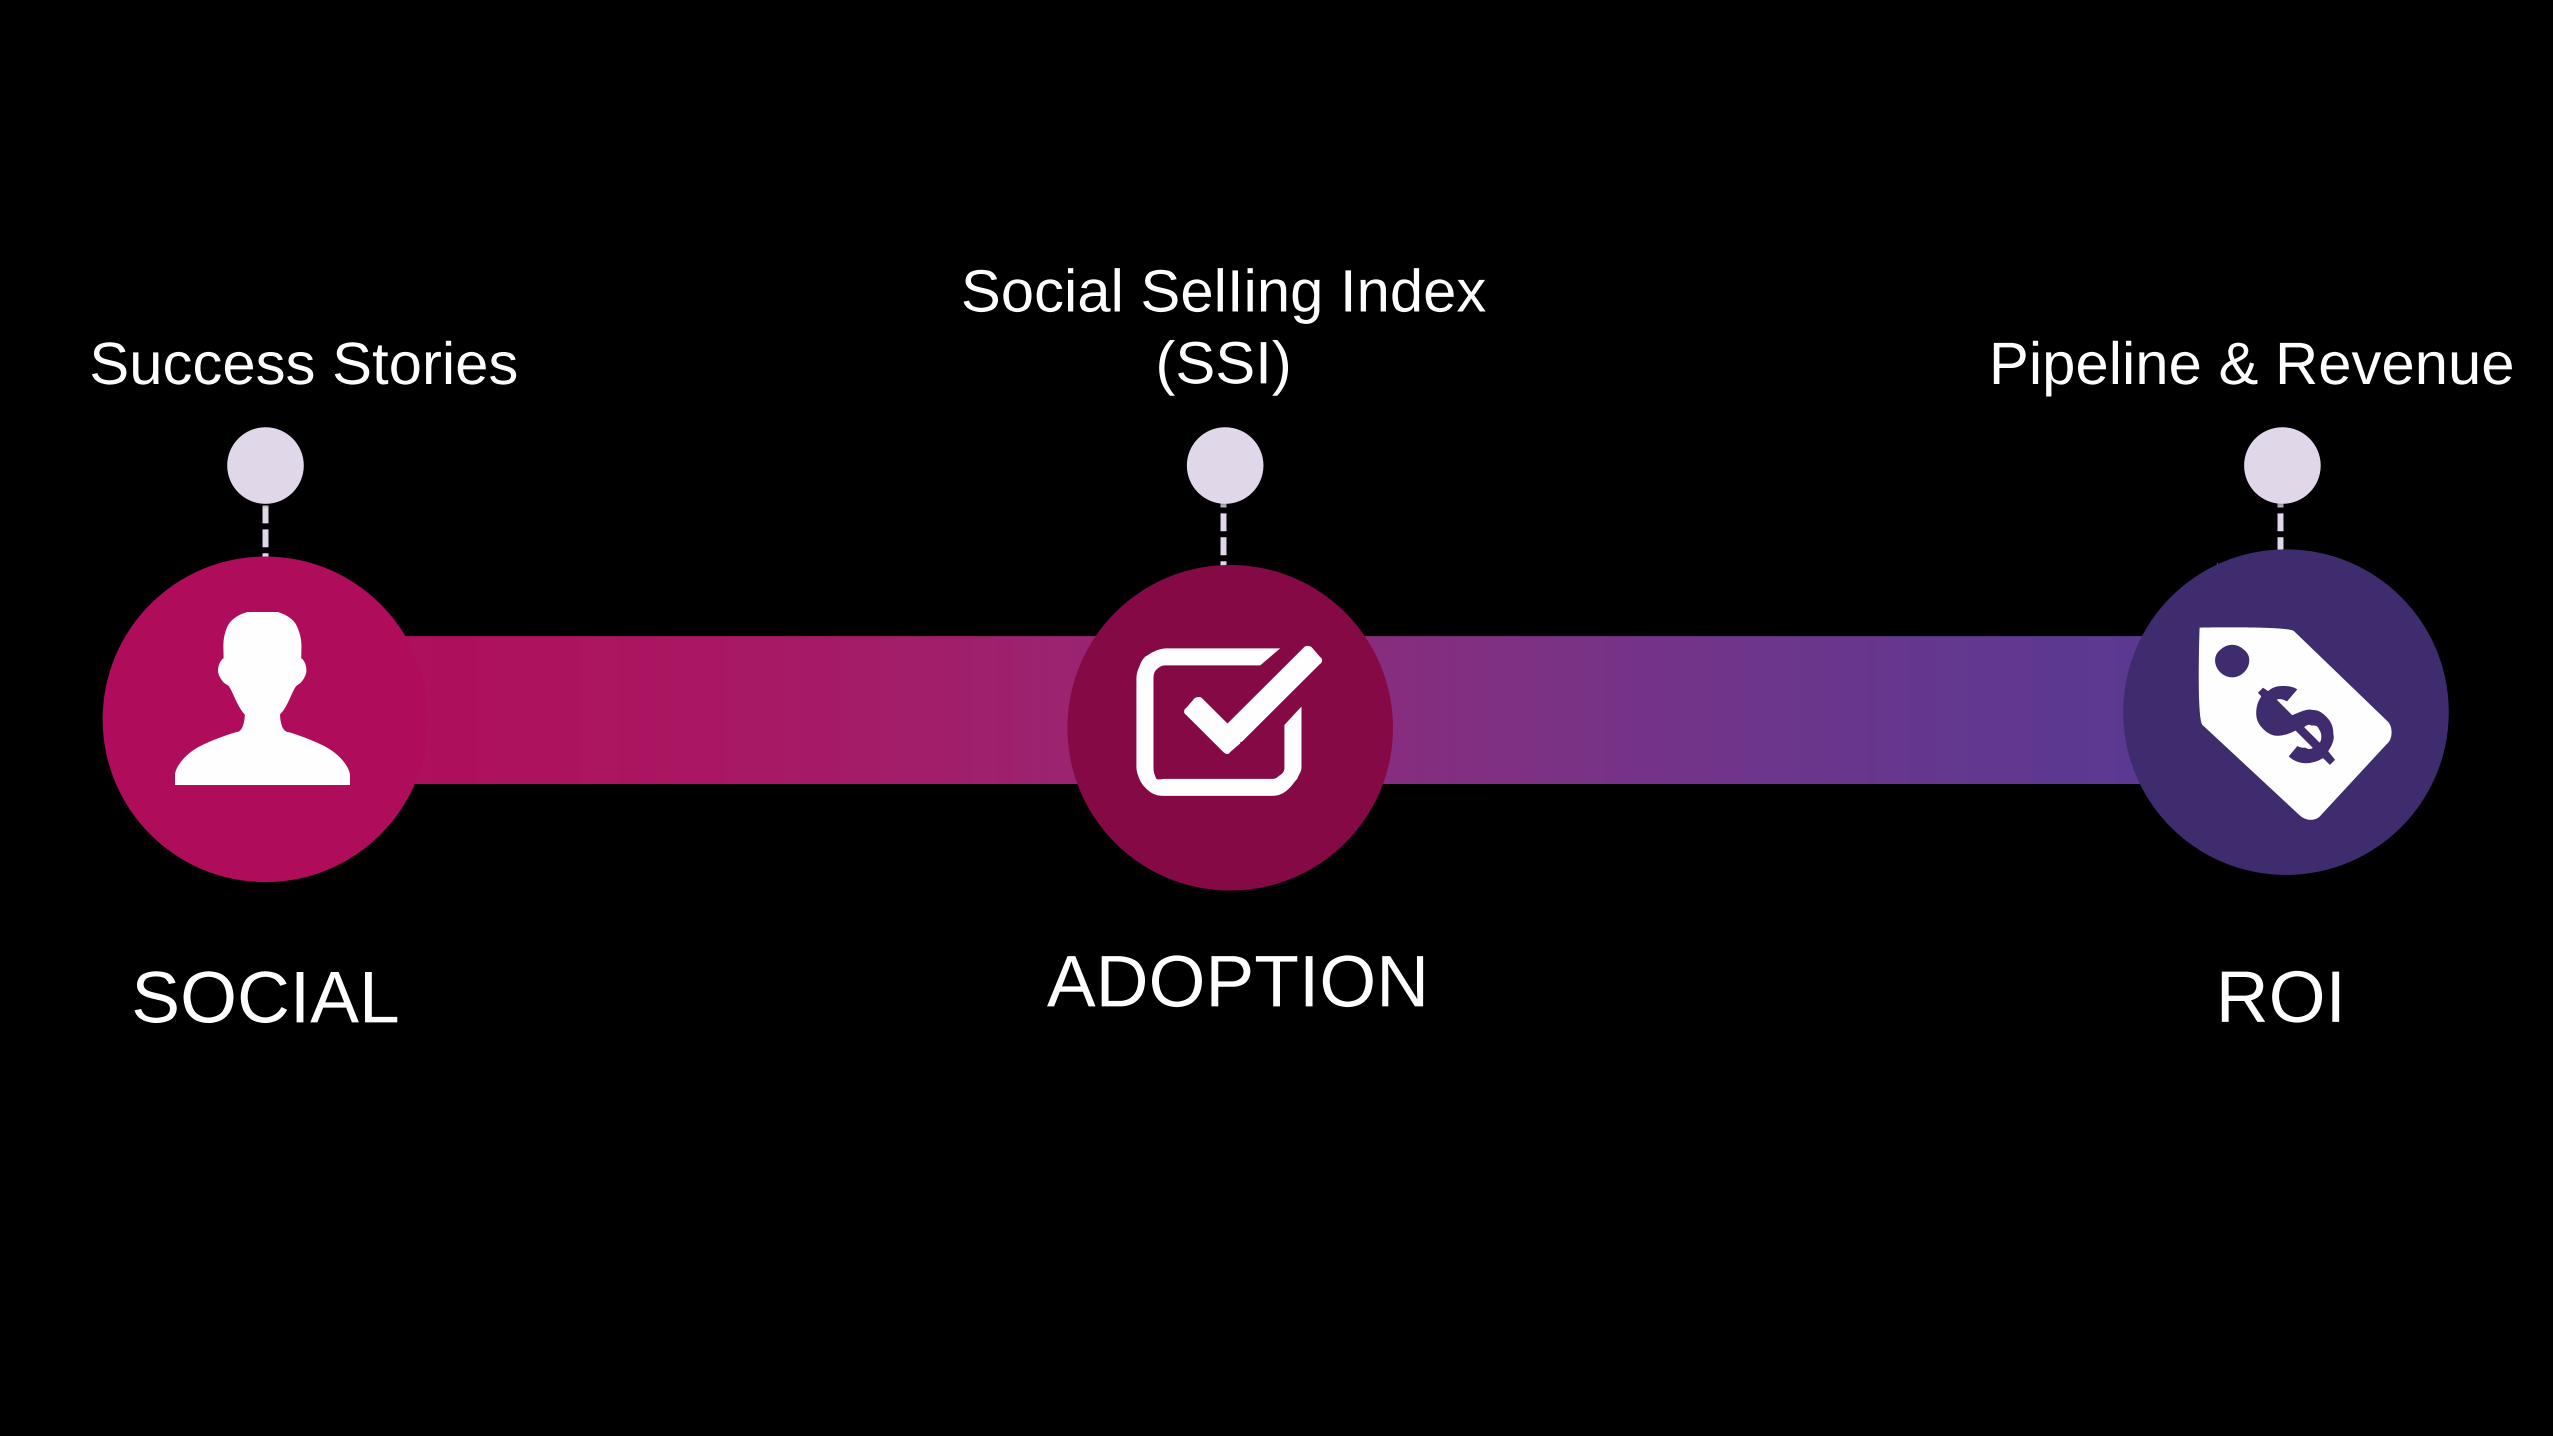
SOCIAL
Success Stories
Social SelIing Index
(SSI)
ADOPTION
Pipeline & Revenue
ROI

Freshman Sophomore Junior Senior
2.8 GPA
3.0 GPA
3.2 GPA
3.5 GPA

Are you presenting at a breakout session?
Make sure your segue slides are the right color.
To swap the slide master...
On the View tab, click Normal.
In Normal View, in the thumbnail pane on the left, click the
slide that you want to apply a layout to.
On the Home tab, click Layout, and then select the layout
that you want.
Keynotes & general
sessions
The Future of Sales
and Marketing
breakout track
Habits of High
Performing Reps
breakout track
How to Build a Social
Selling Organization
breakout track
title title title title
Social SelIing Index Defined
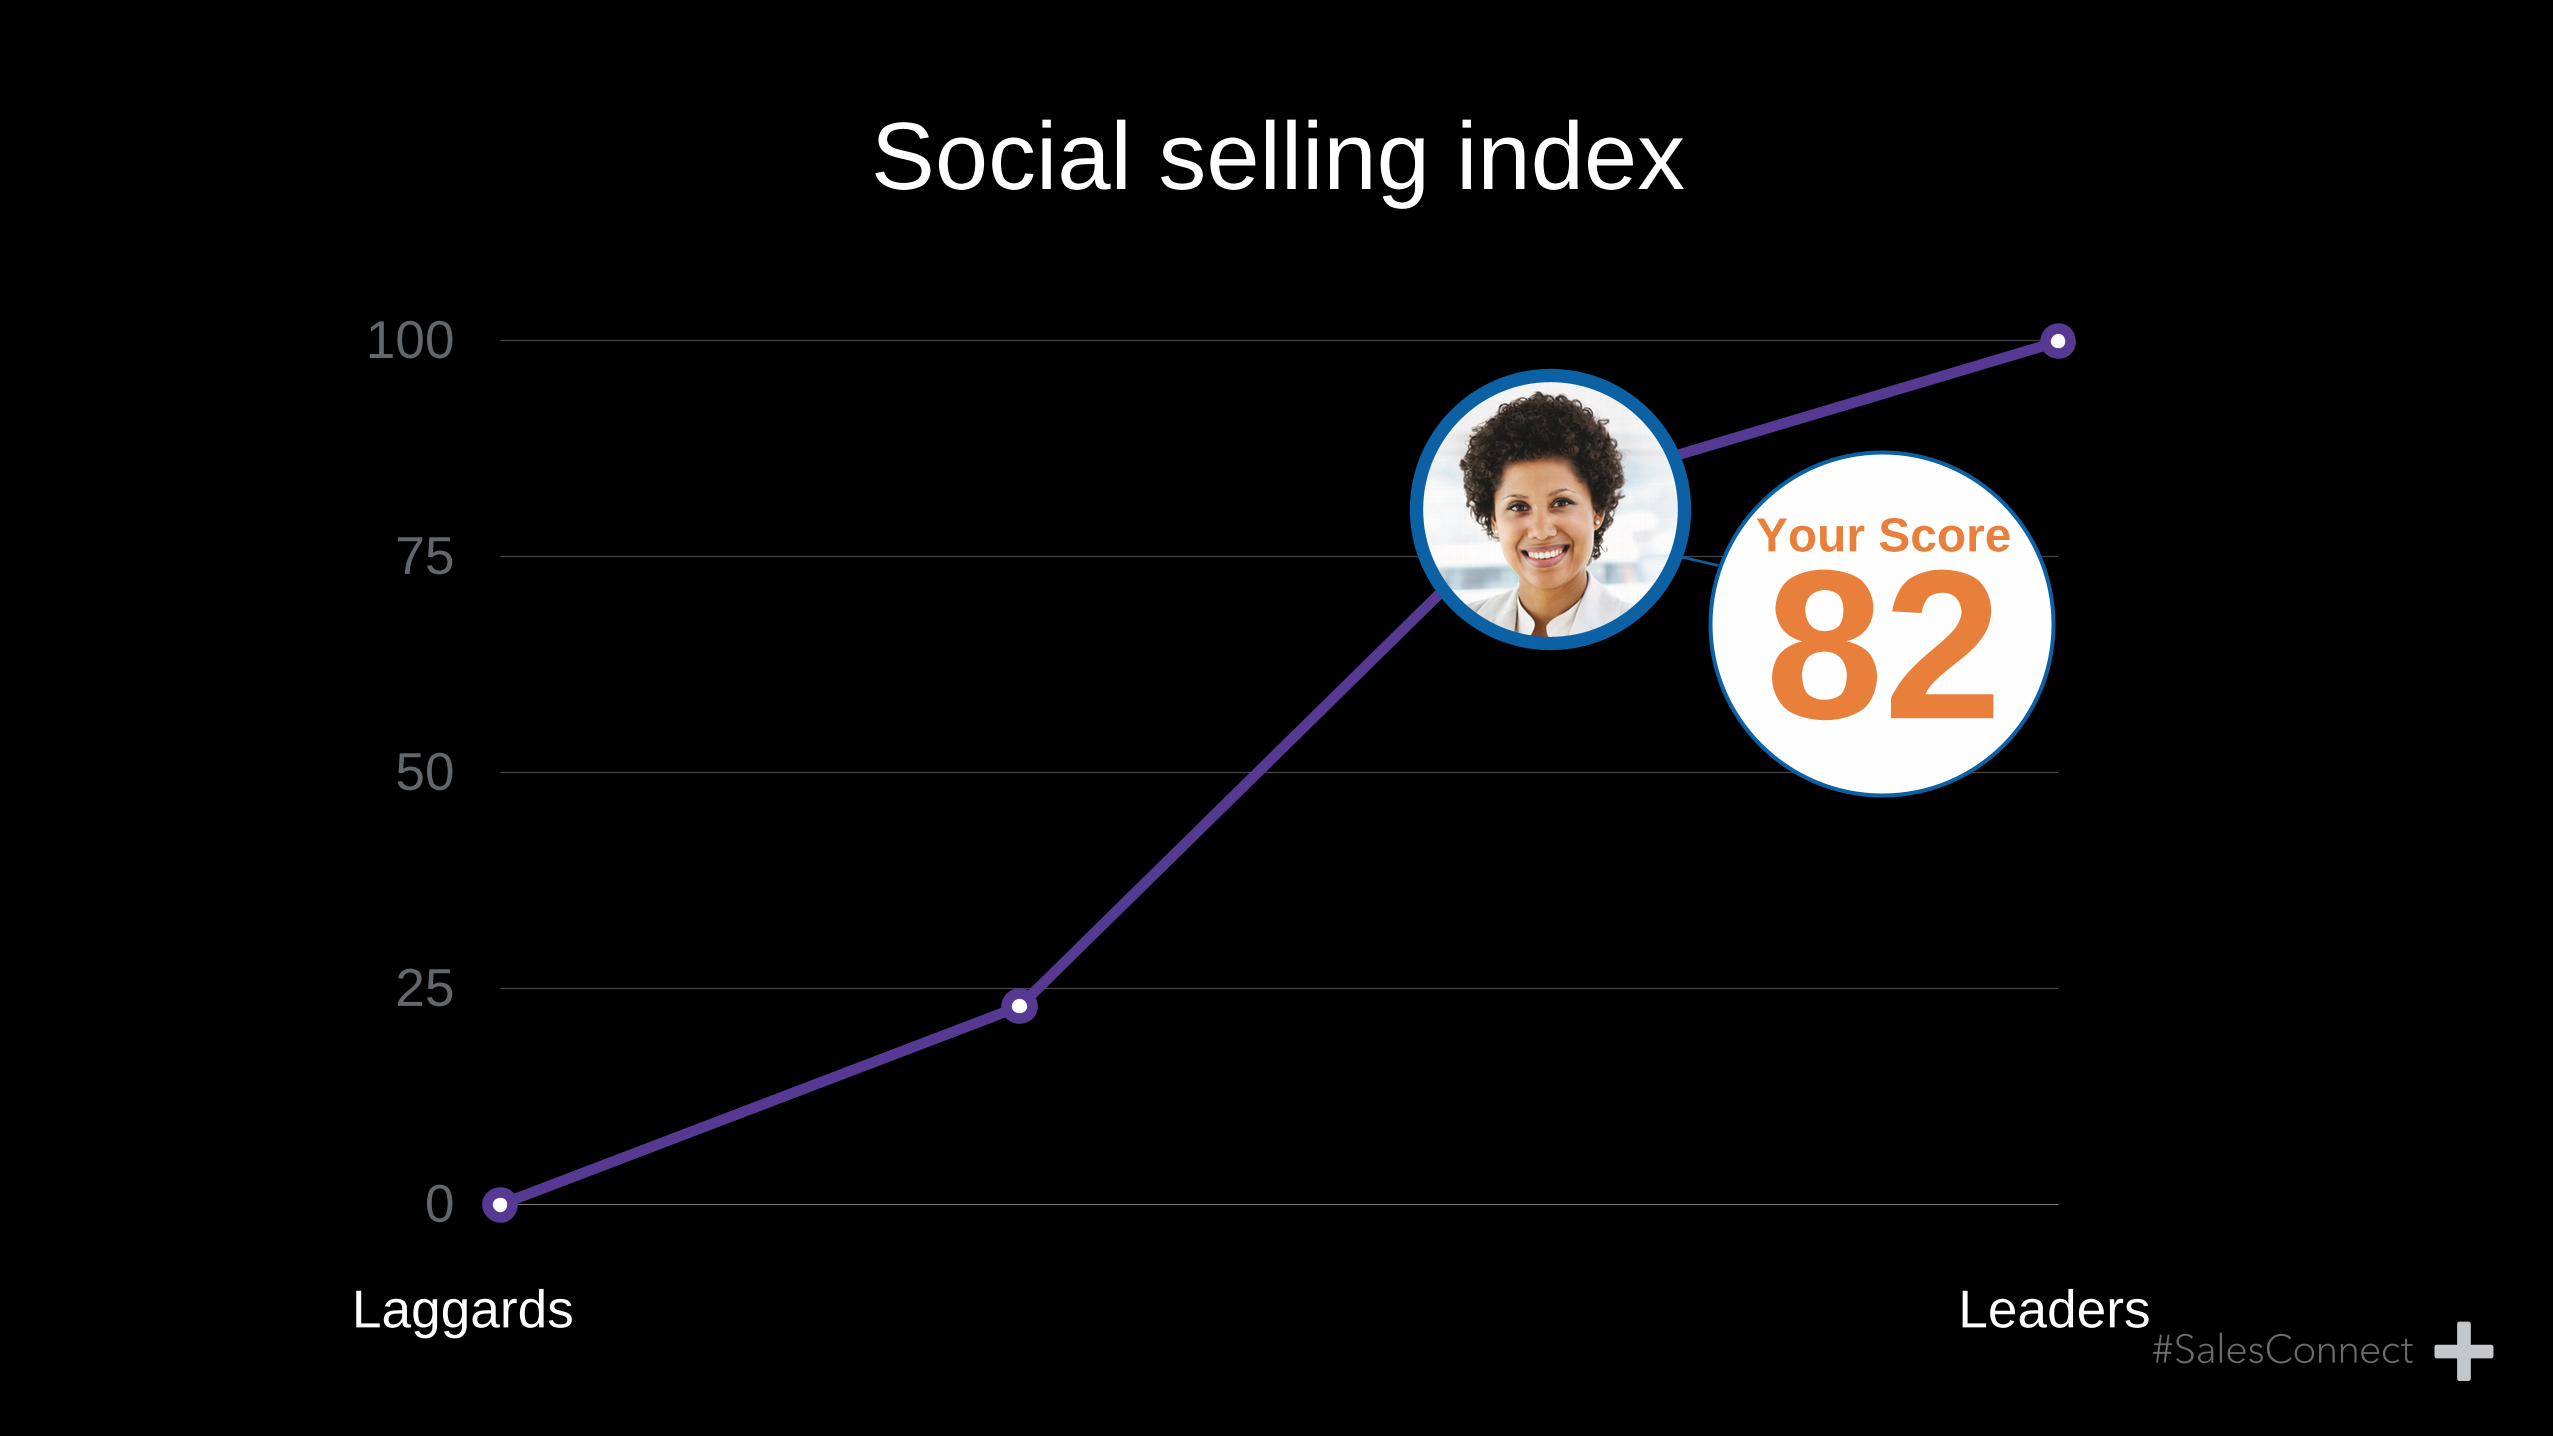
Social selling index
0
25
50
75
100
Laggards Leaders
Your Score
82

The components of social selling
Create a
professional
brand
Find the
right
people
Engage with
insights
Build strong
relationships
100


The components of social selling
Create a
professional
brand
Find the
right
people
Engage with
insights
Build strong
relationships
100
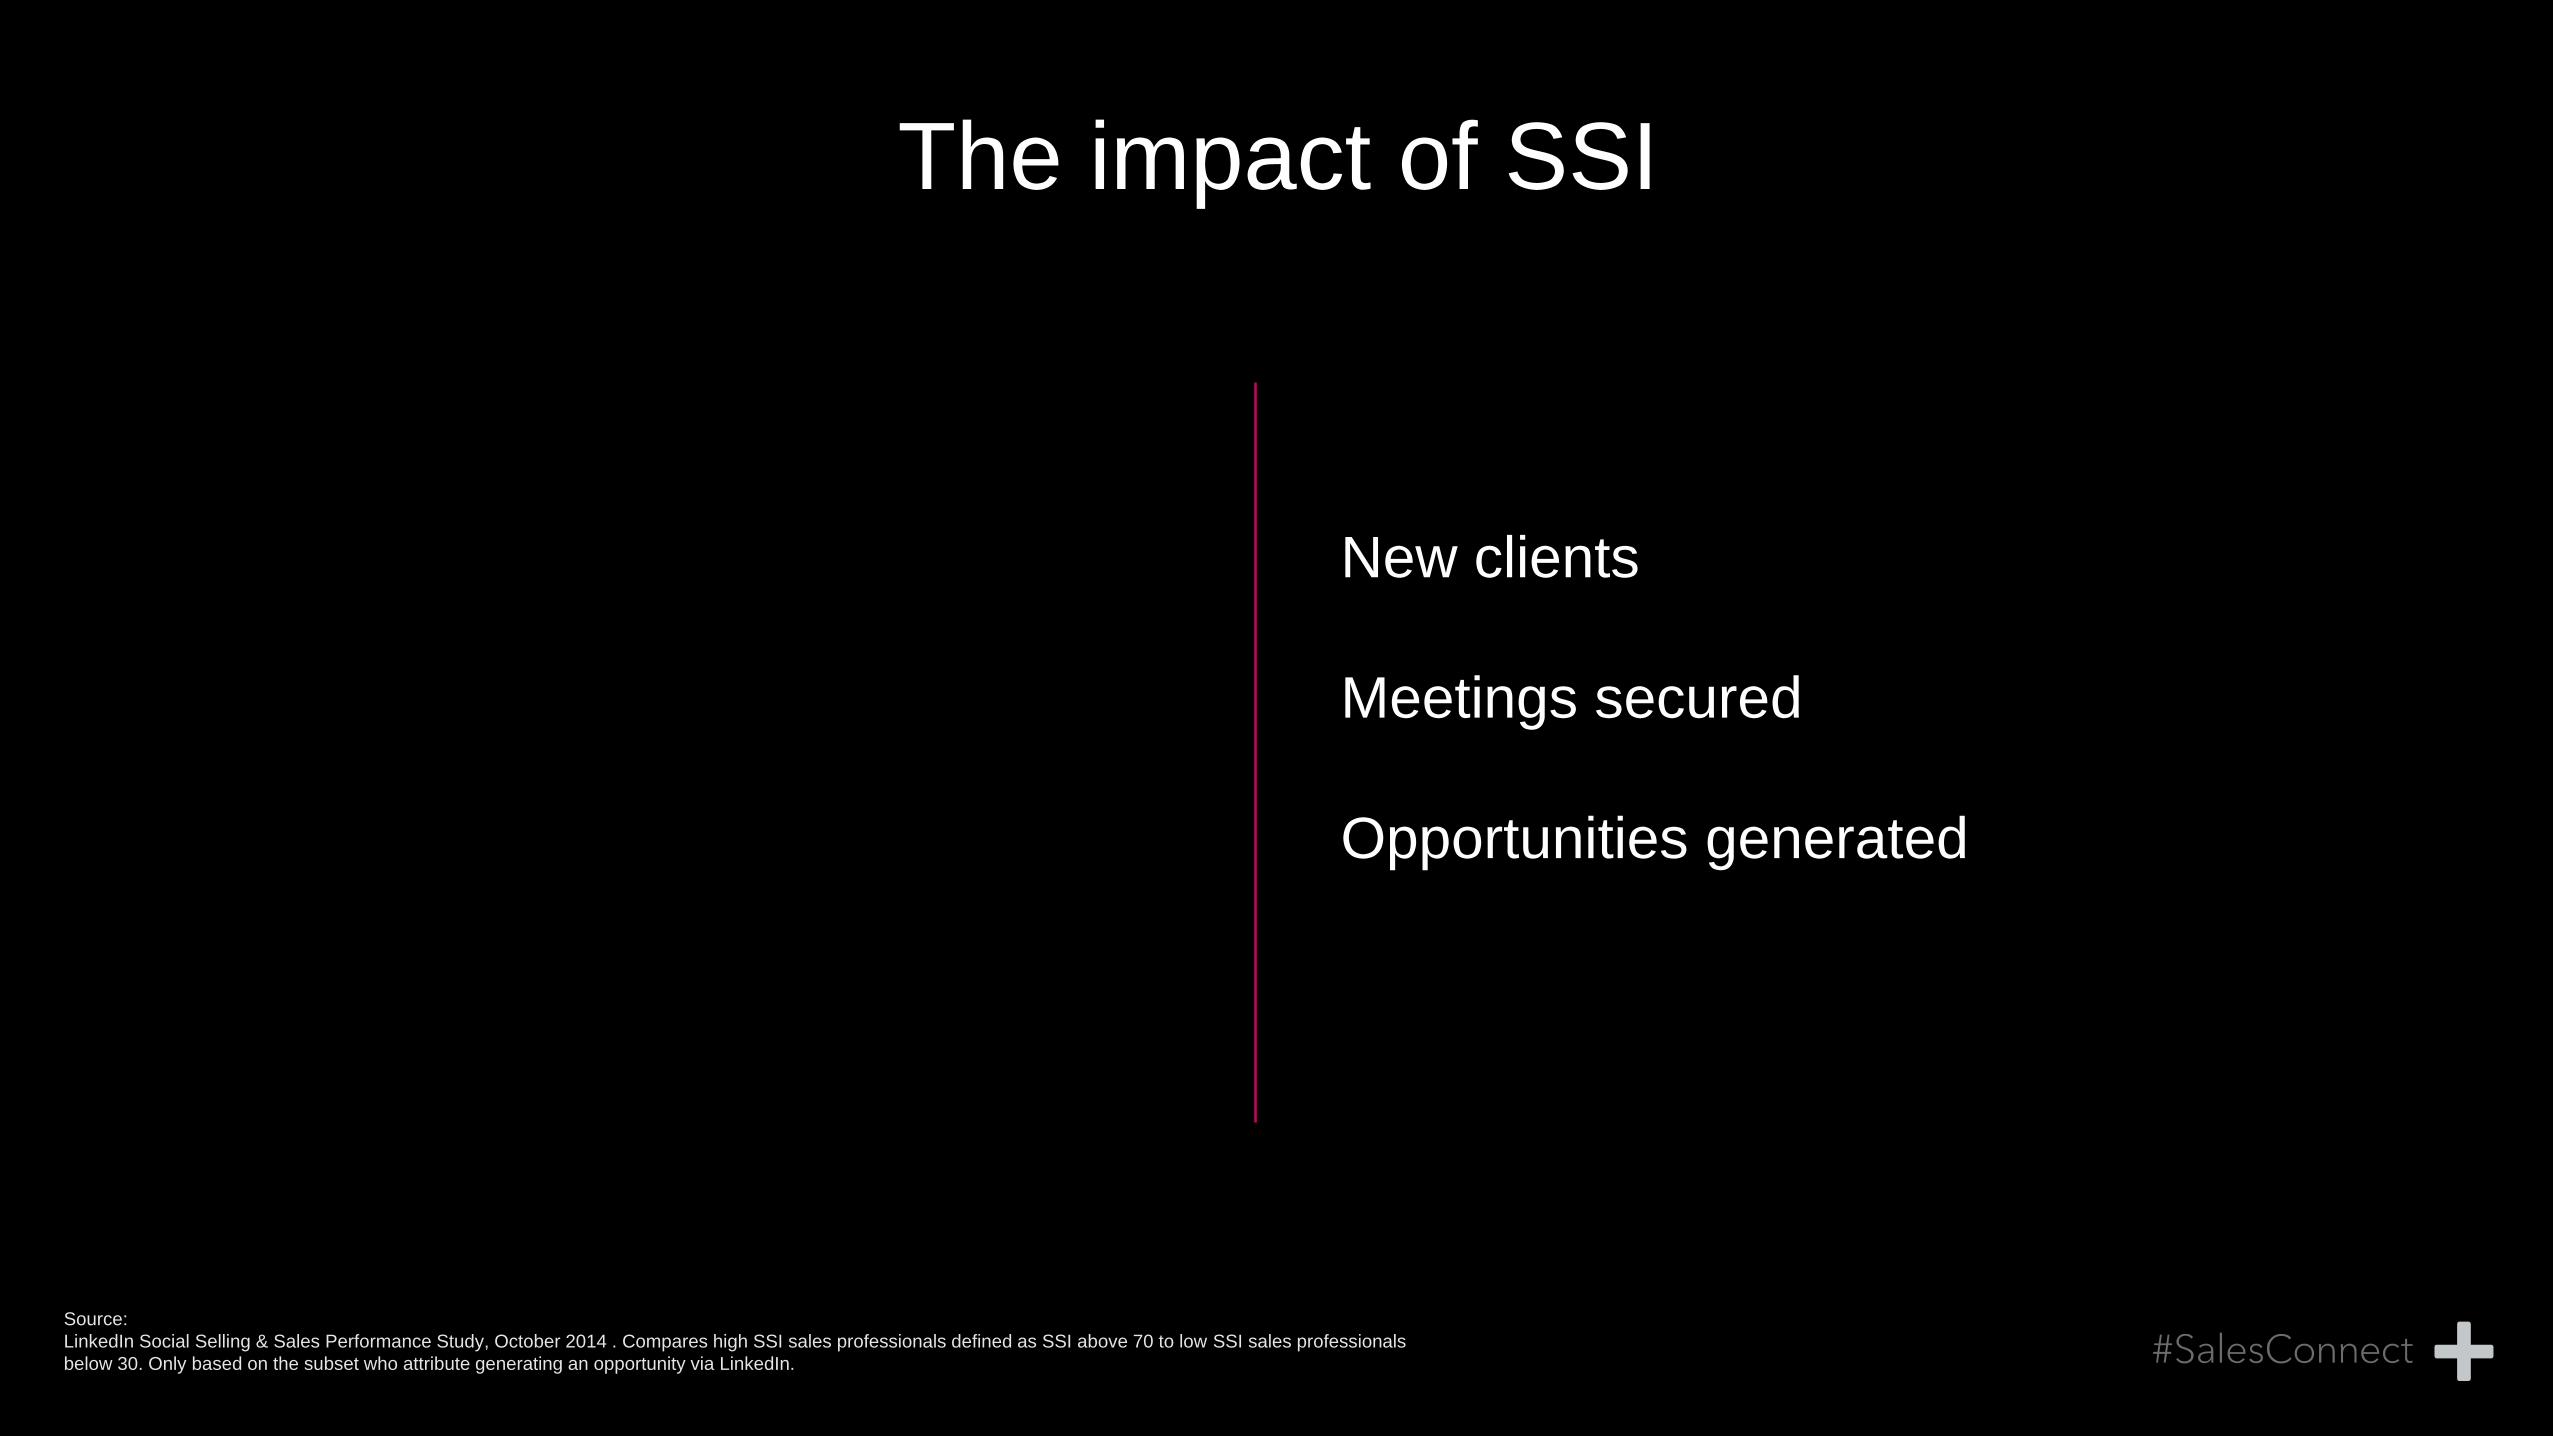
The impact of SSI
New clients
Meetings secured
Opportunities generated
Source:
LinkedIn Social Selling & Sales Performance Study, October 2014 . Compares high SSI sales professionals defined as SSI above 70 to low SSI sales professionals
below 30. Only based on the subset who attribute generating an opportunity via LinkedIn.

Are you presenting at a breakout session?
Make sure your segue slides are the right color.
To swap the slide master...
On the View tab, click Normal.
In Normal View, in the thumbnail pane on the left, click the
slide that you want to apply a layout to.
On the Home tab, click Layout, and then select the layout
that you want.
Keynotes & general
sessions
The Future of Sales
and Marketing
breakout track
Habits of High
Performing Reps
breakout track
How to Build a Social
Selling Organization
breakout track
title title title title
How do we really look?


It’s lonely at the top
46.7%
51.9%
0-20 21-69 70+
SSI distribution for all sales professionals
1.4%
Sources:
All Sales Professionals according to Linkedin as of Aug 2015, current SSI average
.

Social sellers are trending up globally
Aug 2014 Aug 2015
21.2
28.2
+33%
Sources:
Aug 2014 to Aug 2015, All Sales Professionals, Cohort – Aug 2014
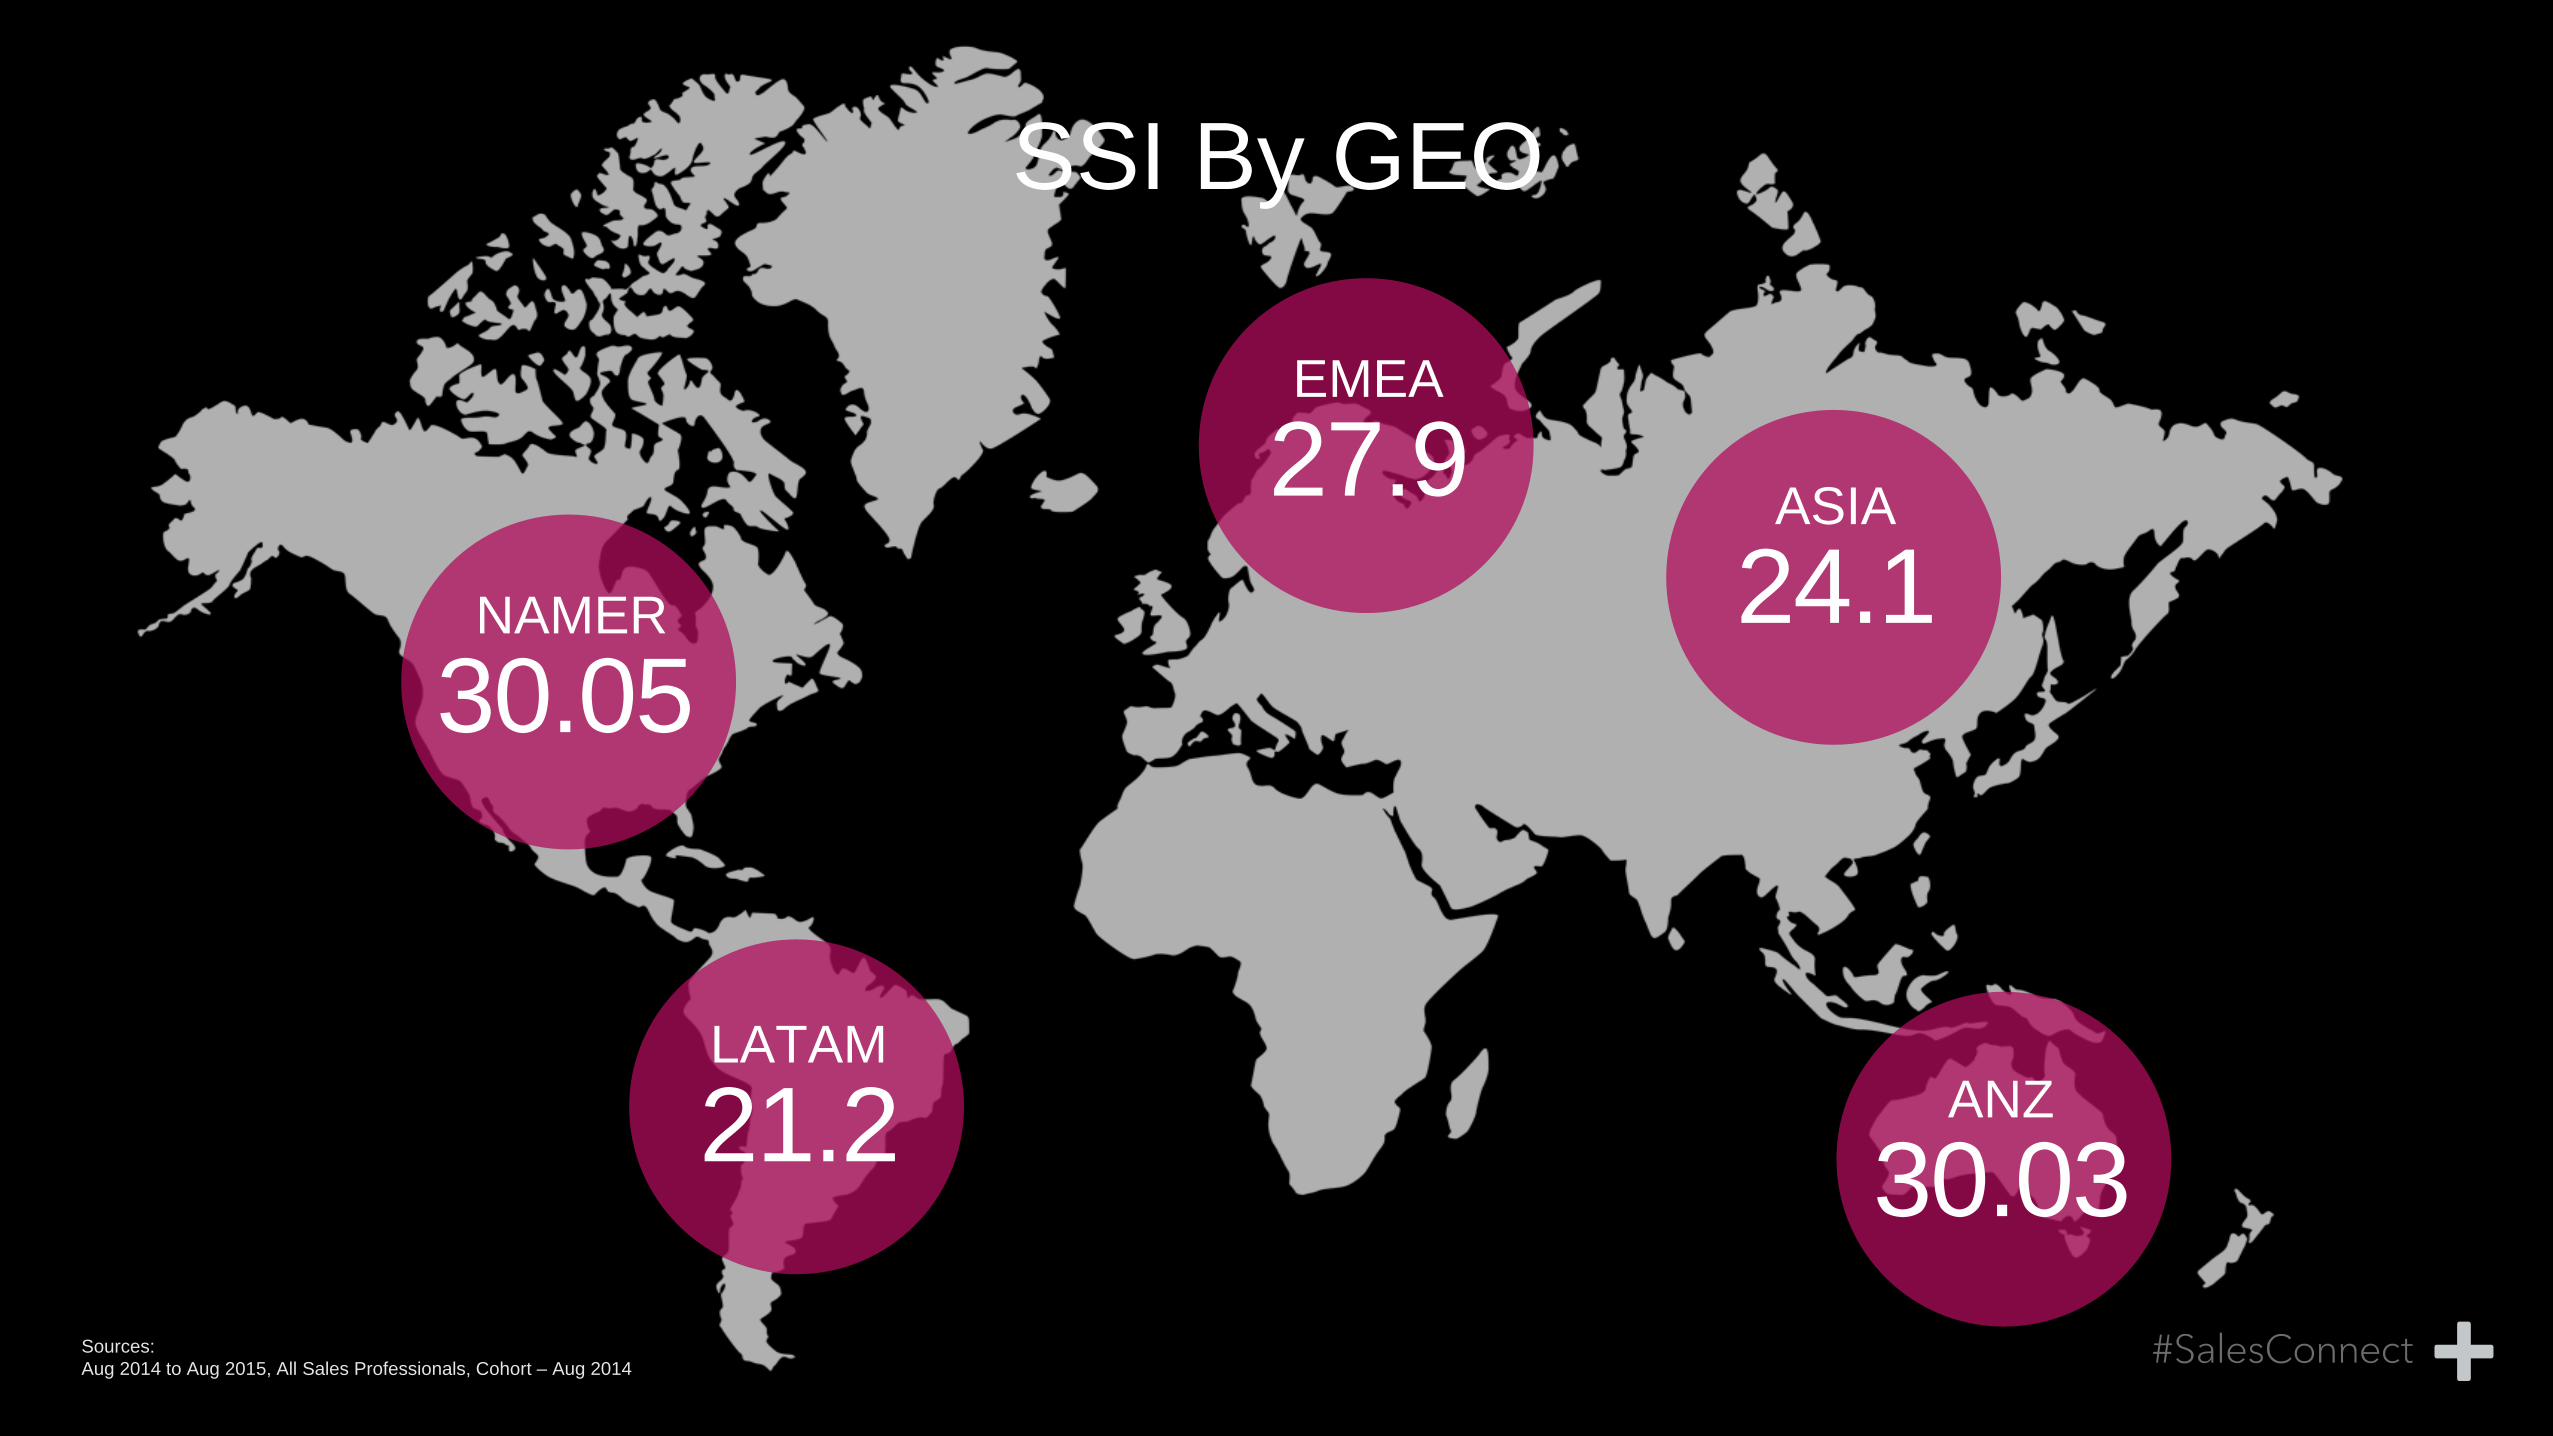
ANZ
30.03
ASIA
24.1
EMEA
27.9
LATAM
21.2
NAMER
30.05
SSI By GEO
Sources:
Aug 2014 to Aug 2015, All Sales Professionals, Cohort – Aug 2014

ANZ
+33%
ASIA
+36%
EMEA
+34%
LATAM
+46%
NAMER
+29%
SSI By GEO
Sources:
Aug 2014 to Aug 2015, All Sales Professionals, Cohort – Aug 2014

Tech and Professional Services lead
0 5 10 15 20 25 30 35 40
Retail & Consumer Products
Manufacturing/Industrial
Aero/Auto/Engineering
Government/Education/Non-profit
Healthcare & Pharmaceutical
Financial Services & Insurance
Oil & Energy
Professional Services
Tech, Telecom, & Media
Aug 15 Aug 14Sources:
Aug 2014 to Aug 2015, All Sales Professionals, Cohort – Aug 2014
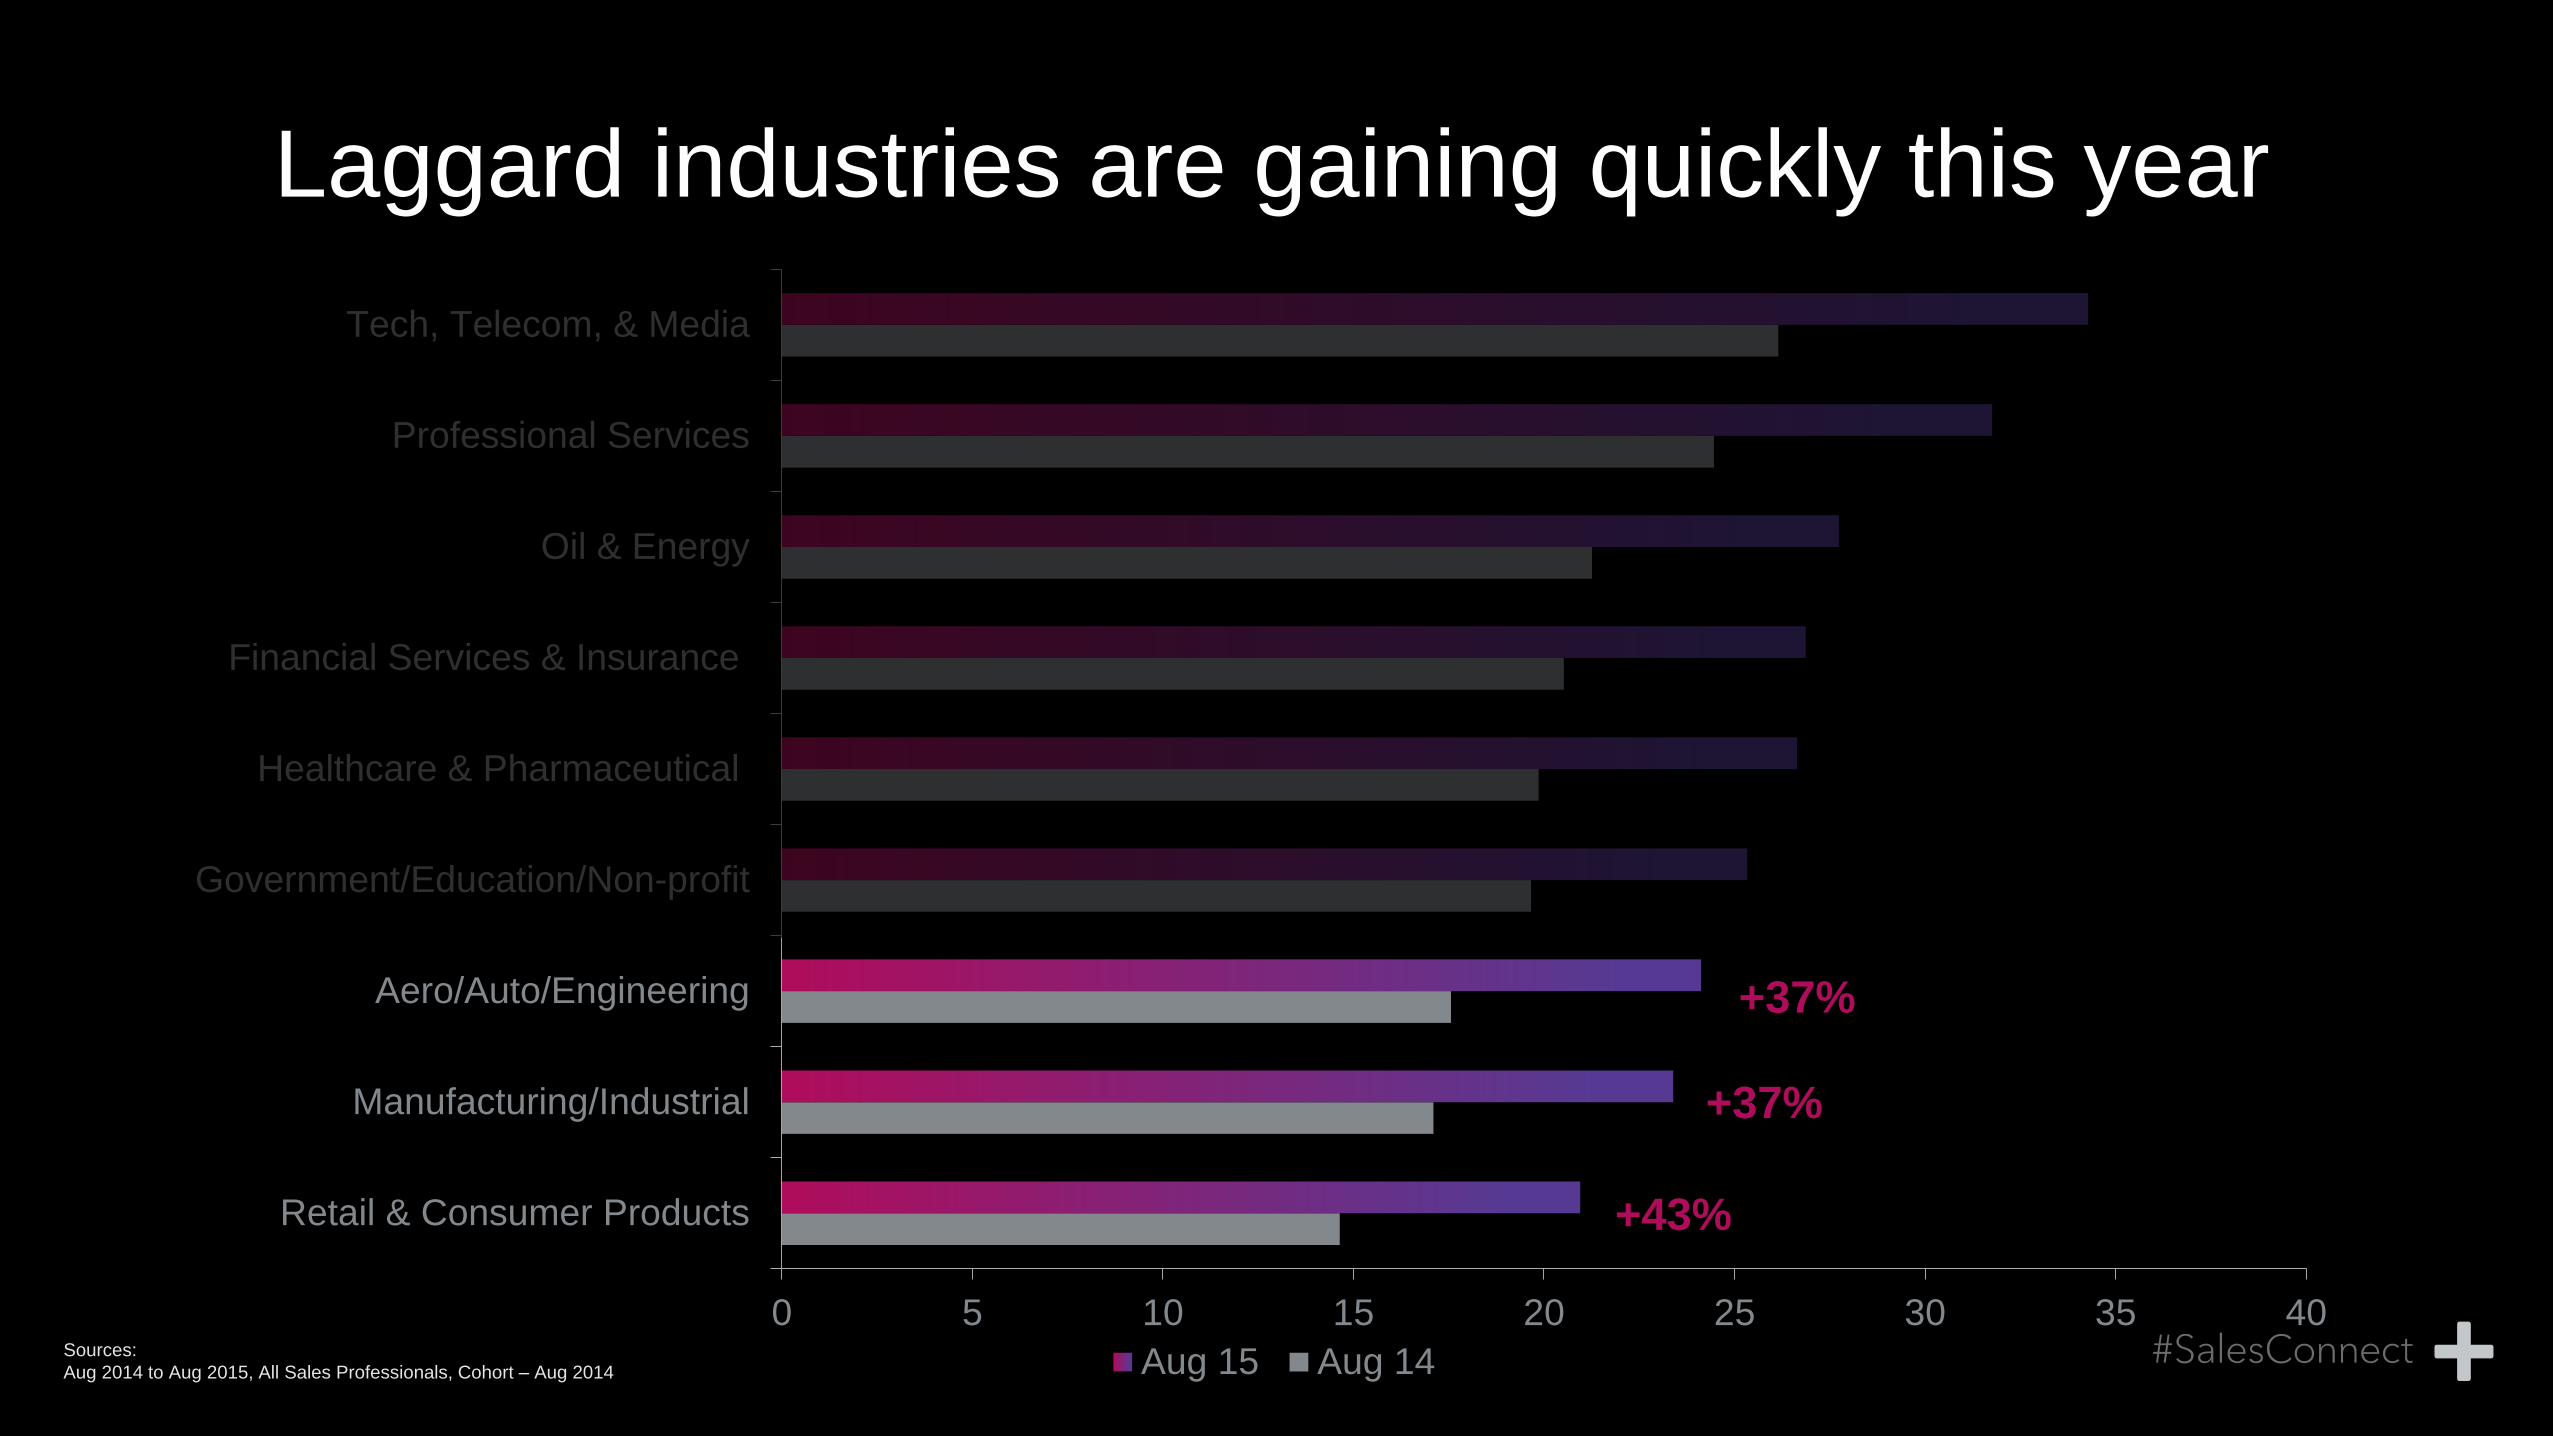
Laggard industries are gaining quickly this year
0 5 10 15 20 25 30 35 40
Retail & Consumer Products
Manufacturing/Industrial
Aero/Auto/Engineering
Government/Education/Non-profit
Healthcare & Pharmaceutical
Financial Services & Insurance
Oil & Energy
Professional Services
Tech, Telecom, & Media
Aug 15 Aug 14
+37%
+37%
+43%
Sources:
Aug 2014 to Aug 2015, All Sales Professionals, Cohort – Aug 2014
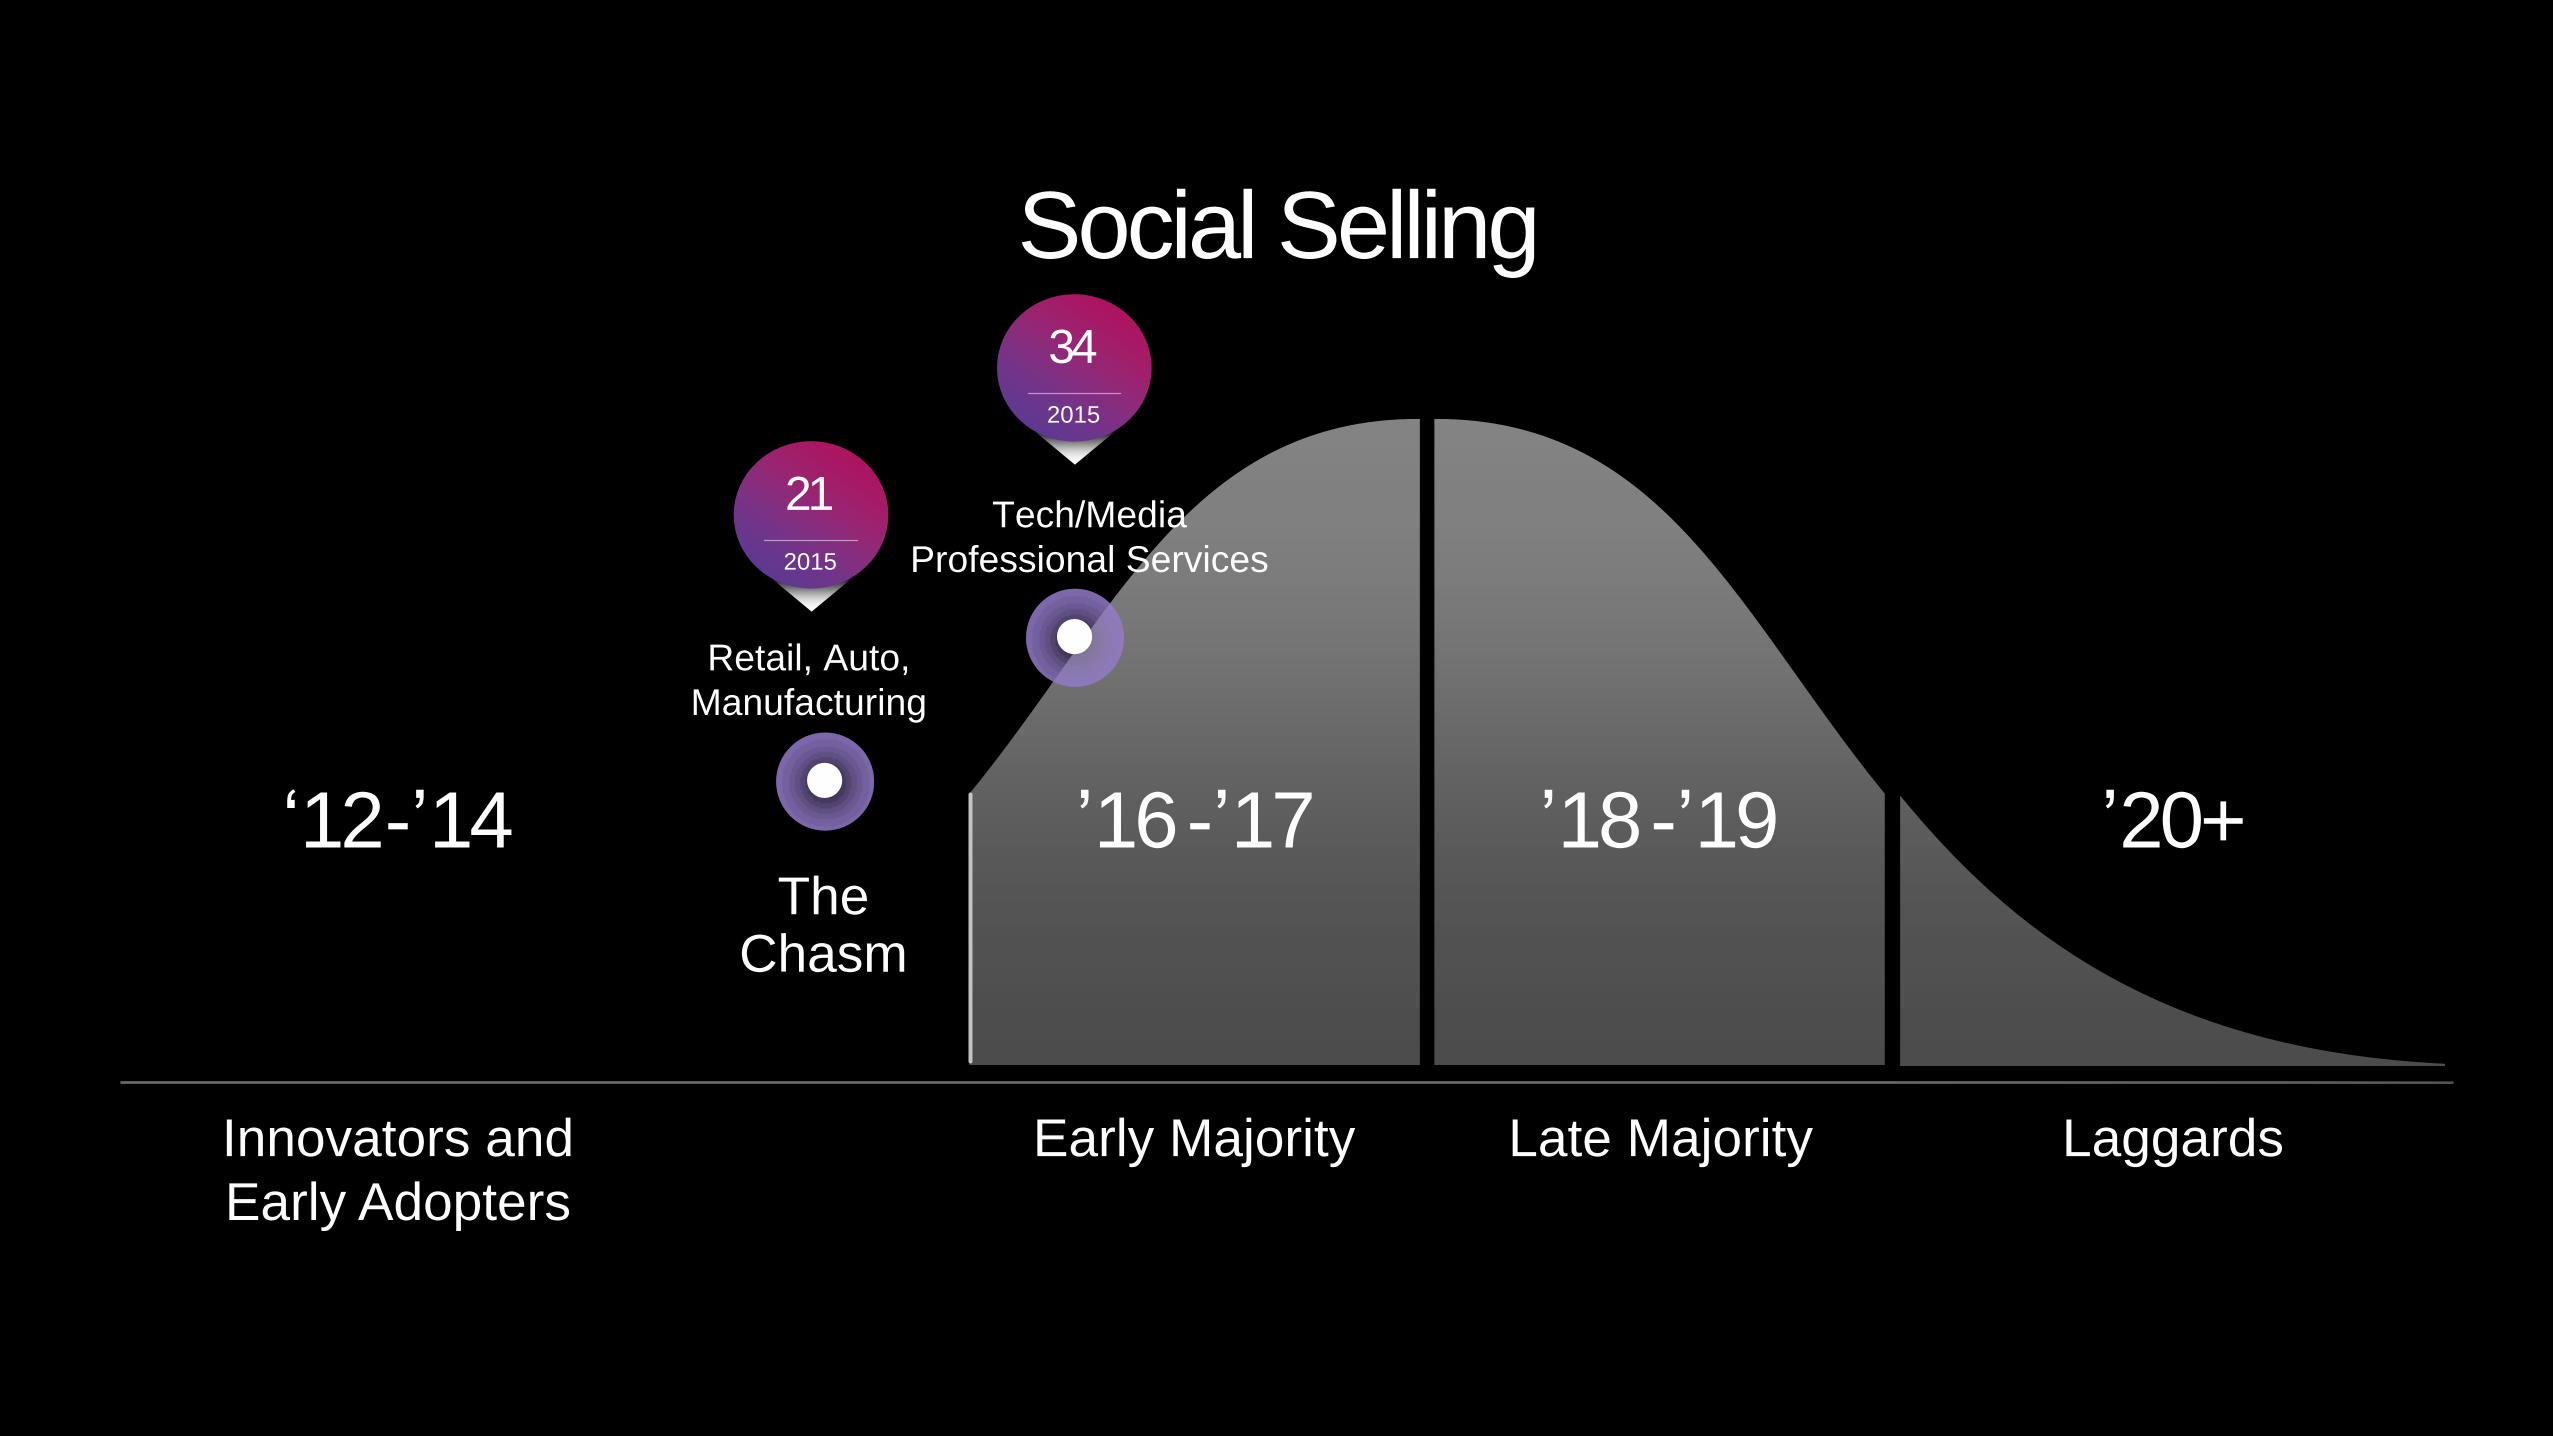
The Chasm
Early Majority Late Majority Laggards Innovators and
Early Adopters
Social Selling
‘12-’14 ’18-’19 ’20+ ’16-’17
Tech/Media
Professional Services
Retail, Auto,
Manufacturing
34
2015
21
2015

SMBs show greater social selling adoption
27.1
27.9
30.5
Enterprise Mid-Market SMB
Sources:
Aug 2014 to Aug 2015, All Sales Professionals, Cohort – Aug 2014

27.1
27.9
30.5
Enterprise Mid-Market SMB
SMBs show greater social selling adoption
+32% +32%
+34%
Sources:
Aug 2014 to Aug 2015, All Sales Professionals, Cohort – Aug 2014
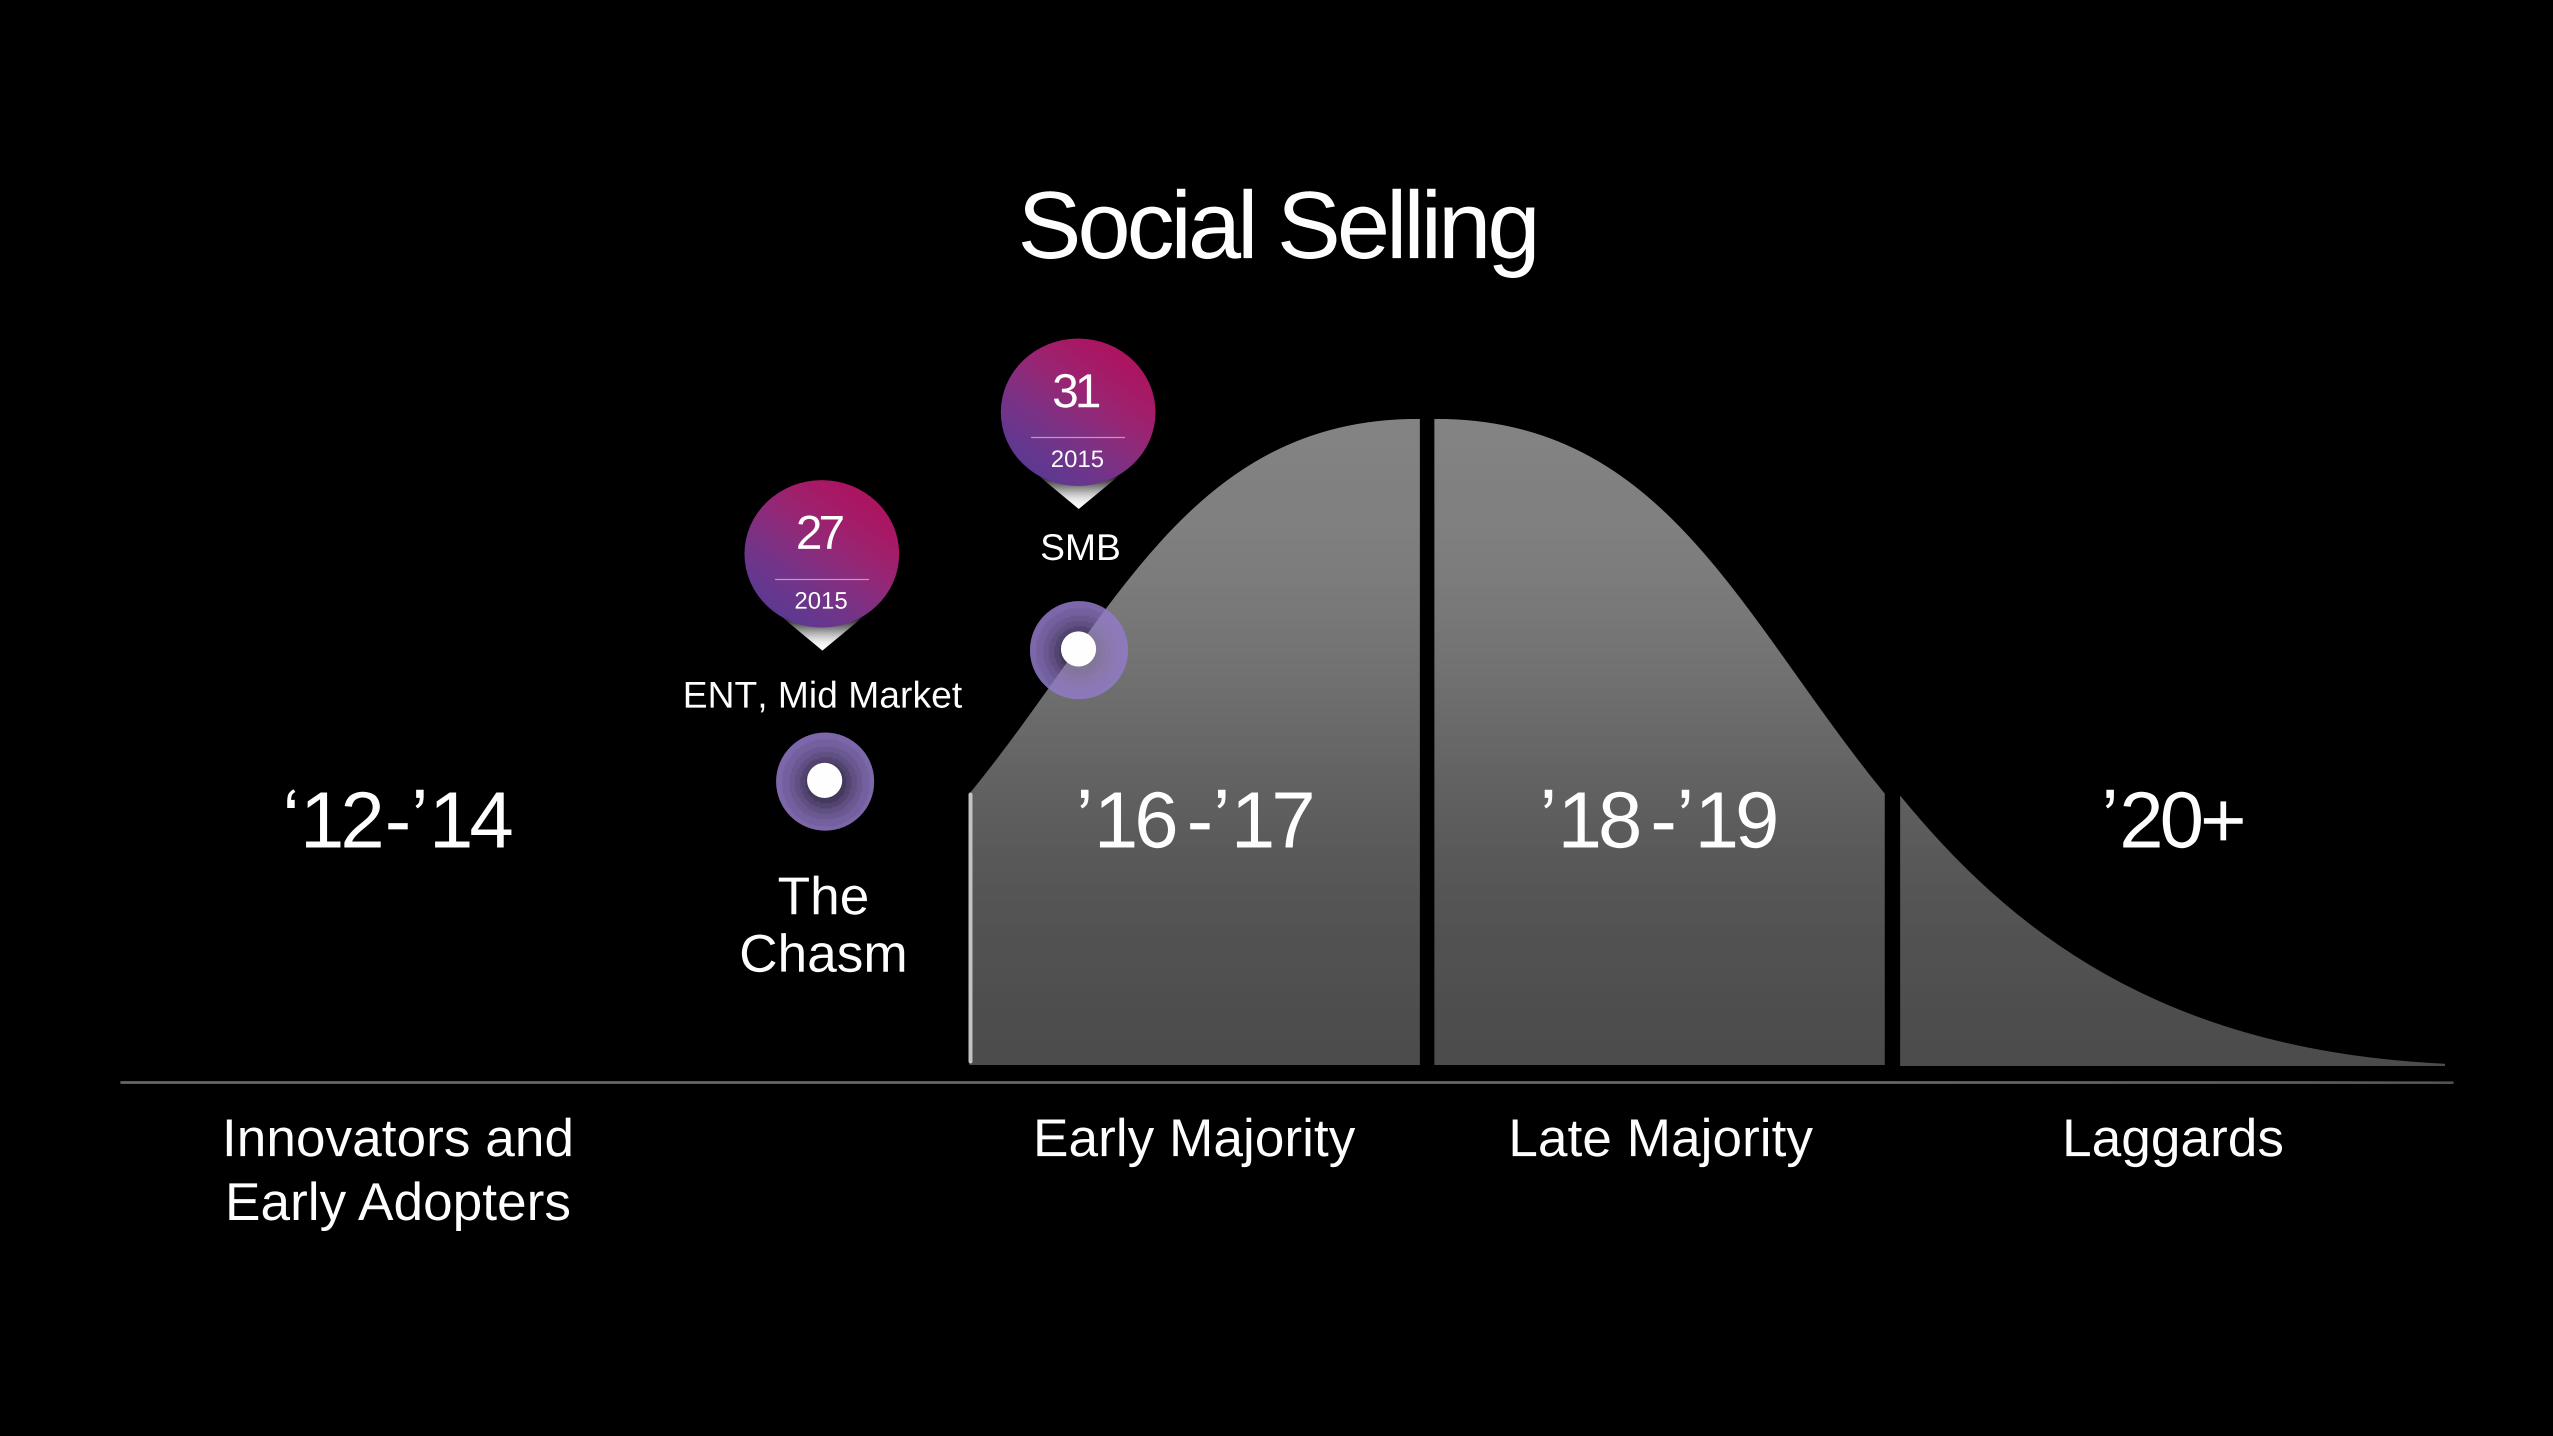
The Chasm
Early Majority Late Majority Laggards Innovators and
Early Adopters
Social Selling
‘12-’14 ’18-’19 ’20+ ’16-’17
SMB
ENT, Mid Market
31
2015
27
2015

Globally there’s room on the adoption curve
All Sales Professionals
Median: 22
SC Attendees
Median: 64
0 100
# o
f S
ale
s p
rofe
ssio
na
ls
SSI score Sources:
Aug 2015, All Sales Professionals according to LinkedIn compared to Sales Connect Attendees

Leaderboard
1 96
2 95
3 95
4 95
5 94
6 94
7 93
8 93
9 93
10 92
Lindsey Boggs
Darren Marble
Courtney Friedman
Paul Ratner
Jake Reni
Frannie Danzinger
Chris Keneally
Kevin Tully
Gabe Faraone
Shane Oren
Sources:
SSI score as of October 2, 2015.

56.1
MSFT SocialSellers
25.7
35.8
43.1 45.2
56.0
Company A Company B Company C Company D Company E
Microsoft overall SSI compared to competitors
Sources:
Aug 2015, Microsoft Sales Navigator Users vs Competitor Sales Professionals, current average

19%
39% 36%
6%
1%
17%
66%
15%
0%
10%
20%
30%
40%
50%
60%
70%
0 - 20 21 - 45 46 - 69 70 +
2.5x more than competition
Microsoft’s journey: creating a competitive advantage
SSI Range
MSFT Social Sellers
MSFT Competition
Sources:
Aug 2015, Microsoft Sales Navigator Users vs Competitor Sales Professionals, current average

Ahead of the competition in all SSI components
1.2x Establish a
professional
brand
1.2x Finding the right
people
1.7x Engaging with
insights
1.5x Establishing
relationships
Sources:
Aug 2015, Microsoft Sales Navigator Users vs Competitor Sales Professionals, current average

From SSI to outcomes
+34%
Profile views from
decision makers
+74%
Decision maker
connections
Microsoft vs. competitors…
Sources:
Aug 2014 to Aug 2015, Microsoft Sales Navigator Users vs Competitor Sales Professionals, no cohort.

Inbound profile views and connections at target
accounts are predictive of success
Opportunity creation
Close rate
Deal size
+

Are you presenting at a breakout session?
Make sure your segue slides are the right color.
To swap the slide master...
On the View tab, click Normal.
In Normal View, in the thumbnail pane on the left, click the
slide that you want to apply a layout to.
On the Home tab, click Layout, and then select the layout
that you want.
Keynotes & general
sessions
The Future of Sales
and Marketing
breakout track
Habits of High
Performing Reps
breakout track
How to Build a Social
Selling Organization
breakout track
title title title title


Leading by example to drive social selling behavior

Ensure that reps represent themselves well and connect to their customers
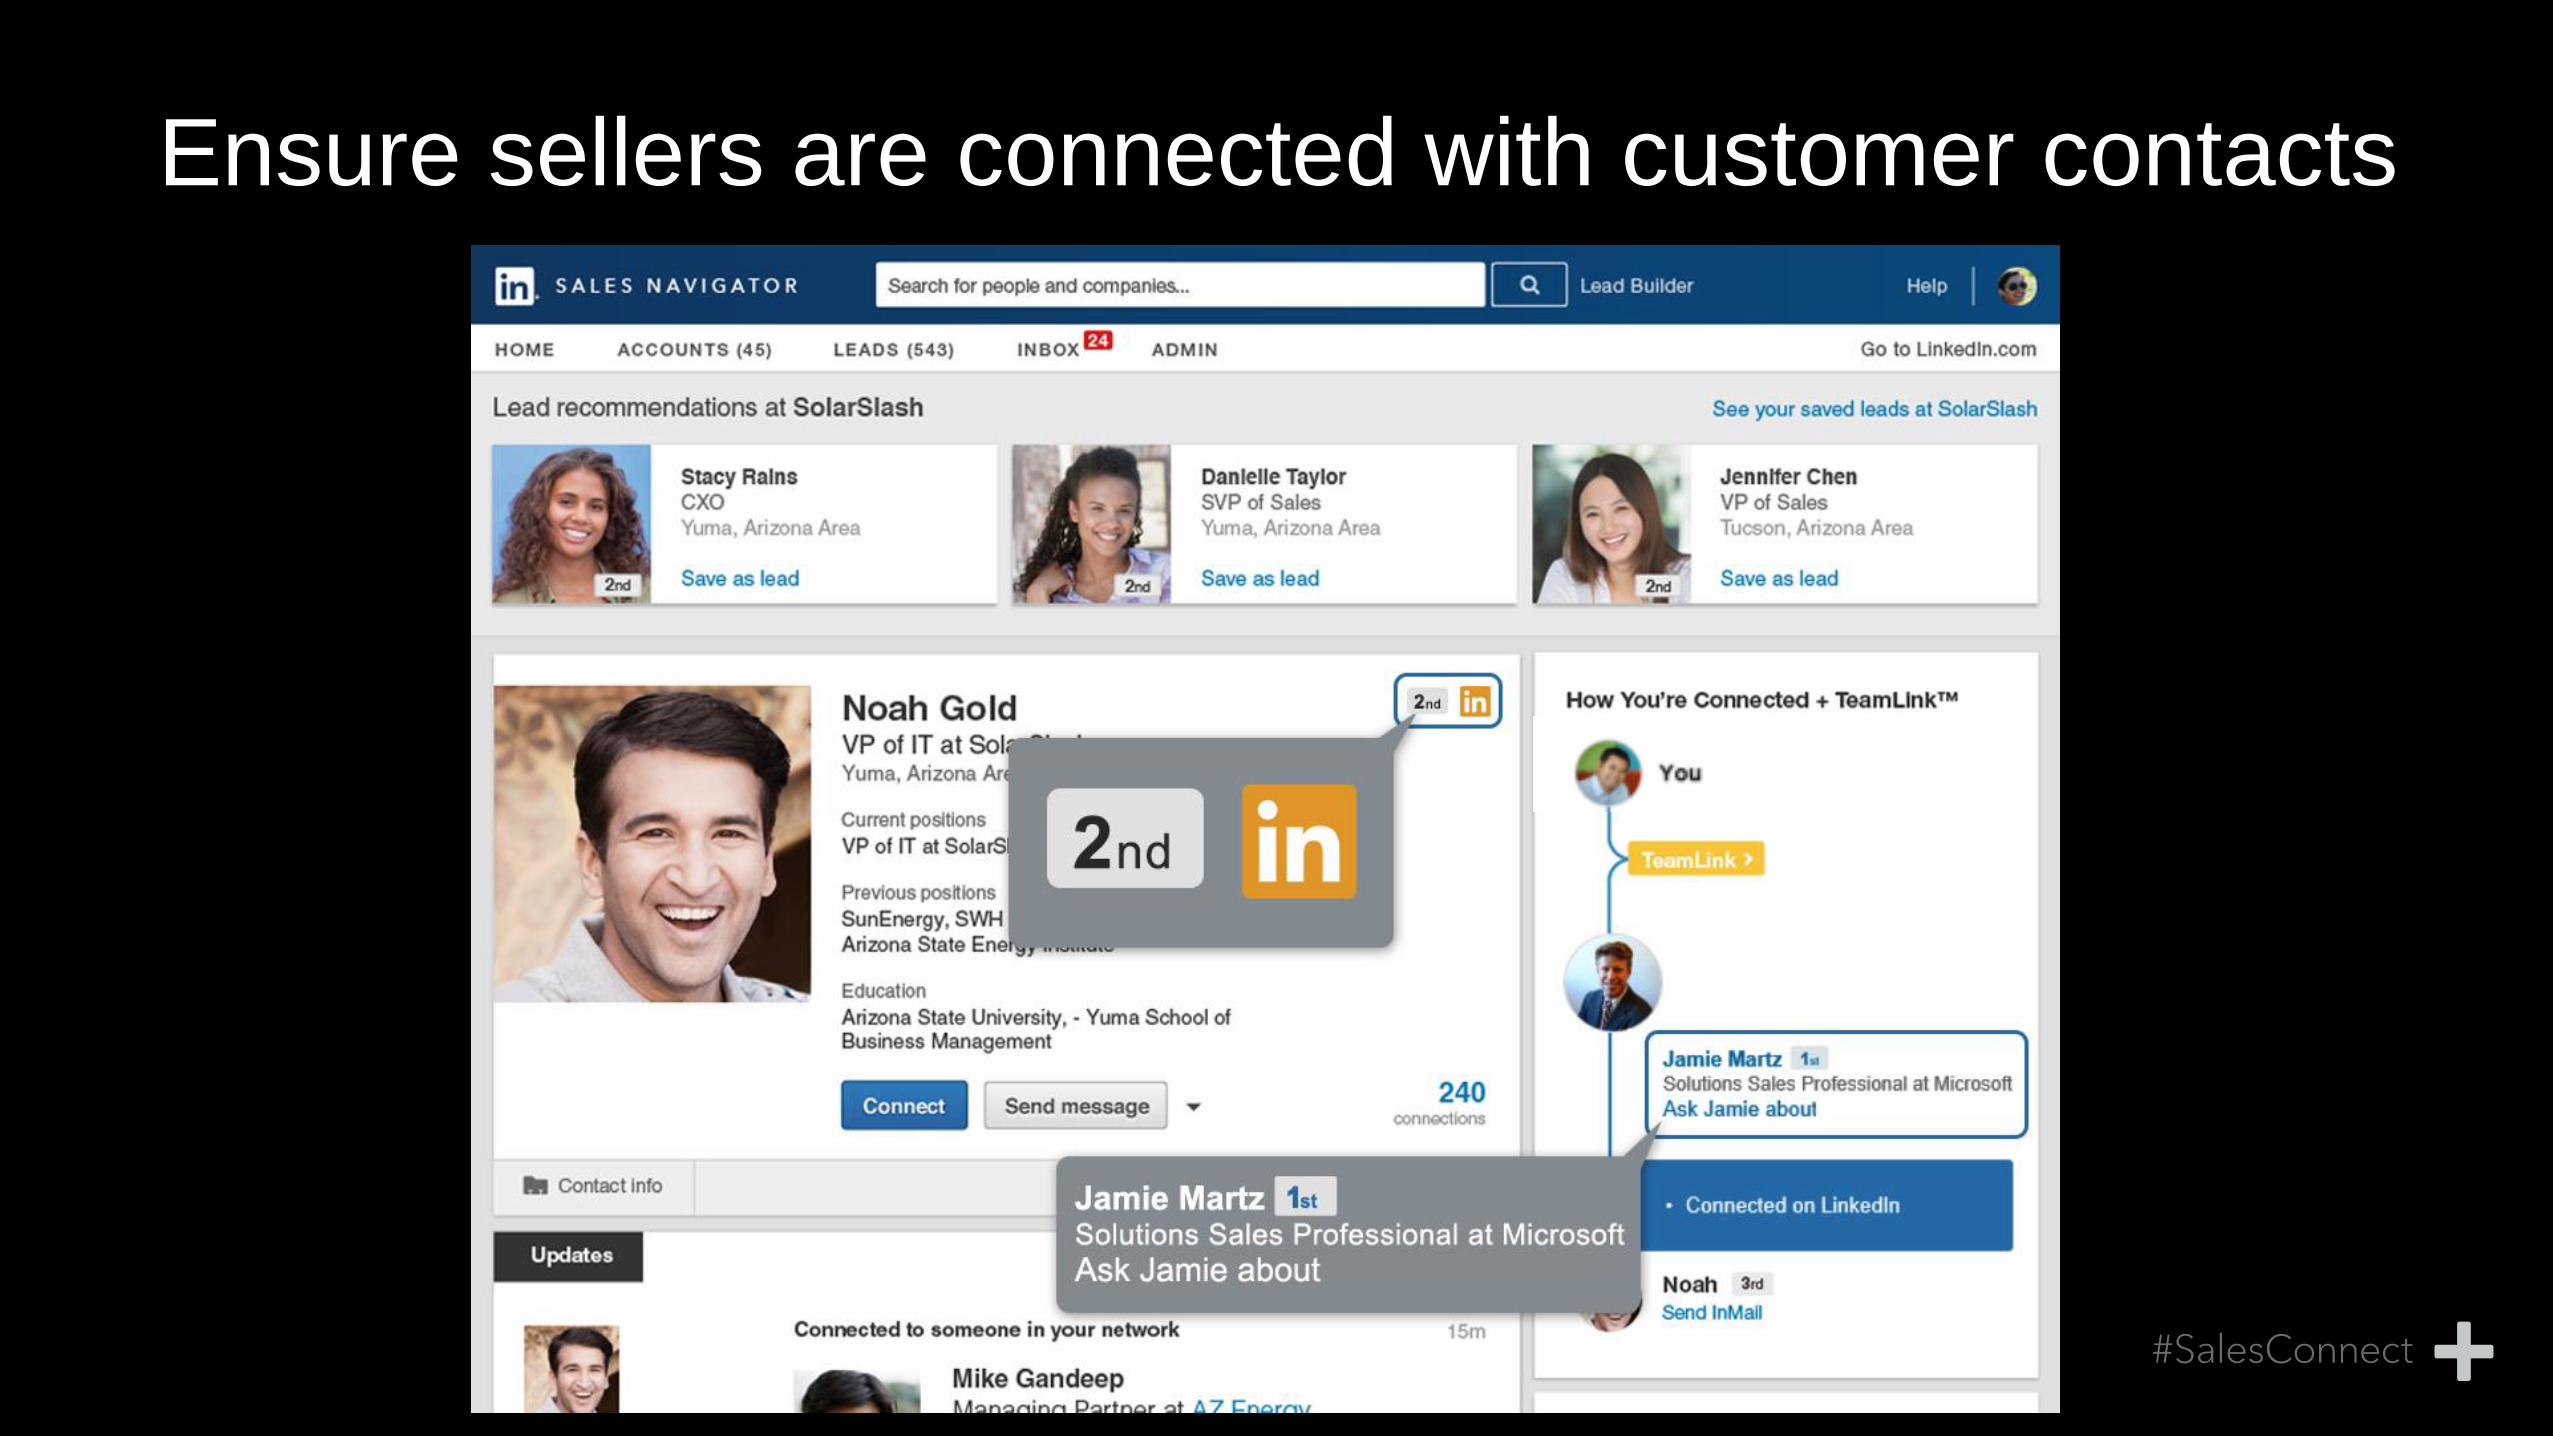
Ensure sellers are connected with customer contacts

How we got there SSI was first used to measure adoption of social

Microsoft Non-Social Sellers Microsoft Social Sellers
Our SSI trajectory
+7.8
+11.5 1.5x
higher
Sources:
Microsoft internal analysis
.

40
50
60
MSFT Social Sellers
Our journey and program timeline
Worldwide
kick-off
Launched
CRM system
with SSI
Mid year
review with
social selling
Aug 2014 Aug 2015 Sources:
Aug 2014 to Aug 2015, Microsoft Sales Navigator Users, Cohort – Aug 2014
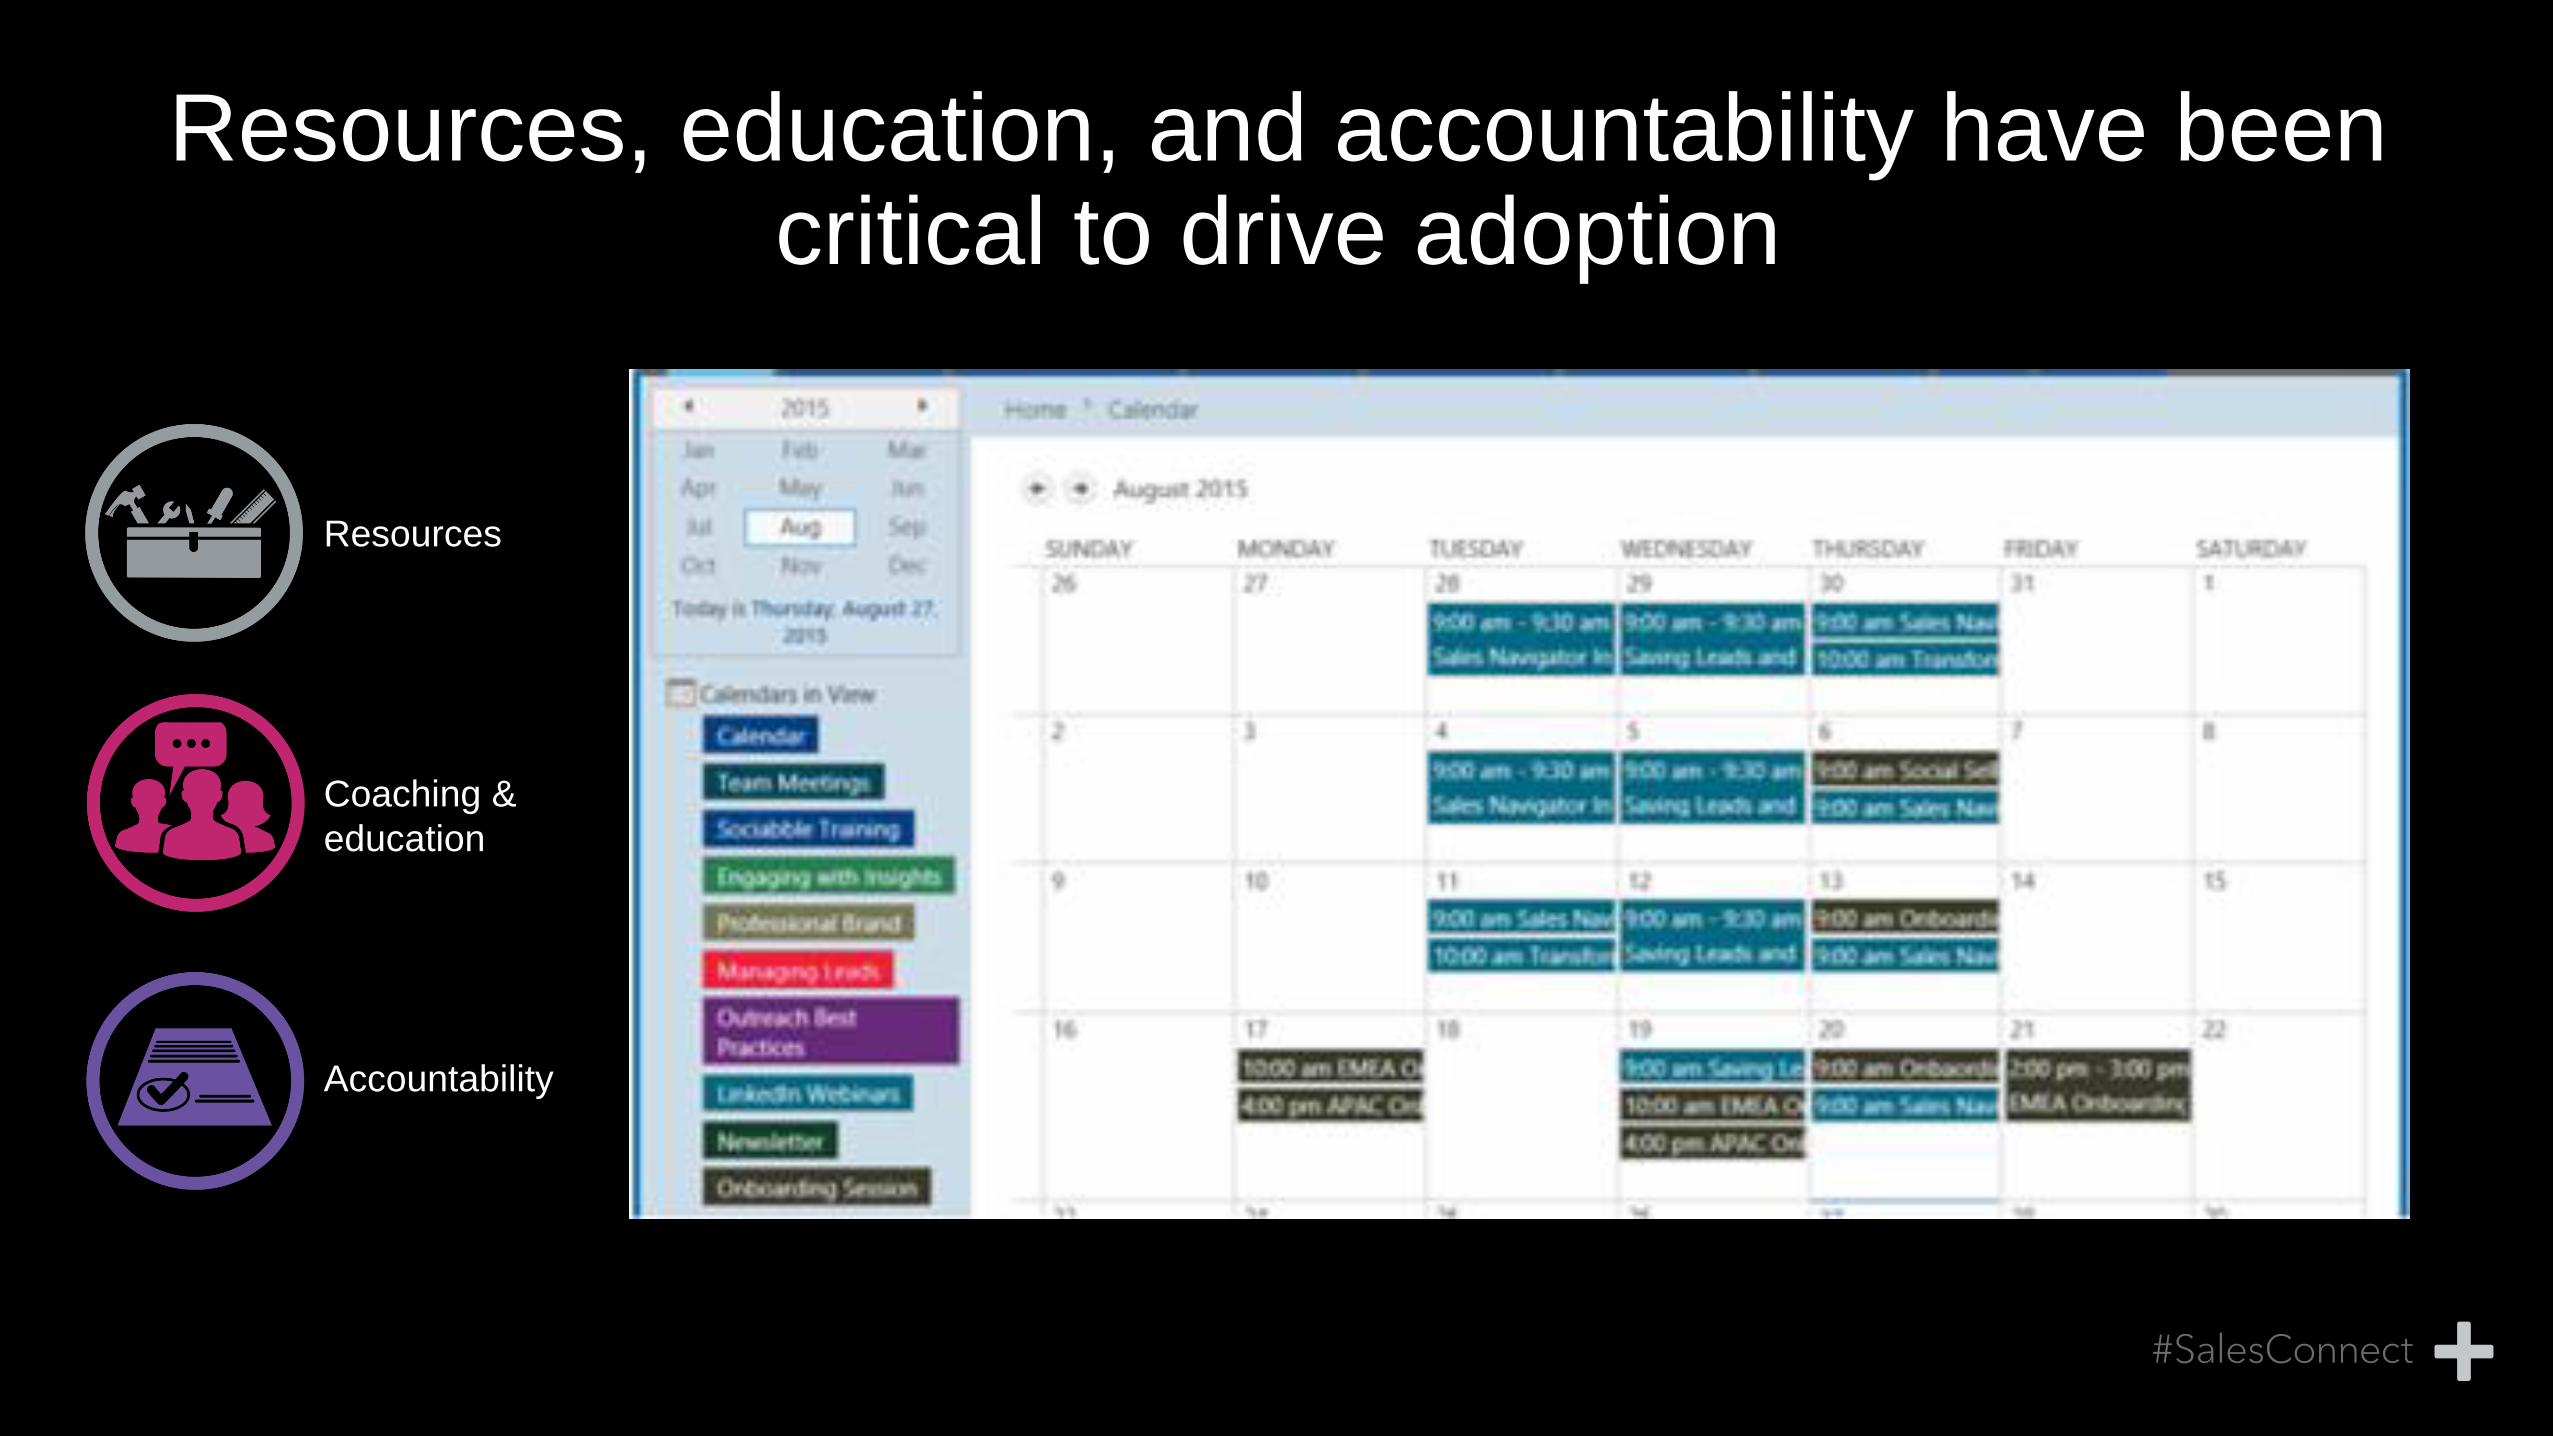
Resources, education, and accountability have been critical to drive adoption
Resources
Coaching &
education
Accountability

Social sellers have moved along the distribution curve
Microsoft Social Sellers SSI
Nu
mb
er
of
So
cia
l S
ell
ers
Pre SSI
Aug 15 SSI
Pre- SSI
Median: 48
Current SSI
Median: 56 Julie Ovadia- Sr. Director
SSI: 5 to 62
Sources:
Aug 2015, Microsoft Sales Navigator Customers, Pre SSI is the score prior to onboarding with Sales Navigator, while Aug 2015 is the SSI score as of Aug 2015 for all Microsoft Sales Navigator users

Opportunity impact for high SSI sellers
Low engaged High engaged
+38%
30.3
41.8
# of Opportunities Sources:
Aug 2014 to Aug 2015, Microsfot Sales Navigator Users, Cohort of users who on boarded prior to Aug 2014

We saw a direct relationship between SSI and
opportunity growth
For every
10 SSI point increase
4.3 More
opportunities
=
Sources:
Microsoft internal analysis
.

SSI leaders have increased connectivity and account penetration
IT Decision Makers
70+ SSI
+79% More decision maker
connections than non-social
sellers
Business Decision Makers
Sources:
Microsoft internal analysis
.

Sales Navigator users are generating 1.7x the number
of opportunities & revenue
1.7x More opportunities &
revenue on average
1.9x
2.3x
3.0x Enterprise &
Partner Group
Corporate Group
Public Sector
1.5x
1.2x
5.0x
$
Opportunities Revenues
Sources:
LinkedIn & Microsoft CRM Analysis – Fiscal Year 2015, US Subsidiary Only. October 2015
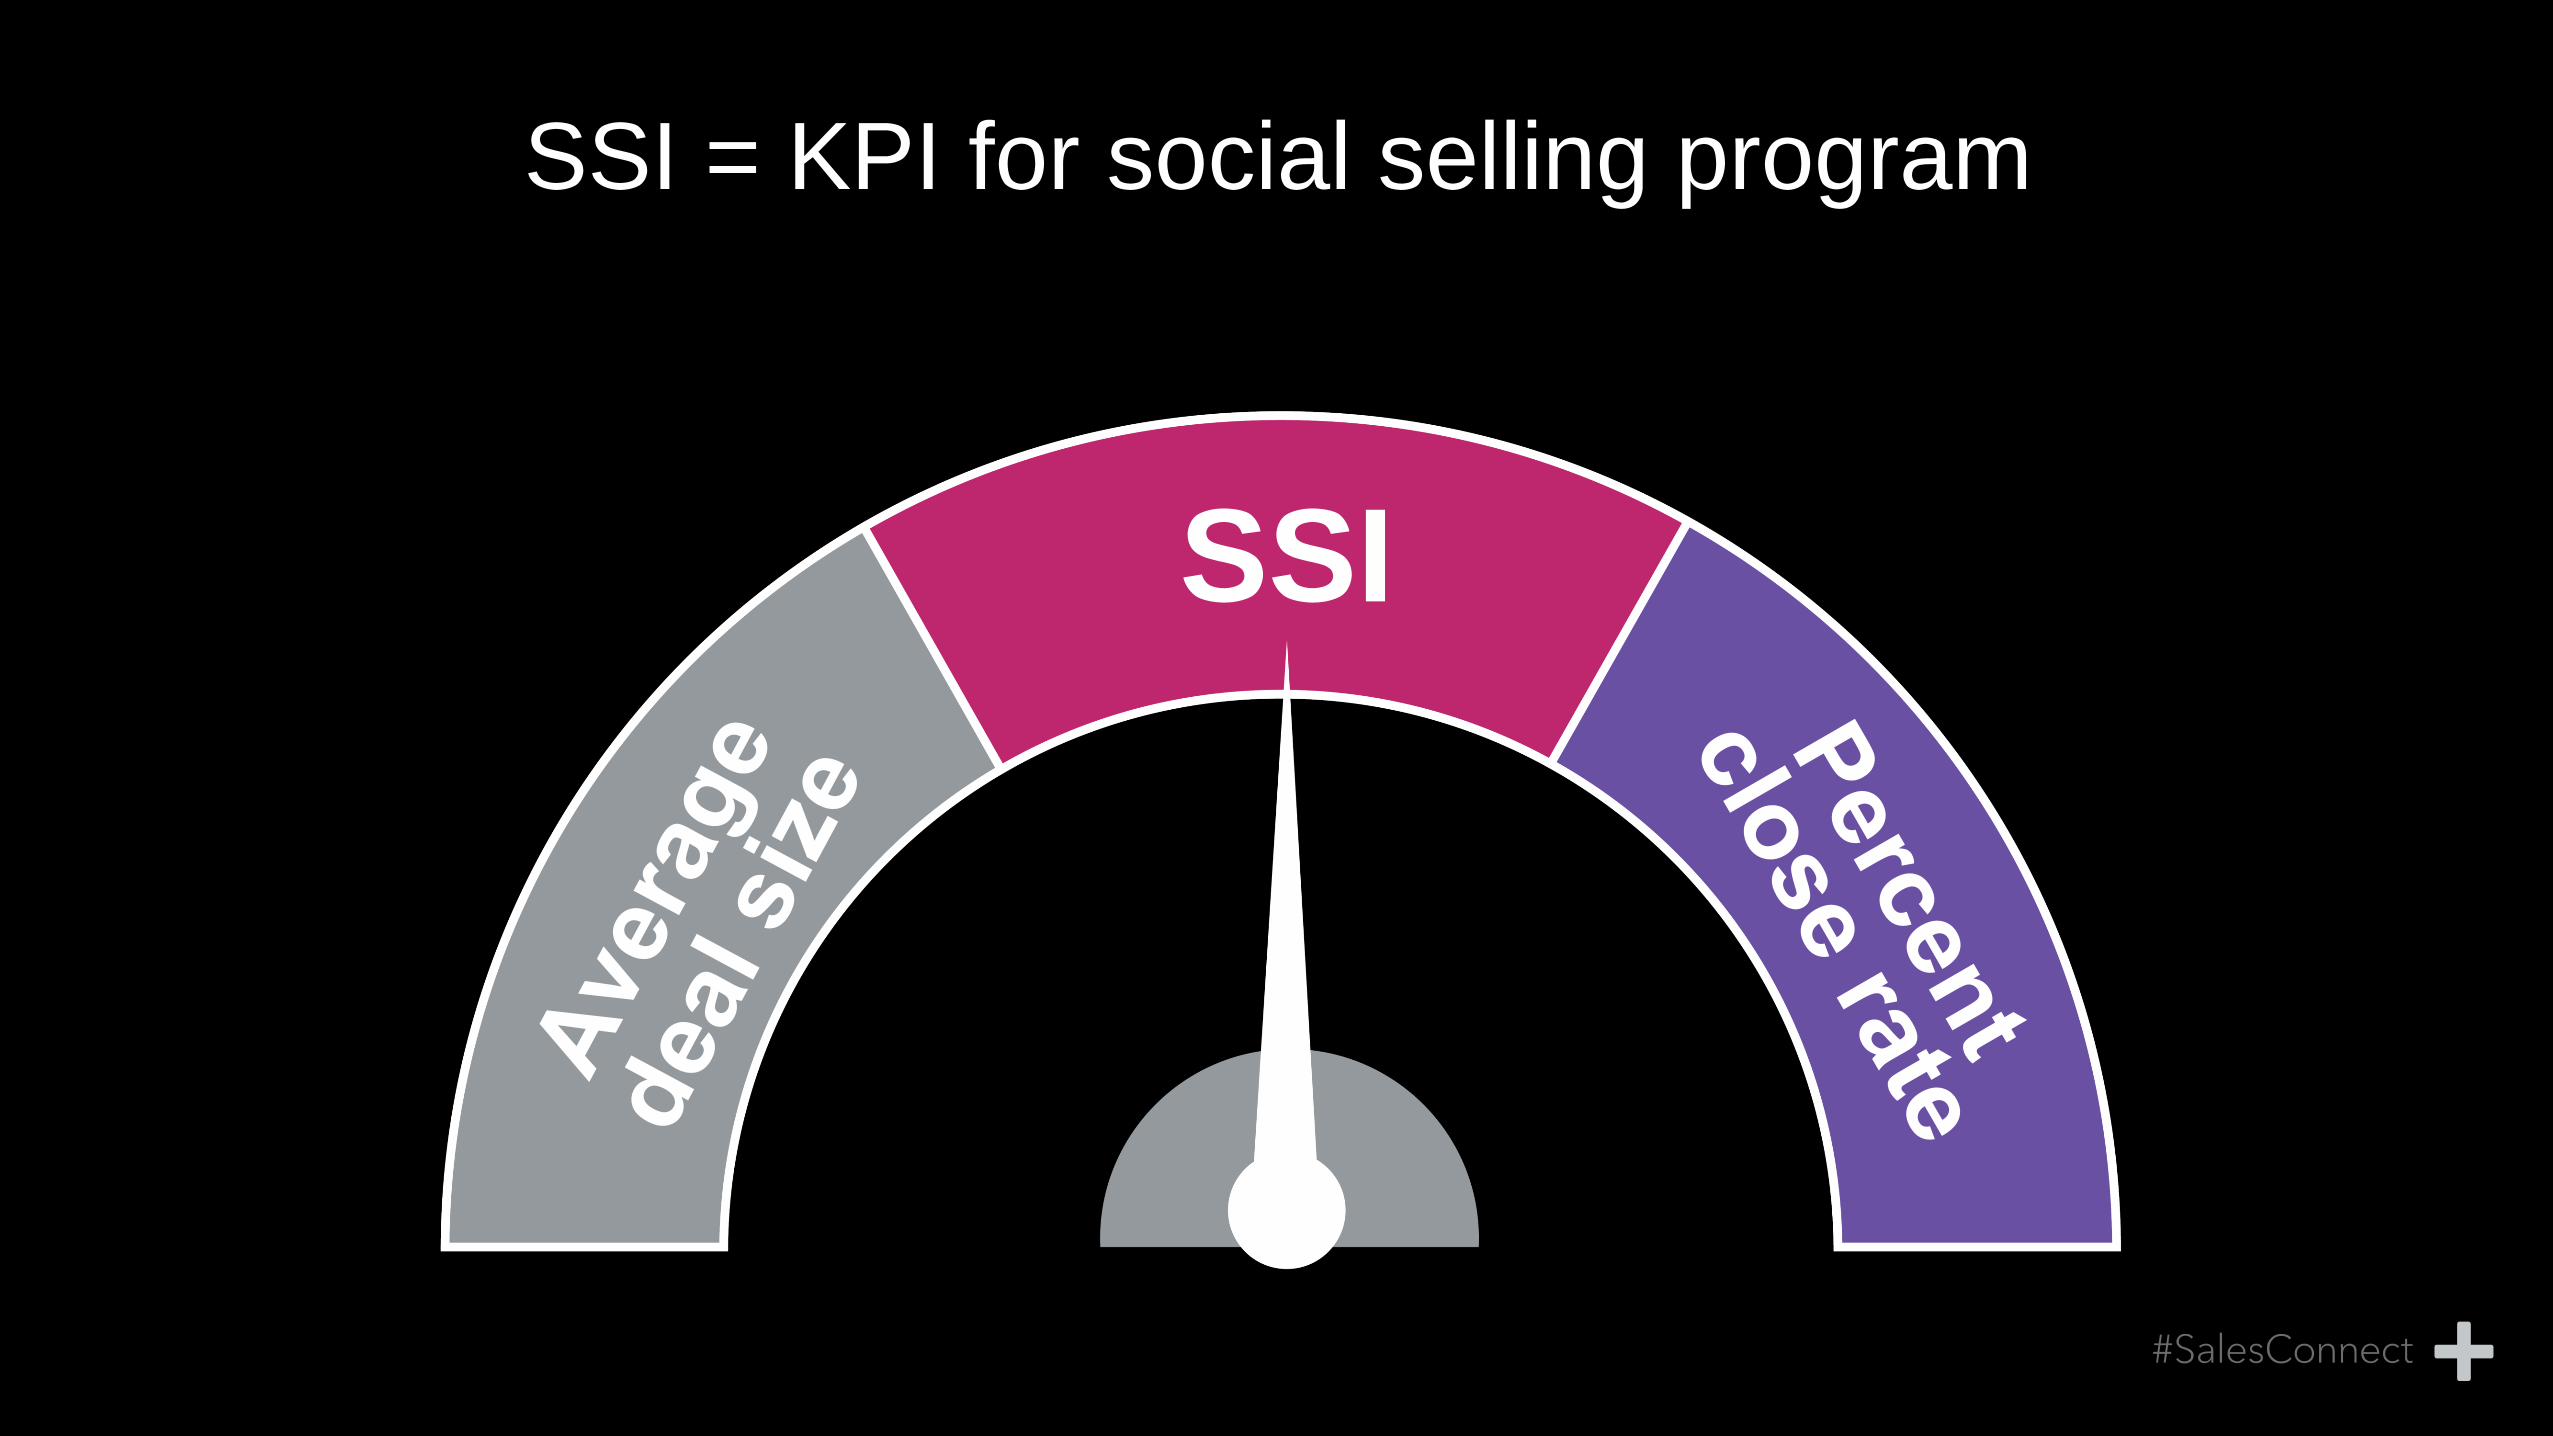
SSI = KPI for social selling program
SSI
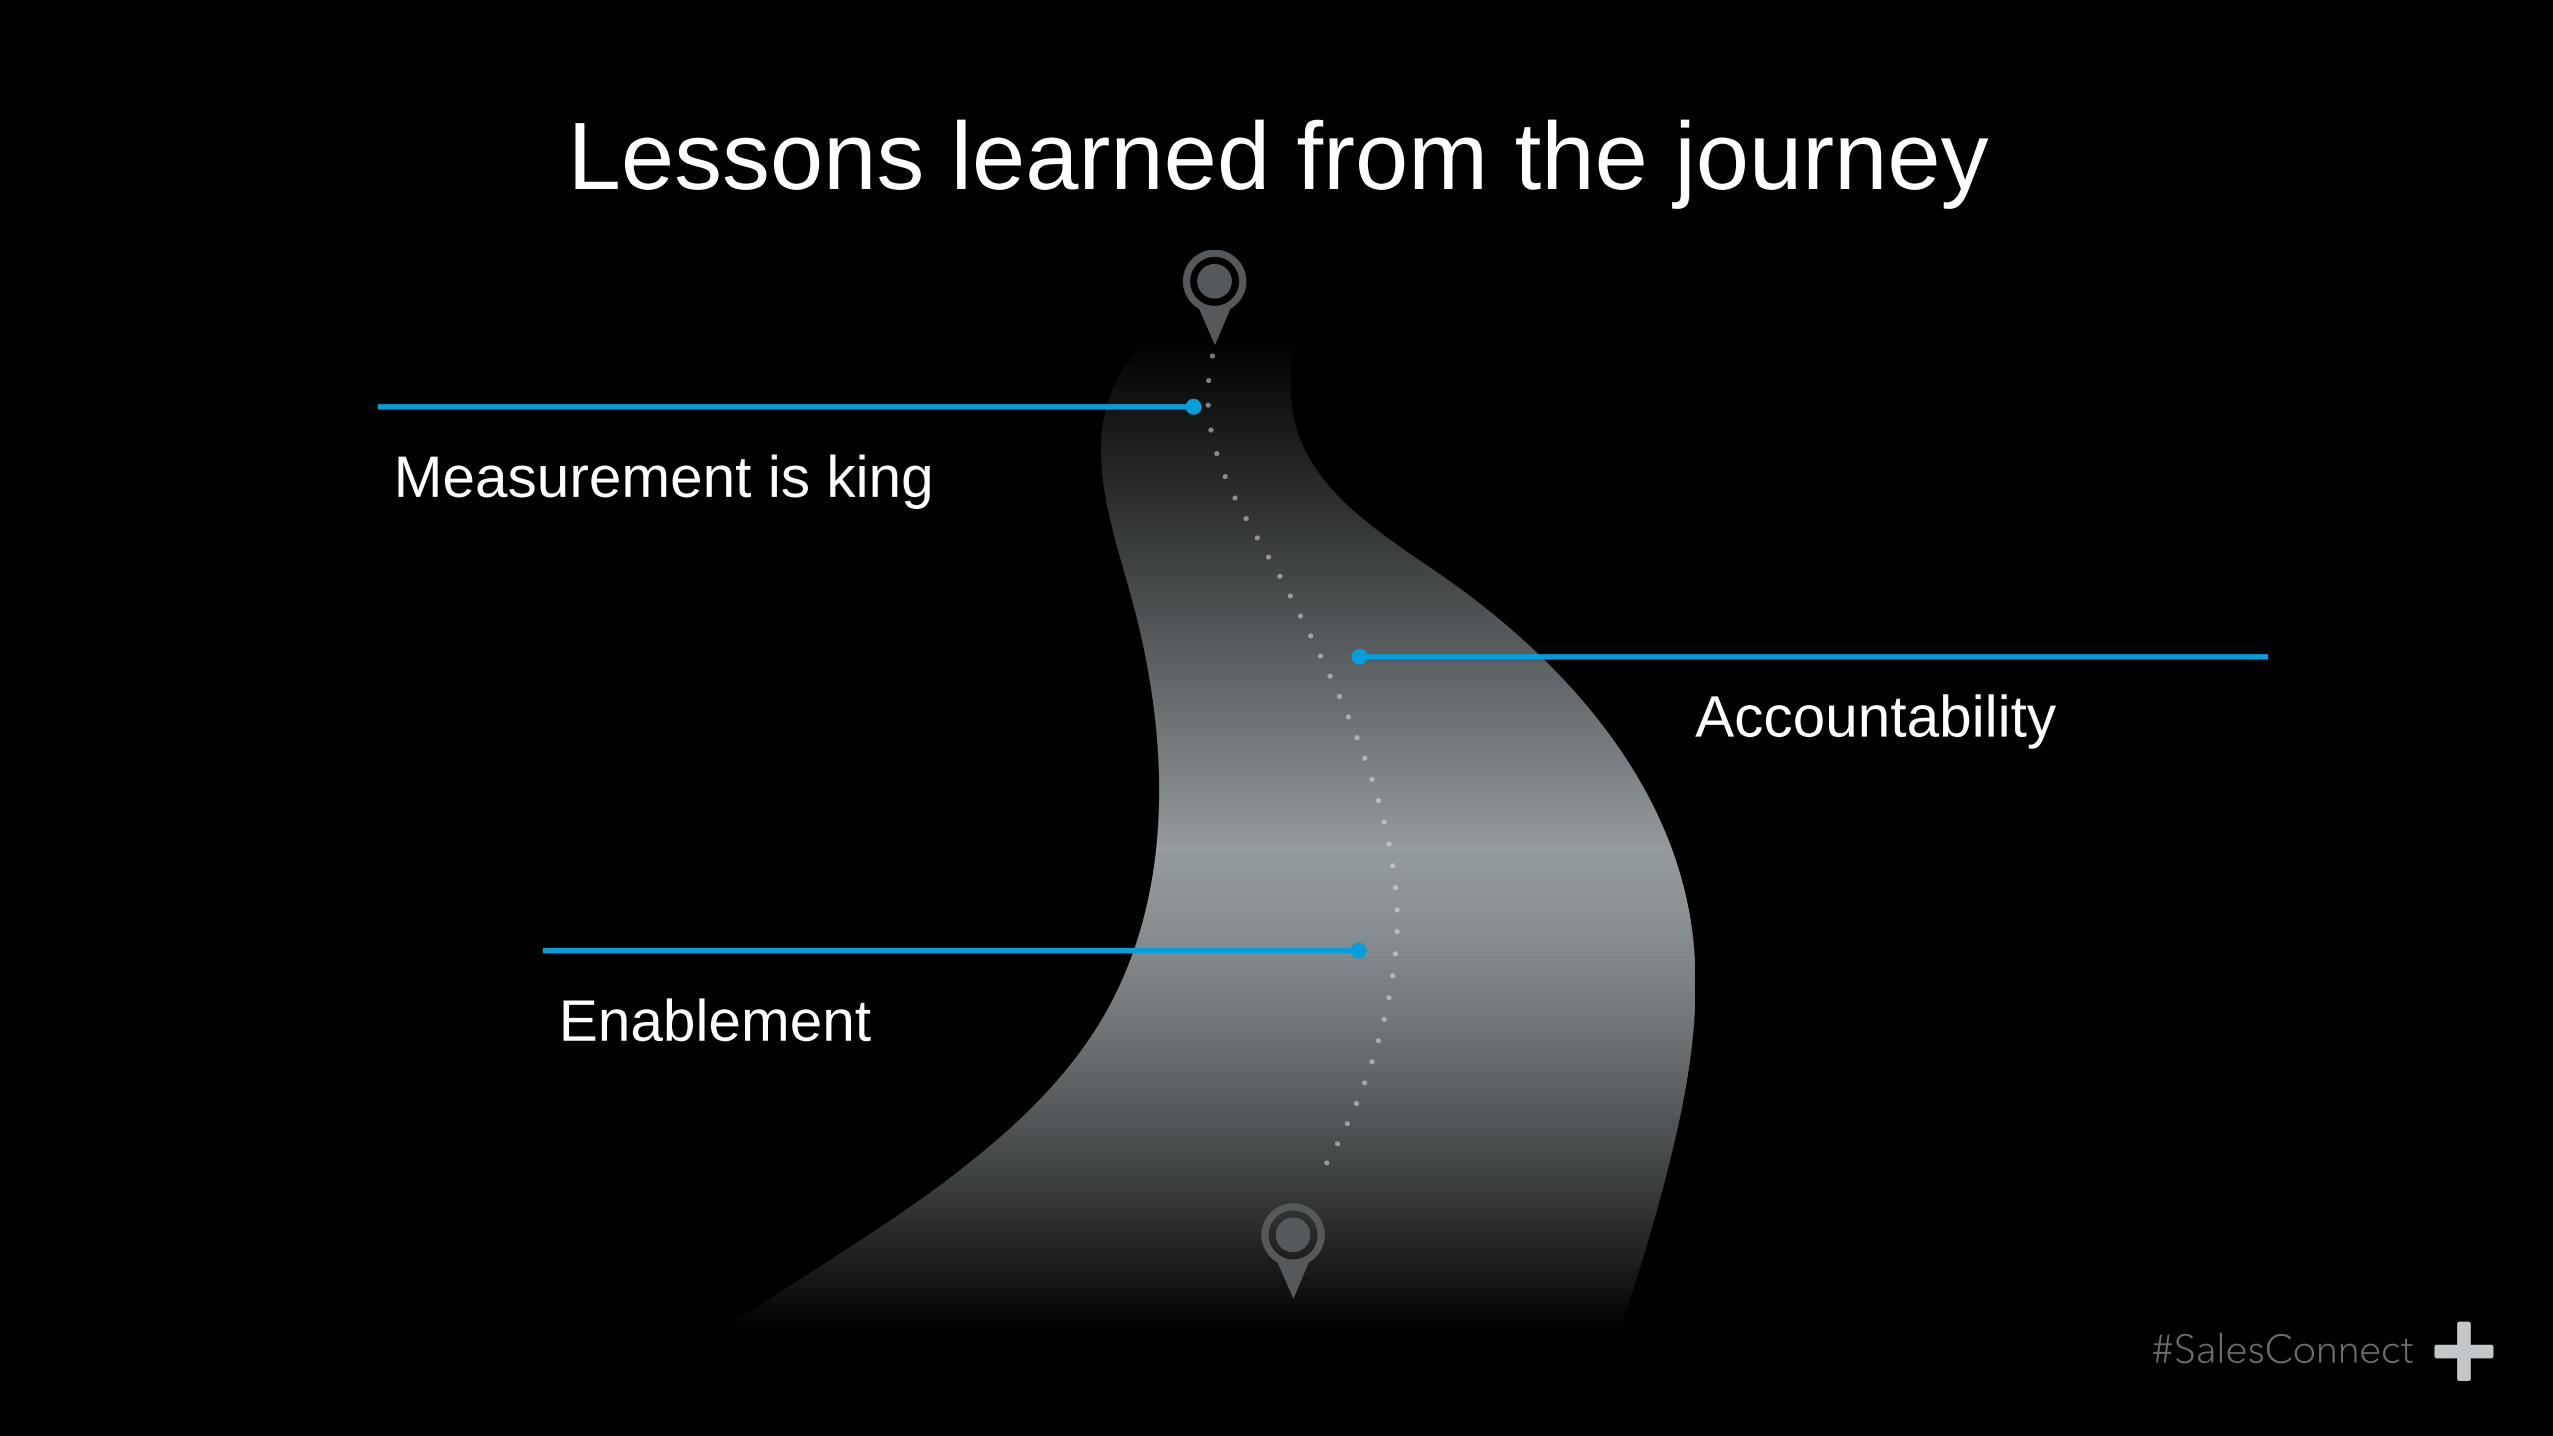
Lessons learned from the journey
Measurement is king
Accountability
Enablement

You can’t change what you don’t measure
SSI matters and accountability is key
Celebrate success
©2015 LinkedIn Corporation. All Rights Reserved.