the role of recruitment in structuring patterns of small-scale spatial variability in intertidal and...
TRANSCRIPT
www.elsevier.com/locate/jembe
Journal of Experimental Marine Biology and Ecology
291 (2003) 131–145
The role of recruitment in structuring patterns
of small-scale spatial variability in intertidal
and subtidal algal turfs
M.A. Coleman*
Centre for Research on Ecological Impacts of Coastal Cities, Marine Ecology Laboratories (A11),
University of Sydney, Science Road, NSW 2006, Australia
Received 6 September 2001; received in revised form 2 February 2003; accepted 26 February 2003
Abstract
Recruitment is often important in structuring patterns of distribution and abundance of algal
assemblages. Intertidal and subtidal turfing algal assemblages consistently vary on small spatial
scales (tens of centimetres), and this variability may be due to patterns of recruitment varying on
similar spatial scales. The validity of this model was evaluated by testing the hypothesis that the
numbers and types of taxa recruiting to turfs would vary at small spatial scales within intertidal and
within subtidal habitats. Abundances of algal recruits were estimated on sandstone plates that were
placed at a number of spatial scales within intertidal and within subtidal habitats (centimetres to tens
of metres). Significant differences in entire assemblages were found only between habitats. This was
explained by abundances of individual taxa, which generally varied between intertidal and subtidal
habitats or between sites within habitats. Only small proportions of the overall spatial variation
(dissimilarity) could be explained at the scale of replicate recruitment plates that were centimetres
apart. Results indicate that while recruitment may contribute to differences between intertidal and
subtidal habitats, it cannot explain the small-scale spatial variability in established turfing algal
assemblages within these habitats. There was some evidence to suggest that recruitment may
contribute to variability in established turfing algal assemblages but only over longer time scales than
examined here.
D 2003 Elsevier Science B.V. All rights reserved.
Keywords: Recruitment; Algal assemblages; Variability; Scale; Turf
0022-0981/03/$ - see front matter D 2003 Elsevier Science B.V. All rights reserved.
doi:10.1016/S0022-0981(03)00116-3
* Current address: School of Marine Sciences, University of Maine, 210 Deering Hall, Orono, ME 04469,
USA. Tel.: +1-207-581-2998; fax: +1-207-581-2969.
E-mail address: [email protected] (M.A. Coleman).
M.A. Coleman / J. Exp. Mar. Biol. Ecol. 291 (2003) 131–145132
1. Introduction
Recruitment has long been recognised as an important ecological process that has the
potential to structure patterns of distribution and abundances of many organisms (Under-
wood and Denley, 1984; Connell, 1985; Gaines and Roughgarden, 1985; Menge, 1991). It
is particularly important in determining the structure of marine algal assemblages and can
often explain the limited distribution exhibited by many species (Gunnill, 1980; Reed et
al., 1988; Vadas et al., 1990; Viejo et al., 1999).
Assemblages of algae can show great variation in patterns of distribution, abundance and
diversity on small spatial scales (e.g. Underwood and Chapman, 1998; Benedetti-Cecchi,
2000, tens of centimetres; Coleman, 2002a). This variation may be due to small-scale
differences in the types and numbers of species recruiting on similar spatial scales. Pre-
recruitment processes that have been shown to influence the distribution and abundance of
algae include the dispersal and availability of propagules (Deysher and Norton, 1982;
Hoffmann and Ugarte, 1985; Andrew and Veijo, 1998) and environmental conditions that
affect their deposition (Santelices, 1990). For example, algae cannot settle and grow in areas
where their propagules do not reach even if prevailing environmental conditionswould allow
them to (Underwood and Denley, 1984). In contrast, even if propagules are in abundance,
algae are unlikely to settle, grow and persist if environmental conditions are not favourable.
For example, Brawley and Johnson (1991) found survival of Pelvetia fastigiata embryos to
be dependent on conditions prevailing in the microhabitats in which they were placed.
Alternatively, the same numbers and types of species may initially recruit over small
spatial scales, but differences in post-recruitment processes acting at similar spatial scales
may subsequently lead to differences in assemblages on these scales (Santelices and Ojeda,
1984; Kendrick, 1994). Post-recruitment processes are important determinants of patterns of
distribution and abundance of many species of algae. They include processes such as grazing
(Underwood and Jernakoff, 1981; Jernakoff, 1983), competition (Fletcher, 1975; Breitburg,
1984; Benedetti-Cecchi and Cinelli, 1992) and a variety of physical disturbances (Hruby and
Norton, 1979; Norton, 1983; Kennelly, 1987a,b; Kendrick, 1991).
The greatest proportion of variation in assemblages of intertidal and subtidal turfing
algae around Sydney, Australia, can be explained at the scale of replicate quadrats, tens of
centimetres apart (Coleman, 2002a). One explanation for this variability is that it is a result
of differences in patterns of recruitment of algae on similar spatial scales. If this is so, then
one would expect there to be (a) differences in entire assemblages of recruits and (b)
differences in the types and numbers of species that comprise these assemblages, at small
spatial scales (tens of centimetres or less) within intertidal and subtidal habitats. Small-
scale variability in patterns of algal recruitment is evidence to suggest that pre-recruitment
processes (the combined effects of which are reflected in patterns of recruitment) are
important in structuring assemblages of turfing algae.
2. Materials and methods
This experiment was done from October 2000 to January 2001 on the intertidal
sandstone shores and subtidal reefs of Cape Banks Scientific Marine Research Area,

M.A. Coleman / J. Exp. Mar. Biol. Ecol. 291 (2003) 131–145 133
Botany Bay (see Coleman, 2002a for map showing location of Cape Banks). Sandstone
recruitment plates (6� 6 cm2) were attached to bars of wood with stainless steel bolts in
areas of low intertidal and shallow subtidal turfing algae. This was done in two randomly
chosen intertidal and two randomly chosen subtidal sites (approximately 60 m apart).
Intertidal and subtidal sites were not horizontally separated, i.e. they were randomly
positioned horizontally. For example, one intertidal site was on a point while one subtidal
site was in a bay. At each site, pairs of bars were placed in two randomly chosen patches of
(
a) O
ne m
onth
(
b) T
wo
mon
ths
(c
) T
hree
mon
ths
(i) Raw data (ii) Presence/absence data
Stress = 0.01 Stress = 0.00
Stress = 0.01Stress = 0.01
Stress = 0.00Stress = 0.01
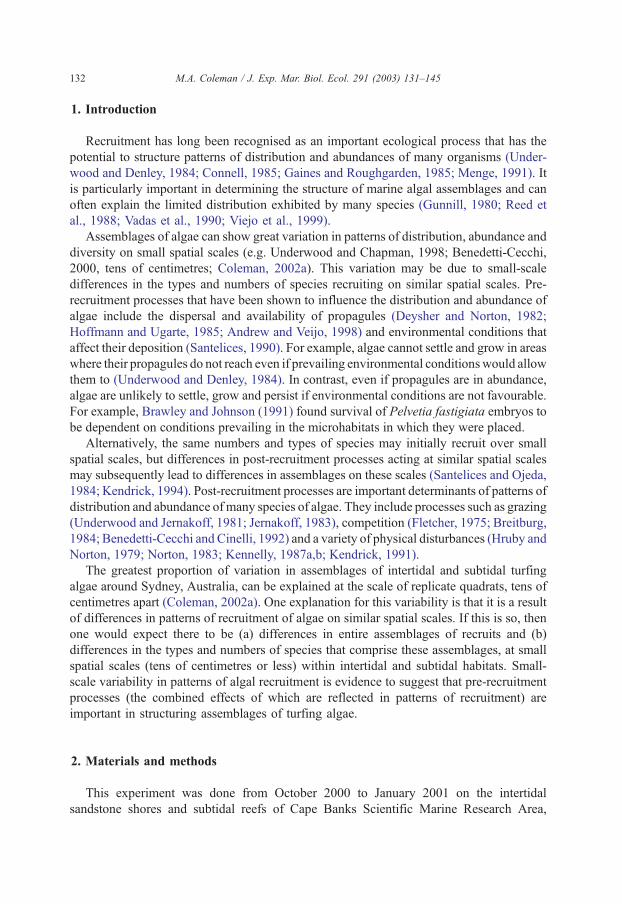
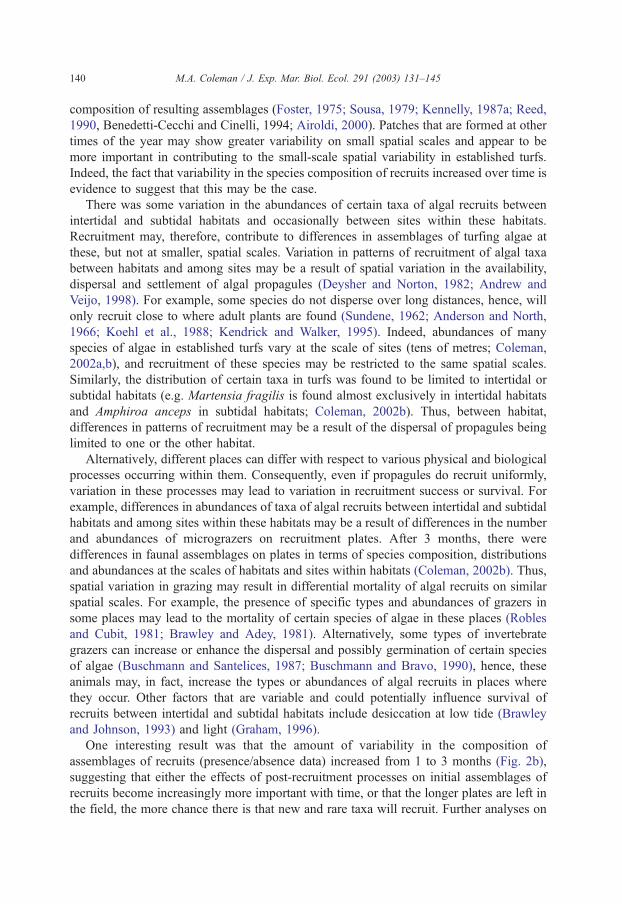
Fig. 1. nMDS plots showing relationships between assemblages of algae that recruited to intertidal (shaded) and
subtidal (clear) recruitment plates. Diamonds and squares represent randomly chosen sites within habitats. Plots
for raw (i) and presence/absence (ii) data at 1- (a), 2- (b) and 3-month (c) sampling times are shown. Points on the
plots are patch centroids. n= 2 patches per site and 4 replicate plates per patch.
M.A. Coleman / J. Exp. Mar. Biol. Ecol. 291 (2003) 131–145134
turf approximately 1 m apart to test hypotheses about differences at the scale of tens of
centimetres. Four replicate plates from each scale (patch, site and habitat) were collected
for sampling (without replacement) at each of three times (1, 2 and 3 months after being
placed in the field). These times were chosen because 1 month was the minimum amount
of time that plates had to be left out in the field for recruits to be identified to any
reasonable taxonomic resolution (Coleman, unpublished data), and 3 months was
considered to be the longest that plates could be left in the field before the effects of
post-recruitment processes became too great. Recruitment was defined as the time at which
individuals were observed to enter a defined population, i.e. when they are first sampled
(Keough and Downes, 1982).
At each of the times of sampling, plates were put in seawater and returned immediately
to the laboratory where they were refrigerated at 3 jC until examination. The number of
individual recruits (for coralline algae) or the percentage cover of individual species in five
randomly chosen fields of view (FOV; approximately 1.33 cm2) were counted and
identified to the lowest taxonomic level possible using a dissecting microscope. This
was done for ephiphytes, canopy and primary cover, but data were pooled so total
percentage covers can be greater than 100%. A 0.5-cm boundary around the edge and
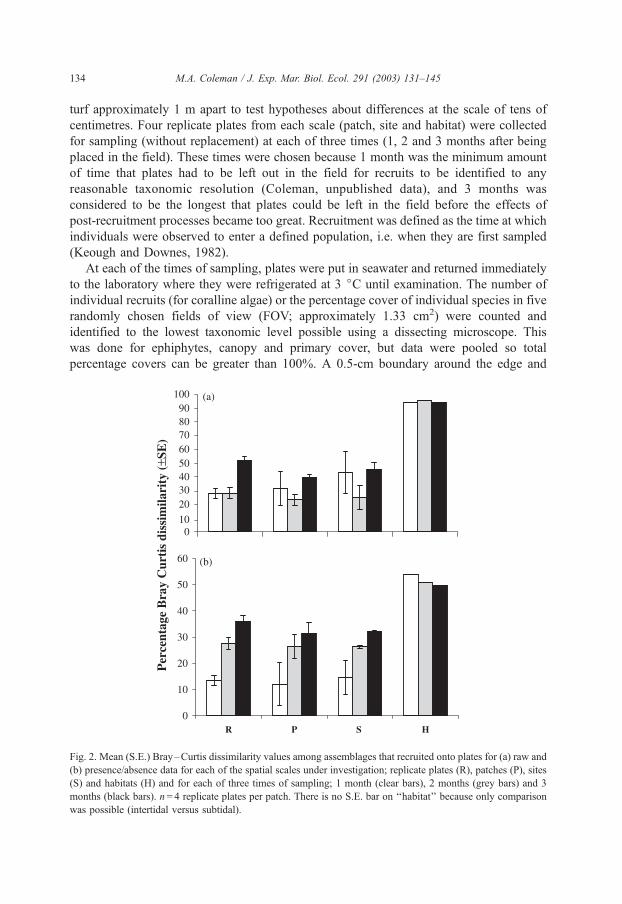
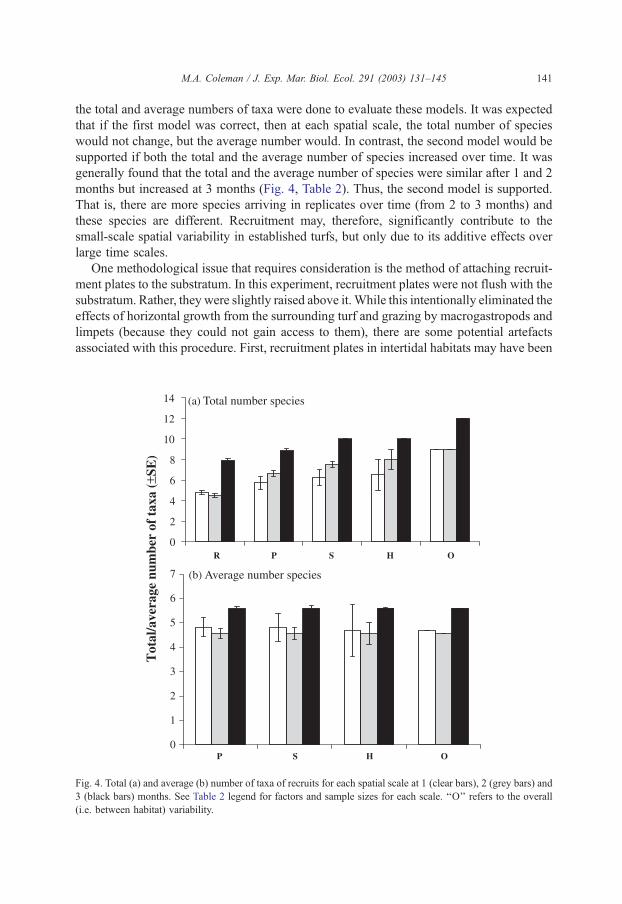
Fig. 2. Mean (S.E.) Bray–Curtis dissimilarity values among assemblages that recruited onto plates for (a) raw and
(b) presence/absence data for each of the spatial scales under investigation; replicate plates (R), patches (P), sites
(S) and habitats (H) and for each of three times of sampling; 1 month (clear bars), 2 months (grey bars) and 3
months (black bars). n= 4 replicate plates per patch. There is no S.E. bar on ‘‘habitat’’ because only comparison
was possible (intertidal versus subtidal).
M.A. Coleman / J. Exp. Mar. Biol. Ecol. 291 (2003) 131–145 135
centre of plates was not sampled to avoid possible edge effects of the sides of plates and
the presence of a screw in the centre, respectively.
3. Statistical analyses
Data were represented graphically using nonmetric multidimensional scaling plots
(nMDS) to illustrate relationships among assemblages of recruits at different spatial scales.
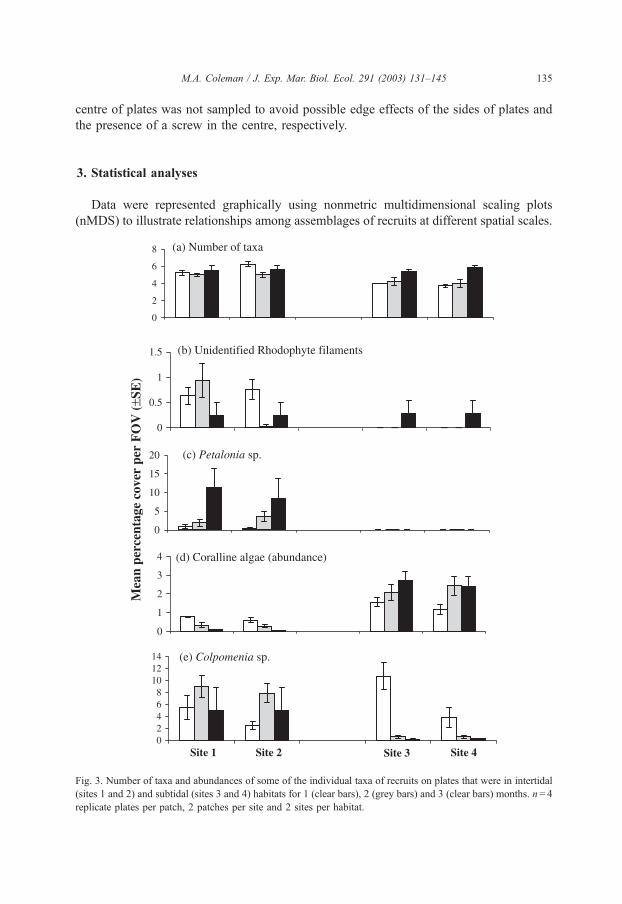
Fig. 3. Number of taxa and abundances of some of the individual taxa of recruits on plates that were in intertidal
(sites 1 and 2) and subtidal (sites 3 and 4) habitats for 1 (clear bars), 2 (grey bars) and 3 (clear bars) months. n= 4
replicate plates per patch, 2 patches per site and 2 sites per habitat.
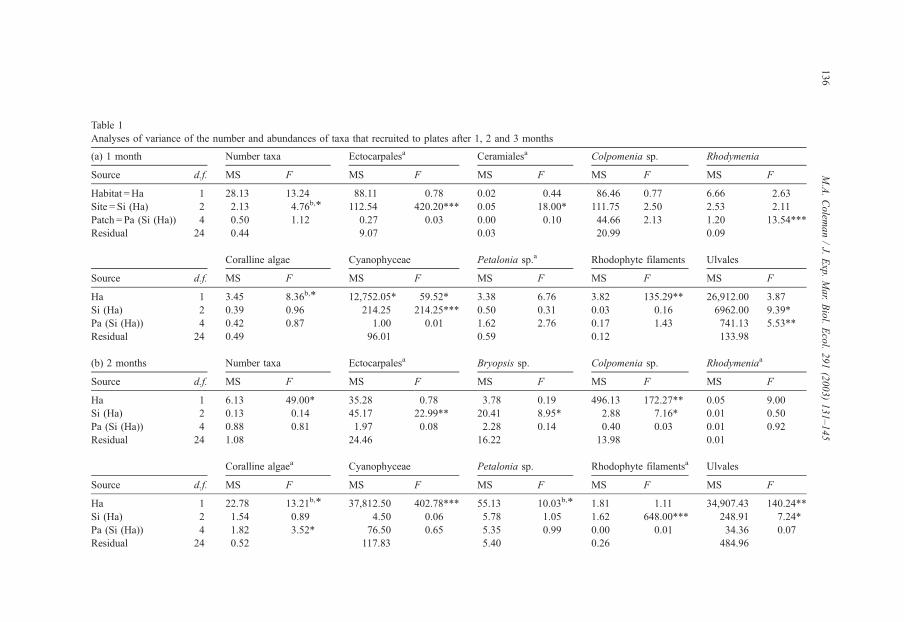
Table 1
Analyses of variance of the number and abundances of taxa that recruited to plates after 1, 2 and 3 months
(a) 1 month Number taxa Ectocarpalesa Ceramialesa Colpomenia sp. Rhodymenia
Source d.f. MS F MS F MS F MS F MS F
Habitat =Ha 1 28.13 13.24 88.11 0.78 0.02 0.44 86.46 0.77 6.66 2.63
Site = Si (Ha) 2 2.13 4.76b,* 112.54 420.20*** 0.05 18.00* 111.75 2.50 2.53 2.11
Patch = Pa (Si (Ha)) 4 0.50 1.12 0.27 0.03 0.00 0.10 44.66 2.13 1.20 13.54***
Residual 24 0.44 9.07 0.03 20.99 0.09
Coralline algae Cyanophyceae Petalonia sp.a Rhodophyte filaments Ulvales
Source d.f. MS F MS F MS F MS F MS F
Ha 1 3.45 8.36b,* 12,752.05* 59.52* 3.38 6.76 3.82 135.29** 26,912.00 3.87
Si (Ha) 2 0.39 0.96 214.25 214.25*** 0.50 0.31 0.03 0.16 6962.00 9.39*
Pa (Si (Ha)) 4 0.42 0.87 1.00 0.01 1.62 2.76 0.17 1.43 741.13 5.53**
Residual 24 0.49 96.01 0.59 0.12 133.98
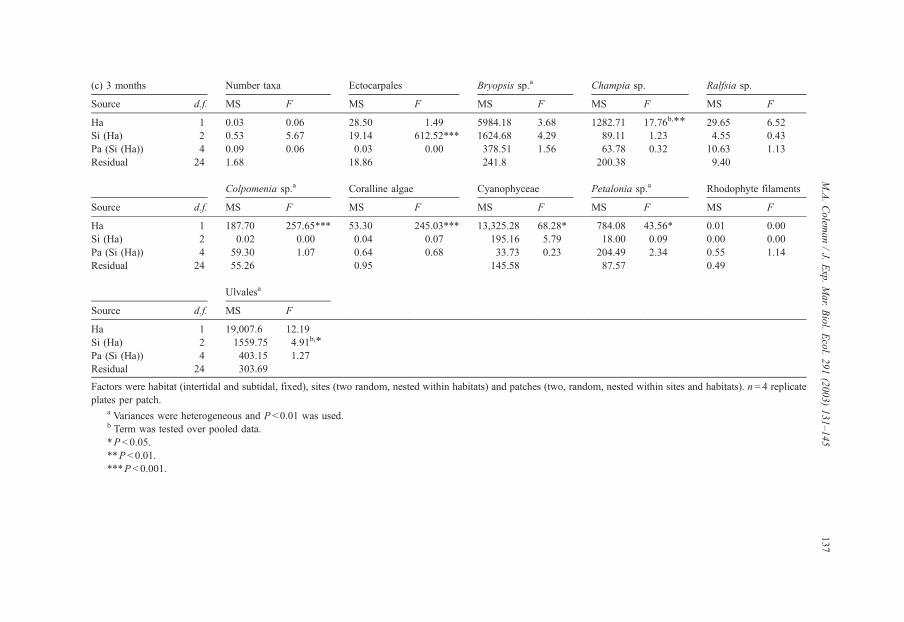
(b) 2 months Number taxa Ectocarpalesa Bryopsis sp. Colpomenia sp. Rhodymeniaa
Source d.f. MS F MS F MS F MS F MS F
Ha 1 6.13 49.00* 35.28 0.78 3.78 0.19 496.13 172.27** 0.05 9.00
Si (Ha) 2 0.13 0.14 45.17 22.99** 20.41 8.95* 2.88 7.16* 0.01 0.50
Pa (Si (Ha)) 4 0.88 0.81 1.97 0.08 2.28 0.14 0.40 0.03 0.01 0.92
Residual 24 1.08 24.46 16.22 13.98 0.01
Coralline algaea Cyanophyceae Petalonia sp. Rhodophyte filamentsa Ulvales
Source d.f. MS F MS F MS F MS F MS F
Ha 1 22.78 13.21b,* 37,812.50 402.78*** 55.13 10.03b,* 1.81 1.11 34,907.43 140.24**
Si (Ha) 2 1.54 0.89 4.50 0.06 5.78 1.05 1.62 648.00*** 248.91 7.24*
Pa (Si (Ha)) 4 1.82 3.52* 76.50 0.65 5.35 0.99 0.00 0.01 34.36 0.07
Residual 24 0.52 117.83 5.40 0.26 484.96
M.A.Colem
an/J.
Exp.Mar.Biol.Ecol.291(2003)131–145
136
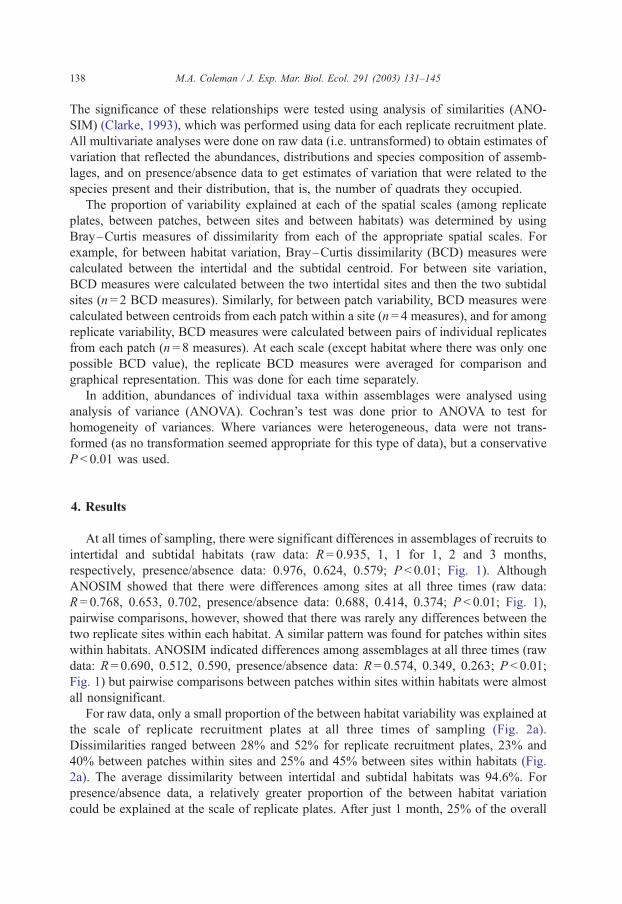
(c) 3 months Number taxa Ectocarpales Bryopsis sp.a Champia sp. Ralfsia sp.
Source d.f. MS F MS F MS F MS F MS F
Ha 1 0.03 0.06 28.50 1.49 5984.18 3.68 1282.71 17.76b,** 29.65 6.52
Si (Ha) 2 0.53 5.67 19.14 612.52*** 1624.68 4.29 89.11 1.23 4.55 0.43
Pa (Si (Ha)) 4 0.09 0.06 0.03 0.00 378.51 1.56 63.78 0.32 10.63 1.13
Residual 24 1.68 18.86 241.8 200.38 9.40
Colpomenia sp.a Coralline algae Cyanophyceae Petalonia sp.a Rhodophyte filaments
Source d.f. MS F MS F MS F MS F MS F
Ha 1 187.70 257.65*** 53.30 245.03*** 13,325.28 68.28* 784.08 43.56* 0.01 0.00
Si (Ha) 2 0.02 0.00 0.04 0.07 195.16 5.79 18.00 0.09 0.00 0.00
Pa (Si (Ha)) 4 59.30 1.07 0.64 0.68 33.73 0.23 204.49 2.34 0.55 1.14
Residual 24 55.26 0.95 145.58 87.57 0.49
Ulvalesa
Source d.f. MS F
Ha 1 19,007.6 12.19
Si (Ha) 2 1559.75 4.91b,*
Pa (Si (Ha)) 4 403.15 1.27
Residual 24 303.69
Factors were habitat (intertidal and subtidal, fixed), sites (two random, nested within habitats) and patches (two, random, nested within sites and habitats). n= 4 replicate
plates per patch.a Variances were heterogeneous and P< 0.01 was used.b Term was tested over pooled data.
*P< 0.05.
**P< 0.01.
***P < 0.001.
M.A.Colem
an/J.
Exp.Mar.Biol.Ecol.291(2003)131–145
137
M.A. Coleman / J. Exp. Mar. Biol. Ecol. 291 (2003) 131–145138
The significance of these relationships were tested using analysis of similarities (ANO-
SIM) (Clarke, 1993), which was performed using data for each replicate recruitment plate.
All multivariate analyses were done on raw data (i.e. untransformed) to obtain estimates of
variation that reflected the abundances, distributions and species composition of assemb-
lages, and on presence/absence data to get estimates of variation that were related to the
species present and their distribution, that is, the number of quadrats they occupied.
The proportion of variability explained at each of the spatial scales (among replicate
plates, between patches, between sites and between habitats) was determined by using
Bray–Curtis measures of dissimilarity from each of the appropriate spatial scales. For
example, for between habitat variation, Bray–Curtis dissimilarity (BCD) measures were
calculated between the intertidal and the subtidal centroid. For between site variation,
BCD measures were calculated between the two intertidal sites and then the two subtidal
sites (n = 2 BCD measures). Similarly, for between patch variability, BCD measures were
calculated between centroids from each patch within a site (n = 4 measures), and for among
replicate variability, BCD measures were calculated between pairs of individual replicates
from each patch (n = 8 measures). At each scale (except habitat where there was only one
possible BCD value), the replicate BCD measures were averaged for comparison and
graphical representation. This was done for each time separately.
In addition, abundances of individual taxa within assemblages were analysed using
analysis of variance (ANOVA). Cochran’s test was done prior to ANOVA to test for
homogeneity of variances. Where variances were heterogeneous, data were not trans-
formed (as no transformation seemed appropriate for this type of data), but a conservative
P < 0.01 was used.
4. Results
At all times of sampling, there were significant differences in assemblages of recruits to
intertidal and subtidal habitats (raw data: R = 0.935, 1, 1 for 1, 2 and 3 months,
respectively, presence/absence data: 0.976, 0.624, 0.579; P < 0.01; Fig. 1). Although
ANOSIM showed that there were differences among sites at all three times (raw data:
R = 0.768, 0.653, 0.702, presence/absence data: 0.688, 0.414, 0.374; P < 0.01; Fig. 1),
pairwise comparisons, however, showed that there was rarely any differences between the
two replicate sites within each habitat. A similar pattern was found for patches within sites
within habitats. ANOSIM indicated differences among assemblages at all three times (raw
data: R = 0.690, 0.512, 0.590, presence/absence data: R = 0.574, 0.349, 0.263; P < 0.01;
Fig. 1) but pairwise comparisons between patches within sites within habitats were almost
all nonsignificant.
For raw data, only a small proportion of the between habitat variability was explained at
the scale of replicate recruitment plates at all three times of sampling (Fig. 2a).
Dissimilarities ranged between 28% and 52% for replicate recruitment plates, 23% and
40% between patches within sites and 25% and 45% between sites within habitats (Fig.
2a). The average dissimilarity between intertidal and subtidal habitats was 94.6%. For
presence/absence data, a relatively greater proportion of the between habitat variation
could be explained at the scale of replicate plates. After just 1 month, 25% of the overall
M.A. Coleman / J. Exp. Mar. Biol. Ecol. 291 (2003) 131–145 139
dissimilarity (H) was explained at the scale of replicates (R) (Fig. 2b). This increased to
54% after 2 months and 73% after 3 months indicating that variation at the scale
centimetres becomes increasingly more important with time (Fig. 2b). Measures of
dissimilarity between intertidal and subtidal habitats averaged 52%. This was substantially
lower than for raw data suggesting that abundances of taxa of recruits in assemblages are a
major contributor to variability between intertidal and subtidal habitats.
The number of taxa varied between intertidal sites after 1 month was greater in
intertidal than in subtidal habitats after 2 months and not different at any scale after 3
months (Fig. 3, Table 1). Patterns of recruitment of individual taxa to intertidal and
subtidal habitats were complicated with different patterns emerging at different times.
Some species showed differences between intertidal and subtidal habitats at some times
(Champia sp., Colpomenia sp., Petalonia sp., Rhodophyte filaments and Ulvales; Fig. 3,
Table 1) or all times (coralline algae and Cyanophyceae; Fig. 3). Abundances of other taxa
were variable at the scales of sites within habitats at some (Bryposis sp., Ceramiales,
Colpomenia sp., Rhodophyte filaments and Cyanophyceae) or all (Ulvales and Ectocar-
pales) times (Table 1). Only three taxa (Porphyra sp., coralline algae and Ulvales) showed
differences in abundances at the scale of patches within one intertidal site (Table 1), and
this only occurred at one time. Almost all taxa showed no spatial variability in abundances
at least one time of sampling.
5. Discussion
Patterns of variability in assemblages of algal recruits did not reflect the great spatial
variability exhibited by established turfing algal assemblages. There were differences in
the number and abundances of taxa of algal recruits between intertidal and subtidal
habitats and sometimes between sites within habitats. This was reflected in patterns of
spatial variability with only a small proportion of the overall variability being explained at
the smallest scale of the experiment replicate recruitment plates separated by centimetres.
Thus, the hypothesis that recruitment can explain the great small-scale spatial variability in
turfing algal assemblages was rejected. Although spatial variation in recruitment may be a
factor contributing to the small-scale spatial variability exhibited by established turfing
algal assemblages, it cannot fully explain it.
The lack of variability in algal recruitment at small spatial scales may be due to a
number of factors. First, it may be due to uniform dispersal of propagules at the spatial
scales examined here. The prevailing currents at Cape Banks may be such that propagules
are distributed evenly along the shore. Indeed, the water within Cape Banks often appears
to form an eddy that is isolated from the tidal flows of Botany Bay (personal observation).
Alternatively, these patterns may be a function of the time of year that the experiment was
done (October to December; austral spring). Not all species of algae recruit at this time,
and it is possible that those that do have wide ranges of dispersal (e.g. Enteromorpha;
Amsler and Searles, 1980) resulting in uniform patterns of recruitment at the spatial scales
were examined here. If this were so, then repeating the experiment at other times of the
year would reveal additional species whose patterns of recruitment vary on small spatial
scales. This has implications for the timing of disturbances that create free space and the
M.A. Coleman / J. Exp. Mar. Biol. Ecol. 291 (2003) 131–145140
composition of resulting assemblages (Foster, 1975; Sousa, 1979; Kennelly, 1987a; Reed,
1990, Benedetti-Cecchi and Cinelli, 1994; Airoldi, 2000). Patches that are formed at other
times of the year may show greater variability on small spatial scales and appear to be
more important in contributing to the small-scale spatial variability in established turfs.
Indeed, the fact that variability in the species composition of recruits increased over time is
evidence to suggest that this may be the case.
There was some variation in the abundances of certain taxa of algal recruits between
intertidal and subtidal habitats and occasionally between sites within these habitats.
Recruitment may, therefore, contribute to differences in assemblages of turfing algae at
these, but not at smaller, spatial scales. Variation in patterns of recruitment of algal taxa
between habitats and among sites may be a result of spatial variation in the availability,
dispersal and settlement of algal propagules (Deysher and Norton, 1982; Andrew and
Veijo, 1998). For example, some species do not disperse over long distances, hence, will
only recruit close to where adult plants are found (Sundene, 1962; Anderson and North,
1966; Koehl et al., 1988; Kendrick and Walker, 1995). Indeed, abundances of many
species of algae in established turfs vary at the scale of sites (tens of metres; Coleman,
2002a,b), and recruitment of these species may be restricted to the same spatial scales.
Similarly, the distribution of certain taxa in turfs was found to be limited to intertidal or
subtidal habitats (e.g. Martensia fragilis is found almost exclusively in intertidal habitats
and Amphiroa anceps in subtidal habitats; Coleman, 2002b). Thus, between habitat,
differences in patterns of recruitment may be a result of the dispersal of propagules being
limited to one or the other habitat.
Alternatively, different places can differ with respect to various physical and biological
processes occurring within them. Consequently, even if propagules do recruit uniformly,
variation in these processes may lead to variation in recruitment success or survival. For
example, differences in abundances of taxa of algal recruits between intertidal and subtidal
habitats and among sites within these habitats may be a result of differences in the number
and abundances of micrograzers on recruitment plates. After 3 months, there were
differences in faunal assemblages on plates in terms of species composition, distributions
and abundances at the scales of habitats and sites within habitats (Coleman, 2002b). Thus,
spatial variation in grazing may result in differential mortality of algal recruits on similar
spatial scales. For example, the presence of specific types and abundances of grazers in
some places may lead to the mortality of certain species of algae in these places (Robles
and Cubit, 1981; Brawley and Adey, 1981). Alternatively, some types of invertebrate
grazers can increase or enhance the dispersal and possibly germination of certain species
of algae (Buschmann and Santelices, 1987; Buschmann and Bravo, 1990), hence, these
animals may, in fact, increase the types or abundances of algal recruits in places where
they occur. Other factors that are variable and could potentially influence survival of
recruits between intertidal and subtidal habitats include desiccation at low tide (Brawley
and Johnson, 1993) and light (Graham, 1996).
One interesting result was that the amount of variability in the composition of
assemblages of recruits (presence/absence data) increased from 1 to 3 months (Fig. 2b),
suggesting that either the effects of post-recruitment processes on initial assemblages of
recruits become increasingly more important with time, or that the longer plates are left in
the field, the more chance there is that new and rare taxa will recruit. Further analyses on
M.A. Coleman / J. Exp. Mar. Biol. Ecol. 291 (2003) 131–145 141
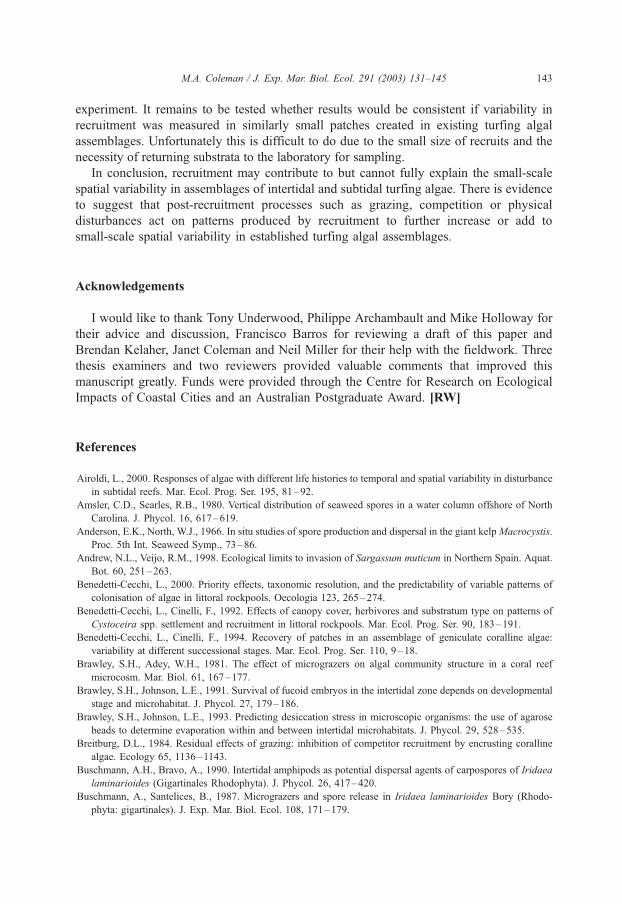
the total and average numbers of taxa were done to evaluate these models. It was expected
that if the first model was correct, then at each spatial scale, the total number of species
would not change, but the average number would. In contrast, the second model would be
supported if both the total and the average number of species increased over time. It was
generally found that the total and the average number of species were similar after 1 and 2
months but increased at 3 months (Fig. 4, Table 2). Thus, the second model is supported.
That is, there are more species arriving in replicates over time (from 2 to 3 months) and
these species are different. Recruitment may, therefore, significantly contribute to the
small-scale spatial variability in established turfs, but only due to its additive effects over
large time scales.
One methodological issue that requires consideration is the method of attaching recruit-
ment plates to the substratum. In this experiment, recruitment plates were not flush with the
substratum. Rather, they were slightly raised above it.While this intentionally eliminated the
effects of horizontal growth from the surrounding turf and grazing by macrogastropods and
limpets (because they could not gain access to them), there are some potential artefacts
associated with this procedure. First, recruitment plates in intertidal habitats may have been
Fig. 4. Total (a) and average (b) number of taxa of recruits for each spatial scale at 1 (clear bars), 2 (grey bars) and
3 (black bars) months. See Table 2 legend for factors and sample sizes for each scale. ‘‘O’’ refers to the overall
(i.e. between habitat) variability.
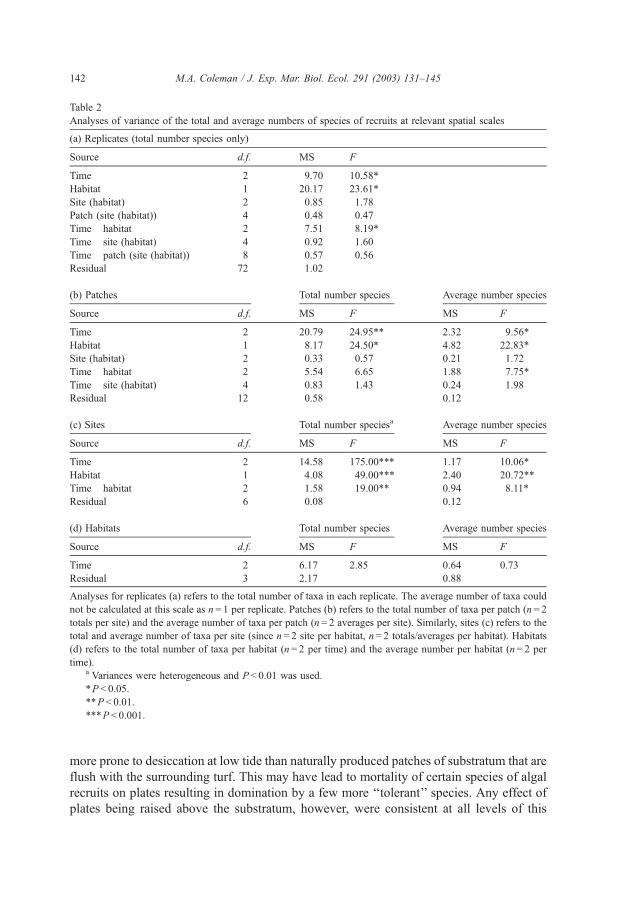
Table 2
Analyses of variance of the total and average numbers of species of recruits at relevant spatial scales
(a) Replicates (total number species only)
Source d.f. MS F
Time 2 9.70 10.58*
Habitat 1 20.17 23.61*
Site (habitat) 2 0.85 1.78
Patch (site (habitat)) 4 0.48 0.47
Time� habitat 2 7.51 8.19*
Time� site (habitat) 4 0.92 1.60
Time� patch (site (habitat)) 8 0.57 0.56
Residual 72 1.02
(b) Patches Total number species Average number species
Source d.f. MS F MS F
Time 2 20.79 24.95** 2.32 9.56*
Habitat 1 8.17 24.50* 4.82 22.83*
Site (habitat) 2 0.33 0.57 0.21 1.72
Time� habitat 2 5.54 6.65 1.88 7.75*
Time� site (habitat) 4 0.83 1.43 0.24 1.98
Residual 12 0.58 0.12
(c) Sites Total number speciesa Average number species
Source d.f. MS F MS F
Time 2 14.58 175.00*** 1.17 10.06*
Habitat 1 4.08 49.00*** 2.40 20.72**
Time� habitat 2 1.58 19.00** 0.94 8.11*
Residual 6 0.08 0.12
(d) Habitats Total number species Average number species
Source d.f. MS F MS F
Time 2 6.17 2.85 0.64 0.73
Residual 3 2.17 0.88
Analyses for replicates (a) refers to the total number of taxa in each replicate. The average number of taxa could
not be calculated at this scale as n= 1 per replicate. Patches (b) refers to the total number of taxa per patch (n= 2
totals per site) and the average number of taxa per patch (n= 2 averages per site). Similarly, sites (c) refers to the
total and average number of taxa per site (since n= 2 site per habitat, n= 2 totals/averages per habitat). Habitats
(d) refers to the total number of taxa per habitat (n= 2 per time) and the average number per habitat (n= 2 per
time).a Variances were heterogeneous and P < 0.01 was used.
*P < 0.05.
**P < 0.01.
***P < 0.001.
M.A. Coleman / J. Exp. Mar. Biol. Ecol. 291 (2003) 131–145142
more prone to desiccation at low tide than naturally produced patches of substratum that are
flush with the surrounding turf. This may have lead to mortality of certain species of algal
recruits on plates resulting in domination by a few more ‘‘tolerant’’ species. Any effect of
plates being raised above the substratum, however, were consistent at all levels of this
M.A. Coleman / J. Exp. Mar. Biol. Ecol. 291 (2003) 131–145 143
experiment. It remains to be tested whether results would be consistent if variability in
recruitment was measured in similarly small patches created in existing turfing algal
assemblages. Unfortunately this is difficult to do due to the small size of recruits and the
necessity of returning substrata to the laboratory for sampling.
In conclusion, recruitment may contribute to but cannot fully explain the small-scale
spatial variability in assemblages of intertidal and subtidal turfing algae. There is evidence
to suggest that post-recruitment processes such as grazing, competition or physical
disturbances act on patterns produced by recruitment to further increase or add to
small-scale spatial variability in established turfing algal assemblages.
Acknowledgements
I would like to thank Tony Underwood, Philippe Archambault and Mike Holloway for
their advice and discussion, Francisco Barros for reviewing a draft of this paper and
Brendan Kelaher, Janet Coleman and Neil Miller for their help with the fieldwork. Three
thesis examiners and two reviewers provided valuable comments that improved this
manuscript greatly. Funds were provided through the Centre for Research on Ecological
Impacts of Coastal Cities and an Australian Postgraduate Award. [RW]
References
Airoldi, L., 2000. Responses of algae with different life histories to temporal and spatial variability in disturbance
in subtidal reefs. Mar. Ecol. Prog. Ser. 195, 81–92.
Amsler, C.D., Searles, R.B., 1980. Vertical distribution of seaweed spores in a water column offshore of North
Carolina. J. Phycol. 16, 617–619.
Anderson, E.K., North, W.J., 1966. In situ studies of spore production and dispersal in the giant kelpMacrocystis.
Proc. 5th Int. Seaweed Symp., 73–86.
Andrew, N.L., Veijo, R.M., 1998. Ecological limits to invasion of Sargassum muticum in Northern Spain. Aquat.
Bot. 60, 251–263.
Benedetti-Cecchi, L., 2000. Priority effects, taxonomic resolution, and the predictability of variable patterns of
colonisation of algae in littoral rockpools. Oecologia 123, 265–274.
Benedetti-Cecchi, L., Cinelli, F., 1992. Effects of canopy cover, herbivores and substratum type on patterns of
Cystoceira spp. settlement and recruitment in littoral rockpools. Mar. Ecol. Prog. Ser. 90, 183–191.
Benedetti-Cecchi, L., Cinelli, F., 1994. Recovery of patches in an assemblage of geniculate coralline algae:
variability at different successional stages. Mar. Ecol. Prog. Ser. 110, 9–18.
Brawley, S.H., Adey, W.H., 1981. The effect of micrograzers on algal community structure in a coral reef
microcosm. Mar. Biol. 61, 167–177.
Brawley, S.H., Johnson, L.E., 1991. Survival of fucoid embryos in the intertidal zone depends on developmental
stage and microhabitat. J. Phycol. 27, 179–186.
Brawley, S.H., Johnson, L.E., 1993. Predicting desiccation stress in microscopic organisms: the use of agarose
beads to determine evaporation within and between intertidal microhabitats. J. Phycol. 29, 528–535.
Breitburg, D.L., 1984. Residual effects of grazing: inhibition of competitor recruitment by encrusting coralline
algae. Ecology 65, 1136–1143.
Buschmann, A.H., Bravo, A., 1990. Intertidal amphipods as potential dispersal agents of carpospores of Iridaea
laminarioides (Gigartinales Rhodophyta). J. Phycol. 26, 417–420.
Buschmann, A., Santelices, B., 1987. Micrograzers and spore release in Iridaea laminarioides Bory (Rhodo-
phyta: gigartinales). J. Exp. Mar. Biol. Ecol. 108, 171–179.
M.A. Coleman / J. Exp. Mar. Biol. Ecol. 291 (2003) 131–145144
Clarke, K.R., 1993. Non-parametric multivariate analyses of change in community structure. Aust. J. Ecol. 18,
117–143.
Coleman, M.A., 2002a. Small-scale spatial variability in intertidal and subtidal turfing algal assemblages and the
temporal generality of these patterns. J. Exp. Mar. Biol. Ecol. 267, 53–74.
Coleman, M.A., 2002b. The ecology of intertidal and subtidal turfing algal assemblages. PhD thesis, University
of Sydney.
Connell, J.H., 1985. The consequence of variation in initial settlement vs. post-settlement mortality in rocky
intertidal communities. J. Exp. Mar. Biol. Ecol. 93, 11–45.
Deysher, L., Norton, T.A., 1982. Dispersal and colonisation in Sargassum muticum (Yendo) Fensholt. J. Exp.
Mar. Biol. Ecol. 56, 179–195.
Fletcher, R.L., 1975. Heteroantagonism observed in mixed algal cultures. Nature 253, 534–535.
Foster, M.S., 1975. Algal succession in a Macrosystis pyrifera forest. Mar. Biol. 32, 313–329.
Gaines, S., Roughgarden, J., 1985. Larval settlement rate: a leading determinant of structure in an ecological
community of the marine intertidal zone. Proc. Natl. Acad. Sci. U. S. A. 83, 4707–4711.
Graham, M.H., 1996. Effect of high irradiance on recruitment of the giant kelp Macrocystis (Phaeophyta) in
shallow water. J. Phycol. 32, 903–906.
Gunnill, F.C., 1980. Recruitment and standing stocks in populations of one green alga and five brown algae in the
intertidal zone near La Jolla, California during 1973–1977. Mar. Ecol. Prog. Ser. 3, 231–244.
Hoffmann, A.J., Ugarte, R., 1985. The arrival of propagules of marine macroalgae in the intertidal zone. J. Exp.
Mar. Biol. Ecol. 92, 83–95.
Hruby, T., Norton, T.A., 1979. Algal colonisation on rocky shores in the Firth of Clyde. J. Ecol. 67, 65–77.
Jernakoff, P., 1983. Factors affecting the recruitment of algae in a midshore region dominated by barnacles.
J. Exp. Mar. Biol. Ecol. 67, 17–32.
Kendrick, G.A., 1991. Recruitment of coralline crusts and filamentous turf algae in the Galapagous archipelago:
effect of simulated scour, erosion and accretion. J. Exp. Mar. Biol. Ecol. 147, 47–63.
Kendrick, G.A., 1994. Effects of propagule settlement density and adult canopy on survival of recruits of
Sargassum spp. (Sargassaceae: Phaeophyta). Mar. Ecol. Prog. Ser. 103, 129–140.
Kendrick, G.A., Walker, D.I., 1995. Dispersal of propagules of Sargassum spp. (Sargassaceae: Phaeophyta):
observations of local patterns of dispersal and consequences for recruitment and population structure. J. Exp.
Mar. Biol. Ecol. 192, 273–288.
Kennelly, S.J., 1987a. Physical disturbance in an Australian kelp community: I. Temporal effects. Mar. Ecol.
Prog. Ser. 40, 145–153.
Kennelly, S.J., 1987b. Physical disturbances in an Australian kelp community: II. Effects on understorey species
due to differences in kelp cover. Mar. Ecol. Prog. Ser. 40, 155–165.
Keough, M.J., Downes, B.J., 1982. Recruitment of marine invertebrates: the role of active larval choices and
early mortality. Oecologia 54, 348–352.
Koehl, M.A., Powell, T.M., Daniel, T.L., 1988. Turbulent transport of marine larvae near rocky shores. Am. Zool.
28 (4), 113A.
Menge, B.A., 1991. Relative importance of recruitment and other causes of variation in rocky intertidal com-
munity structure. J. Exp. Mar. Biol. Ecol. 146, 69–100.
Norton, T.A., 1983. The resistance to dislodgement of Sargassum muticum germlings under defined hydro-
dynamic conditions. J. Mar. Biol. Assoc. U.K. 63, 181–193.
Reed, D.C., 1990. The effects of variable settlement and early competition on patterns of kelp recruitment.
Ecology 72 (2), 776–787.
Reed, D.C., Laur, D.R., Ebeling, A.W., 1988. Variation in algal dispersal and recruitment: the importance of
episodic events. Ecol. Monogr. 58 (4), 321–335.
Robles, C.D., Cubit, J., 1981. Influence of biotic factors in an upper intertidal community: dipteran larvae grazing
on algae. Ecology 62 (6), 1536–1547.
Santelices, B., 1990. Patterns of reproduction, dispersal and recruitment in seaweeds. Oceanogr. Mar. Biol. Ann.
Rev. 28, 177–276.
Santelices, B., Ojeda, F.P., 1984. Effects of canopy removal on the understory algal community structure
of coastal forests of Macrocystis pyrifera from southern South America. Mar. Ecol. Prog. Ser. 14,
165–173.
M.A. Coleman / J. Exp. Mar. Biol. Ecol. 291 (2003) 131–145 145
Sousa, W.P., 1979. Disturbance in marine intertidal boulder fields: the nonequilibrium maintenance of species
diversity. Ecology 60 (6), 1225–1239.
Sundene, O., 1962. The implications of transplant and culture experiments on the growth and distribution of
Alaria. Nytt Mag. Bot. 9, 155–174.
Underwood, A.J., Denley, E.J., 1984. Paradigms, explanations and generalizations in models for the structure of
intertidal communities on rocky shores. In: Strong, D., Simberloff, D.G., Abele, L.G., Thistle, A.B. (Eds.),
Ecological Communities: Conceptual Issues and the Evidence. Princetown Univ. Press, Princetown, NJ, USA,
pp. 151–180.
Underwood, A.J., Jernakoff, P., 1981. Interactions between algae and grazing gastropods in the structure of a low
shore algal community. Oecologia 48, 221–233.
Underwood, A.J., Chapman, M.G., 1998. Variation in algal assemblages on wave-expossed rocky shores in New
South Wales. Mar. FW. Res. 49, 241–254.
Vadas, R.L., Wright, W.A., Miller, S.L., 1990. Recruitment of Ascophyllum nodosum: wave action as a source of
mortality. Mar. Ecol. Prog. Ser. 61, 263–272.
Viejo, R.M., Aberg, P., Cervin, G., Lindegarth, M., 1999. The interactive effects of adult canopy, germling
density and grazing on germling survival of the rockweed Ascophyllum nodosum. Mar. Ecol. Prog. Ser. 187,
113–120.