the role of economic modelling – a brief introduction francis ruiz nice international © nice 2014
TRANSCRIPT

The role of economic modelling – a brief introduction
Francis RuizNICE International
© NICE 2014
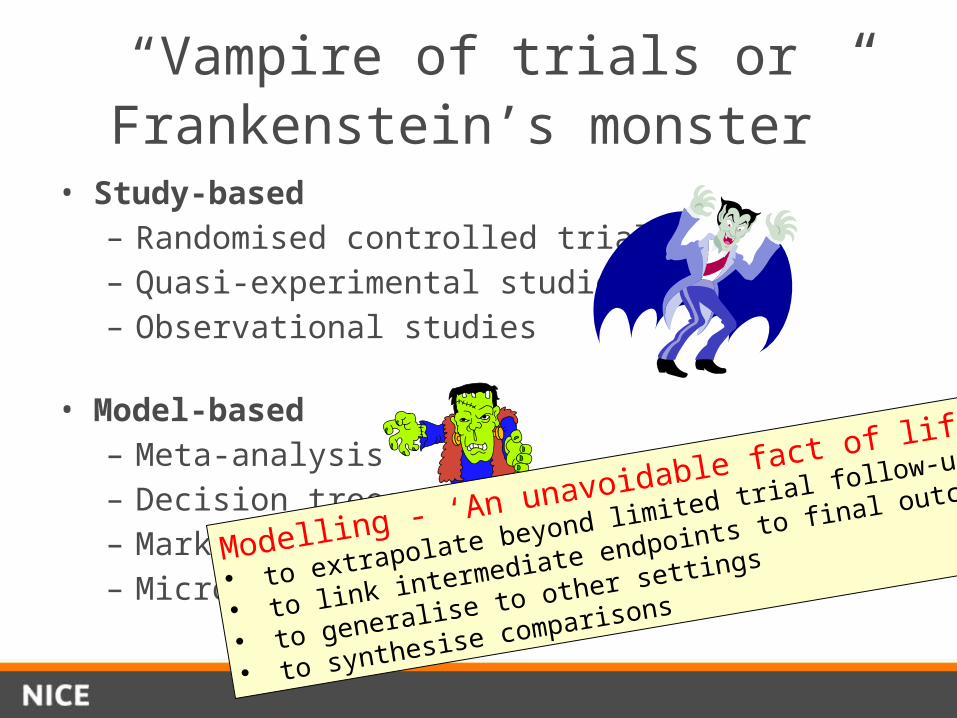
“Vampire of trials or Frankenstein’s monster”
• Study-based– Randomised controlled trials– Quasi-experimental studies– Observational studies
• Model-based– Meta-analysis– Decision trees– Markov models– Micro-simulation
Modelling - ‘An unavoidable fact of life’:
• to extrapolate beyond limited trial follow-up
• to link intermediate endpoints to final outcomes
• to generalise to other settings
• to synthesise comparisons
MODEL
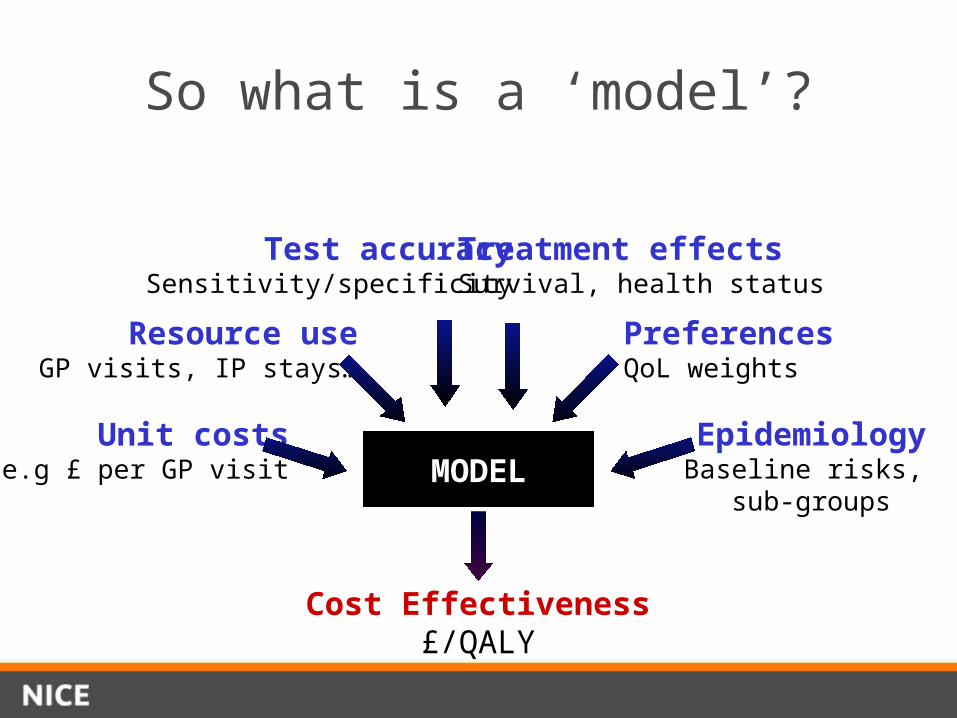
So what is a ‘model’?
Resource useGP visits, IP stays…
PreferencesQoL weights
Unit costse.g £ per GP visit
EpidemiologyBaseline risks,
sub-groups
Cost Effectiveness£/QALY
Treatment effectsSurvival, health status
Test accuracySensitivity/specificity
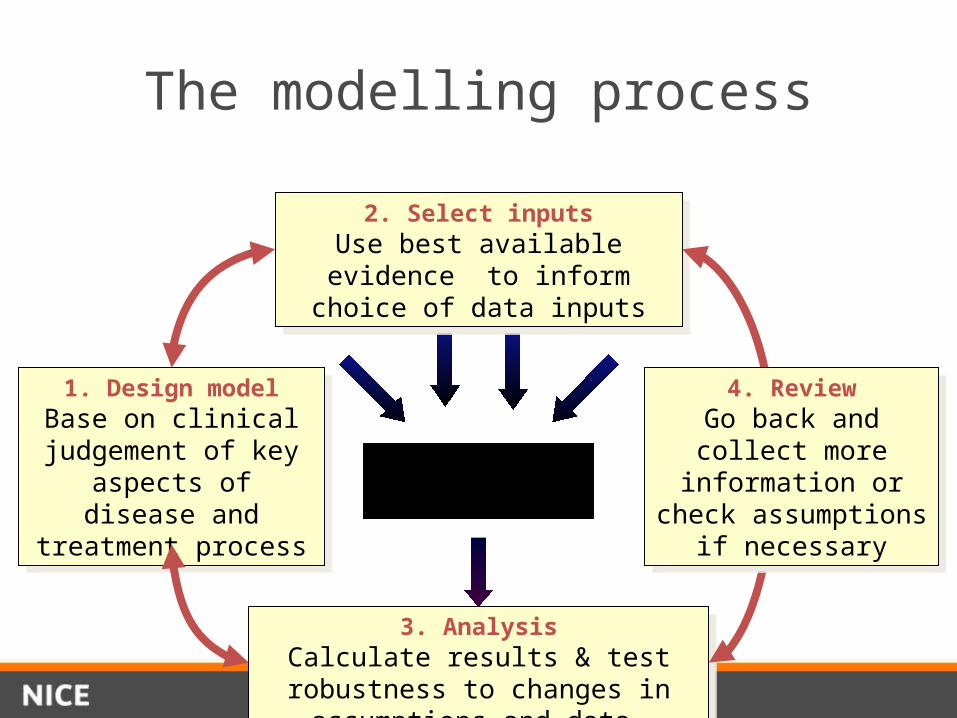
The modelling process
2. Select inputsUse best available evidence to
inform choice of data inputs
2. Select inputsUse best available evidence to
inform choice of data inputs
3. AnalysisCalculate results & test robustness to
changes in assumptions and data
3. AnalysisCalculate results & test robustness to
changes in assumptions and data
1. Design modelBase on clinical
judgement of key aspects of disease and
treatment process
1. Design modelBase on clinical
judgement of key aspects of disease and
treatment process
4. ReviewGo back and collect more information or
check assumptions if necessary
4. ReviewGo back and collect more information or
check assumptions if necessary
DECISION TREES
A simple way of estimatingexpected costs and effectsof alternative actions
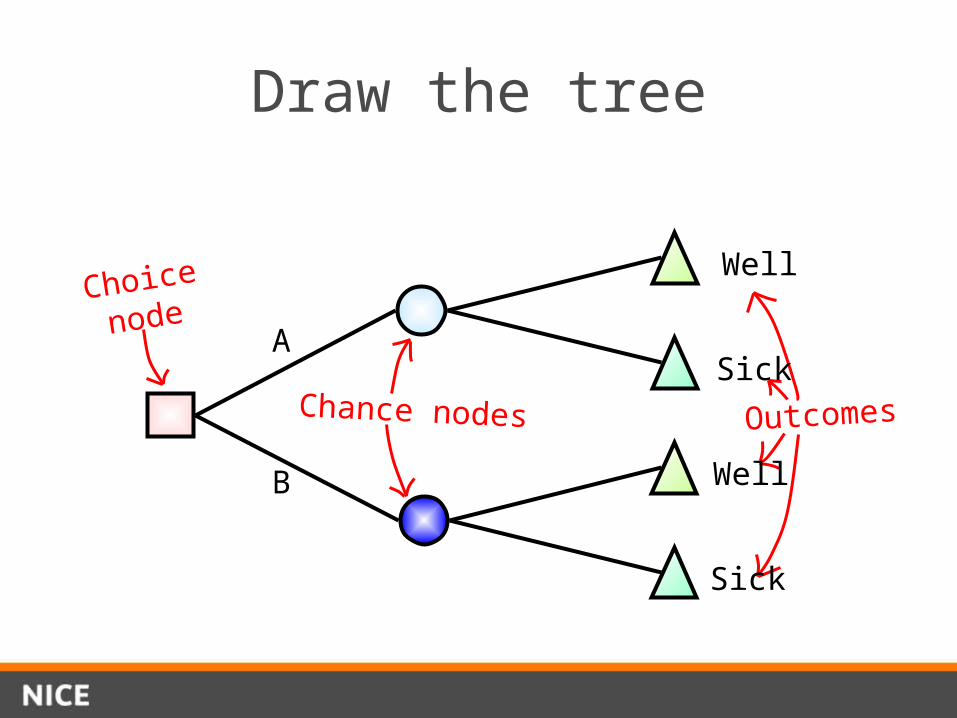
Draw the tree
Chance nodes
Choice
nodeA
B
Outcomes
Well
Sick
Well
Sick
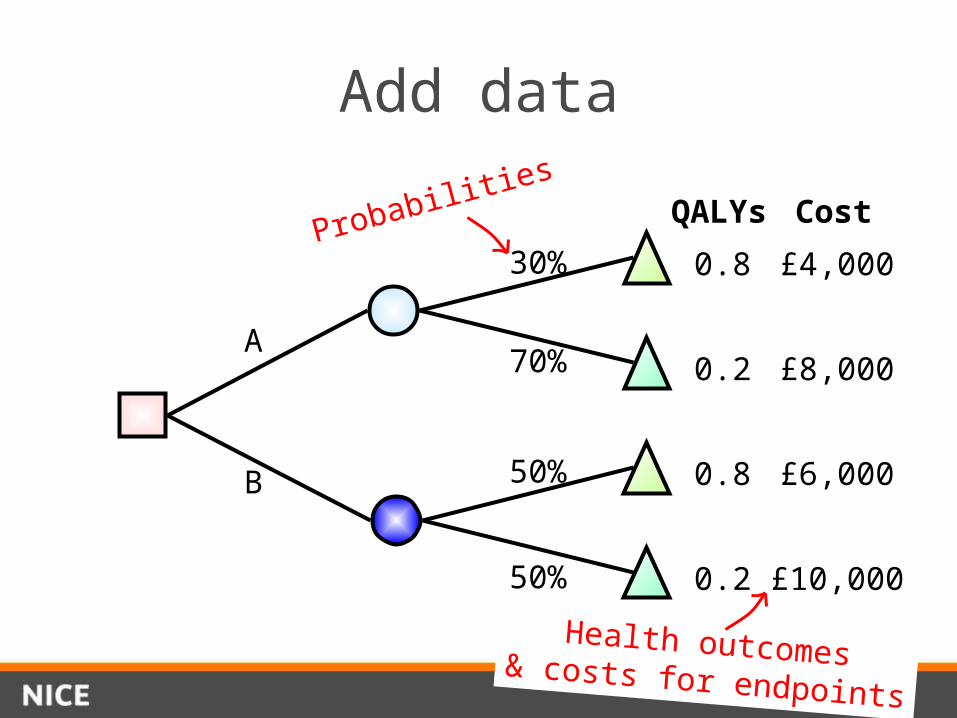
Add data
A
B
0.8
0.2
0.8
0.2
QALYs
£4,000
£8,000
£6,000
£10,000
Cost
Health outcomes& costs for endpoints
30%
70%
50%
50%
Probabilities
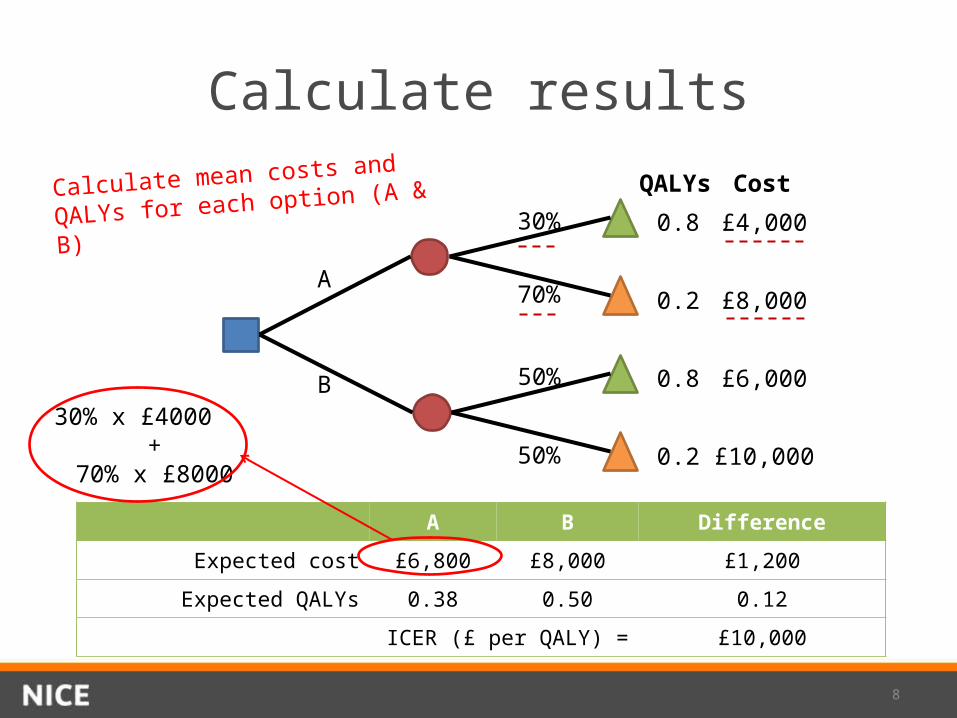
Calculate results
A B Difference
Expected cost £6,800 £8,000 £1,200
Expected QALYs 0.38 0.50 0.12
ICER (£ per QALY) = £10,000
30%
70%
50%
50%
A
B
0.8
0.2
0.8
0.2
QALYs
£4,000
£8,000
£6,000
£10,000
CostCalculate mean costs and
QALYs for each option (A & B)
30% x £4000 +
70% x £8000
8
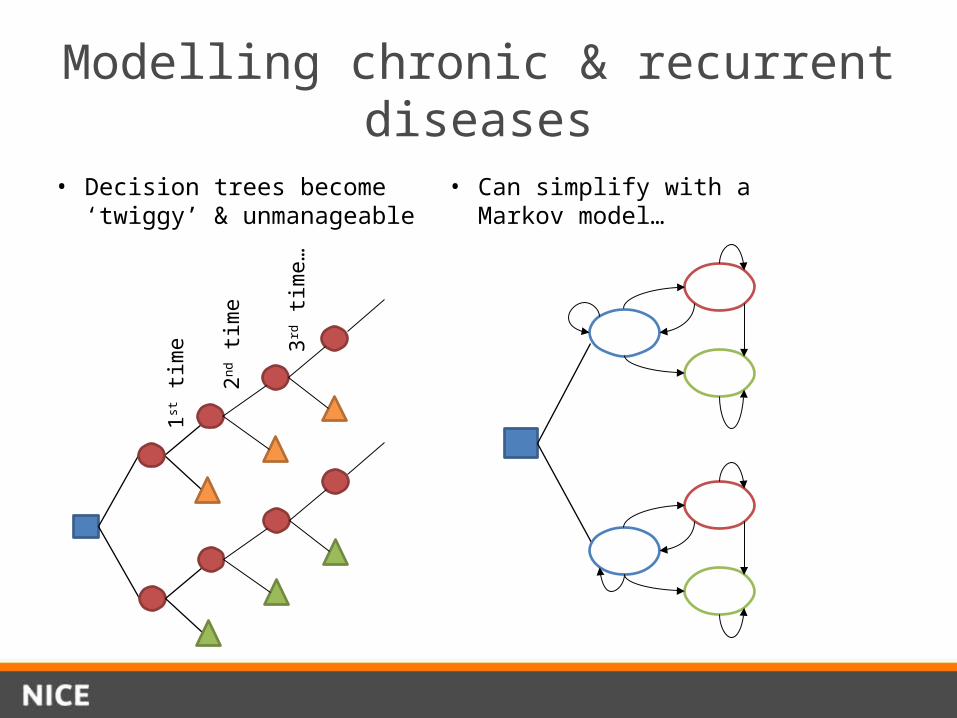
Modelling chronic & recurrent diseases
• Can simplify with a Markov model…
1st ti
me
2nd ti
me
3rd ti
me…
• Decision trees become ‘twiggy’ & unmanageable
MARKOV MODELS
A method for estimating long term costs and effectsfor recurrent or chronic conditions
State 1
State 3
State 2Well
Dead
Sick
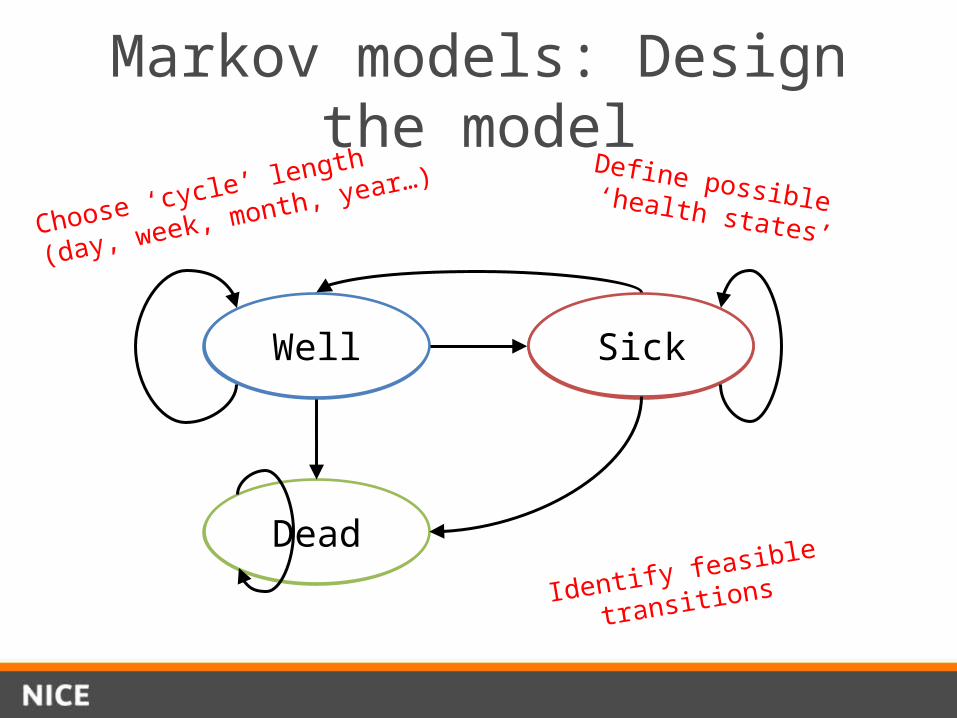
Markov models: Design the modelDefine possible ‘health states’
Identify feasible
transitions
Choose ‘cycle’ length
(day, week, month, year…)
Well
Dead
Sick
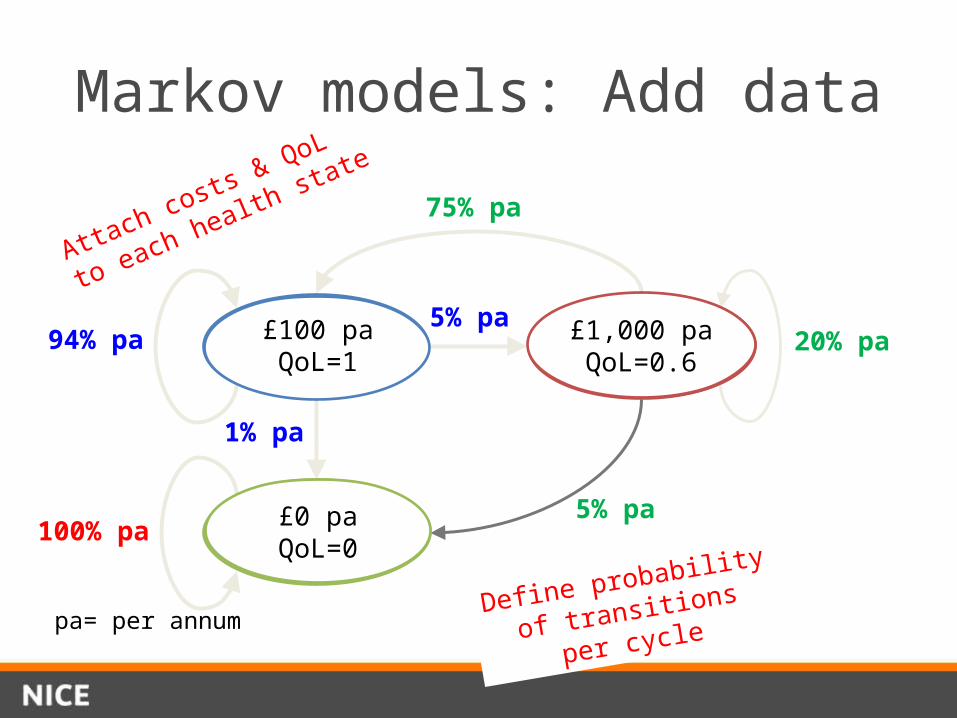
Markov models: Add data
5% pa94% pa
1% pa
100% pa
20% pa
75% pa
5% pa
Define probability
of transitions
per cycle
Attach costs & QoL
to each health state
£1,000 paQoL=0.6
£100 paQoL=1
£0 paQoL=0
pa= per annum
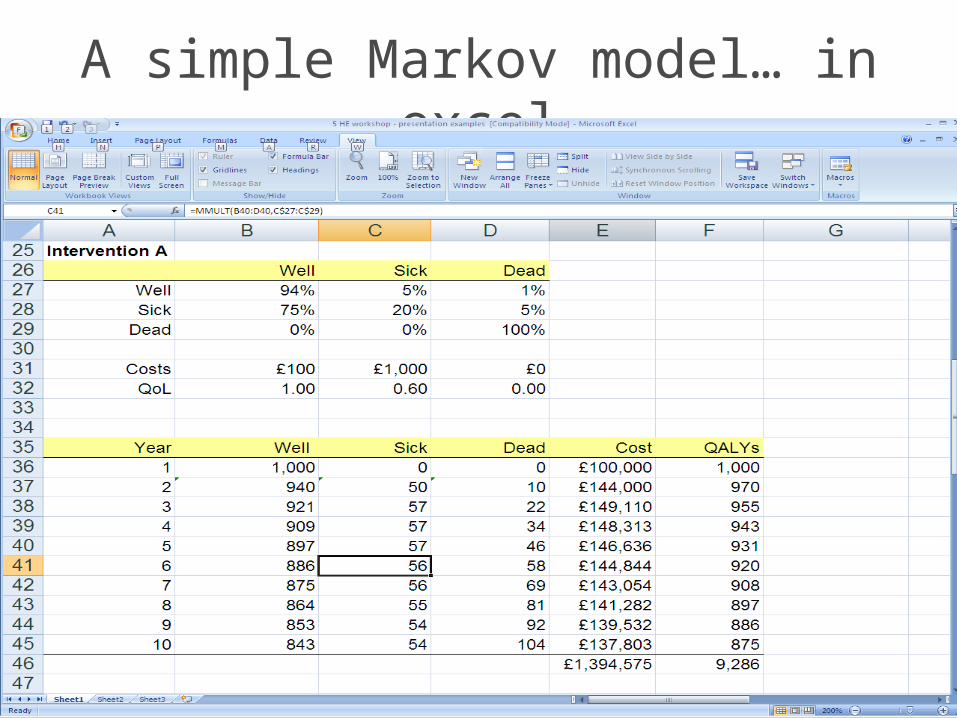
A simple Markov model… in excel
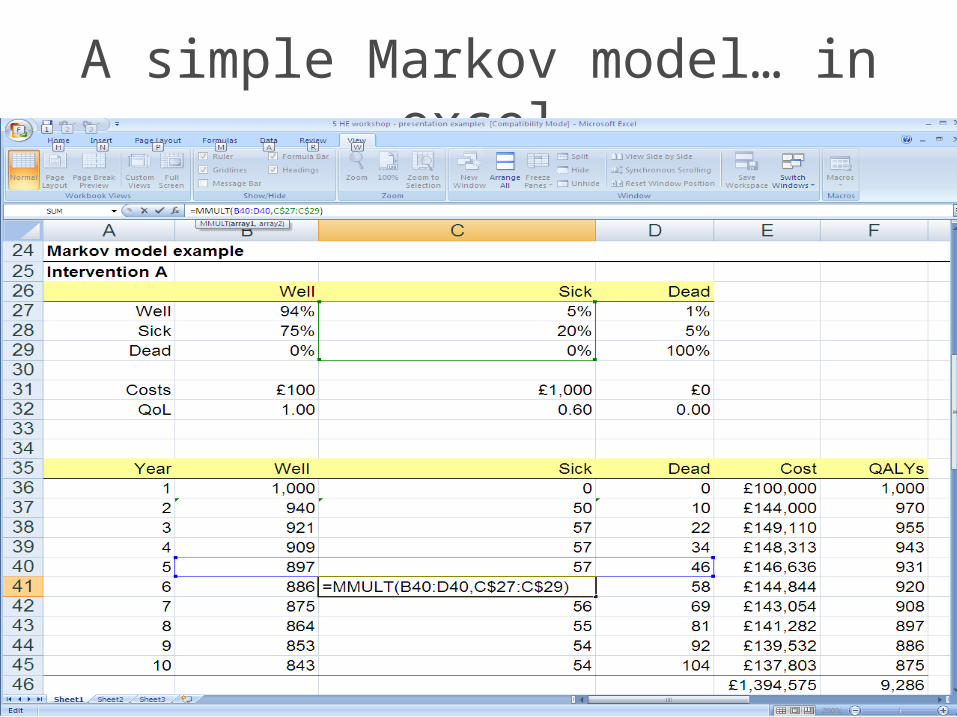
A simple Markov model… in excel
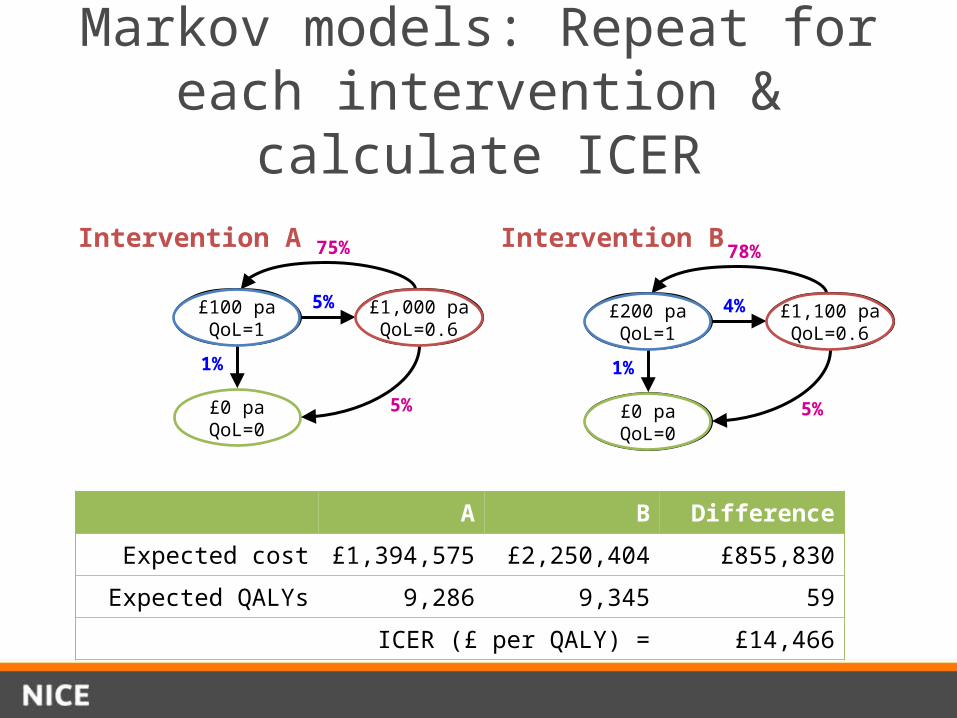
Markov models: Repeat for each intervention & calculate ICER
A B Difference
Expected cost £1,394,575 £2,250,404 £855,830
Expected QALYs 9,286 9,345 59
ICER (£ per QALY) = £14,466
5%
1%
75%
5%
£100 paQoL=1
£0 paQoL=0
£1,000 paQoL=0.6
Intervention A
4%
1%
78%
5%
£200 paQoL=1
£0 paQoL=0
£1,100 paQoL=0.6
Intervention B

Some issues…
• Don’t forget to discount…• Half-cycle correction in a discrete time Markov
model– Adjust so that transitions occur at mid-point in a cycle– May not matter where the focus is on the incremental
costs and outcomes
• Markov assumption– “Memoryless” – once transition is made, population in
a particular health state is considered homogeneous regardless of where they’ve come from (and when)…
Building time-dependency into a Markov model
• Different types– Probabilities can vary according to time in model,
e.g. increased risk of death simply because a cohort ages relatively straightforward to implement (can separate out disease specific mortality from other cause mortality)
– Probabilities that vary according to time in a particular state, i.e. the probability if moving to another state depends on the time spent in the current state less straightforward to implement
• Relax Markov assumption by making use of ‘tunnel’ states where patients remain for only one cycle
• Lots of tunnel states challenging to program
Using survival analysis
• May be able to obtain time dependent probabilities from the literature and other sources, e.g. routine life tables
• Time to event data may be available that can be used to derive time-dependent transition probabilities for models
• Appropriate way to analyse ‘time to event’ information is through survival analysis (well established)
• Survival analysis based on hazard rates need to carefully derive transition probabilities
Combining decision trees and Markov models
• Decision trees and Markov models need not be mutually exclusive (the latter is a form of recursive decision tree)
• There are examples where both approaches have been used in a single decision-analytic framework
• A decision tree may be used to characterise short term events, the results of which are used to determine the proportions of the patient cohort entering particular Markov health states– The Markov model is used to estimate quality
adjusted life expectancy
Good models should…
• Reflect the key clinical characteristics of the disease process and treatments under review
• Use best-available estimates of data inputs – obtained from systematic reviews and critically appraised
• Reflect uncertainty over data inputs and assumptions• Be as simple as possible, but no simpler• Be clearly described, so they can be replicated
Philips et al. Review of guidelines for good practice in decision-analytic modelling in health technology assessment.Health Technol Assess 2004;8(36).
http://www.ncchta.org/fullmono/mon836.pdf

Thankyou